Article

Development and Application of a Cost–Effective Analytical Method for Hydrofluorocarbons Using Preconcentrator–Gas Chromatograph–Mass Spectrometer

1
Center for Environmental Science in Saitama, 914 Kamitanadare, Kazo 347-0115, Saitama, Japan
2
Nishikawa Keisoku Co., Ltd., YBP West Tower 2F, 134 Kobe-cho, Hodogaya-ku, Yokohama 240-0005, Kanagawa, Japan
*
Author to whom correspondence should be addressed.
Atmosphere 2025, 16(1), 69; https://doi.org/10.3390/atmos16010069
Submission received: 22 December 2024 / Revised: 8 January 2025 / Accepted: 8 January 2025 / Published: 9 January 2025
(This article belongs to the Section Atmospheric Techniques, Instruments, and Modeling)

Abstract

:
The expansion of atmospheric observation networks for hydrofluorocarbons (HFCs), which are closely related to climate change and contribute to global warming, significantly impacts our society and daily life. Their emissions are estimated to increase in the future, which is a major challenge. Observations of HFCs globally were performed using expensive GHG–specific equipment installed at AGAGE and other sites, but many research institutions find it difficult to install such equipment. Therefore, we successfully developed a measurement method for six components of HFCs (HFC–23, HFC–32, HFC–125, HFC–134a, HFC–143a, and HFC–152a) with high atmospheric concentrations in various parts of the world by optimizing measurement parameters such as the sample transfer volume and rate, module cooling temperatures, the injection time, the GC oven temperature program, and the monitored ions of a commercially available preconcentrator–GC–MS. Because this developed measurement method is cost–effective and simpler to operate than those of GHG–specific equipment, it is expected to provide an opportunity for many research institutes to measure HFCs. Furthermore, in addition to HFCs, we confirmed that simultaneous measurements can be performed for 97 volatile organic compounds (VOCs), including hazardous components. This research can contribute to the observation of HFCs in countries and regions where the actual status of emissions is unclear or where no or few atmospheric observations were conducted. The results of those observations can be used to formulate more detailed global warming countermeasures.

1. Introduction

With the phase–out of chlorofluorocarbons (CFCs) and hydrochlorofluorocarbons (HCFCs), which are ozone–depleting substances (ODSs), hydrofluorocarbons (HFCs) have become popular industrial alternatives for applications such as refrigerants, foaming agents, and aerosol agents. Although HFCs are not an ODSs, they were subject to regulation at the 28th International Conference of the Parties to the Montreal Protocol (Kigali Amendment) because their global warming potential over 100 years (GWP100) is several hundred to ten thousand times higher than that of CO2 as a greenhouse gas (GHG). In developed countries, reductions began in 2019, using 2011–2013 as the base year, and are expected to be phased out by 85% by 2036. However, developing countries have a different reduction schedule, with some countries using 2020–2022 as the base year and phasing out 80% of their emissions by 2045 and others using 2024–2026 as the base year and phasing out 85% of their emissions by 2047.
The regulation of HFCs in Japan started in 2019; however, because many HFC products are already on the market, it is a challenge to understand the precise emissions and leakage into the environment during product use, as the Ministry of Economy, Trade, and Industry (METI) report states [1]. Additionally, products currently in use have reached the end of their useful life and are disposed of; however, according to data from the Ministry of the Environment (MOEJ), the recovery rate of fluorinated gases (F–gases) from waste products in Japan from 2002 to 2022 remained low, i.e., in the range of 29–44% [2], as shown in Figure S1. Concerns exist that emission and leakage of F–gases from many unrecovered products will accelerate global warming.
The estimation of HFC emissions can be classified into two types: bottom–up and top–down approaches [3]. The bottom–up approach is a calculation method based on activity data and implied emission factors (EFs), as proposed by the Intergovernmental Panel on Climate Change [4,5]. However, this estimation method is subject to uncertain factors such as differences in EF estimation, industry, sector, and reporting category by country, which can lead to large discrepancies in actual emissions [6,7,8]. Contrarily, the top–down method, which calculates emission estimates from atmospheric observation data of HFCs using an inverse estimation model, is regarded as an important tool for verifying emissions from the bottom–up approach [3,7,9].
The Advanced Global Atmospheric Gases Experiment (AGAGE, https://www-air.larc.nasa.gov/missions/agage/ (accessed on 22 December 2024)) network [10] continued long–term observations of global background concentrations of ODSs and GHGs, including HFCs, at 16 sites globally (mostly in the northern hemisphere); however, a denser HFC observation network is needed to estimate emissions by country/region using a top–down approach and to strengthen the monitoring of unnecessary emissions and leakage [7]. The problem is that there are few observations in urban areas where HFC products are used and disposed of and where the potential for emission and leakage is considered high. As described below, there are only two urban areas observed in Japan, i.e., Kawasaki City and Tokushima City. Additionally, no or insufficient observations were made for Asian, African, and South American regions [3,8,11,12], where future HFC emissions are estimated to increase [7,13,14].
Despite the strong emphasis on the importance and necessity of observing atmospheric HFCs, previous domestic and international studies on HFC measurements used expensive specialized equipment dedicated to GHG measurements (e.g., Medusa Gas Chromatograph–Mass Spectrometer (GC–MS), Medusa–like GC–MS, and ODS5–pro (Huanaco Innovation, China)) [15,16,17]. In Japan, the National Institute for Environmental Studies (NIES) measured HFCs on Hateruma Island, Okinawa Prefecture, and Cape Ochiishi, Hokkaido, which are included in the AGAGE site; the MOEJ measured HFCs in Kawasaki City, Kanagawa Prefecture, and around Nemuro and Wakkanai in Hokkaido; and the Japan Meteorological Agency (JMA) measured HFCs on Minamitori Island. These institutions use Medusa–like GC–MS. However, it is demanding in terms of budget to purchase expensive, non–general–purpose, special equipment, and many research institutions may not be able to install such equipment. Furthermore, the operation and maintenance of such special equipment require a high level of skill.
Each Japanese local government established its own environmental research institute to promote research and studies to address the various environmental issues arising in their communities. No local government environmental research institute installed special equipment to observe HFCs, as described above. However, only the local government environmental research institute of Tokushima Prefecture measures HFCs at four local sites (Naruto City, Kitajima Town, Tokushima City, and Anan City) by attaching a porous polymer adsorbent–type porous–layer open tubular (PLOT) column PoraBOND Q (Agilent Technologies, Inc., USA, 0.32 mmI.D. × 25 m × 5.00 μm) to a commercially available preconcentrator (GL Science CC2110, Japan)–GC–MS (Agilent 9890B/JEOL JMS-Q1500GC, Japan) which is commonly used to measure volatile organic compounds (VOCs) [18].
Japan’s Air Pollution Control Law requires local governments to monitor benzene and other harmful VOCs at least once per month. The MOEJ published a standard measurement method for hazardous VOCs using a preconcentrator–GC–MS [19]. While simultaneous measurement of some F–gases is possible using this official method, it is difficult to separate and measure HFCs, which have relatively very low boiling points. The standard measurement method for hazardous VOCs requires the use of chemically bonded methyl silicon liquid columns or EPA Method 624–compatible columns. When measuring HFCs using a PLOT column, simultaneous measurements cannot be performed because the column configurations for hazardous VOC measurements are different. Therefore, each time the column is exchanged, time is required to vent the GC–MS to atmospheric pressure, restart, and stabilize the instrument, which also requires operator labor.
Here, we aimed to develop a cost–effective and simple measurement method for HFCs using a commercially available preconcentrator–GC–MS system equipped with a chemically coupled methyl silicon liquid–phase column. Furthermore, the developed measurement method was applied to atmospheric observations in order to contribute to the establishment of an observation network for atmospheric HFCs and a monitoring system for unwanted emissions and leakages, especially in urban areas with many HFC products.

2. Materials and Methods

2.1. Optimization of Preconcentrator–GC–MS Parameters

In this study, Entech 7200A (Entech Instruments Inc., USA) was used as the preconcentrator, 5977C (Agilent Technologies, Inc., USA) was used as the GC–MS, and the GC column DB–1 (Agilent Technologies, Inc., USA, 0.32 mmI.D. × 60 m × 1.00 μm) was used as a chemically bonded methyl silicon liquid phase that can be applied in the MOEJ standard method for measuring hazardous VOCs. As shown in Figure 1, the preconcentrator accommodates three built–in cooling modules and an inert silonite coating on the flow paths in the equipment to prevent the adsorption of VOCs. The preconcentrator used the following procedure to cryogenically concentrate the VOCs in canisters or direct air samples and introduce them into the GC:
  • Step 1: Air samples were drawn into module 1 (M1, empty trap) and module 2 (M2, Tenax TA trap), which were cooled by liquid nitrogen; the moisture was coagulated and dehydrated in M1. For VOCs, some heavy VOCs were maintained in M1, and light VOCs were adsorbed in M2. Therefore, a small amount of sweep gas (N2, purity of 99.9999% or higher) was blown from M1 to M2 to transfer the heavy VOCs to M2. Other inorganic gases interfering with the measurements, such as N2, O2, CO2, and Ar, passed through M1 and M2 and were sent to the reservoir tank for removal.
  • Step 2: The VOCs were thermally desorbed by heating M2 and were transferred to module 3 (M3, cryofocus module), which was cooled with liquid nitrogen to reduce the bandwidth of the VOCs.
  • Step 3: VOCs were introduced into the GC column with a carrier gas (He, purity of 99.9999% or higher) at a very rapid temperature rise by spraying M3 with hot injector gas.
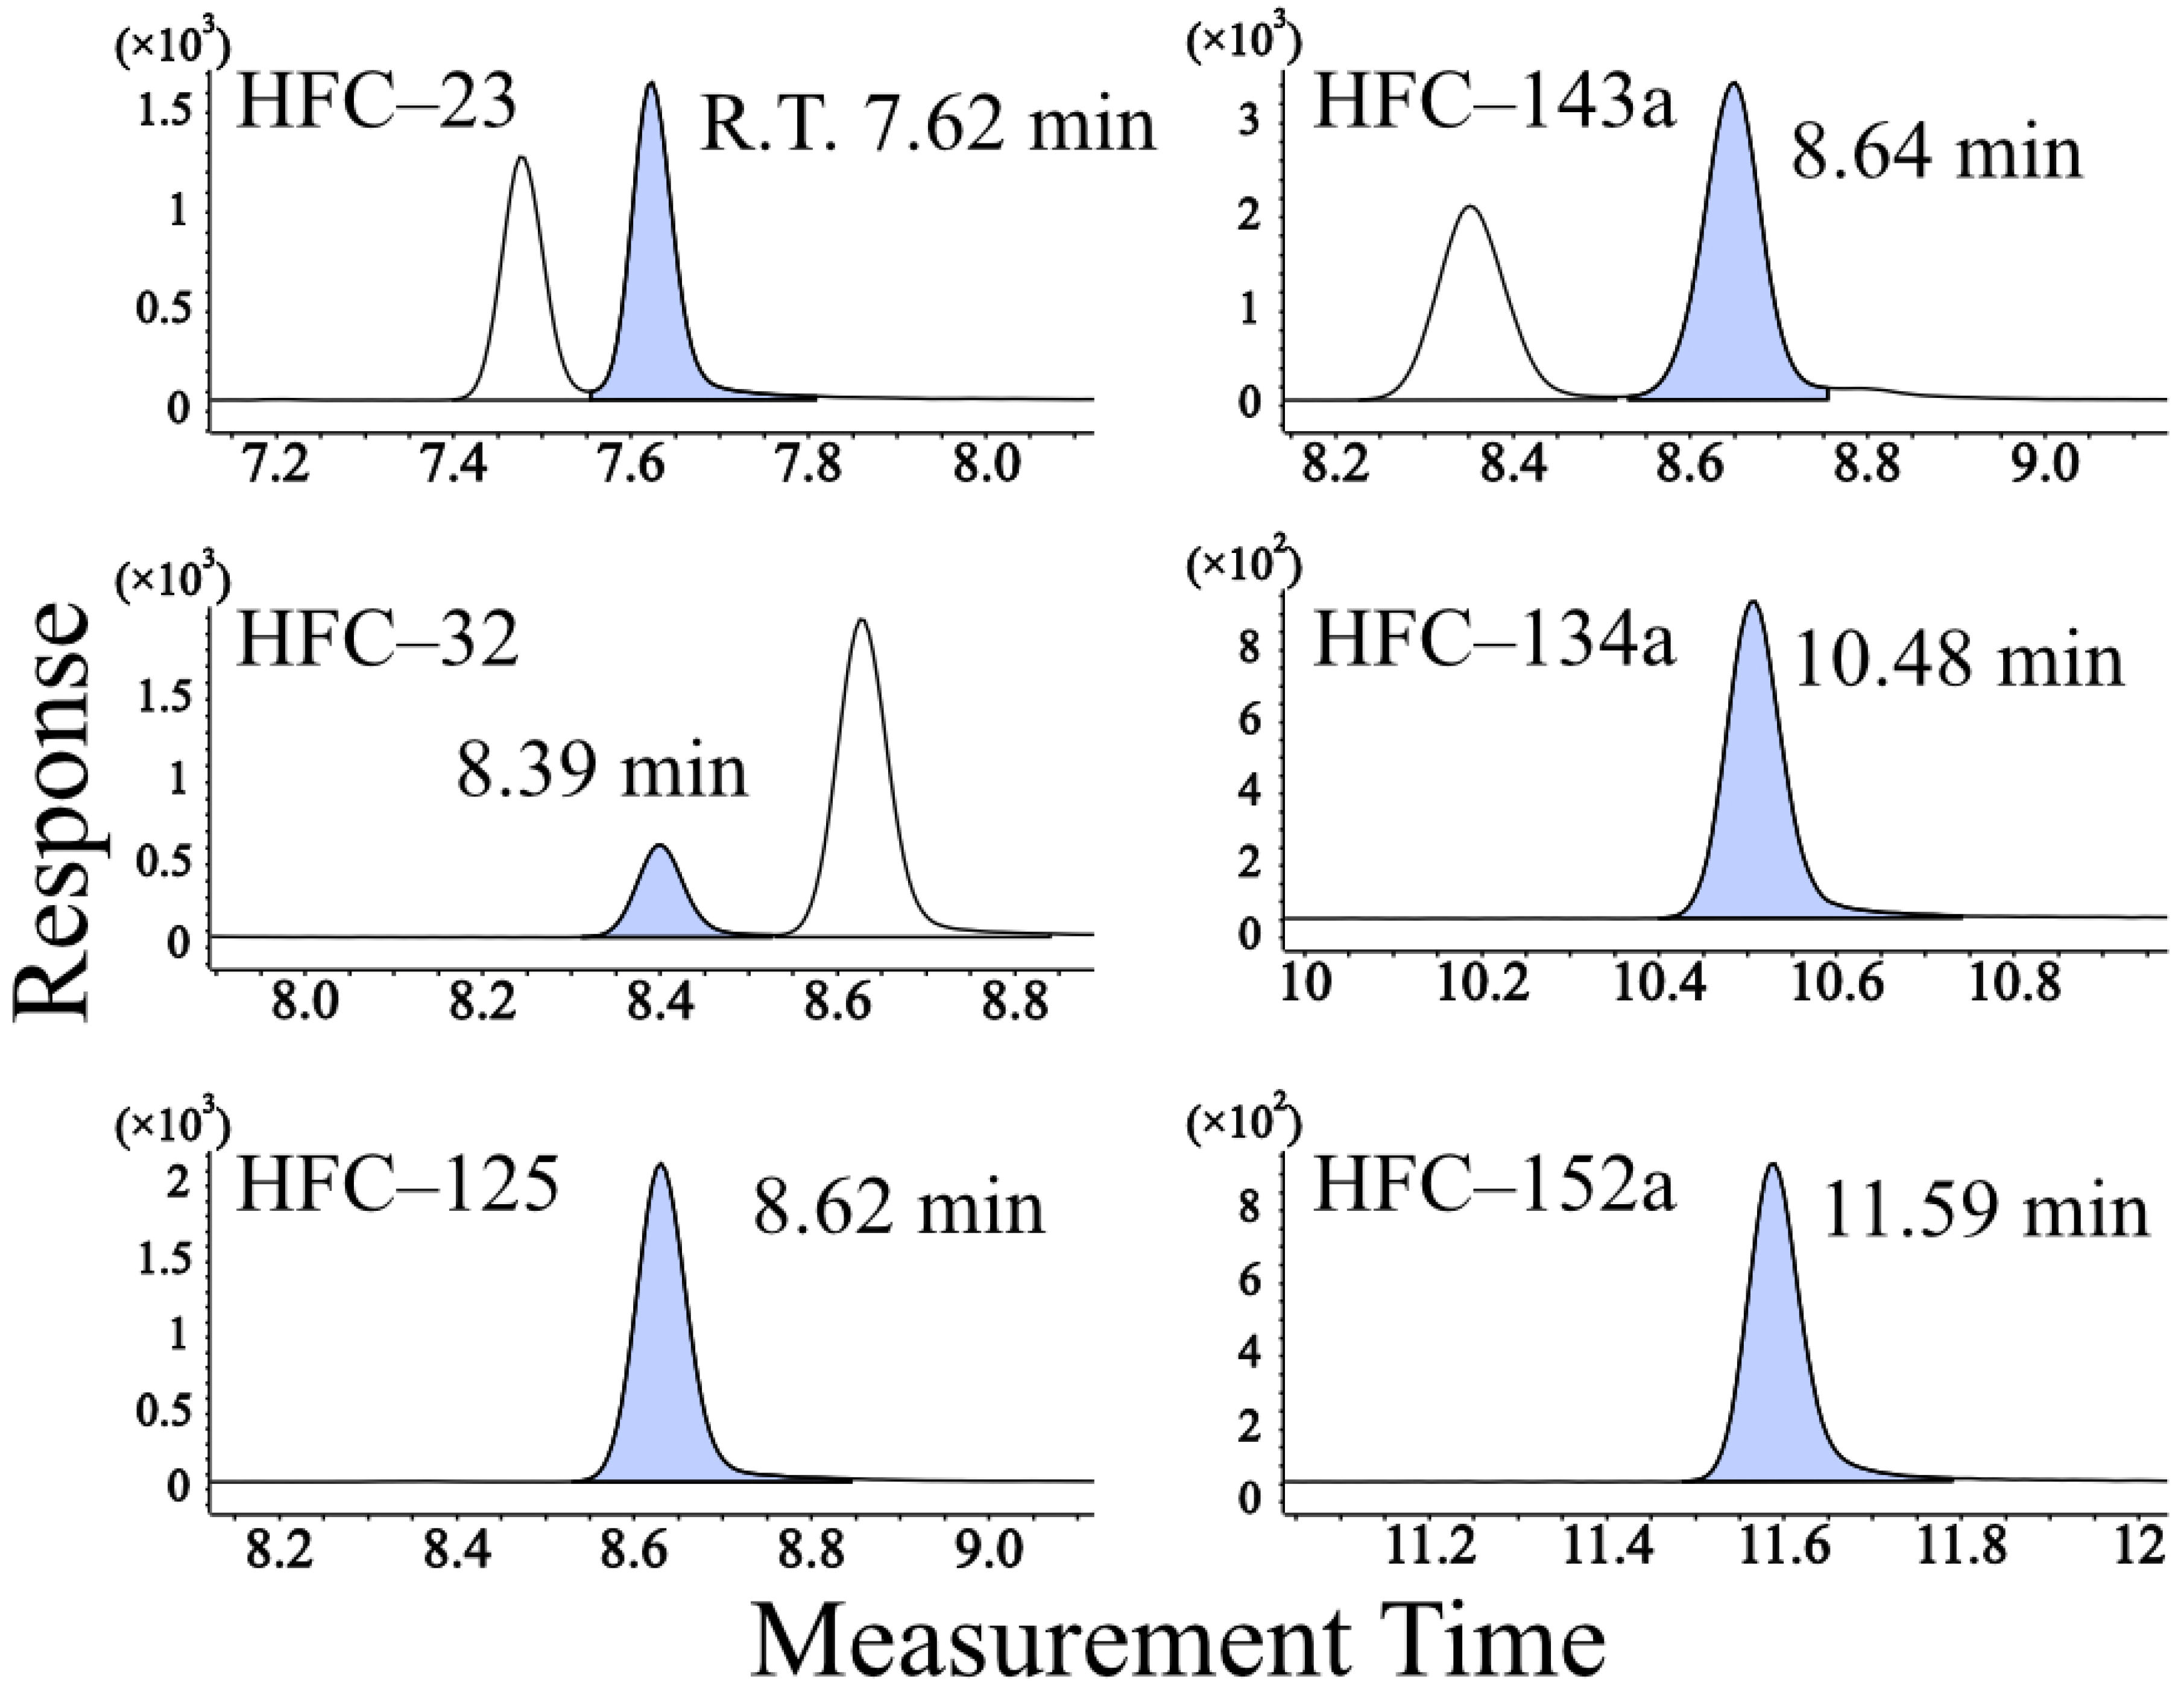
As shown in Figure 1, the sample transfer rate from the canister to M1, the cooling temperatures of M1, M2, and M3, the sample transfer volume and rate from M1 to M2, the injection time from M3 to GC–MS, the GC oven temperature program using oven cryo–technology to blow liquid nitrogen into the GC oven, and the monitored ions (m/z) of each component parameter were investigated and optimized for the measurement of HFCs.
The limit of lower detection (3σ) was calculated from the standard deviation (σ) obtained from repeated measurements of the standard gas (n = 5–7).

2.2. Target HFCs

The United Nations Framework Convention on Climate Change (UNFCCC) [20] and the Emissions Database for Global Atmospheric Research (EDGAR) v8.0 [21] published HFC emissions inventory data for Japan and other countries globally. Figure S2 illustrates the change over time in the amount of emissions (t) and CO2-equivalent (kt) in Japan based on UNFCCC inventory data. Here, six components, namely, HFC–23, HFC–32, HFC–125, HFC–134a, HFC–143a, and HFC–152a, which have relatively high emission volumes and can be purchased from a local standard gas supplier (Sumitomo Seika Co., Ltd., Japan), were selected for measurement. Table 1 shows the chemical formula, molecular weight, boiling point, atmospheric lifetime, and GWP100 of the target HFCs [22]. All components have low boiling points, partly because they are used as refrigerants in air–conditioning and refrigeration equipment. Furthermore, because of their long lifetimes and high GWP100, they have a long–term impact on global warming when emitted into the atmosphere. Among the target components, HFC–32, HFC–125, HFC–134a, and HFC–143a are the most abundant in the atmosphere globally [3,8,11], and their concentrations were reported to increase over the 2016–2020 period [23].

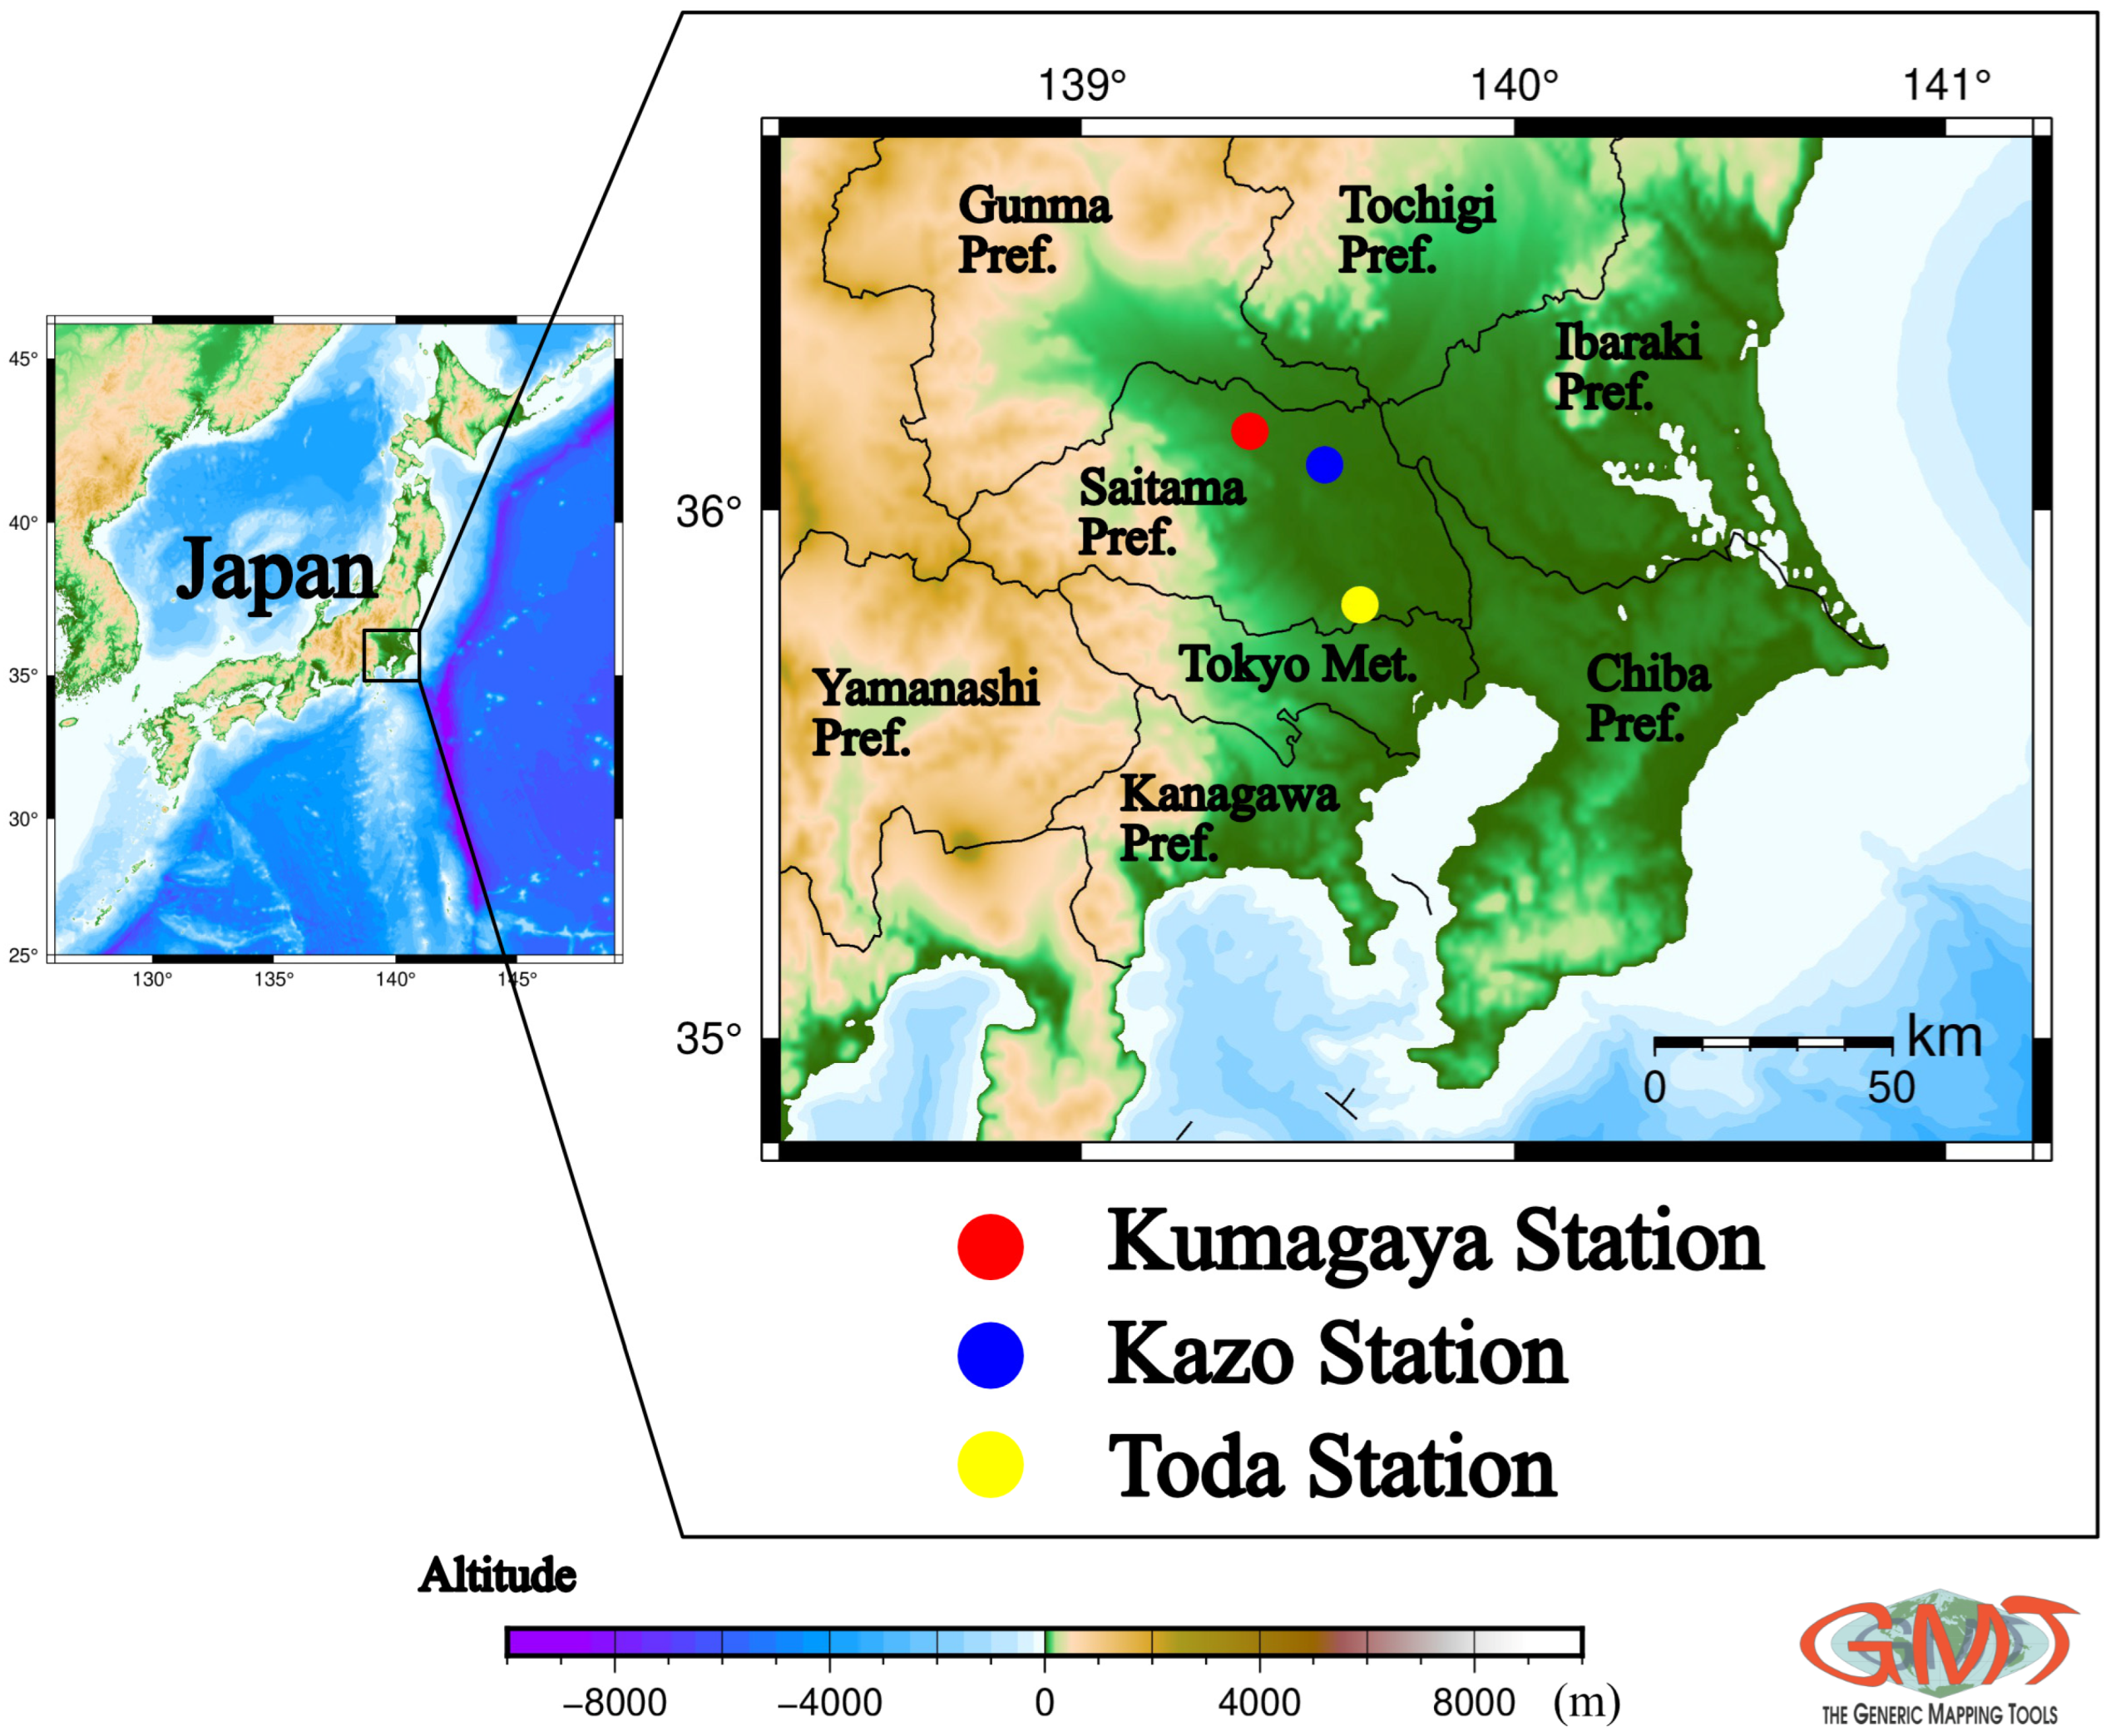
2.3. Observation Sites and Sampling Methods

Because air samples contain a large number of components (moisture, N2, CO2, etc.) that can interfere with measurements, we verified whether the developed method could measure HFCs with low boiling points and fast elution without being significantly affected by these interfering components. Atmospheric samples were collected from January to December 2024 in the northern (Kumagaya Station), central (Kazo Station), and southern (Toda Station) areas of Saitama Prefecture in the Kanto region, as shown in Figure 2.
The Kumagaya station (36°08′51.8″ N 139°23′15.8″ E) is located on the premises of the city office of Kumagaya City, which has a population of ca. 191,000. The trunk road National Route No. 17 (estimated 24 h traffic volume: 10,916 vehicles, percentage of heavy-duty vehicles: 8.9%) is located approximately 425 m southwest, and another trunk road, National Route No. 407 (14,801 vehicles, 14.1%), intersects with National Route No. 17 approximately 690 m west–southwest. The observation site was positioned as an ambient air pollution monitoring station (AAPMS).
The Kazo station (36°05′04.5″ N 139°33′38.1″ E) is located at the Center for Environmental Science in Saitama and has many residential areas and rice paddy fields in its vicinity. The population of Kazo City is approximately 112,000, and approximately 350 m northwest of the station is Saitama Prefectural Road No. 38 (5871 vehicles, 23.4%), whereas approximately 420 m northeast is Saitama Prefectural Road No. 313 (1709 vehicles, 16.2%). This observation site is one of the AAPMS.
The Toda station (35°49′16.0″ N 139°38′34.1″ E) is located on the premises of the Toda City Community Center and Toda City Library complex. Toda City has a population of approximately 142,000 and is adjacent to the Itabashi and Kita Wards in the Tokyo Metropolitan area. National Route No. 17 (35,337 vehicles, 28.3%) and Highway No. 5 Ikebukuro Line (24,628 vehicles, 12.2%) that runs above it are approximately 25 m northeast. National Route No. 298 (13,110 vehicles, 26.4%) and the Gaikan Expressway (41,523 vehicles, 32.2%) that runs above it are located approximately 190 m to the northwest. These are known as arterial roads with high traffic volumes in Saitama Prefecture. The observation site was positioned as a roadside air pollution monitoring station (RAPMS).
The mass flow controller was attached to a heat–cleaned and vacuumed silonite 6 L canister (Entech Instruments Inc., USA), and the collection flow rate was adjusted to approximately 3 mL/min such that the pressure in the canister was approximately 80 kPa after 24 h of collection. After collection, the canisters were pressurized and diluted with VOC–free ultrapure synthetic air (Air Zero–N, Sumitomo Seika Co., Ltd., Japan) to approximately 160–200 kPa in the laboratory and used as the measurement sample. The analysis was performed within two to three weeks of sampling.
A travel blank was used to confirm the effects of contamination during the sample transport and storage. The analysis was conducted using the same method as that used for the actual sample, and the travel blank value was subtracted from the analysis value of the actual sample.

3. Results and Discussion

3.1. Optimization of Preconcentrator–GC–MS Parameters

The sample flow rate from the canister to the preconcentrator was examined in the range of 20–50 mL/min, and the parameter of slow transfer at 20 mL/min, which showed relatively stable and high peak areas for the HFC components, was adopted. M1 temperatures of −40 °C and −50 °C were examined, and since no big difference was found in the peak areas and shapes of the HFC components, −40 °C was selected because it requires less liquid nitrogen. For the M2 temperature, while some HFC components had relatively low peak areas at temperatures below −50 °C, no big difference was observed between −60 °C and −70 °C. Therefore, we decided to use −60 °C, which requires less liquid nitrogen. For the M3 temperature, the peak area was relatively low for the HFC components at −160 °C, although no difference in the −170 to −190 °C range was observed. Therefore, −170 °C was adopted for the M3 temperature. To minimize the effects of peak separation due to inorganic interfering gases (especially moisture and CO2) and sensitivity reduction due to ion suppression of the target compounds as much as possible, the M1 to M2 sample transfer volume was set to 10 mL and the M3 to GC–MS sample injection time to 0.1 min. When the sample transfer volume from M1 to M2 was set to 0 mL, the HFC components could be measured, although it was confirmed that heavy VOCs with carbon numbers greater than seven were not detected because the entire amount of heavy VOCs was not transferred from M1 to M2. Therefore, when HFCs and other VOCs are to be measured simultaneously in one sequence, the sample transfer volume from M1 to M2 should be 10 mL. The measurement results are described in Section 3.3.
The GC oven was verified by lowering the initial temperature step by step from room temperature, and by setting the oven at −50 °C, the peak separation of HFC–32 and HFC–125, whose monitor ions (m/z: 51) overlapped, was successfully achieved. The fragment patterns obtained from the standard gas scan measurements were checked against the NIST library, and the retention times for each HFC component and monitor ions (qualitative and quantitative ions) were selected and analyzed in the SIM mode.
The instrument parameters optimized for the measurement of HFCs are listed in Table 2, and the chromatograms obtained when measuring the standard gases under these conditions are shown in Figure 3. The five-point absolute calibration curves and limits of detection (LOD) for each HFC are shown in Figure 4. Good linearity with a coefficient of determination (R2) of 0.99 or higher was obtained, and the LOD were low enough for atmospheric observations. A point to be noted in the use of this measurement method is that when the liquid nitrogen supplied from the storage container to the preconcentrator–GC–MS is empty, it must be filled manually.

3.2. Atmospheric Observation of HFCs

For comparison, Table 3 shows the HFCs observed in this study and those observed by other organizations (MOEJ, JMA, Tokushima Prefecture, and AGAGE). The sources of observation data from each organization are the MOEJ: annual report [24], JMA: World Data Centre for Greenhouse Gases (WDCGG, https://gaw.kishou.go.jp/search/summary (accessed on 22 December 2024)), Tokushima Prefecture: annual report [18], and AGAGE: the AGAGE website where the data are available (https://www-air.larc.nasa.gov/missions/agage/ (accessed on 22 December 2024)). The NIES data for Hateruma Island and Cape Ochiishi can also be downloaded from the WDCGG, although they are only available from May 2004 to February 2013, which is more than a decade before this study. Therefore, they are not included in Table 3.
The periodic arithmetic average (median) values at the three sites in Saitama Prefecture from January to December 2024 were 164 (143) ppt for HFC–32, 83 (77) ppt for HFC–125, 194 (190) ppt for HFC–134a, 46 (44) ppt for HFC–143a, and 17 (13) ppt for HFC–152a, and the measurements were successfully performed using the developed method. However, HFC–23, which had the lowest boiling point and shortest retention time among the measured HFCs, was most likely affected by interfering gases, and the peak shape became broad for the air samples, making accurate measurement difficult. Unlike other HFCs, HFC–23 emissions are being phased out because it is a compound produced as a byproduct of the synthesis and processing of HCFC–22, which has already been discontinued for domestic production and import [3,13]. Based on the fact that the annual emissions of HFC–23 from 2010 to 2021 are low, ranging from 1.5 to 10 (t/y) [20], and that the atmospheric concentration of HFC–23 observed by the MOEJ in Kawasaki City over a long period of time also shows a decreasing trend (median value from March 2022 to February 2023 is 32.2 ppt) [24], we excluded HFC–23 from the target compound.
The concentrations of HFCs in Saitama Prefecture were higher than those at background sites (Hokkaido, Minamitori Island, and global background) and were almost at the same levels as those observed in urban areas (Kawasaki City and Tokushima City). However, relatively large differences in the concentrations of HFC–32 and HFC–134a were observed, even among the observation sites that may be affected by anthropogenic sources, which may reflect the usage and stock levels in the surrounding area. Particularly, Toda City showed the highest concentration of HFCs among the three sites in Saitama Prefecture because it is an RAPMS near the Tokyo Metropolitan area with heavy vehicle traffic and is easily affected by anthropogenic sources. The observation results for Tokushima City [18] showed a tendency for HFCs to be higher in RAPMS than in AAPMS, which is similar to that of our study.
Among the five components, HFC–134a (GWP100: 1526) had the highest concentration. HFC–134a has been used since the mid–1990s as a substitute for CFC–12 in household and commercial refrigerators, car air conditioners, and blowing agents and was reported to be the highest HFC detected at global background sites [10].
The component with the second highest concentration was HFC–32 (GWP100: 770). It is often used as a substitute for HCFC–22, mainly as a stand–alone refrigerant in residential and commercial air conditioners and refrigerators, or as a mixed refrigerant R–410A (HFC–32: HFC–125 = 50%: 50%). The HFC–32 emissions of Japan were reported to be the second highest among East Asian countries [8].
The third highest concentration was that of HFC–125 (GWP100: 3744), which was primarily used as the mixed refrigerant R–410A. However, it is also available on the market as other mixed refrigerants, such as R–404A, R–407C, and R–422A [25]. The changes in HFC–125 emissions over time in various countries were similar to those of HFC–32, suggesting that HFC–32 and HFC–125 emissions were mainly attributable to the use of R–410A [8].
The next highest concentration was HFC–143a (GWP100: 5807), which was used as R–404A (HFC–125: HFC–143a: HFC–134a = 44%: 52%: 4%), an alternative refrigerant to R–502 (HCFC-22: CFC-115 = 48.8%: 51.2%), regulated as the ODS [25]. R–404A is primarily used in commercial refrigeration units and in low– and medium–temperature refrigeration units for display cases [8].
HFC–152a (GWP100: 164), which had the lowest GWP100 value among the target HFCs, had the lowest concentration. It is mainly used in car air conditioners and medical propellants [25].
Although relative differences in atmospheric concentrations by component were detected, as described above, it is important to consider their impact on global warming. For example, the period–averaged concentrations of HFC–134a and HFC–143a at the three sites in Saitama Prefecture are 194 ppt and 46 ppt, respectively, which are significantly different from each other; however, their respective GWP100 values are 1526 and 5807, respectively, which are roughly equivalent in terms of their impact on global warming. In Japan, the METI and the New Energy and Industrial Technology Development Organization (NEDO) play central roles in developing projects related to green refrigerants with low GWP100 (NH3, CO2, HFO, etc.) as next–generation refrigerants and equipment for practical use. However, because of technical hurdles in achieving the same or better equipment performance as that achieved by conventional HFC refrigerants, as well as safety issues (flammability, chemical instability, etc.), the practical application of next–generation refrigerants in refrigeration and air conditioning equipment is not yet achieved [26]. It may take time to achieve full–scale conversion to green refrigerants. In this process, global warming can be curbed as much as possible by refraining from using HFCs with a high GWP100 and switching to HFCs with a relatively low GWP100.
The other problem we feel is the enormous increase in the amount of the “unspecified mix of HFCs” shown in Figure S2b, which shows the HFC emission CO2–eq (kt) line chart. This is not a problem limited to Japan; as long as it is unspecified, it is difficult to promote and reduce emission control measures in that category. We believe that a higher density and frequency of atmospheric observations, especially at sites in urban areas where they have not been conducted before, will contribute significantly to the identification of “unspecified” quantities.
Generally, HFCs have low reactivity and many of their components have atmospheric lifetimes ranging from a few years to several decades. Once these components are emitted into the atmosphere, they are distributed uniformly on a global scale; therefore, the observed data for Hokkaido and Minamitori Island, which are less affected by anthropogenic sources (Table 3), can be taken as background concentrations in the mid–latitudes of the Northern Hemisphere. For areas with anthropogenic influences, it is possible to evaluate the emission and leakage status of HFCs by comparing them with those of the background concentrations, which suggests the importance of continuous and systematic atmospheric observations.
The method developed in this study uses a configuration for routine VOC measurement and enables the cost–effective and simple measurement of HFCs compared to GHG–specific equipment. This method is useful for research institutes that are unable to observe HFCs, and we hope that it will be used not only in Japan but also in other countries globally.

3.3. Simultaneous Measurement of HFCs and VOCs by the Developed Method

By changing the GC oven conditions of the developed method from “−50 °C (10 min) → 20 °C/min → 50 °C → 5 °C/min → 140 °C → 20 °C/min → 220 °C”, 97 VOCs from 3 to 11 carbons (26 alkanes, 10 alkenes, 17 aromatics, 28 halides, three terpenes, four CFCs, six HCFCs, acrylonitrile, and two internal standards) in addition to the target HFCs could be measured simultaneously in one sequence. The VOC species successfully measured in the simultaneous analyses are listed in Table 4. When a mixed standard gas with a concentration range of 10–500 ppt (some components with high atmospheric concentrations, such as Toluene, Ethylbenzene, Xylene and Dichloromethane were set higher on the high concentration side) were measured under this analytical condition, the calibration curve showed good linearity, allowing quantitative measurement of the atmospheric sample. These include VOCs of hazardous air pollutants (HAPs) that cause or are suspected to cause significant health or adverse environmental effects, such as cancer or reproductive effects, and VOCs monitored at U.S. photochemical assessment monitoring stations (PAMs). Furthermore, these include hazardous VOCs that the MOEJ mandates local governments to monitor constantly.

4. Conclusions

Here, we developed a method for the simultaneous measurement of HFCs and VOCs, which are harmful to human health and require periodic monitoring, by optimizing the measurement parameters of a preconcentrator–GC−MS, which is a cost−effective and simple−to−use commercial device, compared to those of the expensive GHG−specific measurement devices installed at AGAGE sites. It was confirmed that this method can be used to successfully measure HFCs even for ambient air samples containing a large number of interfering gas components. We continued observations at three sites in Saitama Prefecture (Kumagaya, Kazo, and Toda) from January to December 2024, and the average concentration (median) was generally consistent with data from Kawasaki City, Kanagawa Prefecture, and Tokushima City, Tokushima Prefecture, which are the only examples of observations in urban areas in Japan. The measurement method developed in this study enables local governments in Japan, which are required to measure harmful VOCs as part of ambient air quality monitoring under the Air Pollution Control Law, to measure HFCs without changing the configuration of the standard measurement method published by the MOEJ. A key feature of this measurement method is that it is a general−purpose product, which implies that it is budget−friendly, inexpensive, and easy to operate.
Since it is clear that the composition, emissions, and atmospheric concentrations of HFCs vary greatly depending on industrial structures and policies, it is extremely important to understand the actual situation. This measurement method can also contribute to HFC observations in countries and regions not required to report emissions to the UNFCCC or that have never observed atmospheric concentrations. In particular, there are few observations in urban areas where HFC products are used or disposed of. The expansion of the HFC observation network is expected to improve the accuracy of HFC emission estimation and enhance the monitoring of unnecessary leakage, which will contribute to more detailed global warming countermeasure planning. The regulation and phasing out of HFC emissions are important initiatives for compliance with the Kigali Amendment and climate change action.

Supplementary Materials

The following supporting information can be downloaded from https://www.mdpi.com/article/10.3390/atmos16010069/s1. Figure S1: Amount of refrigerant residual and recovery amounts at disposal, and the recovery rate at disposal for F−gas−filled products in Japan over the period 2002–2022. Figure S2: HFC emissions of Japan by component as reported to the UNFCCC from 1990 to 2021. (a) amount of emissions (t), (b) amount of emissions in CO2−equivalent (kt).

Author Contributions

Conceptualization, Y.I. and K.S.; methodology, Y.I. and Y.O.; formal analysis, Y.I.; investigation, Y.I.; resources, Y.I.; data curation, Y.I.; writing—original draft preparation, Y.I.; writing—review and editing, Y.I. and K.S. All authors have read and agreed to the published version of the manuscript.

Funding

This study received no external funding.

Institutional Review Board Statement

Not applicable.

Informed Consent Statement

Not applicable.

Data Availability Statement

The data are contained within this article.

Conflicts of Interest

Yukikio Ono is an employee of Nishikawa Keisoku Company Limited. The paper reflects the views of the scientist and not the company.

Abbreviations

The following abbreviations are used in this manuscript:
HFCshydrofluorocarbons
CFCschlorofluorocarbons
HCFCshydrochlorofluorocarbons
ODSsozone−depleting substances
GWP100global warming potential over 100 years
GHGgreenhouse gas
METIMinistry of Economy, Trade and Industry
MOEJMinistry of the Environment
F−gasesfluorinated gases
EFsemission factors
AGAGEAdvanced Global Atmospheric Gases Experiment
NIESNational Institute for Environmental Studies
JMAJapan Meteorological Agency
PLOTporous−layer open tubular
VOCsvolatile organic compounds
UNFCCCUnited Nations Framework Convention on Climate Change
EDGAREmissions Database for Global Atmospheric Research
AAPMSambient air pollution monitoring station
RAPMSroadside air pollution monitoring station
LODlimits of detection
WDCGGWorld Data Centre for Greenhouse Gases
NEDONew Energy and Industrial Technology Development Organization
HAPshazardous air pollutants
PAMsphotochemical assessment monitoring stations

References

  1. METI. Available online: https://www.meti.go.jp/meti_lib/report/2021FY/000263.pdf (accessed on 22 December 2024). (In Japanese).
  2. MOEJ. Available online: https://www.env.go.jp/content/000194840.pdf (accessed on 22 December 2024). (In Japanese).
  3. Flerlage, H.; Velders, G.M.; Boer, J. A review of bottom-up and top-down emission estimates of hydrofluorocarbons (HFCs) in different parts of the world. Chemosphere 2021, 283, 131208. [Google Scholar] [CrossRef] [PubMed]
  4. IPCC. 2006 IPCC Guidelines for National Greenhouse Gas Inventories. Available online: https://www.ipcc-nggip.iges.or.jp/public/2006gl/ (accessed on 22 December 2024).
  5. IPCC. 2019 Refinement to the 2006 IPCC Guidelines for National Greenhouse Gas Inventories. Available online: https://www.ipcc-nggip.iges.or.jp/public/2019rf/index.html (accessed on 22 December 2024).
  6. Li, J.; Sheng, J.; Zhu, L.; Yao, B.; Wu, J.; Pu, D.; Shu, L.; Liu, S.; Li, X.; Chen, Y.; et al. Bayesian inversion of HFC–134a emissions in southern China from a new AGAGE site: Results from an observing system simulation experiment. Atmos. Environ. 2024, 334, 120715. [Google Scholar] [CrossRef]
  7. Simmonds, P.G.; Rigby, M.; Manning, A.J.; Lunt, M.F.; O’Doherty, S.; McCulloch, A.; Fraser, P.J.; Henne, S.; Vollmer, M.K.; Mühle, J.; et al. Global and regional emissions estimates of 1,1-difluoroethane (HFC–152a, CH3CHF2) from in situ and air archive observations. Atmos. Chem. Phys. 2016, 16, 365–382. [Google Scholar] [CrossRef]
  8. Choi, H.; Redington, A.L.; Park, H.; Kim, J.; Thompson, R.L.; Mühle, J.; Salameh, P.K.; Harth, C.M.; Weiss, R.F.; Manning, A.J.; et al. Revealing the significant acceleration of hydrofluorocarbon (HFC) emissions in eastern Asia through long-term atmospheric observations. Atmos. Chem. Phys. 2024, 24, 7309–7330. [Google Scholar] [CrossRef]
  9. Graziosi, F.; Arduini, J.; Furlani, F.; Giostra, U.; Cristofanelli, P.; Fang, X.; Hermanssen, O.; Lunder, C.; Maenhout, G.; O’Doherty, S.; et al. European emissions of the powerful greenhouse gases hydrofluorocarbons inferred from atmospheric measurements and their comparison with annual national reports to UNFCCC. Atmos. Environ. 2017, 158, 85–97. [Google Scholar] [CrossRef]
  10. Prinn, R.G.; Weiss, R.F.; Arduini, J.; Arnold, T.; DeWitt, H.L.; Fraser, P.J.; Ganesan, A.L.; Gasore, J.; Harth, C.M.; Hermansen, O.; et al. History of chemically and radiatively important atmospheric gases from the Advanced Global Atmospheric Gases Experiment (AGAGE). Earth Syst. Sci. Data 2018, 10, 985–1018. [Google Scholar] [CrossRef]
  11. Lunt, M.F.; Rigby, M.; Ganesan, A.L.; Manning, A.J.; Prinn, R.G.; O’Doherty, S.; Mühle, J.; Harth, C.M.; Salameh, P.K.; Arnold, T.; et al. Reconciling reported and unreported HFC emissions with atmospheric observations. Proc. Natl. Acad. Sci. USA 2015, 112, 5927–5931. [Google Scholar] [CrossRef] [PubMed]
  12. Yao, B.; Fang, X.; Vollmer, M.K.; Reimann, S.; Chen, L.; Fang, S.; Prinn, R.G. China’s hydrofluorocarbon emissions for 2011–2017 inferred from atmospheric measurements. Environ. Sci. Technol. Lett. 2019, 6, 479–486. [Google Scholar] [CrossRef]
  13. Velders, G.J.M.; Daniel, J.S.; Montzka, S.A.; Vimont, I.; Rigby, M.; Krummel, P.B.; Muhle, J.; O’Doherty, S.; Prinn, R.G.; Weiss, R.F.; et al. Projections of hydrofluorocarbon (HFC) emissions and the resulting global warming based on recent trends in observed abundances and current policies. Atmos. Chem. Phys. 2022, 22, 6087–6101. [Google Scholar] [CrossRef]
  14. Velders, G.J.M.; Fahey, D.W.; Daniel, J.S.; Andersen, S.O.; McFarland, M. Future atmospheric abundances and climate forcings from scenarios of global and regional hydrofluorocarbon (HFC) emissions. Atmos. Environ. 2015, 123, 200–209. [Google Scholar] [CrossRef]
  15. Miller, B.R.; Weiss, R.F.; Salameh, P.K.; Tanhua, T.; Greally, B.R.; Mühle, J.; Simmonds, P.G. Medusa: A sample preconcentration and GC/MS detector system for in situ measurements of atmospheric trace halocarbons, hydrocarbons, and sulfur compounds. Anal. Chem. 2008, 80, 1536–1545. [Google Scholar] [CrossRef]
  16. Enomoto, T.; Yokouchi, Y.; Izumi, K.; Inagaki, T. Development of an analytical method for atmospheric halocarbons and its application to airborne observation. J. Jpn. Soc. Atmos. Environ. 2005, 40, 1–8, (In Japanese with English Abstract). [Google Scholar] [CrossRef]
  17. Yi, L.; An, M.; Yu, H.; Ma, Z.; Xu, L.; O’Doherty, S.; Rigby, M.; Western, L.M.; Ganesan, A.L.; Zhou, L.; et al. In situ observations of halogenated gases at the Shangdianzi background station and emission estimates for Northern China. Environ. Sci. Technol. 2023, 57, 7217–7229. [Google Scholar] [CrossRef] [PubMed]
  18. Yoshimi, Y.; Komasaka, K.; Yamashita, D.; Hirai, H.; Kikuno, Y.; Takase, Y.; Karisya, R.; Kaitoh, C.; Tatsuki, S. Trends in atmospheric concentrations of important halocarbons in Tokushima. Tokushima Prefectural Public Health. Pharm. Environ. Sci. Cent. Annu. Rep. 2023, 13, 19–25. (In Japanese) [Google Scholar]
  19. MOEJ. Available online: https://www.env.go.jp/content/900402505.pdf (accessed on 22 December 2024). (In Japanese).
  20. UNFCCC. National Inventory Submissions 2023. Available online: https://unfccc.int/GHG–inventories-annex-i-parties/2023 (accessed on 22 December 2024).
  21. Crippa, M.; Guizzardi, D.; Pagani, F.; Banja, M.; Muntean, M.; Schaaf, E.; Monforti-Ferrario, F.; Becker, W.E.; Quadrelli, R.; Risquez Martin, A.; et al. GHG Emissions of All World Countries; Publications Office of the European Union: Luxembourg, 2024. [Google Scholar] [CrossRef]
  22. IPCC. Working Group III Contribution to the Sixth Assessment Report of the Intergovernmental Panel on Climate Change. Available online: https://www.ipcc.ch/report/ar6/wg3/downloads/report/IPCC_AR6_WGIII_FullReport.pdf (accessed on 22 December 2024).
  23. WMO. Scientific Assessment of Ozone Depletion: 2022. Available online: https://ozone.unep.org/sites/default/files/2023-02/Scientific-Assessment-of-Ozone-Depletion-2022.pdf (accessed on 22 December 2024).
  24. MOEJ. Available online: https://www.env.go.jp/content/000205584.pdf (accessed on 22 December 2024). (In Japanese).
  25. Japan Fluorocarbon Manufacturers Association. Available online: http://www.jfma.org/pdf/mixture-20240401.pdf (accessed on 22 December 2024). (In Japanese).
  26. NEDO. 2024. Available online: https://www.nedo.go.jp/content/100972745.pdf (accessed on 22 December 2024). (In Japanese).
Figure 1. Measurement flow of the preconcentrator–GC–MS and parameters considered for HFCs measurement.
Atmosphere 16 00069 g001
Figure 2. Atmospheric observation sites of HFCs in Saitama Prefecture.
Atmosphere 16 00069 g002
Figure 3. Chromatograms obtained by the developed method.
Atmosphere 16 00069 g003
Figure 4. Calibration curves obtained by the developed method (concentration range 0–100 ppt).
Atmosphere 16 00069 g004
Table 1. Chemical formula, molecular weight, boiling point, atmospheric lifetime, and global warming potential (GWP100) of target HFCs.
HFCsChemical FormulaMolecular WeightBoiling Point (°C)Atmospheric Life (y) (a)GWP100 (a)
HFC–23CHF370–82.122814590
HFC–32CH2F252–51.75.4770
HFC–125CHF2CF3120–48.1303744
HFC–134aCH2FCF3102–26.1141526
HFC–143aCH3CF384–47.2515807
HFC–152aCH3CHF266–241.6164
(a) IPCC, Working group III contribution to the sixth assessment report of the intergovernmental panel on climate change (2022) [22].
Table 2. Optimized measurement conditions in the preconcentrator–GC–MS for the determination of HFCs.
VOC Preconcentrator7200A (Entech Instruments, USA)
 Concentration ModeExtended Cold Trap Dehydration (ECTD)
 Sampling Vol.200 mL
 Sampling Flow Rate20 mL/min
 Module 1Empty Trap
   Trap Temp.–40 °C
   Desorption Temp.10 °C
   M1 to M2 Vol.10 mL/min
   M1 to M2 Flow Rate10 mL/min
 Module 2Tenax TA
   Trap Temp.–60 °C
   Desorption Temp.210 °C
 Module 3Cryo Focus
   Trap Temp.–170 °C
   Desorption Temp.80 °C
 Injection Time0.1 min (Valve Plate Temp. 120 °C)
GC–MS5977C (Agilent Technologies, USA)
 ColumnDB–1, 0.32 mmI.D. × 60 m × 1.00 μm (Agilent Tehnologies, USA)
 Carrier GasHe (Constant Flow 1.5 mL/min)
 Oven Temp.–50 °C (10 min) → 20 °C/min → 220 °C
 MS Transfer Line Temp.210 °C
 Ion Source Temp.250 °C
 Quadpole Temp. 150 °C
 Ionization MethodEI
 Volatge70 eV
 Analytical ModeSIM
m/zQuantifierQualifier
 HFC–236951
 HFC–325133
 HFC–12510151
 HFC–143a6965
 HFC–134a6983, 33
 HFC–152a6551, 47
Table 3. HFCs observed by this study and other organizations.
Organization (a)SiteCharacteristics (b)PeriodStatisticConcentration (ppt)
HFC–32HFC–125HFC–134aHFC–143aHFC–152a
MOEJKawasakiAAPMSMarch 2022–February 2023Median137801713914
HokkaidoBackgroundAugust and December 2022Average36461393311
JMAMinamitorishimaBackgroundJanuary 2023–December 2023Average3346137349
(Median)(33)(45)(137)(34)(9)
Tokushima
Pref.
NarutoAAPMSApril 2021–March 2023Average58471662513
KitajimaAAPMS 58471712711
TokushimaRAPMS 135802042619
AnanAAPMS 43421612412
AGAGE (c)GlobalBackgroundJune 2023Average3744129317
CESS
(This Study)
KumagayaAAPMSJanuary 2024–December 2024Average164781934416
(Median)(149)(75)(191)(43)(13)
KazoAAPMS 131701734316
(127)(71)(174)(42)(12)
TodaRAPMS 1961002165319
(175)(92)(209)(47)(14)
Overall observation in Saitama Prefecture 164831944617
(All data from 3 sites) (143)(77)(190)(44)(13)
(a) MOEJ and JMA are abbreviations for the Ministry of the Environment, Government of Japan and the Japan Meteorological Agency, respectively. (b) JESC, AAPMS, and RAPMS, are abbreviations for the Japan Environmental Sanitation Center, the Ambient Air Pollution Monitoring Station, and the Roadside Air Pollution Monitoring Station, respectively. (c) Transcribed global background data based on “global_mean_ms.txt (updated on August 2024)” downloaded from the AGAGE website (https://www-air.larc.nasa.gov/missions/agage/) (accessed on 22 December 2024).
Table 4. Retention time and monitor ions (qualitative and quantitative ions) of VOCs that can be measured simultaneously.
GroupCompoundR.T.m/z GroupCompoundR.T.m/z
(min)QuantifierQualifier (min)QuantifierQualifier
AlkanesPropane12.744439 HalidesChloromethane15.335052
i–C416.364341 Vinyl Chloride16.966264
n–C417.844358 Bromomethane18.459496
i–C520.285743 Chloroethane19.066466
n–C521.024342 1,1–Dichloroethene21.366196
Cyclopentane22.897055 Dichloromethane21.548486
2,3–Dimethylbutane22.917143 3–Chloro–1–propene21.727641
2–Methylpentane23.004371 1,1–Dichloroethane22.856365
3–Methylpentane23.445756 cis–1,2–Dichloroethene23.729698
n–C623.935756 Chloroform24.038385
Methylcyclopentane24.905669 1,2–Dichloroethane24.866264
2,4–Dimethylpentane24.915785 1,1,1–Trichloroethane25.189799
Cyclohexane26.068469 Carbontetrachloride25.89117119
2–Methylhexane26.138557 1,2–Dichloropropane26.686362
2,3–Dimethylpentane26.277071 Trichloroethene26.95130132
3–Methylhexane26.457057 cis–1,3–Dichloropropene28.037577
2,2,4–Trimethylpentane27.005756 trans–1,3–Dichloropropene28.737577
n–C727.257157 1,1,2–Trichloroethane29.049985
Methylcyclohexane28.288398 1,2–Dibromoethane30.54107109
2,3,4–Trimethylpentane29.257170 Tetrachloroethene31.28166164
2–Methylheptane29.675770 Chlorobenzene32.4311277
3–Methylheptane29.988557 1,1,2,2–Tetrachloroethane34.138385
n–C830.928571 Benzylchloride37.3091126
n–C934.498571 1,3–Dichlorobenzene37.33146148
n–C1037.225771 1,4–Dichlorobenzene37.44146148
n–C1139.425771 1,2–Dichlorobenzene38.04146148
AlkenesPropylene12.434139 1,2,4–Trichlorobenzene41.15180182
1–Butene17.545641 Hexachloro–1,3–butadiene42.06225227
1,3-Butadiene17.685453 TerpenesIsoprene21.186867
trans-2-Butene18.295641 a–Pinene35.839377
cis-2-Butene18.785641 b–Pinene36.979369
1-Pentene20.735570 CFCsCFC–1213.798587
trans-2-Pentene21.265570 CFC–11416.68135137
cis-2-Pentene21.485570 CFC–1120.49101103
2,2–Dimethylbutene22.055771 CFC–11321.86151153
2–Methyl–1–pentene23.586956 HCFCsHCFC–2213.185167
AromaticsBenzene25.717877 HCFC–142b15.656545
Toluene29.499192 HCFC–12320.2985133
Ethylbenzene33.0791106 HCFC–141b20.708161
m,p–Xylene33.3991106 HCFC–225ca21.348385
Styrene34.00104103 HCFC–225cb21.766769
o–Xylene34.2091106 NitrileAcrylonitrile21.665253
i–Propylbenzene35.17105120 Internal Fluorobenzene26.019670
n–Propylbenzene36.0291120 StandardsToluene–d829.3298100
3–Ethyltoluene36.19105120
4–Ethyltoluene36.26105120
1,3,5–Trimethylbenzene36.39105120
2–Ethyltoluene36.71105120
1,2,4–Trimethylbenzene37.07105120
1,2,3–Trimethylbenzene37.81105120
m–Diethylbenzene38.33119134
p–Diethylbenzene38.50119134
Disclaimer/Publisher’s Note: The statements, opinions and data contained in all publications are solely those of the individual author(s) and contributor(s) and not of MDPI and/or the editor(s). MDPI and/or the editor(s) disclaim responsibility for any injury to people or property resulting from any ideas, methods, instructions or products referred to in the content.

