Abstract
The effect of COVID-19 lockdown (LD) on many ambient air pollutants (NO, NO2, PM2.5, PM10, O3 and SO2) was assessed for the first time in the Western Balkans with an innovative approach that evaluates a variety of factors including the stringency of the LD measures, the type of location, the pollution sources, the correlation with traffic fluxes and the meteorology. To that end, observations from 10 urban sites were compared with historical time series. The time window 1 February–30 May 2020 was classified in sub-periods on the basis of the stringency of the circulation restrictions. NO2 and O3 are the pollutants most affected by restrictions to population circulation due to lockdown during the first phase of the COVID-19 pandemic, and are well correlated with traffic fluxes. A reduction in fine particulate matter (PM2.5 and PM10) concentrations is observed in all sites only during the full LD periods, while the relation between SO2 average and maximum hourly concentrations and LD periods in industrial and traffic sites vary from site to site. The reduction in NO2 concentrations during the LD resulted in a reduction in mortality associated with air pollution in the largest cities, while the interpretation of the changes in O3 and particulate matter is less clear.
1. Introduction
The epidemic of the coronavirus disease that was first identified in Wuhan, China, in late December 2019 receives the name of COVID-19. On 11 March 2020, the World Health Organization declared COVID-19 a pandemic. In Europe, the first outbreaks of COVID-19 were registered in Italy in February 2020 and led to sanitary isolation measures by public health authorities to combat the disease spread. The limitation to the circulation of the population, so called lockdown (LD), was progressively extended to all the world. The consequence was a dramatic reduction in displacements, and, more generally speaking, in most human activities, including trade and industrial production. The studied effects of the COVID-19 epidemic on the stock markets revealed that the stock exchanges in the Balkan countries were affected at the same rate as those of other countries [1]. Aside from the emerging economic and health crisis, COVID-19 also had positive aspects, such as reduction in noise and greenhouse gases (GHG) emissions and an unprecedented abatement in the emission of pollutants [2,3]. However, indoor air quality remained poor during the LD, due to the increased domestic activities [4], and in certain cases working from home might have a detrimental health impact, causing the need for interventions to employees working from home [5].
To assess the variation in the concentrations during the LD it is necessary to consider the stringency of the circulation limitation measures and the extent of inter-annual variations in the level of pollutants and the influence of meteorology and atmospheric chemistry [6,7,8]. Previous studies on the changes in air pollution concentrations during LD using different reference periods and considering different controlling factors show that nitrogen oxides and particulate matter concentrations decreased during the COVID-19 LD, while ozone prevalently increased, although the response varies considerably between sites [9,10,11,12]. De-weathered COVID-19 LD pollution levels, to account for meteorological influences, were analysed with the aim of predicting air quality improvements in scenarios where fleets are dominated by electric vehicles. To that end, 2020 NO2 and O3 concentrations were compared with those of pre– (2016–2019), as well as recovery (2021) and post–COVID-19 (2022) years [13]. According to this study, significant decreases in NO2 concentrations are to be expected, while considerable increases in O3 concentrations are unlikely, due to vehicle electrification. The influence of air traffic has the largest impact on ultrafine particle concentrations increase in ambient air at, and around the vicinity of, the airport. This was determined in a study that analysed the periods with no air traffic during airport reconstruction, COVID-19 LD, with limited airport operation and the peak summer holiday travel season [14].
Some studies claim that while the lockdown contributed to reducing the emissions from road transport, those from residential heating increased [15]. Moreover, it has been estimated that lockdown contributed to reducing the emissions of black carbon by 23 kt in Europe (20% in Italy, 40% in Germany, 34% in Spain, 22% in France) compared to the same period in the previous five years [16]. The comparison of emissions in 2020 with the historical five-year period in the Western Balkan (WB) region and analysis across the three sectors is provided in Table 1 [17,18]. The SO2 emissions originate predominantly from the coal power plants using lignite to generate electricity, and increased by 19% in this sector, while they decreased by 9% in the residential sector from the solid fuel combustion [17]. By comparison, PM2.5 and NOx emissions decreased from the electricity generation sector, and increased from both residential and road transport sectors.

Table 1.
Pollutant emissions in the Western Balkans region.
The WB is one of the air pollution hotspots in Europe, because the levels of important regulated pollutants (PM2.5, PM10, and SO2) are among the highest of the entire continent [19] and their impact on health (mortality and morbidity) and related costs for the society are considerably higher than surrounding areas located in EU Member States [20]. This region is considered economically the least developed of Europe, with a substantial dependence on lignite for electricity generation [21], thus making the decarbonisation and depollution of the power sectors in the region challenging. Even in urban areas (cities), significant emissions of pollutants originate from the residential sector, due to the combustion of solid fuels [22,23]. Moreover, the scarcity of reliable air quality measurements and their fragmentation, both in space and time, is an obstacle for analysis of long-term trends in this region [18,24,25]. The absolute number of premature deaths attributable to the exposure to PM2.5 annual average concentrations are above 5 μg/m3, which is the WHO guideline, shows a decrease from 45.9 thousand in 2005 to 36.7 thousand in 2021 [26]. Still, in 2005, the mortality rates in individual WB countries were between 1.7 and 3.1 times higher than in the EU27, and in 2021 the gap grew to 2.9–4.2. Previous studies have reported a reduction in mortality associated with air pollution during the LD [27,28].
Although the response of pollutants to changes in emission during the COVID-19 LD present similarities across different locations, specificities at regional or city level in terms of emission sources, meteorological conditions and stringency of the LD measures may lead to significant differences. The objective of this study is to investigate the situation in a region with intensive emissions of pollutants, especially PM and SOx, from the energy and residential sectors. Therefore, the present study aims to (a) assess the effect of COVID-19 LD on ambient air quality by comparing observations in 2020 before and during the LD with the corresponding time of the year in historical time series, considering the influence of different explanatory variables, and (b) to quantify the impacts of the concentration changes on health.
2. Materials and Methods
The time window selected for this study is 1 February–30 May 2020, to include the period when the circulation of the population was partially or completely restricted (lockdown, LD) and the weeks previous to such restrictions. The LD periods considered in the present study varied between countries. In North Macedonia, the period with lockdown used in this study lasted from 22 March to 26 May, in Serbia from March 18th to May 7th and in Montenegro from 20 March to 30 May.
The days of the studied time window were classified in four sub-periods, on the basis of the duration of the circulation restrictions: (a) Full lockdown (LD full), when restrictions lasted for 24 h, (b) Partial lockdown day and night (LD part. D&N), for restrictions below 24 h involving part of the day and the night, (c) Partial lockdown night (LD part. N), only night-time restrictions, and (d) No lockdown (no LD), for days in which there were no circulation restrictions.
The pollutants selected for the study are particulate matter (PM2.5, PM10), nitrogen oxides (NO, NO2), ozone (O3) and sulphur dioxide (SO2). The 10 monitoring sites located in Serbia, North Macedonia and Montenegro, were selected for the study to obtain the most complete time series (including 3–5 years before 2020) for all the pollutants of interest in locations affected by different type of pollution sources: traffic, industrial and background (Table 2, Figure 1). The first column of this table provides the “Air Quality Station EoI Code”, which is a unique identification for each monitoring station in the European official Air Quality e-reporting system (European Air Quality Portal website https://eeadmz1-cws-wp-air02-dev.azurewebsites.net/ (accessed on 19 December 2024).
Table 2.
List of monitoring stations analysed in the present study.
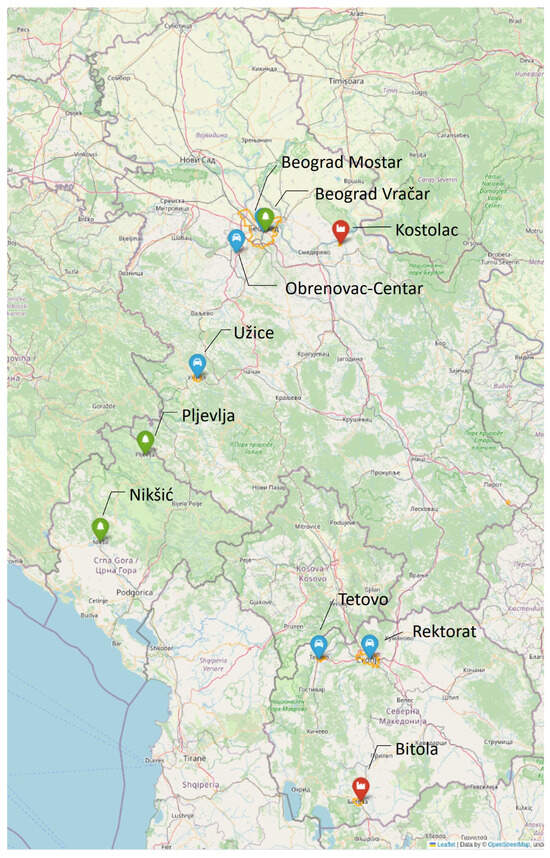
Figure 1.
Location of the monitoring stations used for the present study. The type of monitoring station is also indicated: traffic (blue), background (green) and industrial (red). Source of the background map: OpenStreetMap® licensed under ODbL by the OpenStreetMap Foundation.
To assess the immediate LD effects on air pollution, the average concentration in each site and each of the four sub-periods were compared with the average for the same days in the previous 3–5 years (see time series in Table 3). An adjustment was made for the weekday, to make sure that same weekdays are considered when comparing 2020 with the time series. This was accomplished to account for the weekly variations in the road traffic fluxes (especially between week and weekend days). A comparison by monitoring stations at a daily level between the concentrations in the observed time window of 2020 and the average of the corresponding days in the time series used as a reference is provided in Figures S1–S4 of the Supplementary Material.
Table 3.
Pollutants and meteorological data available by monitoring station.
The correlation between pollutant hourly concentrations and traffic fluxes in the vicinity of the Rektorat monitoring site was used to assess the influence of the emissions from vehicles. The variation in the meteorological parameters: temperature, solar radiation and wind speed, between different time windows, were taken into account for the interpretation of the results.
Premature mortalities were calculated using a population-attributable fraction approach [29]:
where m0 is the cause-specific all-risk mortality rate for the exposed population POP, AF is the fraction of total mortalities attributable to air pollution, and RR is the relative risk of death attributable to a change in population-weighted mean pollutant concentration. The impacts on health were assessed by analysing the changes in mortality associated with changes in the concentration of air pollutants by means of concentration–response functions [30,31]. The population was derived from the Copernicus Stats in the City Database [32] and the all-cause mortality from the WHO mortality database [33].
∆ Mort = m0 × AF × POP
AF = ((RR − 1))/RR
3. Results
The analysis of the variation in concentrations, traffic counts and meteorological variables are presented and discussed in the following three subsections.
3.1. Variations in 2020 Compared with the Time Series
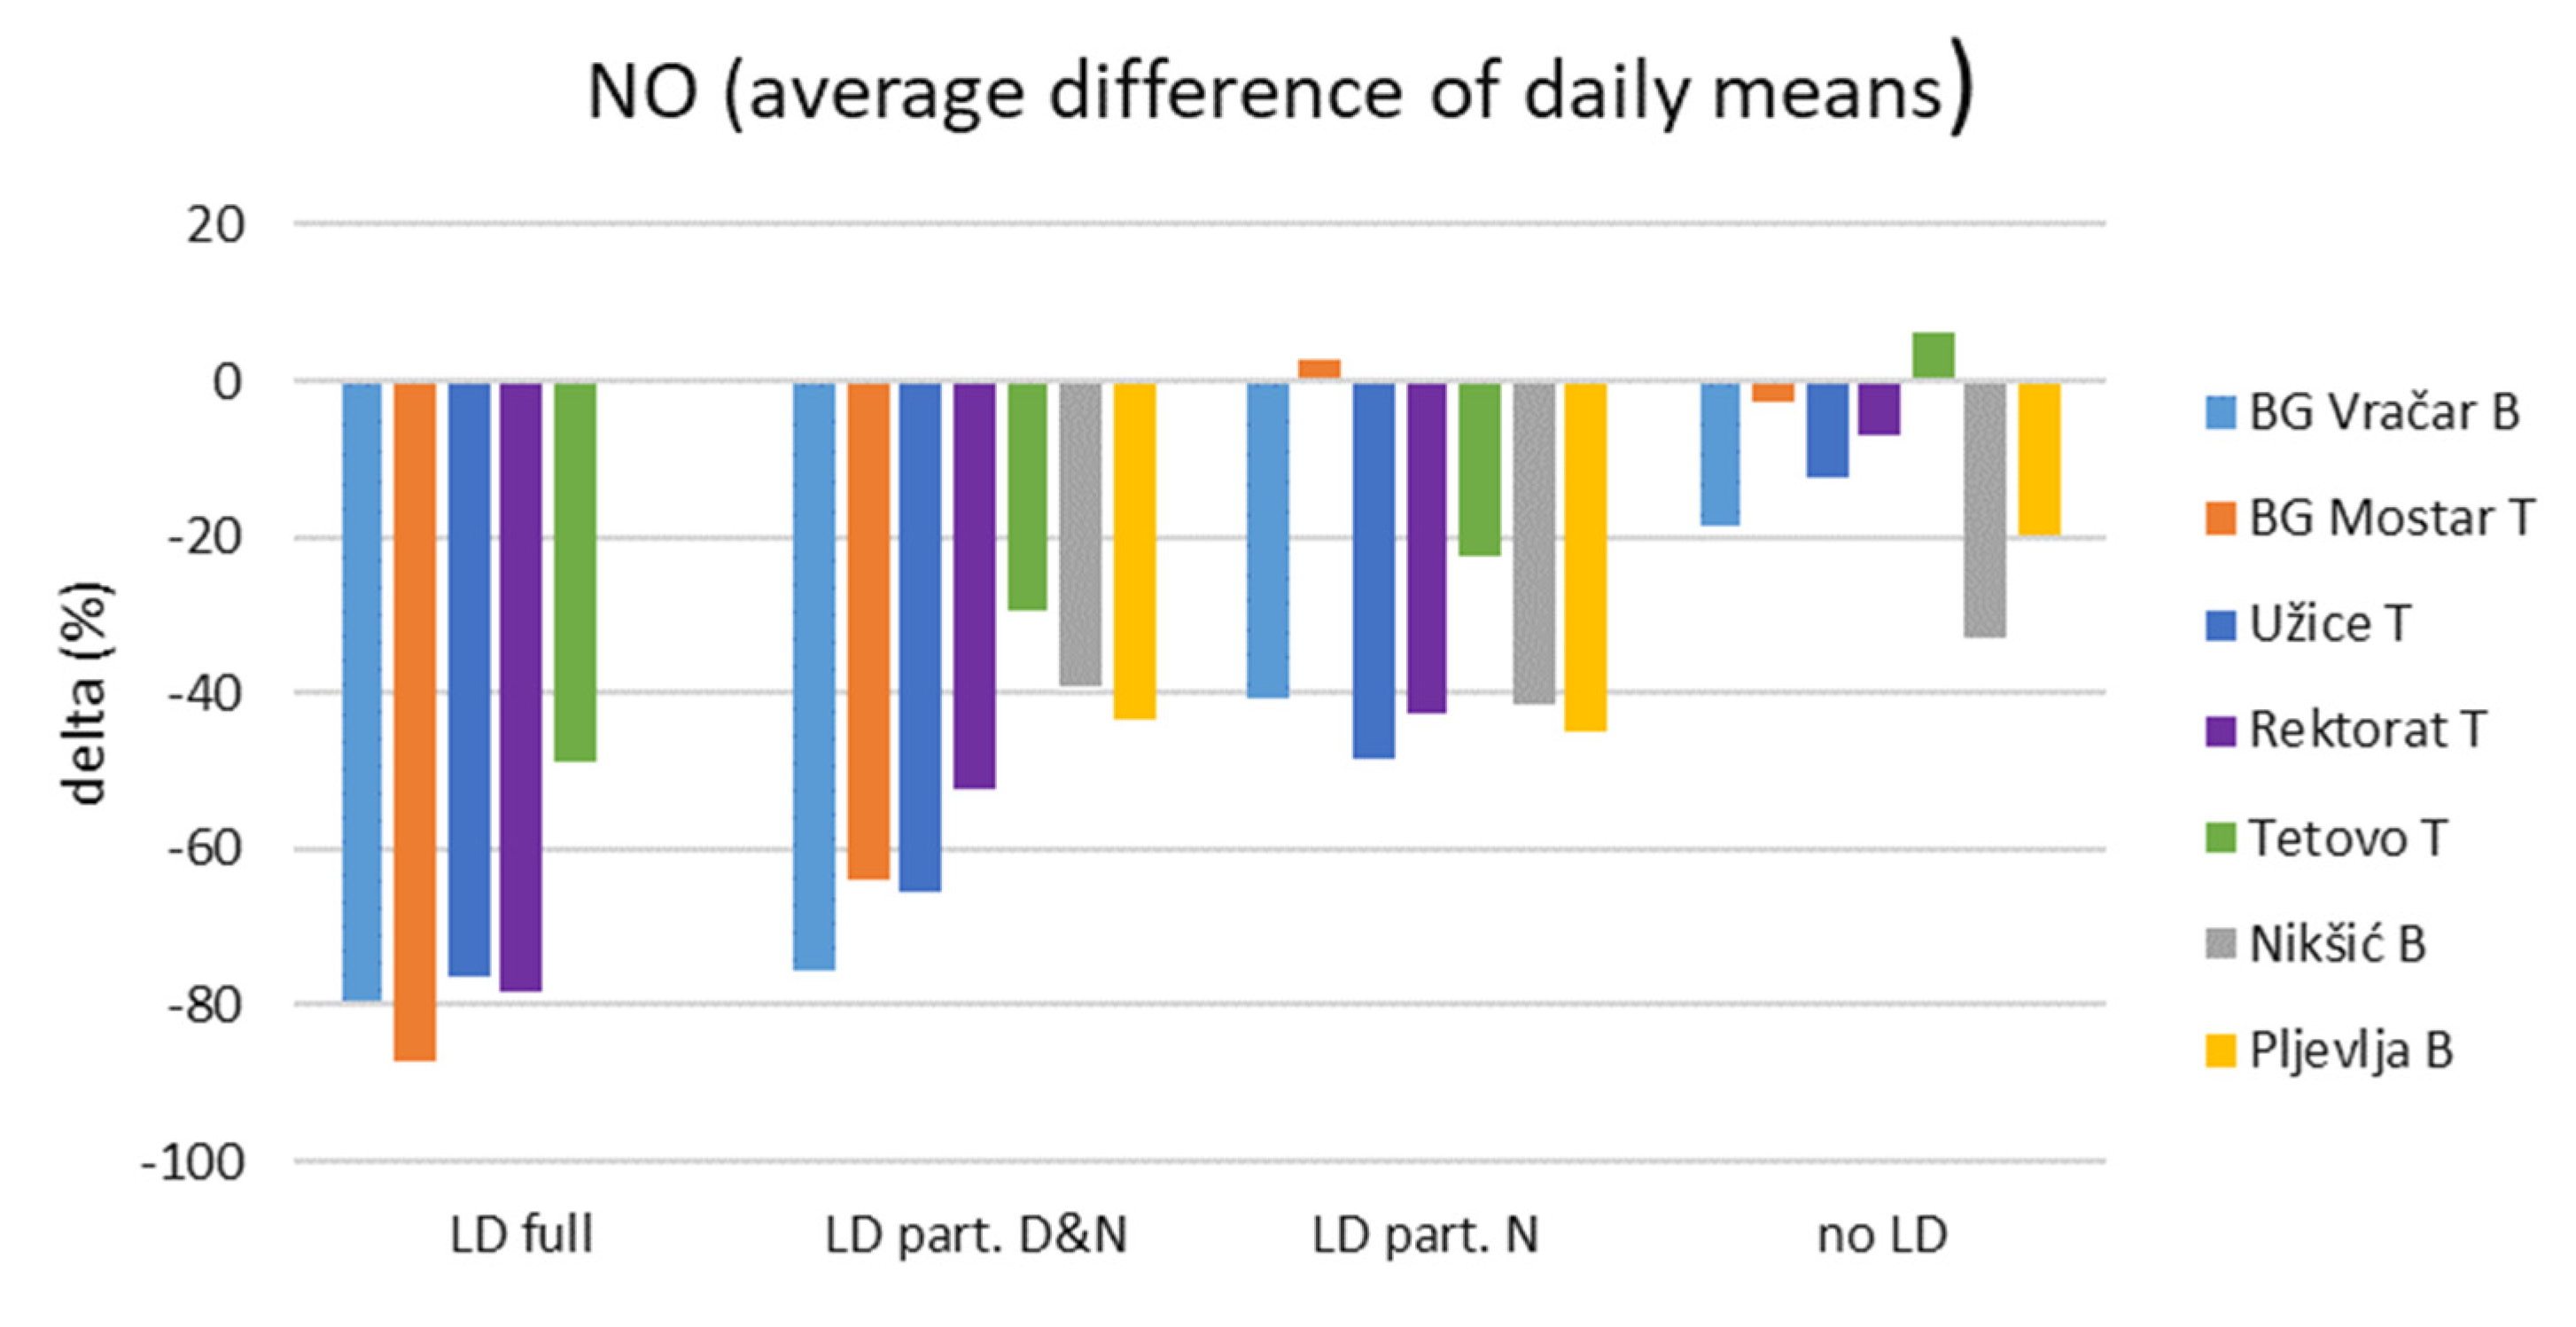
During the full LD periods in 2020, considerable reductions in NO concentrations (average: −74%; range: −50% to −87%) are observed in traffic and background monitoring stations compared to the time series (Figure 2). In absolute terms, the variations (delta) are in the range −11 to −48 µg/m3. The NO concentration variation is, on average, −53% (range: −30%, −75%) in partial day and night LD and −33% (range: +2–48%) in night-time LD. Average NO concentration reductions in the three LD subcategories are significantly higher than those observed during the no-LD periods (p < 0.01).
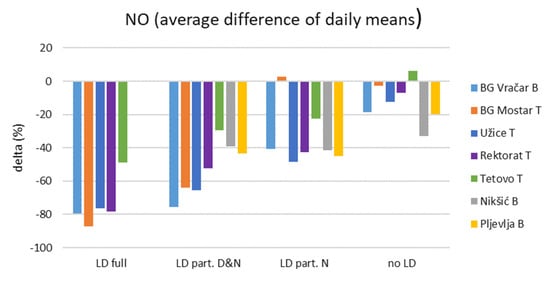
Figure 2.
Average differences between NO daily means in 2020 with different types of lockdown (LD) and the average of the corresponding days in the time series in traffic (T) and background (B) monitoring stations.
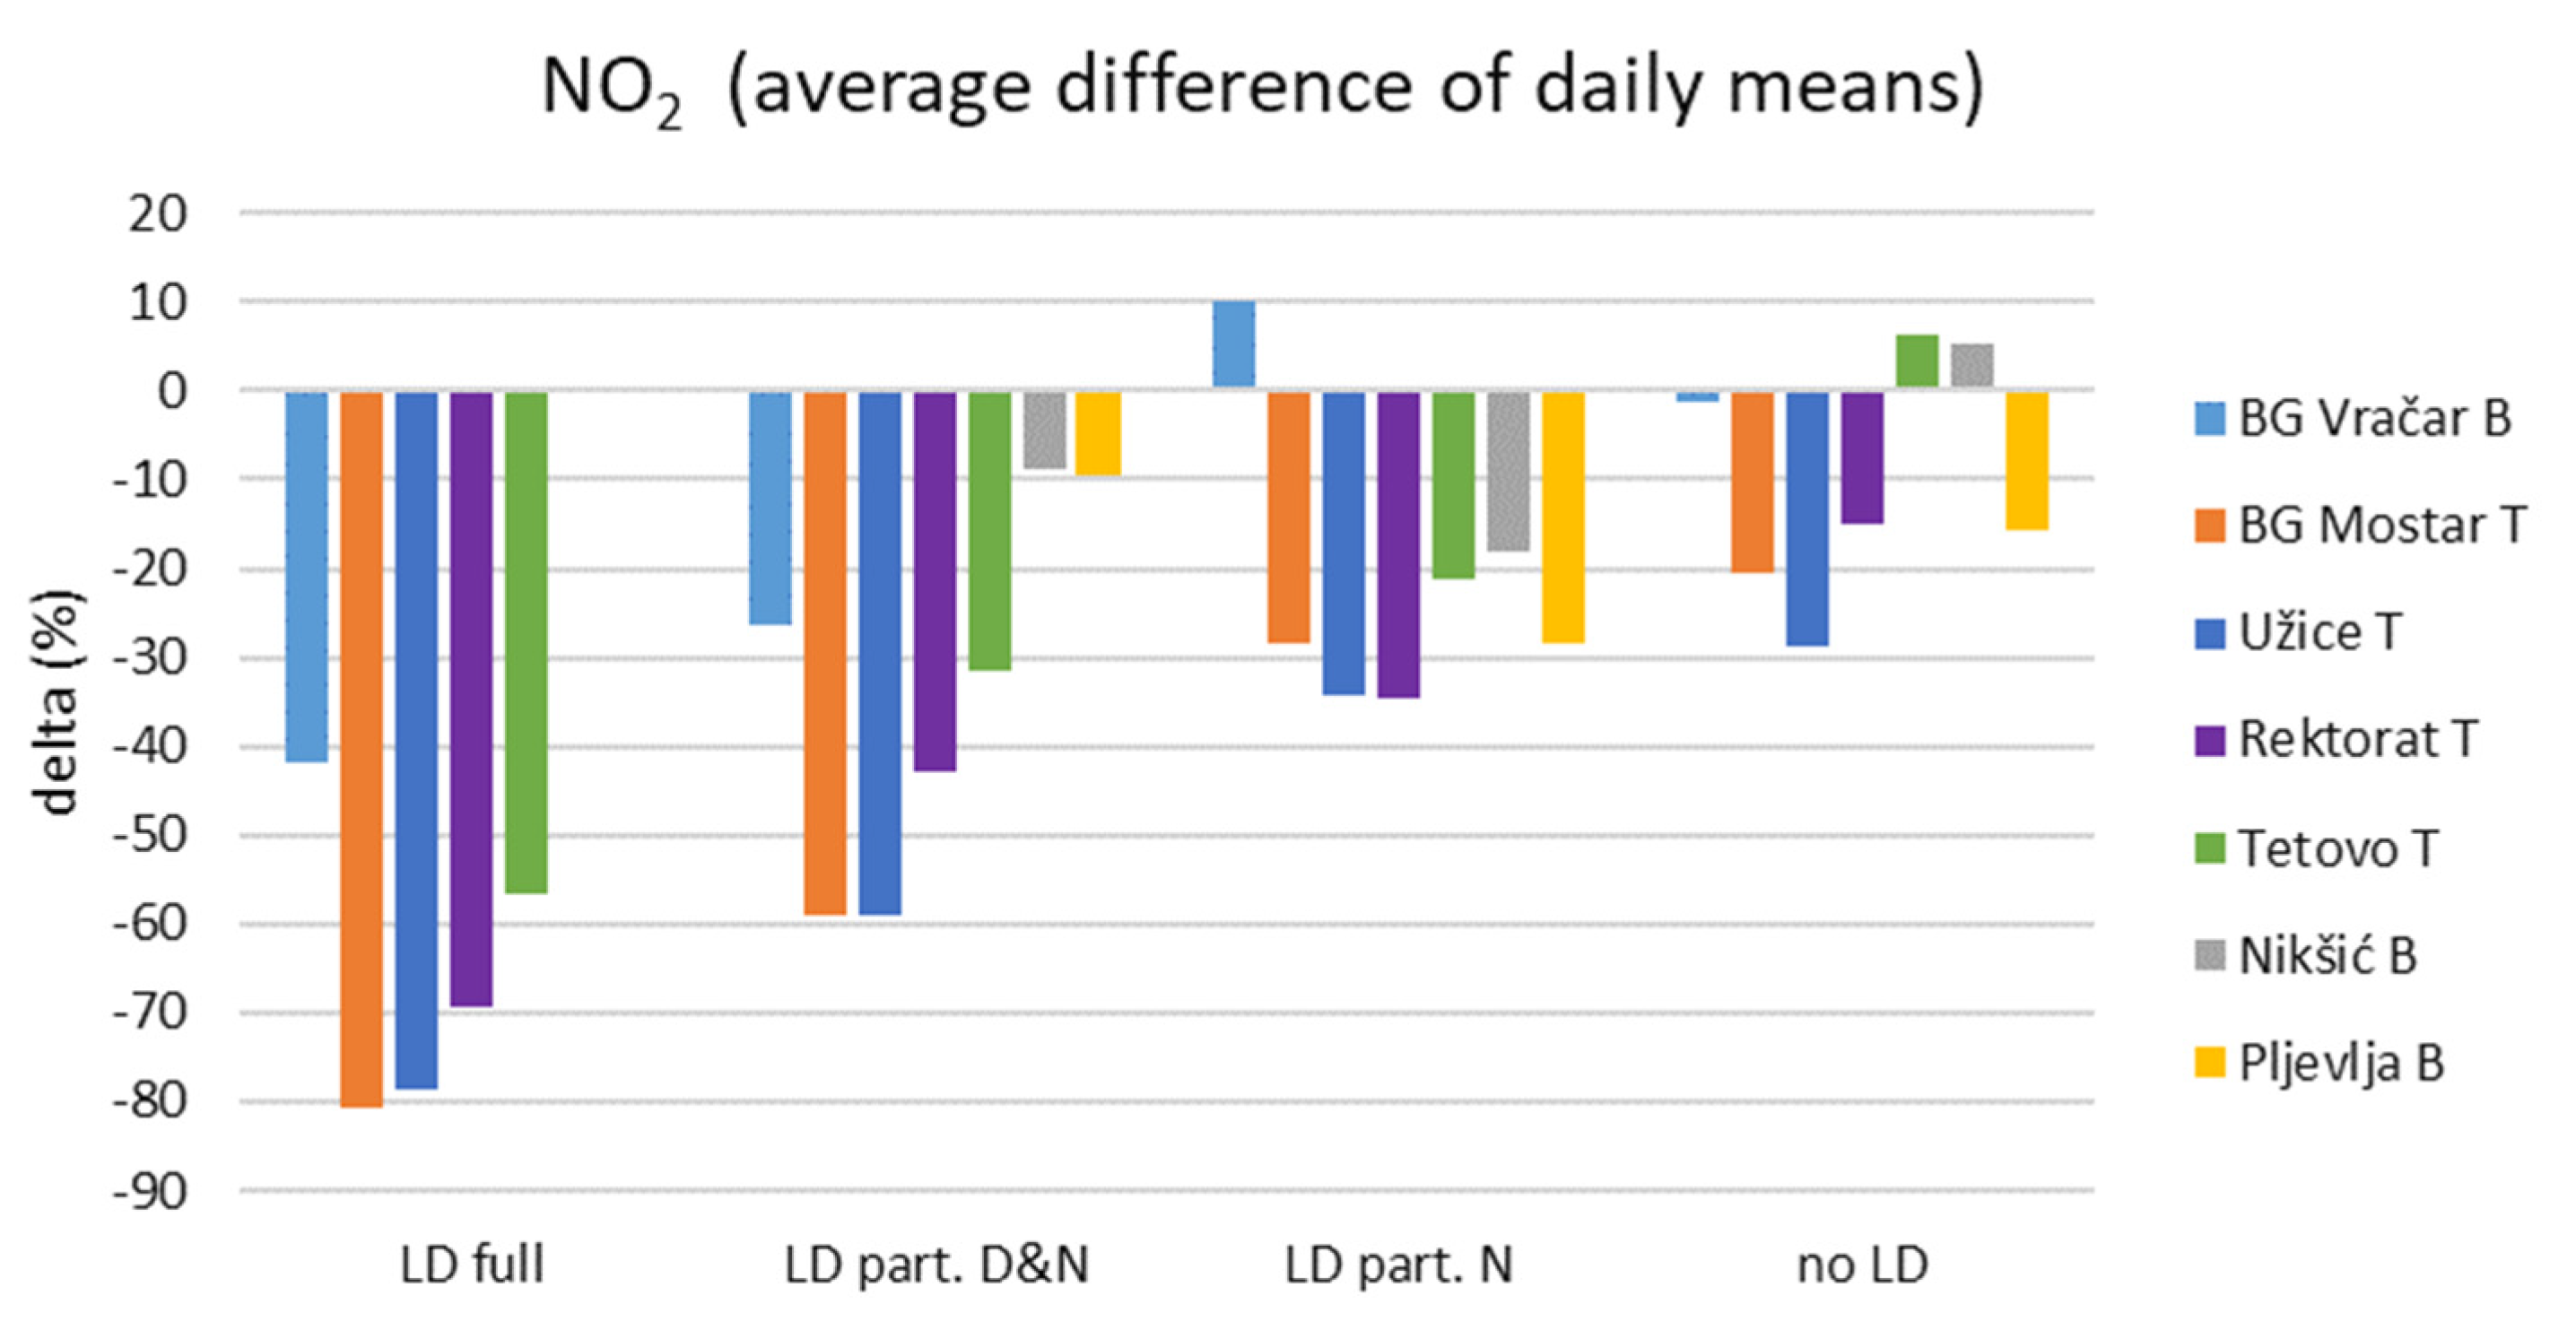
NO2 concentration reductions compared to the time series in the same sites follows a pattern similar to NO (Figure 3). Concentration reductions are, on average, −65% (range: −42%, −81%), −34% (range: −59%, −9%), and −22% (range: −35%, +10%), during the full LD, partial day and night LD, and in night-time LD, respectively. NO2 concentration reductions in the first two subcategories are significantly higher than those observed during the no-LD periods (p < 0.01 and p < 0.02). By comparison, night-time LD levels do not differ significantly from no-LD periods. During the full-LD periods, the average NO2 concentration variation is between −10 µg/m3 and −37 µg/m3. Unlike the background location of Vračar, the sites of Nikšić and Pljevlja show limited differences between the periods with and without LD.

Figure 3.
Average differences in NO2 daily means in 2020 with different types of lockdown (LD) and the average of the corresponding days in the time series in traffic (T) and background (B) monitoring stations.
Unlike nitrogen oxides, the O3 levels in traffic sites are the highest during the full-LD and the lowest during the no-LD periods, with values decreasing proportionally with respect to the stringency of the LD (Figure 4). This is explained by the reduced availability of primary pollutants (NO), which reacts quickly with O3 (titration effect) in a chemical regime where volatile organic compounds are the limiting factor, which is the typical situation in urban locations. In one these sites, the differences with the time series are positive and in the other they are negative, a behaviour that has been attributed to the different levels of NO abatement in the two locations. Also, the industrial site presents positive variations in O3 levels compared with the time series in the periods with LD and differences close to zero, when no LD measures are in place. On the contrary, levels in the background location do not change significantly between LD and no-LD periods, in line with the limited variations in NO and NO2 levels observed in this location, which is not directly affected by road transport or industrial emissions.
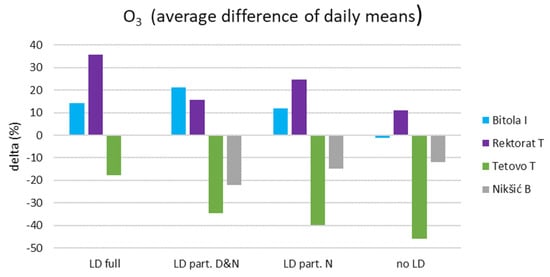
Figure 4.
Average differences between O3 daily means in 2020 with different types of lockdown (LD) and the average of the corresponding days in the time series in traffic (T), background (B) and industrial (I) monitoring stations.
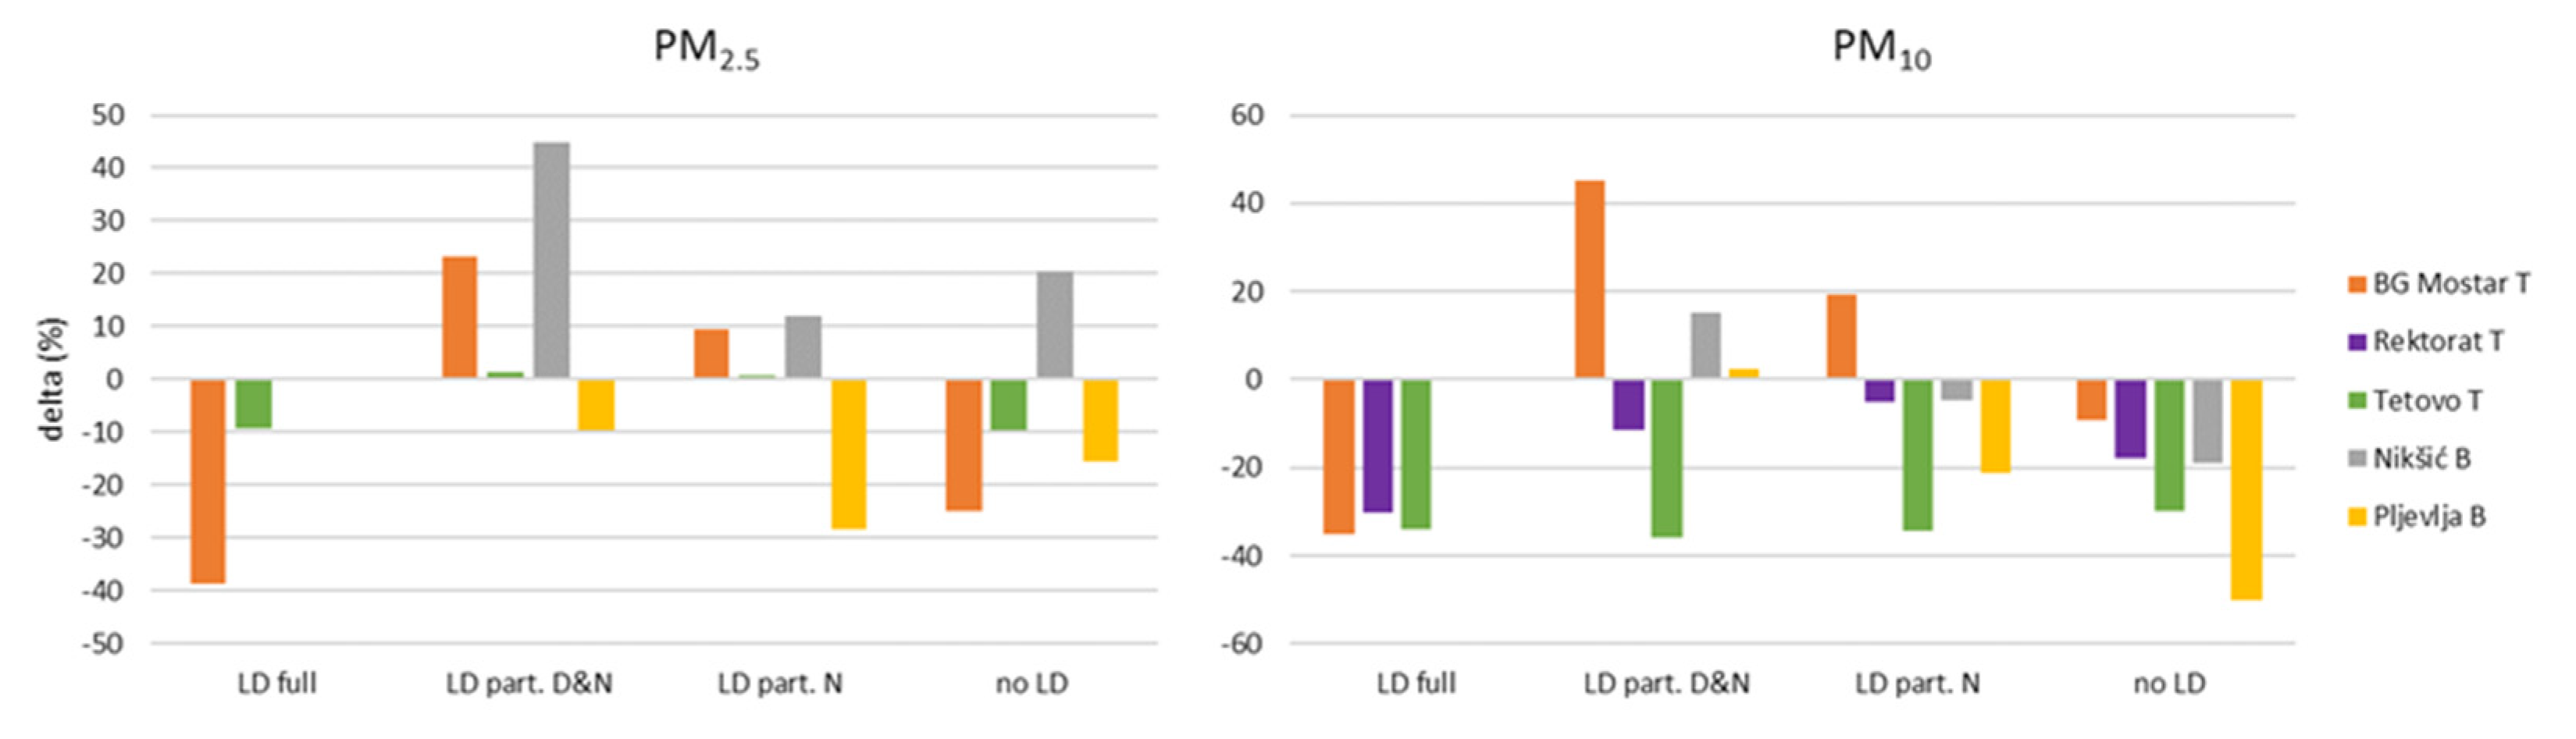
When it comes to fine particulate matter (PM10 and PM2.5), the reductions are clearly observed in all locations only for the full LD (range −1% to −40%). In partial and no LD, the behaviour of the monitoring stations, even of the same type, follows different patterns, and there is no clear relationship with the LD periods (Figure 5). This result is in line with previous studies showing that vehicles contribute to a small share of the observed particulate matter levels in WB cities [34]. The studied time window in 2020 includes a period of the year in which the contribution from domestic heating cannot be neglected, even if the emissions decrease during the transition between winter and summer conditions.
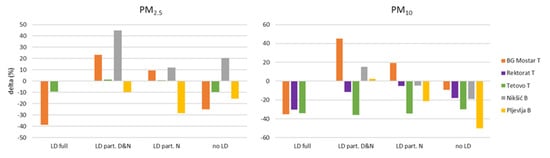
Figure 5.
Average differences between PM2.5 and PM10 daily means in 2020 with different types of lockdown (LD) and the average of the corresponding days in the time series in traffic (T) and background (B) monitoring stations.
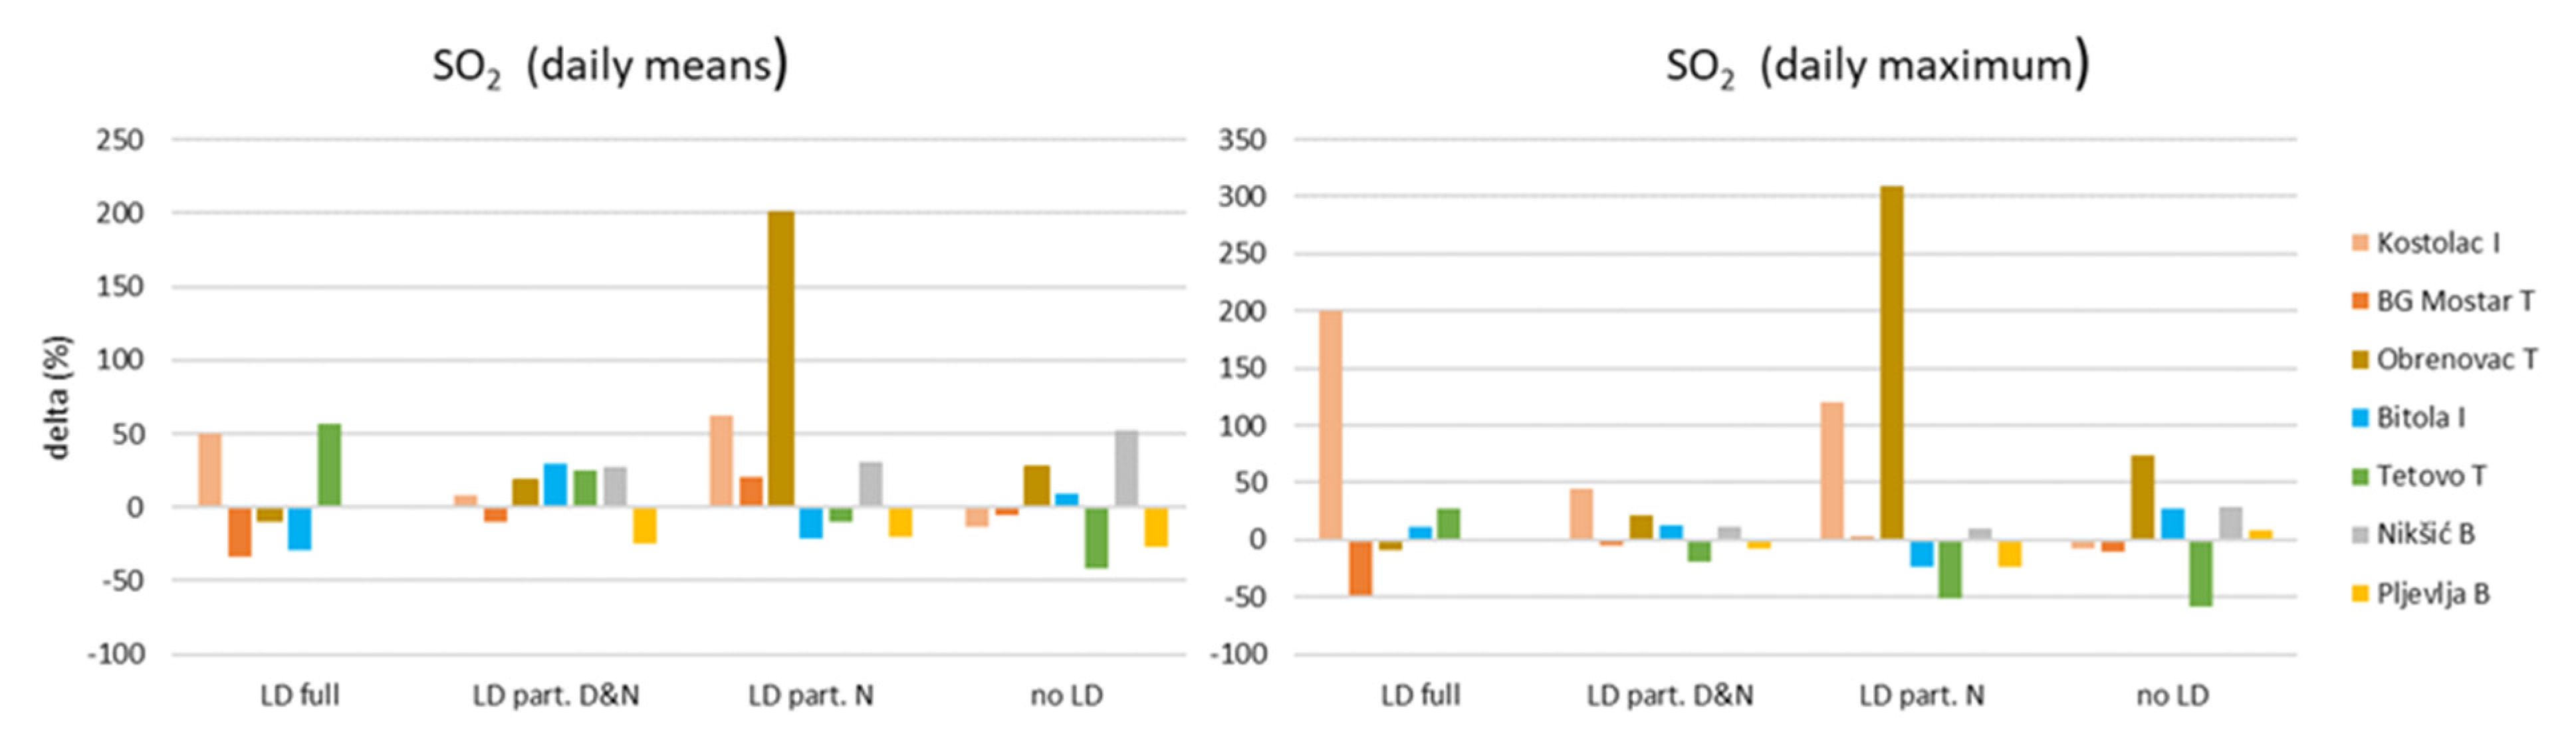
Also, SO2 daily average and maxima were analysed, with particular reference to industrial sites, to assess how LD affected the emissions of this pollutant in coal power plants (Bitola, Kostolac) by comparison with other sites (Figure 6).
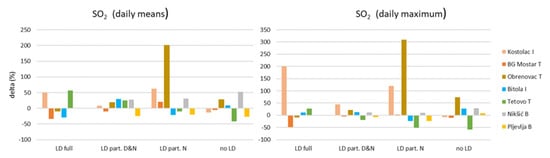
Figure 6.
Average differences between SO2 daily means (left) and daily maximum (right) in 2020 with different types of lockdown (LD) and the average of the corresponding days in the time series in traffic (T), background (B) and industrial (I) monitoring stations.
The behaviour changes significantly from site to site. Tetovo is the only traffic site where concentration deltas decrease gradually from full LD to no LD, while in BG Mostar there is a considerable reduction in concentrations compared to the time series only during the full LD, but not in the partial LDs. Nikšić background site shows an opposite behaviour, with higher values during the no-restriction days. However, the other background site (Pljevlja) does not show a clear relationship between the SO2 levels and LD. As for the industrial sites, Kostolac is the only one where delta concentrations are positive (increase) during LD and close to zero or slightly negative in the periods without restrictions.
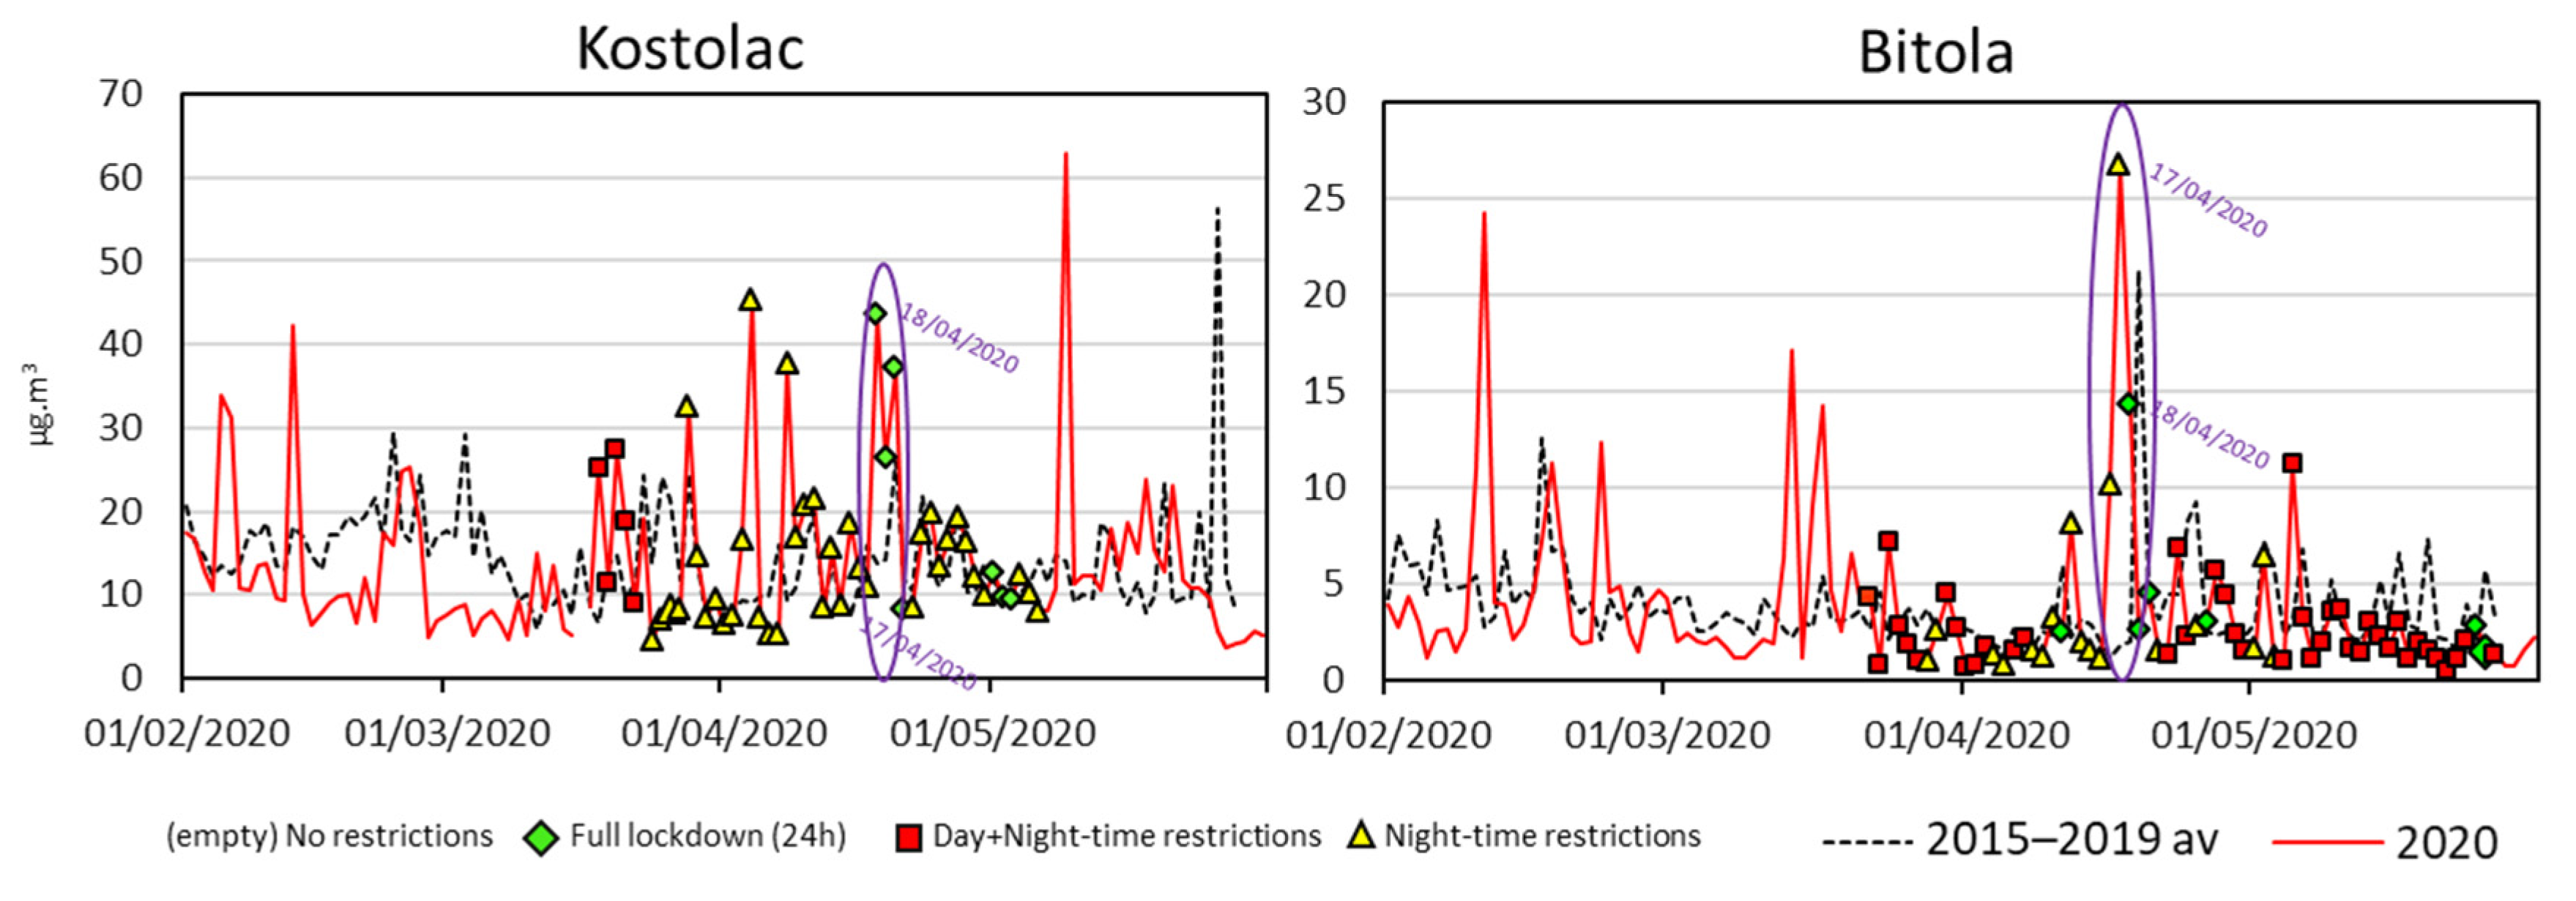
The interpretation of concentrations in industrial locations is different from the other sites. Unlike traffic and heating systems, industrial facilities are point sources, in which plumes are affected by wind speed and direction. As explained in Section 3.3, the decrease in SO2 concentrations in Bitola can be explained by the higher wind speed during the LD compared to the time series used as a reference, while this is not the case for Kostolac. Moreover, limiting the mobility of the population reduces the consumption of electricity in working places, but increases the one in households. For instance, it has been observed that SO2 levels were higher during Easter and in the preceding days (17–18 April 2020) in the industrial sites of Kostolac and Bitola (Figure 7).
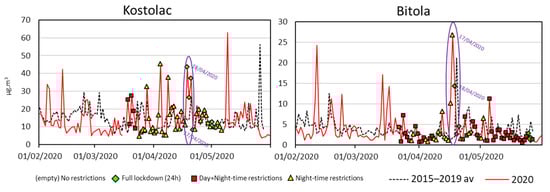
Figure 7.
SO2 daily means in the studied time window from March to May 2020 (red) compared with the average of the corresponding days in the time series (dashed line) in Kostolac and Bitola industrial monitoring stations. Days with different types of lockdown (LD) are indicated.
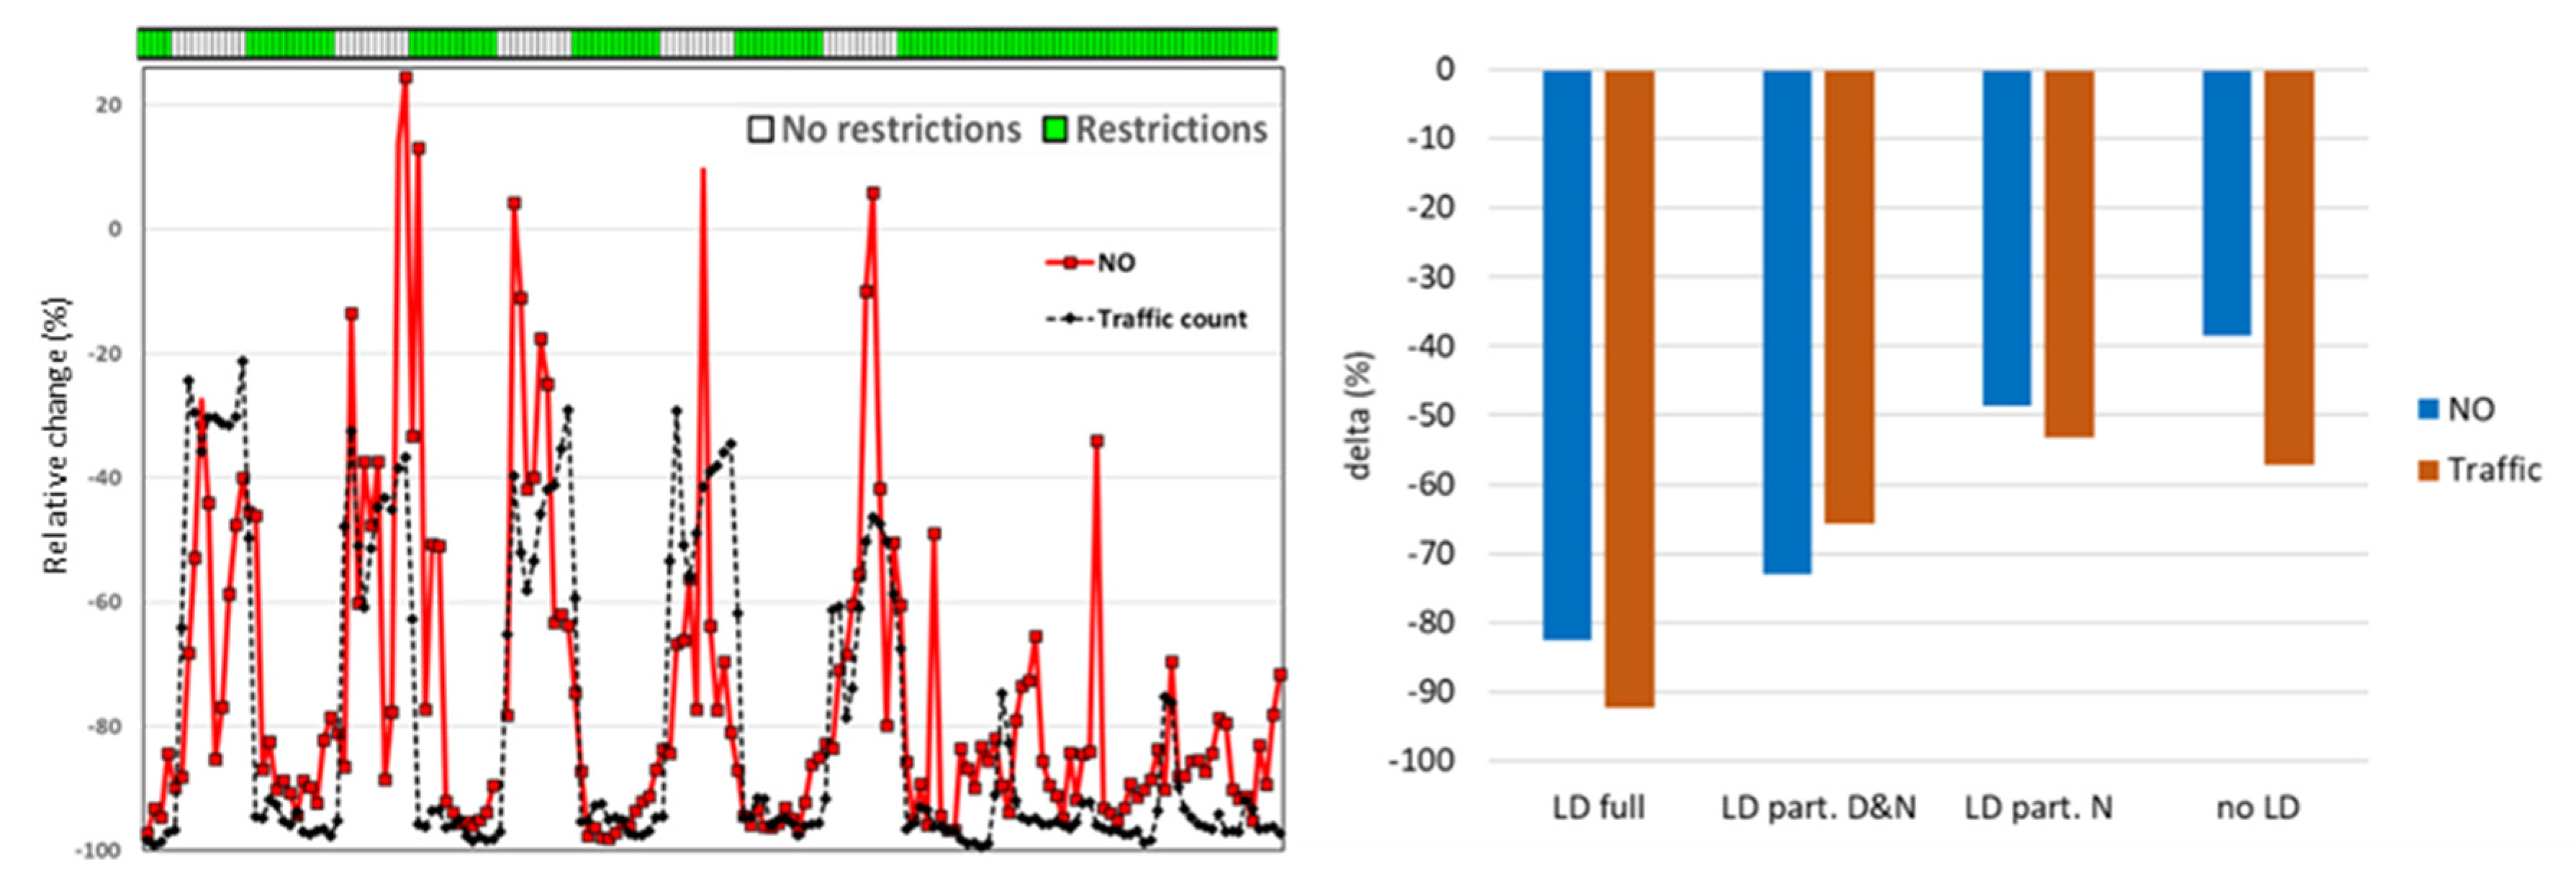
3.2. Comparison with Traffic Counts
It is well known that in urban areas the main source of NOx is road transport [35]. To investigate in more detail the relationship between road transport and NO emissions, the hourly concentrations of this pollutant in the traffic monitoring station of Rektorat are plotted next to the traffic fluxes during the week 16–22 March 2020, with partial and total LD (Figure 8 left). The perfect matching clearly suggests a causal relationship between the two variables. The same analysis was extended to the week 13–19 April 2020 and 18–24 May 2020 and compared with the corresponding weeks in 2017 and 2018 (Figure 8, right). The analysis with higher time resolution of a limited time window (three weeks) confirms the very close relationship between the traffic variations in the different LD sub-periods. Also the difference between full LD and partial night and day LD and no LD resulting from the analysis of daily averages is confirmed (Figure 2). However, the nocturne LD does not show a significant impact in this analysis, because the only hours without restrictions are precisely during the night, when the circulation is limited.

Figure 8.
Comparison of NO hourly concentrations in the Rektorat monitoring station (traffic) with the traffic fluxes during a week with partial and total LD (left). Average differences between NO hourly means and traffic counts in 2020 in selected weeks with different types of lockdown (LD) and the average of the corresponding week in previous years in the Rektorat monitoring station.
3.3. Analysis of Meteorological Variables
To support a proper interpretation of the differences in the levels of pollution between 2020 and time series, in this section the differences between average temperature (T) and wind speed (WS) are discussed in one urban location in Serbia (Belgrade–Mostar) and one in North Macedonia (Bitola).
Figure 9 shows that the meteorological situation in Belgrade in 2020 is comparable with the one of the time series during the full-LD and no-LD days (≤10% difference). During the partial LD periods, the average temperatures were either lower (LD part. D&N) or higher (LD part. N). By contrast, both temperature and wind speed are considerably higher during the full LD in 2020, compared to the time series in Bitola. This may have influenced the concentrations of pollutants during the LD in this location, due to lower thermal inversion and higher dispersion. In this case, the effect of LD could be overestimated, due to the impact of meteorological conditions. Similar to Belgrade, lower temperatures accompanied the partial LD (LD part. D&N) in Bitola. In this case, the effect of restrictions in reducing the emission of pollutants could have been compensated by higher thermal inversion and lower dispersion. In addition, lower temperatures are correlated with a higher use of heating systems.
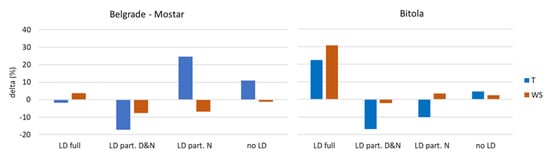
Figure 9.
Average differences between temperature (T) and wind speed (WS) means in 2020 with different types of lockdown (LD) and the average of the corresponding days in the time series in Belgrade–Mostar and Bitola.
3.4. Impacts on Health
The prevented premature deaths and the corresponding costs associated with the abatement of three pollutant concentrations (nitrogen dioxide, ozone and particulate matter) in background locations during the LD are discussed in this section. In Belgrade, a 10% reduction in NO2 concentrations over the period February–May 2020 compared to the same time window in the time series led to a reduction of 38 premature deaths, which is equivalent to a 15% reduction (Table 4). By contrast, no reduction compared to previous years was observed in the days with no restrictions to vehicle circulation in the same location and same time window, confirming the attribution of the reduction to the LD. This mortality reduction expressed on a yearly basis is equivalent to 113 premature deaths and corresponds to approximately one tenth of the deaths caused by COVID-19 in the city of Belgrade in the same year. The majority of the prevented premature deaths are due to the partial day and night measures, because they were applied for 38 days, while the full LD only took place during 7 days over the studied time window. On a yearly basis, the benefits due to the avoided premature deaths using the statistical value of life approach total more than EUR 200 million. In the other cities of this study, where NO2 measurements from background monitoring stations were used, the reduction in premature mortality over the period February–May was between 22% and 24%; however, such changes were not significantly different from those observed in the days with no restrictions. In Skopje, the background monitoring station of Karpos was not included in this analysis. However, this station presented a behaviour similar to Belgrade Vrakar in the time series 2015–2019 and in 2020. Therefore, it is reasonable to assume a similar relative mortality reduction in this location.
Table 4.
Change in premature mortality (# deaths) during the studied period (February–May 2020) in background sites compared with the same period in the time series (2015–2019). Variations are provided for the entire period and for days with no circulation restriction.
The analysis of the differences in mortality between the period February–May of 2020 and the time series associated with ozone and particulate matter in background locations used in the present study does not provide evidence of significant difference between LD days and days without restrictions.
4. Discussion
In the present study, we compare the 2020 concentrations at different levels of LD stringency and different types of monitoring stations with the time series of concentrations in the corresponding days in previous years. The comparison of LD concentrations with a reference period has been used in more than a hundred studies in locations all over the world [4,6]. In our study, the limited length of the existing time series (3–5 years) may have affected the representativeness of the period used as a reference. To evaluate possible biases in the analysis of pollutants’ time series, the variation in meteorological parameters for the same periods was also accomplished. Moreover, the comparison with the variation in traffic counts, which is the main source for NO/NO2, has confirmed the direct relationship between this activity sector and the corresponding change in concentrations.
The average concentration reductions observed in the present work for NO (−33% to −74%) and NO2 (−22% to −65%) during the COVID-19 LD (including full-day and partial restrictions) are comparable to those reported in regions where the response is medium to high. At a regional/continental level, NO2 reductions during the LD, without considering the stringency of the measures, range between −20% and −54%, while in Europe the median NO2 observed concentration reduction was −34% (−24% to −43%), based on 23 studies [6]. In European urban background sites, NO2 concentrations were 32% lower than expected during LD [36]. It was estimated that when circulation was restricted in France’s main cities, NO2 concentrations were 50% lower than expected, according to forecasted emissions without considering the COVID-19 restrictions [37]. In Northern Italy, where the restrictions were the most stringent during the studied period [38], NO2 concentrations decreased by 30% to 50% at the urban and regional background sites, respectively, compared to forecasted model concentrations without the COVID-19 measures [39]. Up to 54% reductions are reported in São Paulo compared to the previous five-year means [9]. In the Yangtze River Delta region (China), NO2 concentrations decreased by 45% during the first lockdown phase compared with the 2017–2019 average for the same period [10]. In Italy and UK, NOx (the sum of NO and NO2) decreased by 59% (−42% to −72%) during 2020 LD, while in Paris it decreased by 42% compared to days with analogue meteorological conditions between 2012 and 2019 [6,12]. A NO abatement of up to 77% was observed in São Paulo during the LD [9].
The reduction in NO2 concentrations during the LD led to a drop in premature mortality associated with air pollution in Belgrade, equivalent to 3.13 deaths per 100,000 inhabitants. Such a rate is comparable to the one reported for reductions in the same pollutant during the lockdowns in Central and Southern Italy (4.66) and higher than those observed in Jiangsu, China; California, U.S; and Germany—full country (1.41, 0.44, and 0.11, respectively) [27].
Similar to the present study, the response of O3 to LD around the world varies considerably among locations, because of their different chemical regimes. The median of O3 concentrations increased by 6.4% (−11% to +11%) at the regional/continental scale during the LD, while in Europe a median O3 increase of 2% (−1% to +15%) was reported in multiple countries [6]. A significant association between O3 concentrations and COVID-19 LD is reported in European urban background sites, with levels 21% higher than expected [36], while in São Paulo O3 increased by approximately 30% compared to the previous 5-year means [9].
In our study, significant reductions in PM2.5 and PM10 (range −10% to −40%) are observed only during full-LD periods. At the continental/regional level, PM2.5 median reductions range from −10% to −40%, while in Europe reductions were, on average, −10% (−5% to −17%), without reference to the measures’ stringency. In the Yangtze River Delta region (China), Li et al. [10] showed that concentrations of PM2.5 decreased by 32%. When it comes to PM10, median reductions in continents ranged from −8% to −40%, while in Europe a decrease of 23% (−11% to −37%) was observed, based on measurements in a few countries [6]. In Northern Italy, PM10 concentrations were not significantly affected by the LD measures [39]. The combustion of solid fuels (e.g., wood, coal) has higher emission factors for PM2.5 compared to liquid or gaseous fuels [40]. Due to the low costs of solid fuels compared with other types of fuels, their use for domestic heating is very common in the WB, and represents an important source of PM2.5 [41]. Consequently, LD measures had only a partial effect on the emissions of this pollutant.
In the present study, the response of SO2 daily mean and maximum concentrations to LD is quite variable in both industrial and traffic sites. It is difficult to compare our results with other studies, because the literature about this pollutant is scarce. The median reduction in SO2 at the regional/continental level ranged from −5% to −49%, while in Europe, the SO2 median concentration in studies representing a limited number of countries decreased by 5% (−10% to +10%), although there is a considerable variability among sites [6]. In China, a study on 44 cities reported an overall SO2 decrease of 6.76% during the LD [42].
5. Conclusions
The methodology adopted in this study has shown to be appropriate for identifying the effects of COVID-19 lockdown on the variation of pollutant concentrations in urban areas for many atmospheric pollutants. The classification of the LD periods according to their level of stringency and the comparison of daily concentrations and meteorological variables with those of the same day in the time series (corrected by the day of the week) of three to five previous years made it possible to control the effect of inter-annual variations.
Nitrogen oxides, and to a lesser extent ozone, showed a clear response to population circulation restrictions due to lockdown during the first phase of the COVID-19 pandemics (March–May 2020) in the urban areas of the WB. The reduction in NO concentrations is well correlated with traffic fluxes, considering that road transport is the main emission source of NO in urban areas. It can be concluded that there is a clear cause–effect association between the COVID-19 lockdowns and the reduction in nitrogen oxides and, consequently, with the increase in the levels of ozone in the studied urban areas. Our conclusions are in line with the results observed in many densely populated regions of the world where reductions in NO2 and NOx concentrations have been associated with a reduction in transportation and industrial activities during LD.
Unlike nitrogen oxides, a reduction in fine particulate matter (PM2.5 and PM10) concentrations has been observed in all the sites only during the full-LD periods, while this is not the case for partial LD. Such a result has been associated with the predominant role of pollution sources different from road transport that were active during the lockdown, like domestic heating (a dominant source of this pollutant in the region), as reported in the Po Valley [39].
Also, the connection between SO2 concentrations and LD periods is not straightforward, due to the influence of several factors. Firstly, SO2 is mainly emitted by coal power plants, which are point sources, and their plumes are affected by meteorological factors, first of all wind speed and direction. Secondly, the lockdown measures did not necessarily reduce the overall consumption of electricity, since the reduction in activity in working places was, at least in part, compensated by higher consumptions in households.
The reduction in NO2 concentrations during the LD resulted in a reduction in premature mortality associated with air pollution in the largest cities, which partially offsets the death toll of COVID-19. By comparison, there are no evident changes in O3 and particulate matter compared with the time series 2015–2019.
COVID-19 LD is a source of real-world experimental quantitative evidence about the behaviour of air pollutants and the impact of pollution sources, which are specific for every site. The COVID-19 LD provided a unique opportunity to quantify in the field the relationship between mobility and air pollution. This analysis confirmed, at the same time, the complexity of the atmospheric processes connected to air pollution, which may lead to a clear decrease in some pollutants (NO, NO2), variable responses of some of them due to the influence of external factors (PM2.5, PM10 and SO2), and, actually, to the increase in others (O3). Such results highlight the contribution that scientific assessments can provide in supporting the design of abatement measures to ensure a full understanding of atmospheric processes and their potential implications, which are specific for every location.
Supplementary Materials
The following supporting information can be downloaded at: https://www.mdpi.com/article/10.3390/atmos16010090/s1, Figure S1: NO2 daily concentrations in 2020 compared with time series; Figure S2: PM2.5 daily concentrations in 2020 compared with time series; Figure S3: O3 daily concentrations in 2020 compared with time series; Figure S4: SO2 daily concentrations in 2020 compared with time series in file AQ COVID WB SUPPL MATERIAL.doc; dataset in file: AQ COVID WB dataset.xlsx.
Author Contributions
Conceptualization, methodology, formal analysis, validation, and writing the original draft, C.A.B. and D.D.; data curation, review and editing of the manuscript M.T., J.K., G.D., A.S., N.G. and B.J.; visualization, review and editing of the manuscript A.G. All authors have read and agreed to the published version of the manuscript.
Funding
This research received no external funding.
Institutional Review Board Statement
Not applicable.
Informed Consent Statement
Not applicable.
Data Availability Statement
The dataset is provided in the Supplementary Material.
Conflicts of Interest
Author Andreas Gavros was employed by the company Fincons SpA. The remaining authors declare that the research was conducted in the absence of any commercial or financial relationships that could be construed as a potential conflict of interest.
References
- Vardari, L. The effects of COVID-19 pandemic on Western Balkan financial markets. In Data Science for COVID-19; Kose, U., Gupta, D., Hugo, C.V.d.A., Khanna, A., Eds.; Academic Press: Cambridge, MA, USA, 2022; pp. 449–464. [Google Scholar] [CrossRef]
- Nicolini, G.; Antoniella, G.; Carotenuto, F.; Christen, A.; Ciais, P.; Feigenwinter, C.; Gioli, B.; Stagakis, S.; Velasco, E.; Vogt, R.; et al. Direct observations of CO2 emission reductions due to COVID-19 lockdown across European urban districts. Sci. Total Environ. 2022, 830, 154662. [Google Scholar] [CrossRef] [PubMed]
- Zambrano-Monserrate, M.A.; Ruano, M.A.; Sanchez-Alcalde, L. Indirect Effects of COVID-19 on the Environment. Sci. Total Environ. 2020, 728, 138813. [Google Scholar] [CrossRef] [PubMed]
- Kumar, S. Insights on Air Pollution During COVID-19: A Review. Aerosol Sci. Eng. 2023, 7, 192–206. [Google Scholar] [CrossRef]
- Roh, T.; Moreno-Rangel, A.; Baek, J.; Obeng, A.; Hasan, N.T.; Carrillo, G. Indoor Air Quality and Health Outcomes in Employees Working from Home during the COVID-19 Pandemic: A Pilot Study. Atmosphere 2021, 12, 1665. [Google Scholar] [CrossRef]
- Gkatzelis, G.I.; Gilman, J.B.; Brown, S.S.; Eskes, H.; Gomes, A.R.; Lange, A.C.; McDonald, B.C.; Peischl, J.; Petzold, A.; Thompson, C.R.; et al. The global impacts of COVID-19 lockdowns on urban air pollution. Elementa Sci. Anthr. 2021, 9, 00176. [Google Scholar] [CrossRef]
- Rahman, M.; Meng, L. Examining the Spatial and Temporal Variation of PM2.5 and Its Linkage with Meteorological Conditions in Dhaka, Bangladesh. Atmosphere 2024, 15, 1426. [Google Scholar] [CrossRef]
- Holland, R.; Seifert, K.; Saboya, E.; Khan, M.A.H.; Derwent, R.G.; Shallcross, D.E. Elucidating the Effects of COVID-19 Lockdowns in the UK on the O3-NOx-VOC Relationship. Atmosphere 2024, 15, 607. [Google Scholar] [CrossRef]
- Nakada, L.Y.K.; Urban, R.C. COVID-19 pandemic: Impacts on the air quality during the partial lockdown in São Paulo state, Brazil. Sci. Total Environ. 2020, 730, 139087. [Google Scholar] [CrossRef]
- Li, L.; Li, Q.; Huang, L.; Wang, Q.; Zhu, A.; Xu, J.; Liu, Z.; Li, H.; Shi, L.; Li, R.; et al. Air quality changes during the COVID-19 lockdown over the Yangtze River Delta Region: An insight into the impact of human activity pattern changes on air pollution variation. Sci. Total Environ. 2020, 732, 139282. [Google Scholar] [CrossRef]
- Giardi, F.; Nava, S.; Calzolai, G.; Pazzi, G.; Chiari, M.; Faggi, A.; Andreini, B.P.; Collaveri, C.; Franchi, E.; Nincheri, G.; et al. PM 10 variation, composition, and source analysis in Tuscany (Italy) following the COVID-19 lockdown restrictions. Atmos. Chem. Phys. 2022, 22, 9987–10005. [Google Scholar] [CrossRef]
- Petit, J.-E.; Dupont, J.-C.; Favez, O.; Gros, V.; Zhang, Y.; Sciare, J.; Simon, L.; Truong, F.; Bonnaire, N.; Amodeo, T.; et al. Response of atmospheric composition to COVID-19 lockdown measures during Spring in the Paris region (France). Atmos. Chem. Phys. 2021, 21, 17167–17183. [Google Scholar] [CrossRef]
- Soares, A.R.; Silva, C.M. What Can the COVID-19 Pandemic Tell Us About the Energy Transition? A Nitrogen Dioxide and Ground-Level Ozone Study. Atmosphere 2024, 15, 1453. [Google Scholar] [CrossRef]
- Samad, A.; Arango, K.; Chourdakis, I.; Vogt, U. Contribution of Airplane Engine Emissions on the Local Air Quality around Stuttgart Airport during and after COVID-19 Lockdown Measures. Atmosphere 2022, 13, 2062. [Google Scholar] [CrossRef]
- Eleftheriadis, K.; Gini, M.I.; Diapouli, E.; Vratolis, S.; Vasilatou, V.; Fetfatzis, P.; Manousakas, M.I. Aerosol microphysics and chemistry reveal the COVID19 lockdown impact on urban air quality. Sci. Rep. 2021, 11, 14477. [Google Scholar] [CrossRef]
- Evangeliou, N.; Platt, S.M.; Eckhardt, S.; Myhre, C.L.; Laj, P.; Alados-Arboledas, L.; Backman, J.; Brem, B.T.; Fiebig, M.; Flentje, H.; et al. Changes in black carbon emissions over Europe due to COVID-19 lockdowns. Atmos. Chem. Phys. 2021, 21, 2675–2692. [Google Scholar] [CrossRef]
- Belis, C.; DJatkov, D.; Dobricic, S.; De Meij, A.; Kolarević, S.; Arias Navarro, C.; Wojda, P.; Jones, A.; Lamy, M.-C.; Porcel Rodriguez, E.; et al. Status of Environment and Climate in the Western Balkans; Publications Office of the European Union: Luxembourg, 2024; Available online: https://data.europa.eu/doi/10.2760/1865356 (accessed on 19 December 2024).
- EMEP Centre on Emission Inventories and Projections. WebDab Reported Emission Data. Available online: https://www.ceip.at/webdab-emission-database/reported-emissiondata (accessed on 19 December 2024).
- EEA, European Environmental Agency. Europe’s Air Quality Status 2024. Available online: https://www.eea.europa.eu/publications/europes-air-quality-status-2024 (accessed on 19 December 2024).
- Belis, C.A.; Pisoni, E.; Degraeuwe, B.; Peduzzi, E.; Thunis, P.; Monforti-Ferrario, F.; Guizzardi, D. Urban pollution in the Danube and Western Balkans regions: The impact of major PM2.5 sources. Environ. Int. 2019, 133, 105158. [Google Scholar] [CrossRef]
- Kusugak, M.; Miljevic, D.; Rajakovic, N. Chaotic and Fake Decarbonization of Power Sectors in the Western Balkans (Evaluation of International Policies). Center for Sustainable Energy Transition (RESET). 2023. Available online: https://reset.ba/images/2023/11_novembar/Chaotic%20and%20fake%20decarbonization%20on%20WB%20RESET%20web.pdf (accessed on 19 December 2024).
- Denby, B.R.; Klimont, Z.; Nyiri, A.; Kiesewetter, G.; Heyes, C.; Fagerli, H. Future scenarios for air quality in Europe, the Western Balkans and EECCA countries: An assessment for the Gothenburg protocol review. Atmos. Environ. 2024, 333, 120602. [Google Scholar] [CrossRef]
- Nesterovic, A.; Djatkov, D.; Viskovic, M.; Martinov, M.; Adamovic, D. Air pollutants emissions from biomass combustion in the City of Novi Sad, Serbia. Biomass Convers. Biorefinery 2021, 13, 10935–10946. [Google Scholar] [CrossRef]
- Banja, M.; Đukanović, G.; Belis, C.A. Status of Air Pollutants and Greenhouse Gases in the Western Balkans: Benchmarking the Accession Process Progress on Environment; EUR 30113 EN; Publications Office of the European Union: Luxembourg, 2020; ISBN 978-92-76-16860-7. [Google Scholar] [CrossRef]
- European Commission: Joint Research Centre; Belis, C.; Djatkov, D.; Lettieri, T.; Jones, A.; Wojda, P.; Banja, M.; Muntean, M.; Paunović, M.; Niegowska, M.; et al. Status of Environment and Climate in the Western Balkans—Benchmarking the Accession Process Progress on Environment; Publications Office of the European Union: Luxembourg, 2022; Available online: https://data.europa.eu/doi/10.2760/294516 (accessed on 19 December 2024).
- European Environmental Agency (EEA). Premature Deaths Due to Exposure to Fine Particulate Matter PM2.5 (2005-2021), EU SDG 11_52. Available online: https://sdi.eea.europa.eu/catalogue/srv/eng/catalog.search#/metadata/9159207e-7ef2-4c93-b531-f73a213f3e17 (accessed on 19 December 2024).
- Ma, Y.; Nobile, F.; Marb, A.; Dubrow, R.; Kinney, P.L.; Peters, A.; Stafoggia, M.; Breitner, S.; Chen, K. Air pollution changes due to COVID-19 lockdowns and attributable mortality changes in four countries. Environ. Int. 2024, 187, 108668. [Google Scholar] [CrossRef]
- Son, J.-Y.; Fong, K.C.; Heo, S.; Kim, H.; Lim, C.C.; Bell, M.L. Reductions in mortality resulting from reduced air pollution levels due to COVID-19 mitigation measures. Sci. Total Environ. 2020, 744, 141012. [Google Scholar] [CrossRef]
- Murray, C.J.; Ezzati, M.; Lopez, A.D.; Rodgers, A.; Vander Hoorn, S. Comparative quantification of health risks: Conceptual framework and methodological issues. Popul. Health Metr. 2003, 1, 1. [Google Scholar] [CrossRef] [PubMed]
- Huangfu, P.; Atkinson, R. Long-term exposure to NO2 and O3 and all-cause and respiratory mortality: A systematic review and meta-analysis. Environ. Int. 2020, 144, 105998. [Google Scholar] [CrossRef] [PubMed]
- Chen, J.; Hoek, G. Long-term exposure to PM and all-cause and cause-specific mortality: A systematic review and meta-analysis. Environ. Int. 2020, 143, 105974. [Google Scholar] [CrossRef] [PubMed]
- Melchiorri, M.; Mari Rivero, I.; Florio, P.; Schiavina, M.; Krasnodebska, K.; Politis, P.; Uhl, J.; Pesaresi, M.; Maffenini, L.; Sulis, P.; et al. Stats in the City—The GHSL Urban Centre Database 2025—Public Release GHS-UCDB R2024 ed; Publications Office of the European Union: Luxembourg, 2024. [Google Scholar]
- WHO. 2024. Available online: https://www.who.int/data/data-collection-tools/who-mortality-database (accessed on 19 December 2024).
- Belis, C.A.; Matkovic, V.; Ballocci, M.; Jevtic, M.; Millo, G.; Mata, E.; Van Dingenen, R. Assessment of health impacts and costs attributable to air pollution in urban areas using two different approaches. A case study in the Western Balkans. Environ. Int. 2023, 182, 108347. [Google Scholar] [CrossRef]
- Crippa et al. Global Air Pollutants Emissions EDGAR V 8.1. 2024. Available online: https://edgar.jrc.ec.europa.eu/dataset_ap81 (accessed on 19 December 2024).
- Grange, S.K.; Lee, J.D.; Drysdale, W.S.; Lewis, A.C.; Hueglin, C.; Emmenegger, L.; Carslaw, D.C. COVID-19 lockdowns highlight a risk of increasing ozone pollution in European urban areas. Atmos. Chem. Phys. 2021, 21, 4169–4185. [Google Scholar] [CrossRef]
- INERIS (Institut National de l’Environnement Industriel et des Risques). The Lockdown and Air Quality: Nitrogen Dioxide Pollution Falls in France’s Largest Cities. Available online: https://www.ineris.fr/en/ineris/news/lockdown-and-air-quality-nitrogen-dioxide-pollution-falls-france-largest-cities (accessed on 26 July 2024).
- Stringency Index. Our World in Data. 2022. Available online: https://ourworldindata.org/grapher/covid-stringency-index (accessed on 19 December 2024).
- Putaud, J.-P.; Pozzoli, L.; Pisoni, E.; Dos Santos, S.M.; Lagler, F.; Lanzani, G.; Santo, U.D.; Colette, A. Impacts of the COVID-19 lockdown on air pollution at regional and urban background sites in northern Italy. Atmos. Chem. Phys. 2021, 21, 7597–7609. [Google Scholar] [CrossRef]
- Shen, H.; Luo, Z.; Xiong, R.; Liu, X.; Zhang, L.; Li, Y.; Du, W.; Chen, Y.; Cheng, H.; Shen, G.; et al. A critical review of pollutant emission factors from fuel combustion in home stoves. Environ. Int. 2021, 157, 106841. [Google Scholar] [CrossRef]
- Almeida, S.; Manousakas, M.; Diapouli, E.; Kertesz, Z.; Samek, L.; Hristova, E.; Šega, K.; Alvarez, R.P.; Belis, C.; Eleftheriadis, K. Ambient particulate matter source apportionment using receptor modelling in European and Central Asia urban areas. Environ. Pollut. 2020, 266, 115199. [Google Scholar] [CrossRef]
- Bao, R.; Zhang, A. Does lockdown reduce air pollution? Evidence from 44 cities in northern China. Sci. Total Environ. 2020, 731, 139052. [Google Scholar] [CrossRef]


Disclaimer/Publisher’s Note: The statements, opinions and data contained in all publications are solely those of the individual author(s) and contributor(s) and not of MDPI and/or the editor(s). MDPI and/or the editor(s) disclaim responsibility for any injury to people or property resulting from any ideas, methods, instructions or products referred to in the content. |
© 2025 by the authors. Licensee MDPI, Basel, Switzerland. This article is an open access article distributed under the terms and conditions of the Creative Commons Attribution (CC BY) license (https://creativecommons.org/licenses/by/4.0/).