
Spatial Analysis of Carbon Metabolism in Different Economic Divisions Based on Land Use and Cover Change (LUCC) in China


Abstract
:1. Introduction
2. Literature Review
3. Methods
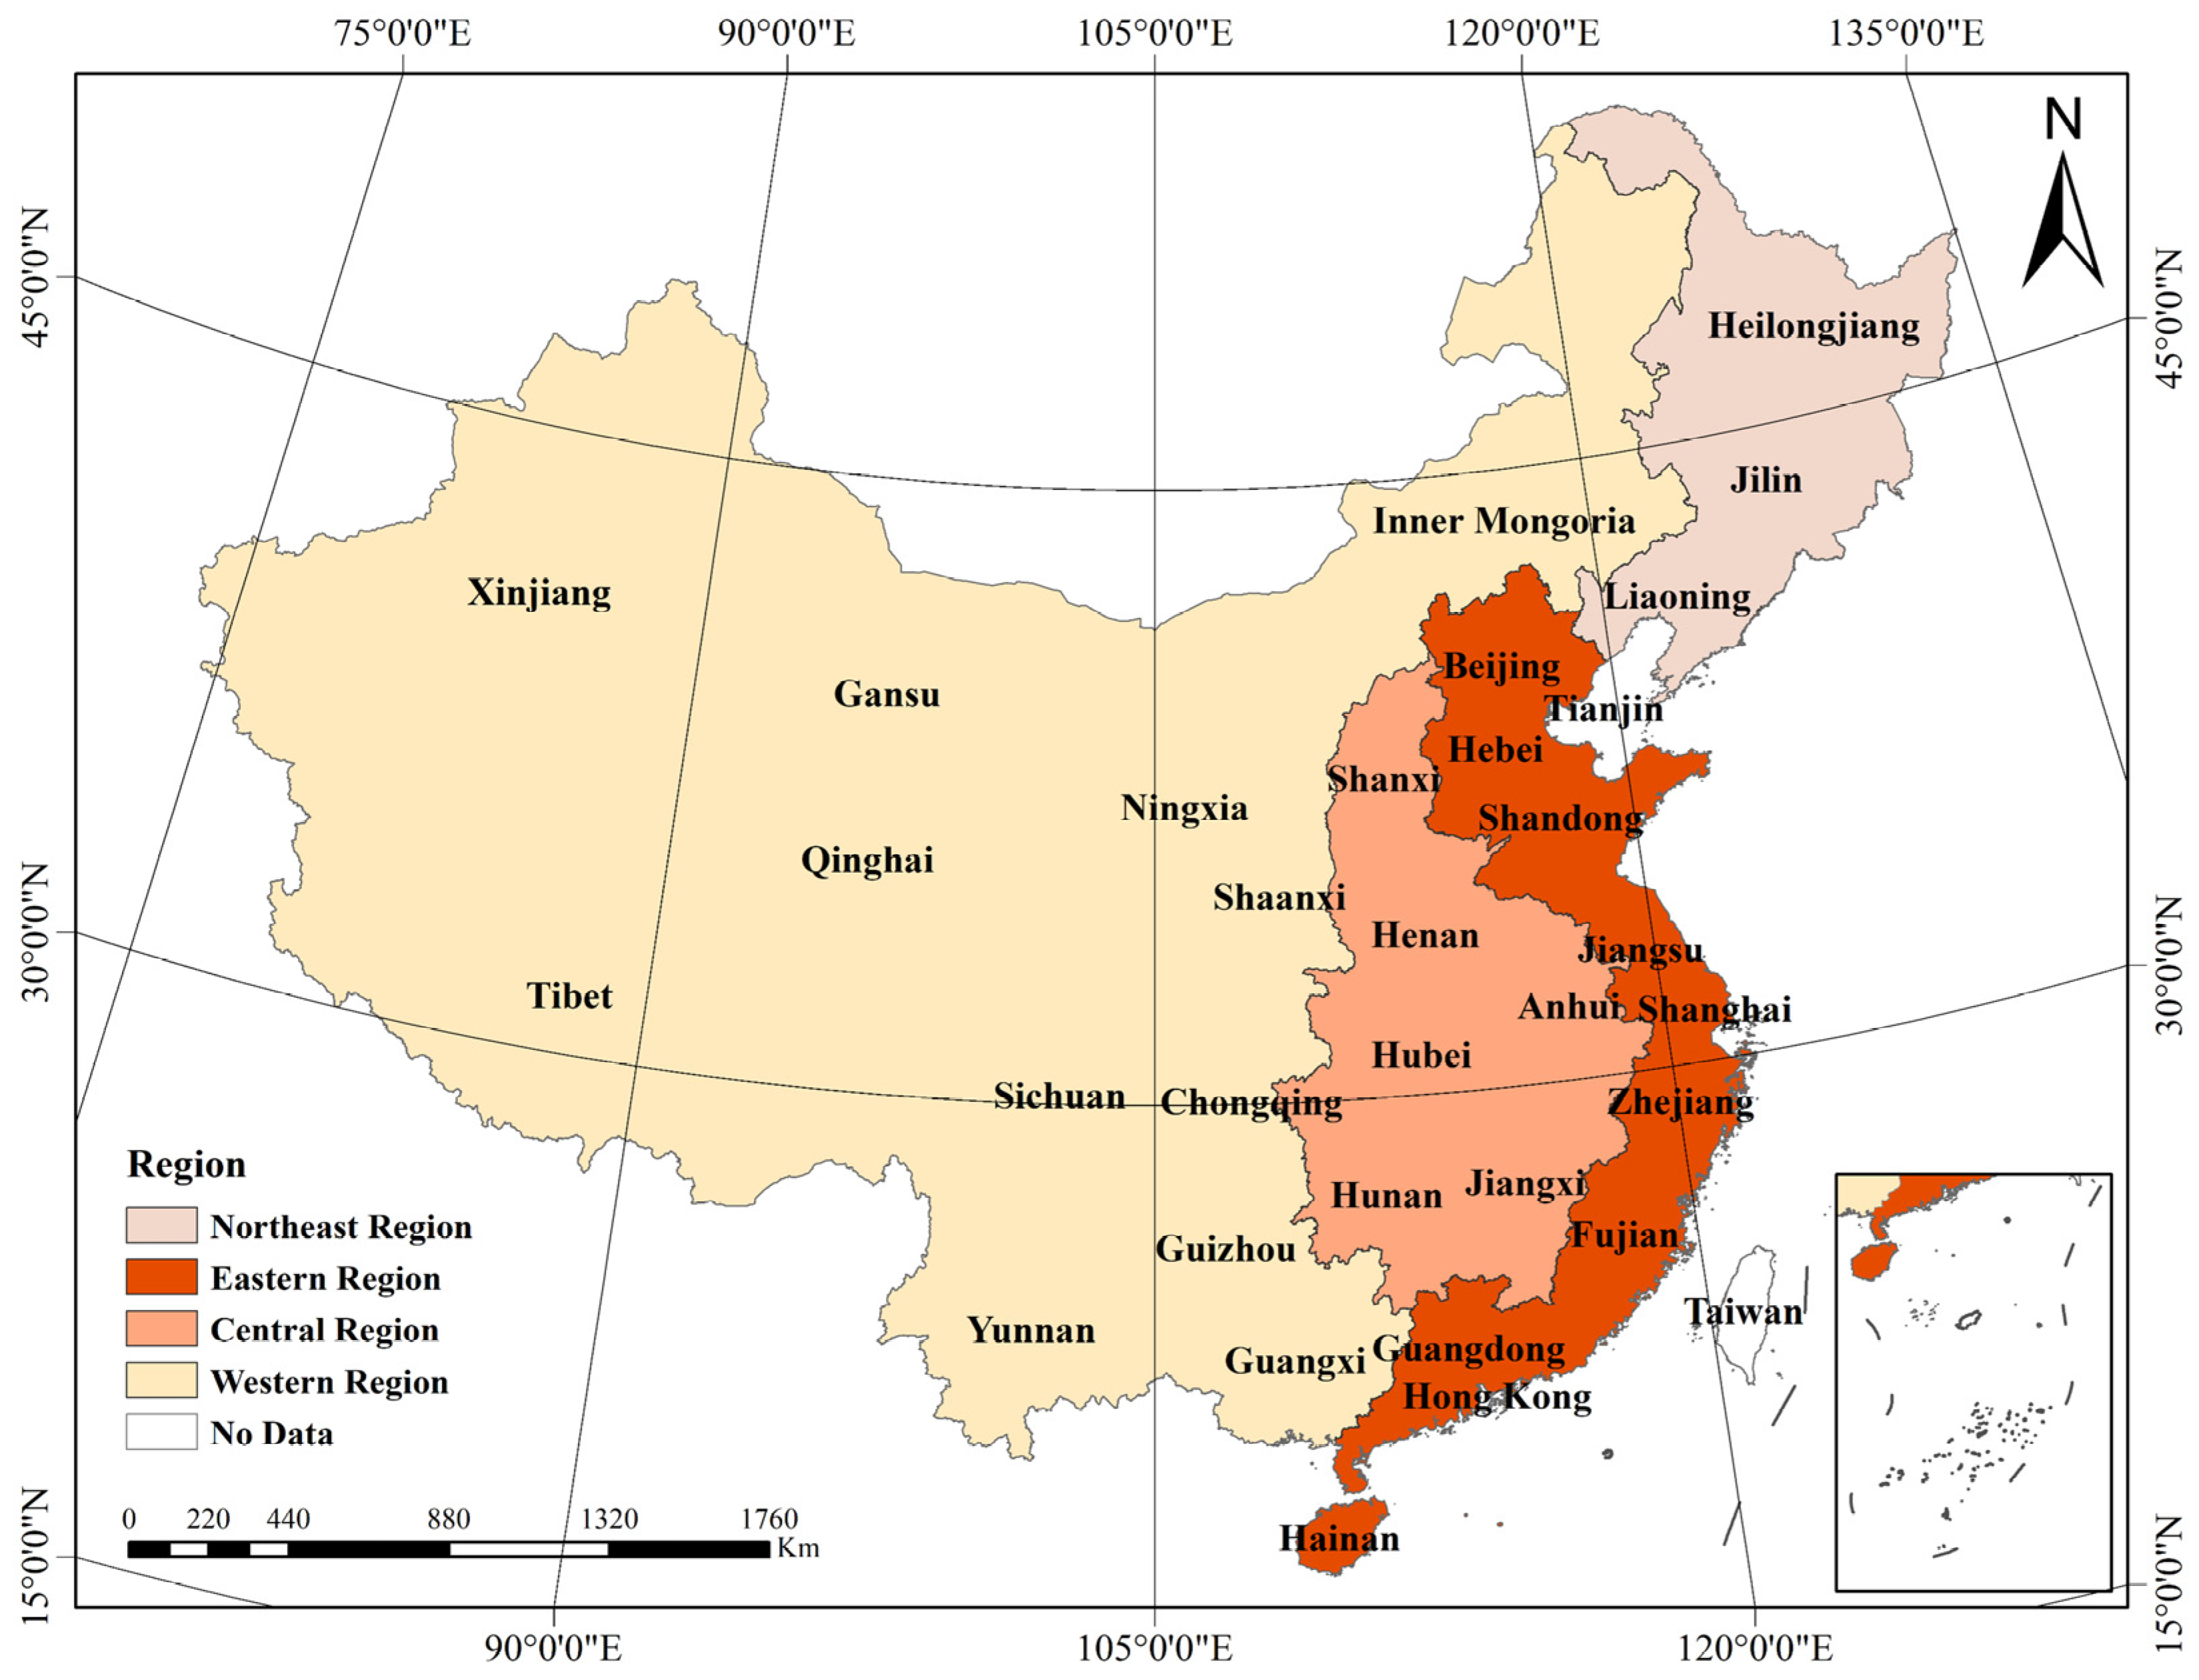
3.1. Research Area
3.2. Data Sources
4. Accounting Methods and Model Construction
4.1. Calculation of Carbon Sources and Sinks
4.2. Carbon Flow Accounting
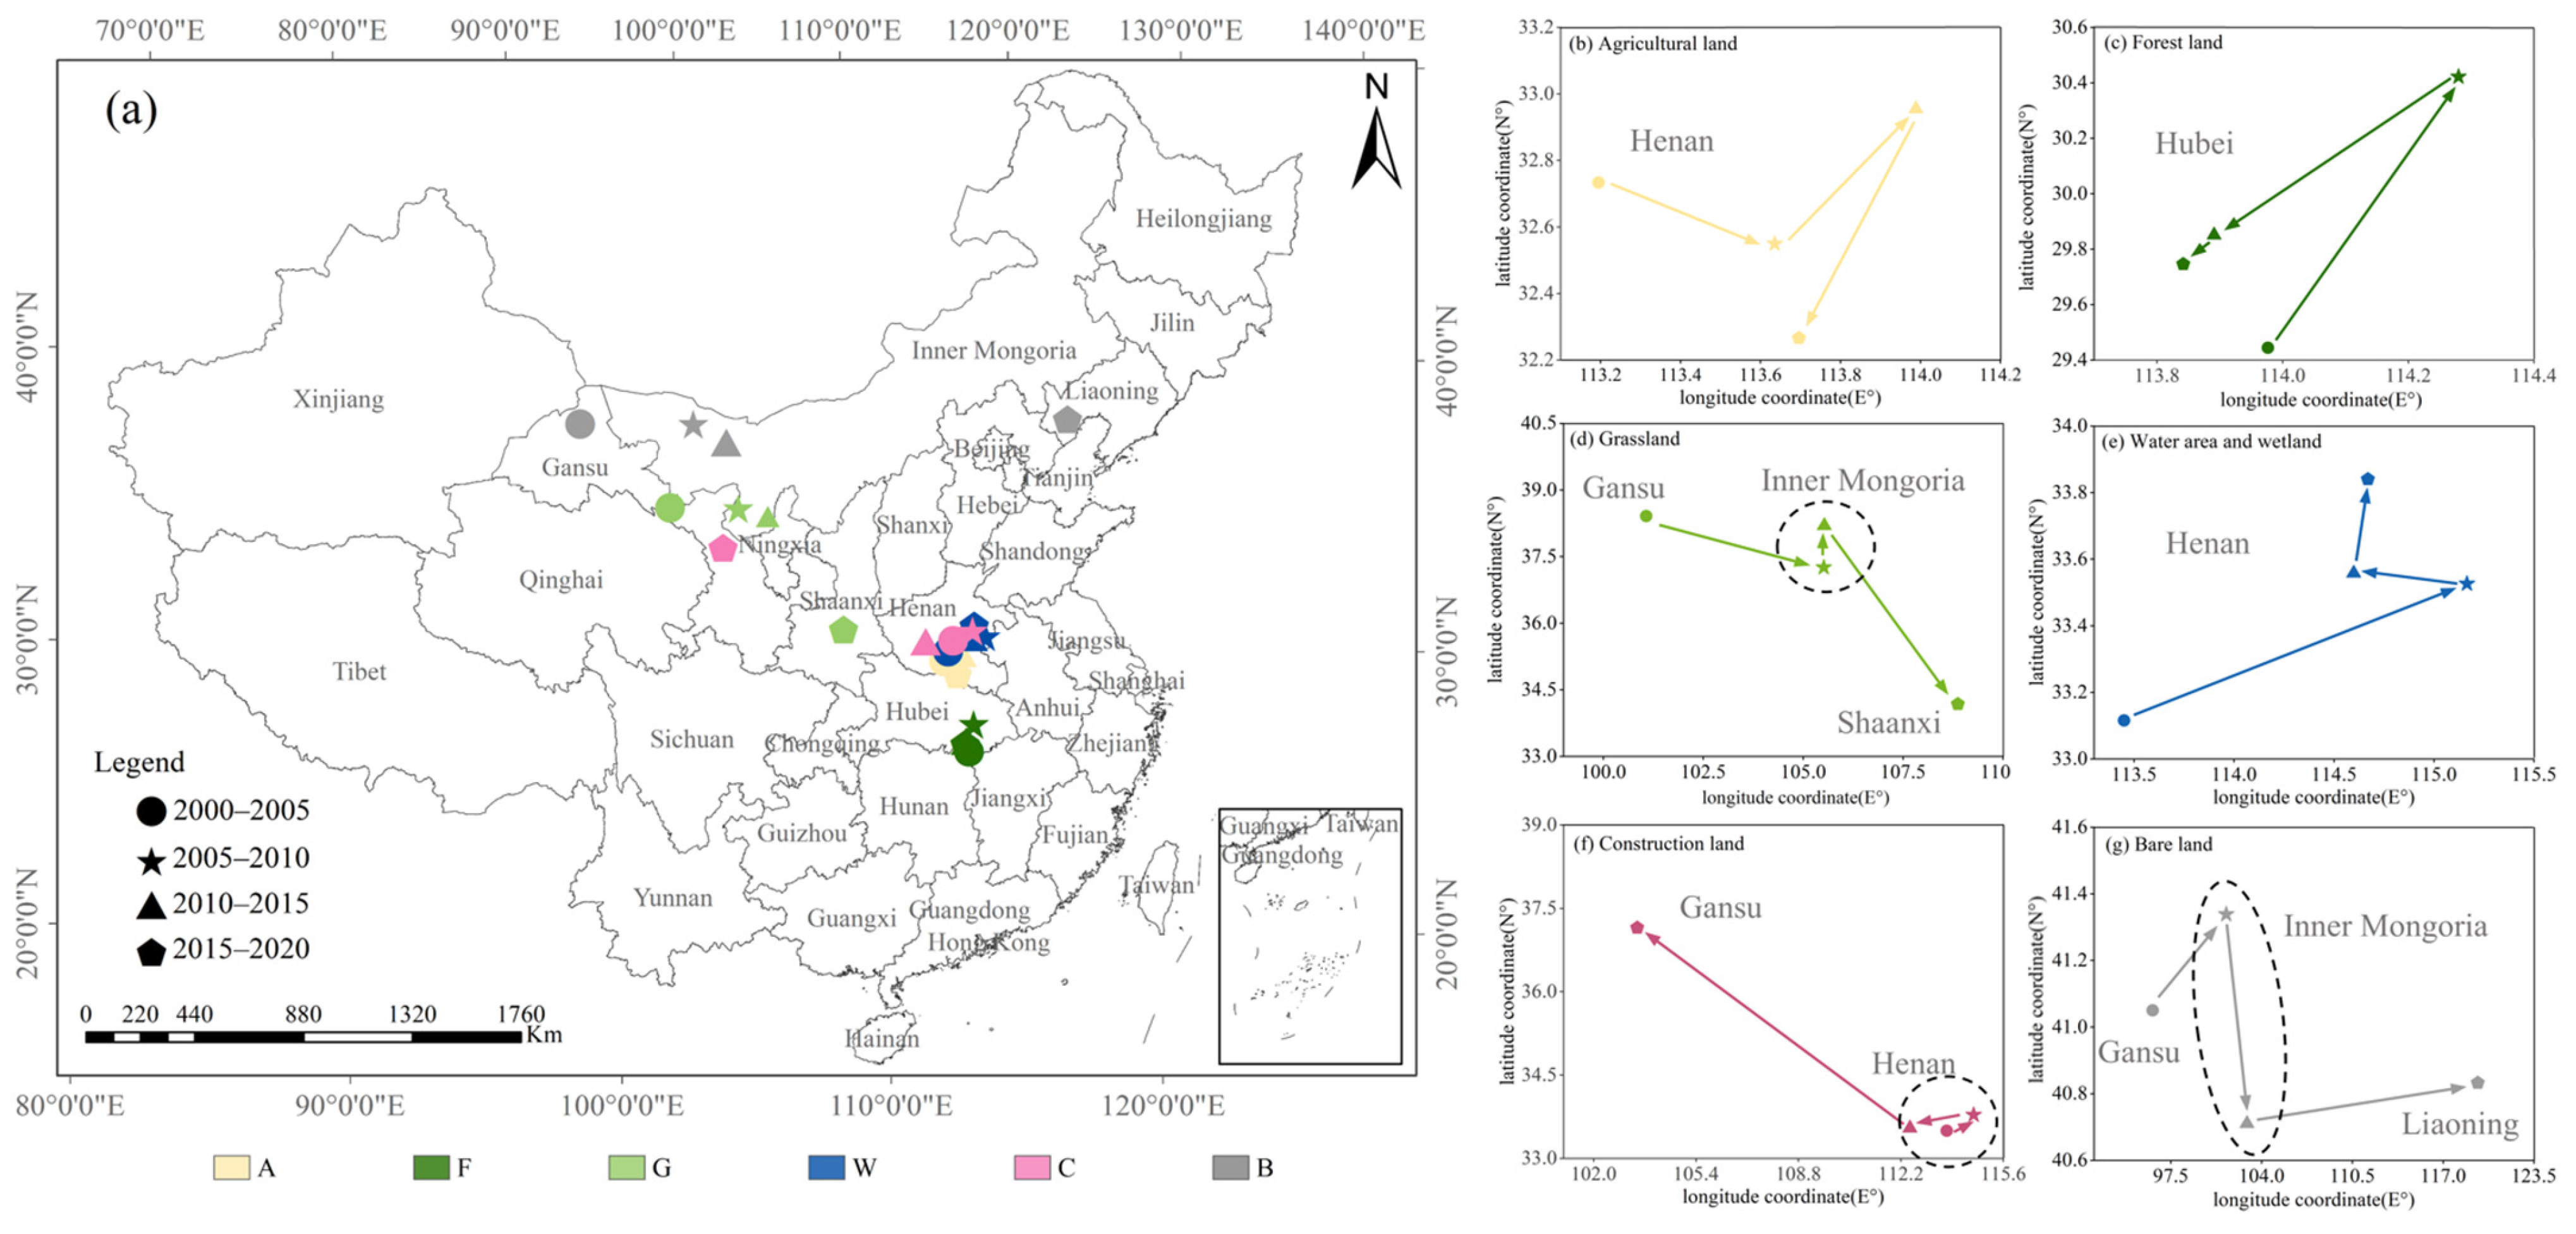
4.3. Gravity Center Changes with Carbon Flows
4.4. ENA Method and Ecological Relationship Judgment
5. Results
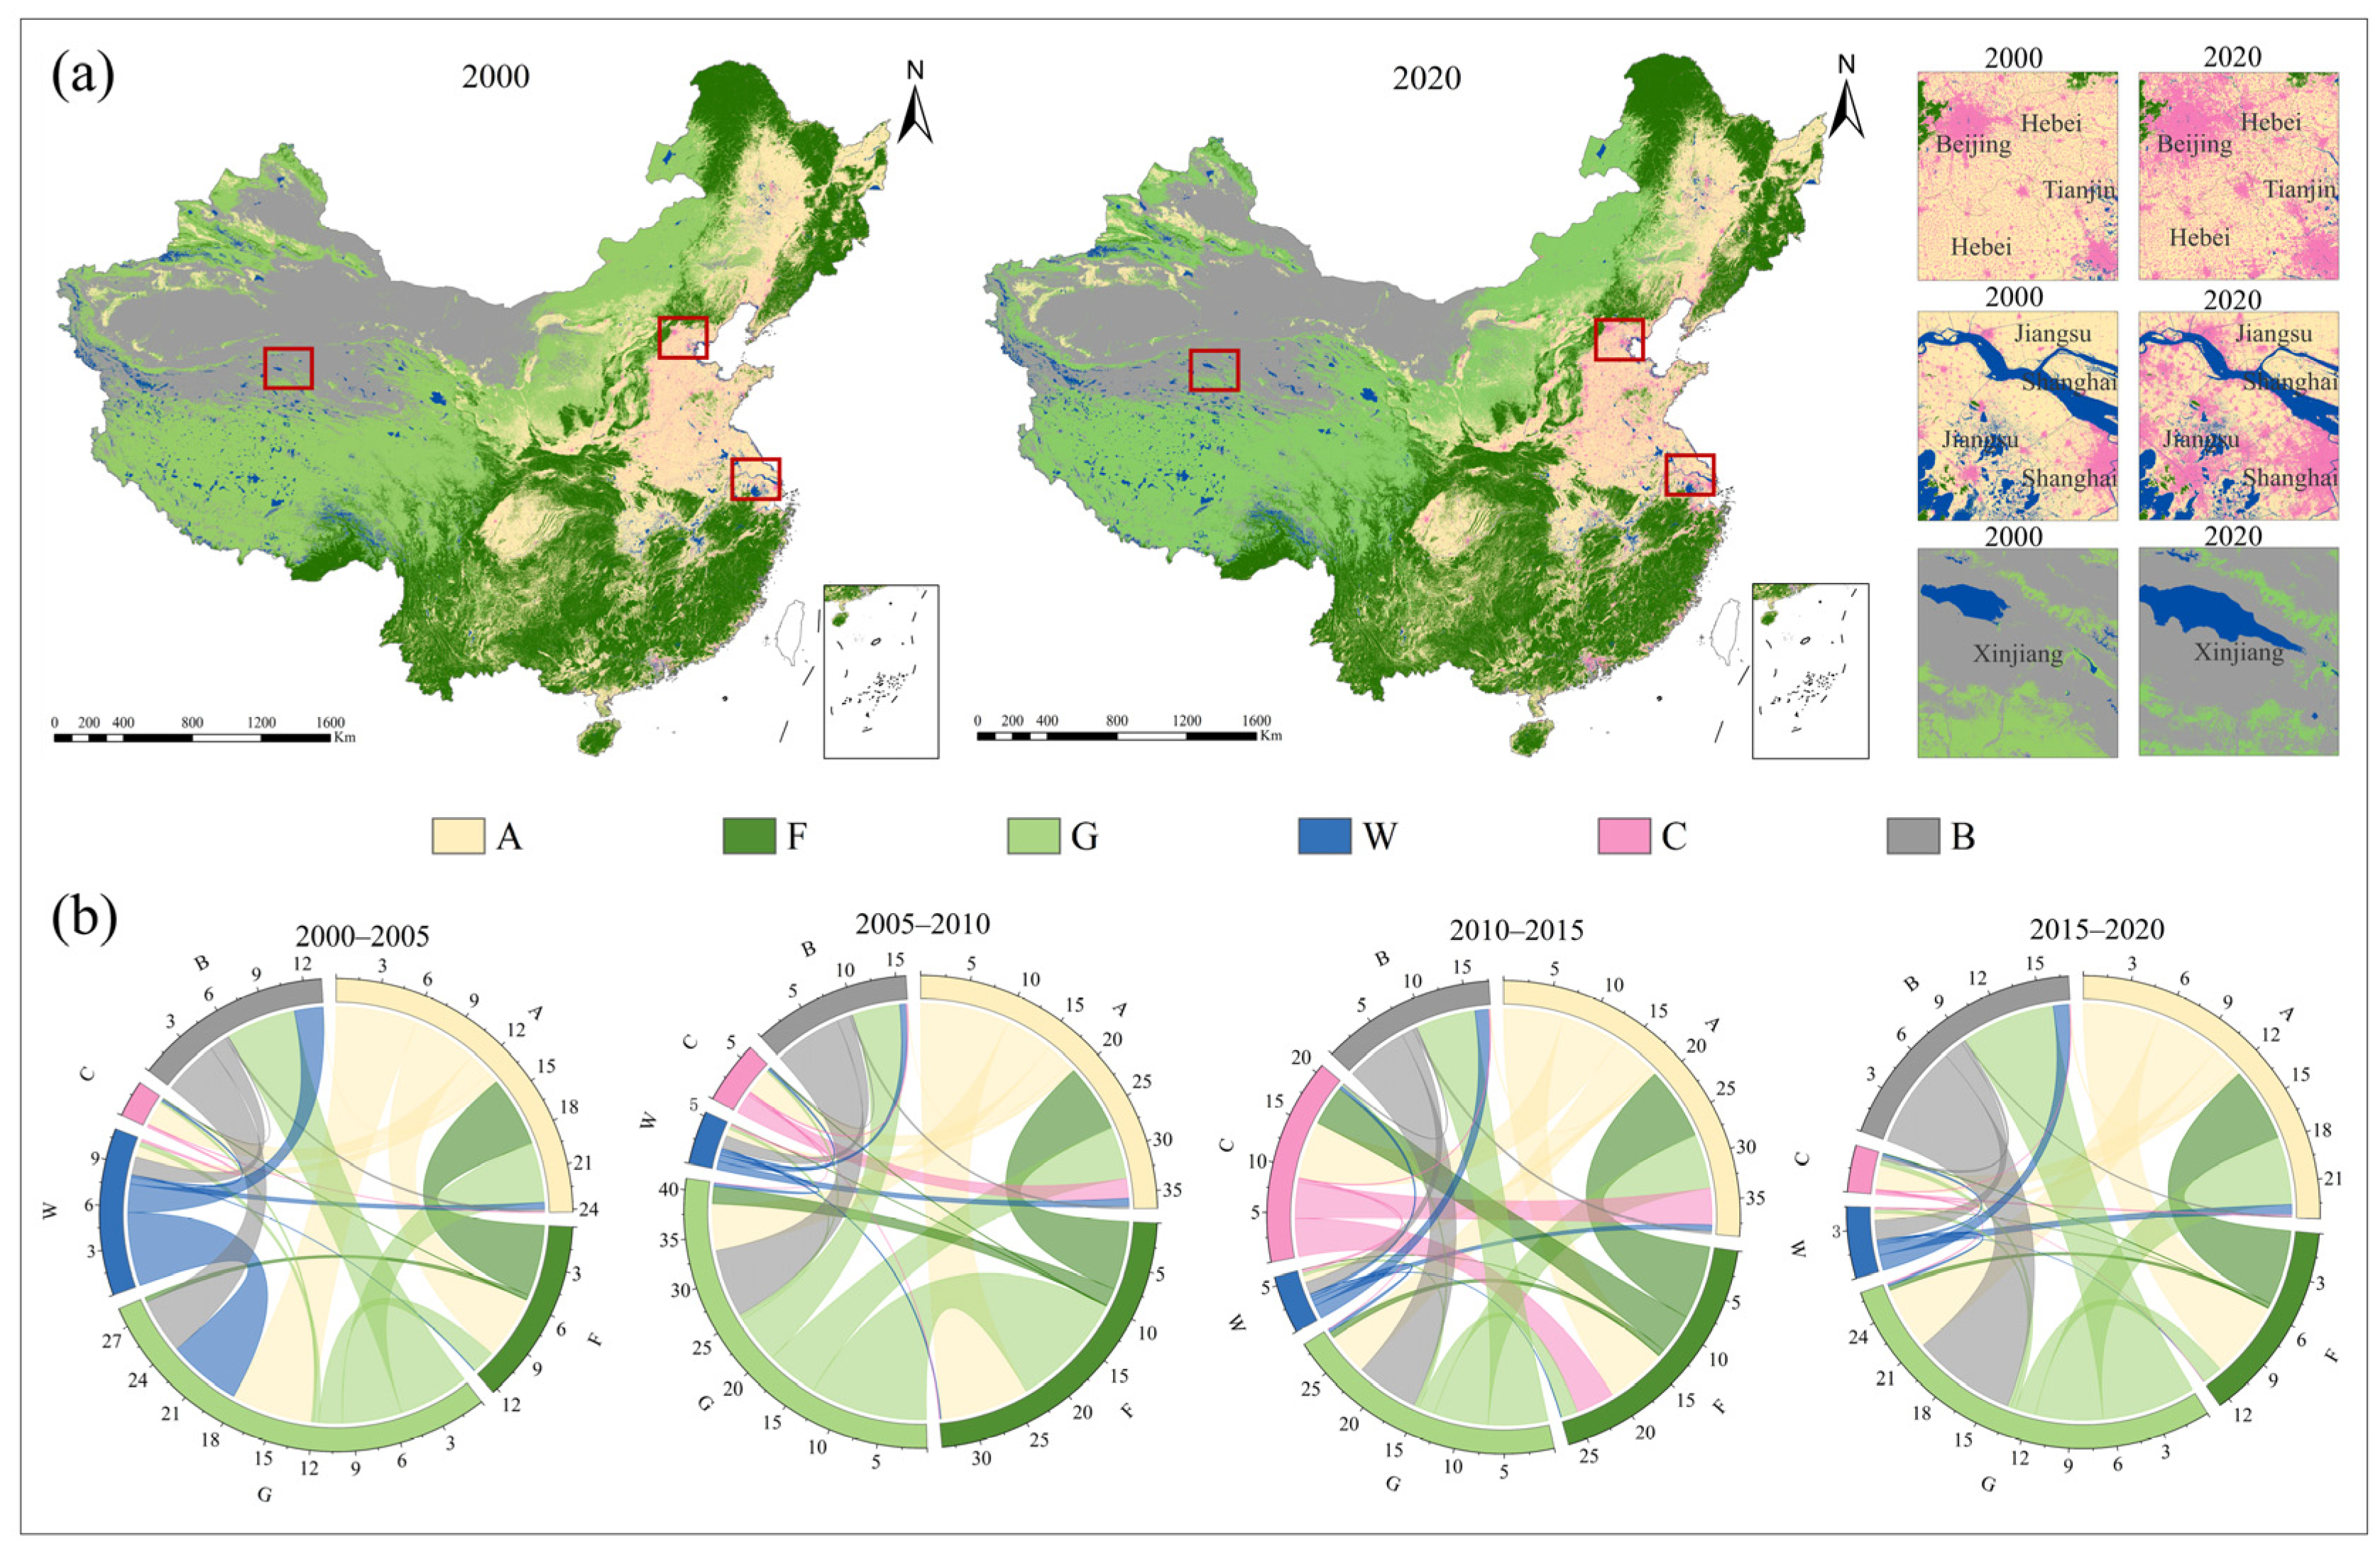
5.1. Time and Space Changes in Land Use
5.2. Changes in Carbon Emissions and Carbon Absorption
5.3. Carbon Flow Time and Space Distribution
5.4. Ecological Relationships
6. Discussion
7. Conclusions
Supplementary Materials
Author Contributions
Funding
Institutional Review Board Statement
Informed Consent Statement
Data Availability Statement
Conflicts of Interest
References
- Dong, B.; Ma, X.; Zhang, Z.; Zhang, H.; Chen, R.; Song, Y.; Shen, M.; Xiang, R. Carbon emissions, the industrial structure and economic growth: Evidence from heterogeneous industries in China. Environ. Pollut. 2020, 262, 114322. [Google Scholar] [CrossRef] [PubMed]
- Li, G.; Wei, W. Financial development, openness, innovation, carbon emissions, and economic growth in China. Energy Econ. 2021, 97, 105194. [Google Scholar] [CrossRef]
- Melillo, J.M.; Reilly, J.M.; Kicklighter, D.W.; Gurgel, A.C.; Cronin, T.W.; Paltsev, S.; Felzer, B.S.; Wang, X.; Sokolov, A.P.; Schlosser, C.A. Indirect Emissions from Biofuels: How Important? Science 2009, 326, 1397–1399. [Google Scholar] [CrossRef] [PubMed]
- Wolman, A. The Metabolism of Cities. Sci. Am. 1965, 213, 179–190. [Google Scholar] [CrossRef] [PubMed]
- Baccini, P. Understanding regional metabolism for a sustainable development of urban systems. Environ. Sci. Pollut. Res. 1996, 3, 108–111. [Google Scholar] [CrossRef]
- Houghton, R.A. The annual net flux of carbon to the atmosphere from changes in land use 1850–1990. Tellus Ser. B-Chem. Phys. Meteorol. 1999, 51, 298–313. [Google Scholar] [CrossRef]
- Rittenhouse, C.D.; Rissman, A.R. Forest cover, carbon sequestration, and wildlife habitat: Policy review and modeling of tradeoffs among land-use change scenarios. Environ. Sci. Policy 2012, 21, 94–105. [Google Scholar] [CrossRef]
- Piao, S.L.; Fang, J.Y.; Zhou, L.M.; Zhu, B.; Tan, K.; Tao, S. Changes in vegetation net primary productivity from 1982 to 1999 in China. Glob. Biogeochem. Cycles 2005, 19, GB2027. [Google Scholar] [CrossRef]
- Liu, J.; Vogelmann, J.E.; Zhu, Z.; Key, C.H.; Sleeter, B.M.; Price, D.T.; Chen, J.M.; Cochrane, M.A.; Eidenshink, J.C.; Howard, S.M.; et al. Estimating California ecosystem carbon change using process model and land cover disturbance data: 1951–2000. Ecol. Model. 2011, 222, 2333–2341. [Google Scholar] [CrossRef]
- Christen, A.; Coops, N.C.; Crawford, B.R.; Kellett, R.; Liss, K.N.; Olchovski, I.; Tooke, T.R.; van der Laan, M.; Voogt, J.A. Validation of modeled carbon-dioxide emissions from an urban neighborhood with direct eddy-covariance measurements. Atmos. Environ. 2011, 45, 6057–6069. [Google Scholar] [CrossRef]
- Chrysoulakis, N.; Lopes, M.; San Jose, R.; Grimmond, C.S.B.; Jones, M.B.; Magliulo, V.; Klostermann, J.E.M.; Synnefa, A.; Mitraka, Z.; Castro, E.A.; et al. Sustainable urban metabolism as a link between bio-physical sciences and urban planning: The BRIDGE project. Landsc. Urban Plan. 2013, 112, 100–117. [Google Scholar] [CrossRef]
- Xie, H. Towards Sustainable Land Use in China: A Collection of Empirical Studies. Sustainability 2017, 9, 2129. [Google Scholar] [CrossRef]
- Wei, C.; Meng, J.; Zhu, L.; Han, Z. Assessing progress towards sustainable development goals for Chinese urban land use: A new cloud model approach. J. Environ. Manag. 2023, 326, 116826. [Google Scholar] [CrossRef]
- Bolin, B. Changes of land biota and their importance for the carbon cycle. Science 1977, 196, 613–615. [Google Scholar] [CrossRef]
- Wang, C.; Wang, Y.; Wang, R.; Zheng, P. Modeling and evaluating land-use/land-cover change for urban planning and sustainability: A case study of Dongying city, China. J. Clean. Prod. 2018, 172, 1529–1534. [Google Scholar] [CrossRef]
- Chen, S.; Chen, B. Network Environ Perspective for Urban Metabolism and Carbon Emissions: A Case Study of Vienna, Austria. Environ. Sci. Technol. 2012, 46, 4498–4506. [Google Scholar] [CrossRef]
- Hannon, B. The structure of ecosystems. J. Theor. Biol. 1973, 41, 535–546. [Google Scholar] [CrossRef]
- Finn, J.T. Measures of ecosystem structure and function derived from analysis of flows. J. Theor. Biol. 1976, 56, 363–380. [Google Scholar] [CrossRef]
- Patten, B.C. Environs: Relativistic elementary particles for ecology. Am. Nat. 1982, 119, 179–219. [Google Scholar] [CrossRef]
- Li, H.; Chen, W.; He, W. Planning of Green Space Ecological Network in Urban Areas: An Example of Nanchang, China. Int. J. Environ. Res. Public Health 2015, 12, 12889–12904. [Google Scholar] [CrossRef]
- Yu, X.; Liu, Y.; Zhang, Z.; Xiong, Y.; Dang, M. Urban spatial structure features in Qinling mountain area based on ecological network analysis-case study of Shangluo City. Alex. Eng. J. 2022, 61, 12829–12845. [Google Scholar] [CrossRef]
- Shan, L.; Jiang, Y.; Liu, C.; Wang, Y.; Zhang, G.; Cui, X.; Li, F. Exploring the multi-dimensional coordination relationship between population urbanization and land urbanization based on the MDCE model: A case study of the Yangtze River Economic Belt, China. PLoS ONE 2021, 16, e0253898. [Google Scholar] [CrossRef] [PubMed]
- Jiang, S.; Zhang, Z.; Ren, H.; Wei, G.; Xu, M.; Liu, B. Spatiotemporal Characteristics of Urban Land Expansion and Population Growth in Africa from 2001 to 2019: Evidence from Population Density Data. ISPRS Int. J. Geo-Inf. 2021, 10, 584. [Google Scholar] [CrossRef]
- Gately, C.K.; Hutyra, L.R.; Wing, I.S. Cities, traffic, and CO2: A multidecadal assessment of trends, drivers, and scaling relationships. Proc. Natl. Acad. Sci. USA 2015, 112, 4999–5004. [Google Scholar] [CrossRef]
- Liu, W.; Sun, Y.; Cai, W.; Ke, Y.; Ren, H. A Study on the Spatial Association Network of CO2 Emissions from the Perspective of City Size: Evidence from the Yangtze River Delta Urban Agglomeration. Buildings 2022, 12, 617. [Google Scholar] [CrossRef]
- Sanquetta, C.R.; Bastos, A.D.S.; Sanquetta, M.N.I.; Barberena, I.M.; Dalla Corte, A.P.; Queiroz, A.; Almeida, L.F.P.U. Assessing the carbon stock of cultivated pastures in Rondonia, southwestern Brazilian Amazon. An. Acad. Bras. Cienc. 2022, 94, e20210262. [Google Scholar] [CrossRef]
- Qiu, C.; Ciais, P.; Zhu, D.; Guenet, B.; Peng, S.; Petrescu, A.M.R.; Lauerwald, R.; Makowski, D.; Gallego-Sala, A.V.; Charman, D.J.; et al. Large historical carbon emissions from cultivated northern peatlands. Sci. Adv. 2021, 7, eabf1332. [Google Scholar] [CrossRef]
- Xia, C.; Li, Y.; Xu, T.; Chen, Q.; Ye, Y.; Shi, Z.; Liu, J.; Ding, Q.; Li, X. Analyzing spatial patterns of urban carbon metabolism and its response to change of urban size: A case of the Yangtze River Delta, China. Ecol. Indic. 2019, 104, 615–625. [Google Scholar] [CrossRef]
- Wei, J.; Xia, L.; Chen, L.; Zhang, Y.; Yang, Z. A network-based framework for characterizing urban carbon metabolism associated with land use changes: A case of Beijing city, China. J. Clean. Prod. 2022, 371, 133695. [Google Scholar] [CrossRef]
- Wang, C.; Zhan, J.; Chu, X.; Liu, W.; Zhang, F. Variation in ecosystem services with rapid urbanization: A study of carbon sequestration in the Beijing-Tianjin-Hebei region, China. Phys. Chem. Earth 2019, 110, 195–202. [Google Scholar] [CrossRef]
- Chen, J.; Li, J.; Li, G.; Zhang, J. How to recognize and characterize land use-based carbon emissions within city networks in the Beijing-Tianjin-Hebei region of China. Urban Clim. 2024, 53, 101789. [Google Scholar] [CrossRef]
- Huang, Y.; Liu, J.; Shi, M. Analysis of influencing factors and prediction of carbon emissions of typical urban agglomerations in China: A case study of Beijing-Tianjin-Hebei region. Environ. Sci. Pollut. Res. 2023, 30, 52658–52678. [Google Scholar] [CrossRef]
- Wei, M.; Cai, Z.; Song, Y.; Xu, J.; Lu, M. Spatiotemporal evolutionary characteristics and driving forces of carbon emissions in three Chinese urban agglomerations. Sustain. Cities Soc. 2024, 104, 105320. [Google Scholar] [CrossRef]
- Zhang, L.; Lin, X.; Xiao, Y.; Lin, Z. Spatial and structural characteristics of the ecological network of carbon metabolism of cultivated land based on land use and cover change: A case study of Nanchang, China. Environ. Sci. Pollut. Res. 2023, 30, 30514–30529. [Google Scholar] [CrossRef]
- Zhu, E.; Li, W.; Chen, L.; Sha, M. Spatiotemporal coupling analysis of land urbanization and carbon emissions: A case study of Zhejiang Province, China. Land Degrad. Dev. 2023, 34, 4594–4606. [Google Scholar] [CrossRef]
- Ke, Y.; Xia, L.; Huang, Y.; Li, S.; Zhang, Y.; Liang, S.; Yang, Z. The carbon emissions related to the land-use changes from 2000 to 2015 in Shenzhen, China: Implication for exploring low-carbon development in megacities. J. Environ. Manag. 2022, 319, 115660. [Google Scholar] [CrossRef]
- Wang, N.; Chen, X.; Zhang, Y.; Pang, J.; Long, Z.; Chen, Y.; Zhang, Z. Integrated effects of land use and land cover change on carbon metabolism: Based on ecological network analysis. Environ. Impact Assess. Rev. 2024, 104, 107320. [Google Scholar] [CrossRef]
- Xu, Y.; Liu, Y.; Chen, R.; Meng, Y.; Li, K.; Fu, C. Study on the spatio-temporal evolution characteristics and driving mechanism of China’s carbon emissions. Humanit. Soc. Sci. Commun. 2023, 10, 786. [Google Scholar] [CrossRef]
- Wang, Q.; Jiang, R. Is China’s economic growth decoupled from carbon emissions? J. Clean. Prod. 2019, 225, 1194–1208. [Google Scholar] [CrossRef]
- Lai, L.; Huang, X.; Yang, H.; Chuai, X.; Zhang, M.; Zhong, T.; Chen, Z.; Chen, Y.; Wang, X.; Thompson, J.R. Carbon emissions from land-use change and management in China between 1990 and 2010. Sci. Adv. 2016, 2, e1601063. [Google Scholar] [CrossRef]
- National Bureau of Statistics. 2011. Available online: http://www.stats.gov.cn/hd/cjwtjd/ (accessed on 14 January 2024).
- Liu, F.; Tang, L.; Liao, K.; Ruan, L.; Liu, P. Spatial distribution and regional difference of carbon emissions efficiency of industrial energy in China. Sci. Rep. 2021, 11, 19419. [Google Scholar] [CrossRef] [PubMed]
- Bhowmik, R.; Zhu, Y.; Gao, K. An analysis of trade cooperation: Central region in China and ASEAN. PLoS ONE 2021, 16, e0261270. [Google Scholar] [CrossRef] [PubMed]
- Zhang, Y.; Wang, W.; Liang, L.; Wang, D.; Cui, X.; Wei, W. Spatial-temporal pattern evolution and driving factors of China’s energy efficiency under low-carbon economy. Sci. Total Environ. 2020, 739, 140197. [Google Scholar] [CrossRef] [PubMed]
- Lv, M.; Yang, W.; Wang, M.; Wang, Y. The spatial changes of China’s environmental efficiency and driving factors from the perspective of circular economy. Environ. Sci. Pollut. Res. 2023, 30, 23312–23334. [Google Scholar] [CrossRef]
- Xiong, F. Analysis on the Causes and Countermeasures of the Economic Predicament in the Northeast China. Mod. Econ. 2016, 7, 1014–1019. [Google Scholar] [CrossRef]
- Liu, F.; Zhang, Z.; Shi, L.; Zhao, X.; Xu, J.; Yi, L.; Liu, B.; Wen, Q.; Hu, S.; Wang, X.; et al. Urban expansion in China and its spatial-temporal differences over the past four decades. J. Geogr. Sci. 2016, 26, 1477–1496. [Google Scholar] [CrossRef]
- Data Center for Resources and Environmental Sciences, Chinese Academy of Sciences. 2000–2020. Available online: https://www.resdc.cn/ (accessed on 14 January 2024).
- Yang, J.; Huang, X. The 30 m annual land cover dataset and its dynamics in China from 1990 to 2019. Earth Syst. Sci. Data 2021, 13, 3907–3925. [Google Scholar] [CrossRef]
- Li, L.; Bai, Y.; Yang, X.; Gao, Z.; Qiao, F.; Liang, J.; Zhang, C. A Low-Carbon Land Use Management Framework Based on Urban Carbon Metabolism: A Case of a Typical Coal Resource-Based City in China. Sustainability 2022, 14, 13854. [Google Scholar] [CrossRef]
- China’s Provincial Statistical Yearbooks. 2000–2020. Available online: http://www.stats.gov.cn/sj/ndsj/ (accessed on 14 January 2024).
- China’s Economic and Social Big Data Research Platform. Available online: https://data.cnki.net/ (accessed on 14 January 2024).
- Wen, H.; Li, Y.; Li, Z.; Cai, X.; Wang, F. Spatial Differentiation of Carbon Budgets and Carbon Balance Zoning in China Based on the Land Use Perspective. Sustainability 2022, 14, 12962. [Google Scholar] [CrossRef]
- Walsh, J.J. Importance of continental margins in the marine biogeochemical cycling of carbon and nitrogen. Nature 1991, 350, 53–55. [Google Scholar] [CrossRef]
- Meybeck, M. Riverine transport of atmospheric carbon: Sources, global typology and budget. Water Air Soil Pollut. 1993, 70, 443–463. [Google Scholar] [CrossRef]
- Liang, X.; Liu, Z.; Zhai, L.; Ji, L.; Feng, Y.; Sang, H. Spatial terrestrial carbon emissions/sequestrations evolution based on ecological network analysis in Beijing-Tianjin-Hebei urban agglomeration. Ecol. Eng. 2023, 189, 106914. [Google Scholar] [CrossRef]
- Zhang, Y.; Xia, L.; Fath, B.D.; Yang, Z.; Yin, X.; Su, M.; Liu, G.; Li, Y. Development of a spatially explicit network model of urban metabolism and analysis of the distribution of ecological relationships: Case study of Beijing, China. J. Clean. Prod. 2016, 112, 4304–4317. [Google Scholar] [CrossRef]
- Zhang, X.; Zhang, J.; Yang, C. Spatio-Temporal Evolution of Agricultural Carbon Emissions in China, 2000–2020. Sustainability 2023, 15, 3347. [Google Scholar] [CrossRef]
- Wiesner, S.; Duff, A.J.; Desai, A.R.; Panke-Buisse, K. Increasing Dairy Sustainability with Integrated Crop-Livestock Farming. Sustainability 2020, 12, 765. [Google Scholar] [CrossRef]
- Chen, K.S.; Wang, W.C.; Chen, H.M.; Lin, C.F.; Hsu, H.C.; Kao, J.H.; Hu, M.T. Motorcycle emissions and fuel consumption in urban and rural driving conditions. Sci. Total Environ. 2003, 312, 113–122. [Google Scholar] [CrossRef]
- Ghahramani, M.; Pilla, F. Analysis of Carbon Dioxide Emissions from Road Transport Using Taxi Trips. IEEE Access 2021, 9, 98573–98580. [Google Scholar] [CrossRef]
- Li, X.; Lv, T.; Zhan, J.; Wang, S.; Pan, F. Carbon Emission Measurement of Urban Green Passenger Transport: A Case Study of Qingdao. Sustainability 2022, 14, 9588. [Google Scholar] [CrossRef]
- Yin, K.; Lu, D.; Tian, Y.; Zhao, Q.; Yuan, C. Evaluation of Carbon and Oxygen Balances in Urban Ecosystems Using Land Use/Land Cover and Statistical Data. Sustainability 2015, 7, 195–221. [Google Scholar] [CrossRef]
- Shan, Y.; Liu, J.; Liu, Z.; Xu, X.; Shao, S.; Wang, P.; Guan, D. New provincial CO2 emission inventories in China based on apparent energy consumption data and updated emission factors. Appl. Energy 2016, 184, 742–750. [Google Scholar] [CrossRef]
- Xia, C.; Li, Y.; Xu, T.; Ye, Y.; Shi, Z.; Peng, Y.; Liu, J. Quantifying the spatial patterns of urban carbon metabolism: A case study of Hangzhou, China. Ecol. Indic. 2018, 95, 474–484. [Google Scholar] [CrossRef]
- Duman, Z.; Mao, X.; Cai, B.; Zhang, Q.; Chen, Y.; Gao, Y.; Guo, Z. Exploring the spatiotemporal pattern evolution of carbon emissions and air pollution in Chinese cities. J. Environ. Manag. 2023, 345, 118870. [Google Scholar] [CrossRef] [PubMed]
- Mao, X.; Wei, X.; Engel, B.; Wei, X.; Zhang, Z.; Tao, Y.; Wang, W. Network-based perspective on water-air interface GHGs flux on a cascade surface-flow constructed wetland in Qinghai-Tibet Plateau, China. Ecol. Eng. 2020, 151, 105862. [Google Scholar] [CrossRef]
- Geng, Y.; Zhao, H.; Liu, Z.; Xue, B.; Fujita, T.; Xi, F. Exploring driving factors of energy-related CO2 emissions in Chinese provinces: A case of Liaoning. Energy Policy 2013, 60, 820–826. [Google Scholar] [CrossRef]
- Nie, Y.; Li, Q.; Wang, E.; Zhang, T. Study of the nonlinear relations between economic growth and carbon dioxide emissions in the Eastern, Central and Western regions of China. J. Clean. Prod. 2019, 219, 713–722. [Google Scholar] [CrossRef]
- Ning, J.; Liu, J.; Kuang, W.; Xu, X.; Zhang, S.; Yan, C.; Li, R.; Wu, S.; Hu, Y.; Du, G.; et al. Spatiotemporal patterns and characteristics of land-use change in China during 2010–2015. J. Geogr. Sci. 2018, 28, 547–562. [Google Scholar] [CrossRef]
- Chen, Q.; Su, M.; Meng, F.; Liu, Y.; Cai, Y.; Zhou, Y.; Yang, Z. Analysis of urban carbon metabolism characteristics based on provincial input-output tables. J. Environ. Manag. 2020, 265, 110561. [Google Scholar] [CrossRef]
- Fath, B.D.; Strelkovskii, N.; Wang, S.; Chen, B. Assessing urban carbon metabolism using network analysis across Chinese and European cities. Clean. Prod. Lett. 2023, 4, 100042. [Google Scholar] [CrossRef]
- Jin, X.; Li, Y.; Sun, D.; Zhang, J.; Zheng, J. Factors Controlling Urban and Rural Indirect Carbon Dioxide Emissions in Household Consumption: A Case Study in Beijing. Sustainability 2019, 11, 6563. [Google Scholar] [CrossRef]
- Li, M.; Liu, H.; Yu, S.; Wang, J.; Miao, Y.; Wang, C. Estimating the Decoupling Between Net Carbon Emissions and Construction Land and Its Driving Factors: Evidence from Shandong Province, China. Int. J. Environ. Res. Public Health 2022, 19, 8910. [Google Scholar] [CrossRef]
- Cui, Y.; Li, L.; Chen, L.; Zhang, Y.; Cheng, L.; Zhou, X.; Yang, X. Land-Use Carbon Emissions Estimation for the Yangtze River Delta Urban Agglomeration Using 1994–2016 Landsat Image Data. Remote Sens. 2018, 10, 1334. [Google Scholar] [CrossRef]
- Zhou, Y.; Chen, M.; Tang, Z.; Mei, Z. Urbanization, land use change, and carbon emissions: Quantitative assessments for city-level carbon emissions in Beijing-Tianjin-Hebei region. Sustain. Cities Soc. 2021, 66, 102701. [Google Scholar] [CrossRef]
- Zhao, L.; Yang, C.-h.; Zhao, Y.-c.; Wang, Q.; Zhang, Q.-p. Spatial Correlations of Land Use Carbon Emissions in Shandong Peninsula Urban Agglomeration: A Perspective from City Level Using Remote Sensing Data. Remote Sens. 2023, 15, 1488. [Google Scholar] [CrossRef]
- Lv, T.; Hu, H.; Zhang, X.; Xie, H.; Wang, L.; Fu, S. Spatial spillover effects of urbanization on carbon emissions in the Yangtze River Delta urban agglomeration, China. Environ. Sci. Pollut. Res. 2022, 29, 33920–33934. [Google Scholar] [CrossRef]
- Wang, Z.; Li, Y.; Cai, H.; Wang, B. Comparative analysis of regional carbon emissions accounting methods in China: Production-based versus consumption-based principles. J. Clean. Prod. 2018, 194, 12–22. [Google Scholar] [CrossRef]
- Lu, X.; Kuang, B.; Li, J.; Han, J.; Zhang, Z. Dynamic Evolution of Regional Discrepancies in Carbon Emissions from Agricultural Land Utilization: Evidence from Chinese Provincial Data. Sustainability 2018, 10, 552. [Google Scholar] [CrossRef]
- Zhang, P.; He, J.; Hong, X.; Zhang, W.; Qin, C.; Pang, B.; Li, Y.; Liu, Y. Carbon sources/sinks analysis of land use changes in China based on data envelopment analysis. J. Clean. Prod. 2018, 204, 702–711. [Google Scholar] [CrossRef]
- Cai, C.; Fan, M.; Yao, J.; Zhou, L.; Wang, Y.; Liang, X.; Liu, Z.; Chen, S. Spatial-temporal characteristics of carbon emissions corrected by socio-economic driving factors under land use changes in Sichuan Province, southwestern China. Ecol. Inform. 2023, 77, 102164. [Google Scholar] [CrossRef]
- Hu, Y.; Sun, J.; Zheng, J. Spatiotemporal Analysis of Urban Carbon Metabolism and Its Response to Land Use Change: A Case Study of Beijing, China. Atmosphere 2023, 14, 1305. [Google Scholar] [CrossRef]
- Xia, L.; Zhang, Y.; Wu, Q.; Liu, L. Analysis of the ecological relationships of urban carbon metabolism based on the eight nodes spatial network model. J. Clean. Prod. 2017, 140, 1644–1651. [Google Scholar] [CrossRef]
- Xia, C.; Chen, B. Urban land-carbon nexus based on ecological network analysis. Appl. Energy 2020, 276, 115465. [Google Scholar] [CrossRef]


| Matrix Notation | Positive (+) | Neutral (0) | Negative (−) |
|---|---|---|---|
| Positive (+) | Mutualism (+,+) | Commensalism (+,0) | Exploitation (+,−) |
| Neutral (0) | Commensalism host (0,+) | Neutralism (0,0) | Amensalism (0,−) |
| Negative (−) | Control (−,+) | Amensal host (−,0) | Competition (−,−) |
| Land Use Types | A | F | G | W | C | B |
|---|---|---|---|---|---|---|
| Mutualism relationships | 2 | 9 | 5 | 1 | 8 | 4 |
| Exploitation and control relationships | 7 | 10 | 7 | 10 | 5 | 8 |
| Competition relationships | 11 | 1 | 8 | 9 | 7 | 8 |
Disclaimer/Publisher’s Note: The statements, opinions and data contained in all publications are solely those of the individual author(s) and contributor(s) and not of MDPI and/or the editor(s). MDPI and/or the editor(s) disclaim responsibility for any injury to people or property resulting from any ideas, methods, instructions or products referred to in the content. |
© 2025 by the authors. Licensee MDPI, Basel, Switzerland. This article is an open access article distributed under the terms and conditions of the Creative Commons Attribution (CC BY) license (https://creativecommons.org/licenses/by/4.0/).
Share and Cite
Yuan, C.; Liu, Y.; Lu, J.; Guo, C.; Quan, T.; Su, W. Spatial Analysis of Carbon Metabolism in Different Economic Divisions Based on Land Use and Cover Change (LUCC) in China. Atmosphere 2025, 16, 148. https://doi.org/10.3390/atmos16020148
Yuan C, Liu Y, Lu J, Guo C, Quan T, Su W. Spatial Analysis of Carbon Metabolism in Different Economic Divisions Based on Land Use and Cover Change (LUCC) in China. Atmosphere. 2025; 16(2):148. https://doi.org/10.3390/atmos16020148
Chicago/Turabian StyleYuan, Cui, Yaju Liu, Jingzhao Lu, Chengyi Guo, Tingting Quan, and Wei Su. 2025. "Spatial Analysis of Carbon Metabolism in Different Economic Divisions Based on Land Use and Cover Change (LUCC) in China" Atmosphere 16, no. 2: 148. https://doi.org/10.3390/atmos16020148
APA StyleYuan, C., Liu, Y., Lu, J., Guo, C., Quan, T., & Su, W. (2025). Spatial Analysis of Carbon Metabolism in Different Economic Divisions Based on Land Use and Cover Change (LUCC) in China. Atmosphere, 16(2), 148. https://doi.org/10.3390/atmos16020148