Article

The Influence of Multisensory Perception on Student Outdoor Comfort in University Campus Design

by
Hichem Touhami
1,
Djihed Berkouk
2,3,*,
Tallal Abdel Karim Bouzir
3,
Sara Khelil
3 and
Mohammed M. Gomaa
2,4,*
1
Laboratory of Design and Modelling of Architectural and Urban Forms and Ambiances (LACOMOFA), Department of Architecture, Biskra University, Biskra 07000, Algeria
2
Department of Architecture, School of Engineering, Computing & Design, Dar Al-Hekma University, Jeddah 22246, Saudi Arabia
3
Department of Architecture, Biskra University, Biskra 07000, Algeria
4
Department of Architectural Engineering, Faculty of Engineering, Aswan University, Aswan 81542, Egypt
*
Authors to whom correspondence should be addressed.
Atmosphere 2025, 16(2), 150; https://doi.org/10.3390/atmos16020150
Submission received: 27 December 2024 / Revised: 23 January 2025 / Accepted: 27 January 2025 / Published: 29 January 2025

Abstract

:
The user’s experience is critical in spatial design, particularly in outdoor spaces like university campuses, where the physical environment significantly influences students’ relaxation and stress relief. This study investigates the combined impact of thermal, luminous, and auditory environments on students’ perceptions within recreational areas at Bordj Bou Arreridj University Campus. A mixed-method approach combined field surveys and on-site measurements across eleven locations within three distinct spatial configurations. The findings from this study indicate that the auditory environment had the most substantial influence on overall perceptions, surpassing luminous and thermal factors. The open courtyard (Area 1) was perceived as less comfortable due to excessive heat and noise exposure. The shaded zone (Area 2) was identified as the most vulnerable, experiencing significant thermal stress and noise disturbances. In contrast, the secluded patio (Area 3) achieved the highest comfort rating and was perceived as the most cheerful and suitable space. Correlation analysis revealed significant interrelationships between physical and perceptual dimensions, highlighting the critical role of factors such as wind velocity, sky view factor, and illuminance in shaping thermal, luminous, and acoustic perceptions. A fuzzy logic model was developed to predict user perceptions of comfort, suitability, and mood based on measured environmental parameters to address the complexity of multisensory interactions. This study highlights the importance of integrating multisensory evaluations into spatial design to optimize the quality of outdoor environments.

1. Introduction

Outdoor environments foster relaxation, social interaction, and stress relief, particularly within university campuses, hubs of academic and social activity [1,2]. However, traditional architectural design often prioritizes aesthetics and structural form over the quality of outdoor spaces. As a result, the well-being of users in recreational areas is frequently treated as a secondary consideration [3,4]. This oversight underscores the need for a more user-centered approach to outdoor spatial design that integrates multisensory environmental factors to enhance comfort and satisfaction [5].
A combination of sensory stimuli, including thermal, luminous, and auditory environments, shapes perceptions of outdoor spaces. Extensive research has explored the impact of these factors individually [6,7,8,9,10,11]. For instance, studies on thermal comfort have highlighted its importance in outdoor usability, particularly in hot climates [7]. The thermal environment is a critical determinant of outdoor comfort, particularly in regions with extreme climatic conditions. Studies have demonstrated that thermal stress directly affects physiological and psychological well-being [8]. For example, shade, wind, and surface materials were emphasized in mitigating thermal discomfort in outdoor spaces [9,10,11]. However, most research focuses on temperature as an isolated factor, with limited consideration of its interaction with other environmental dimensions. In university campuses, thermal comfort is particularly vital, as prolonged exposure to heat can deter students from utilizing recreational spaces.
Similarly, research on soundscapes has emphasized the role of auditory environments in influencing emotional responses [12,13]. The auditory environment, often called the soundscape, significantly influences emotional responses and perceived comfort in outdoor spaces. Kang and Zhang (2010) demonstrated that natural sounds, such as birdsong or flowing water, enhance positive experiences, while noise pollution, such as traffic or construction, detracts from overall satisfaction [14]. Despite growing interest in soundscapes, the combined effect of auditory stimuli with thermal and luminous conditions remains underexplored, particularly in recreational areas within university campuses.
While luminous conditions influence visual comfort, mood, and spatial perception, research by [15,16] highlighted the significance of light intensity, shading, and contrast in shaping outdoor experiences. While studies on daylighting strategies are well-documented in architectural design [17,18], they primarily address indoor spaces, leaving a gap in the understanding of how luminous conditions interact with other sensory factors in outdoor settings. This gap is critical for designing functional and aesthetically pleasing spaces.
University campuses present unique research settings for exploring multisensory perceptions. These environments must balance functionality, aesthetics, and user well-being, particularly in recreational spaces where students seek respite from academic stress. Although some studies have examined campus design, most fail to address the multisensory interactions that shape users’ experiences in outdoor areas. Despite evidence that well-designed campus landscapes contribute significantly to psychological restoration and overall well-being, natural environments positively influence mental health and reduce stress levels [19,20]. University recreational areas, critical for promoting relaxation, social interaction, and stress relief, remain underexplored in the scientific literature. These spaces provide an ideal context for investigating the influence of environmental factors on human perception. While existing studies have extensively explored individual environmental factors on university campuses, such as thermal comfort, noise levels, and lightscape experience, limited research has integrated these variables into a multisensory framework [16,21]. This gap is particularly evident in regions such as North Africa, where climatic conditions and cultural practices create distinct challenges and opportunities for outdoor design.
To address this knowledge gap, the present study investigates the combined impact of thermal, luminous, and auditory environments on students’ perceptions of recreational spaces at the Faculty of Science and Technology, Bordj Bou Arreridj University. A mixed-methods approach was employed, integrating field surveys and on-site measurements of environmental parameters across distinct spatial configurations. This study identifies the factors contributing to comfort, suitability, and mood and introduces a fuzzy logic model to predict user perceptions based on measured environmental data. This approach represents a novel application of fuzzy logic in the context of outdoor recreational spaces.
This research contributes to the growing literature on multisensory design in architecture and urban planning by highlighting the interactions between thermal, luminous, and auditory factors. It underscores the importance of integrating sensory evaluations into spatial design processes to optimize the quality of outdoor environments. The findings of this study have broader implications for enhancing user well-being in recreational areas, particularly on university campuses, where outdoor spaces play a pivotal role in promoting relaxation and social connectivity.

2. Materials and Methods

Bordj Bou Arreridj city is located approximately 200 km southeast of Algiers, in a region classified as semi-arid according to the UNEP, De Matrone, and Emberger indices [22]. To investigate the effect of thermal, visual, and auditory environments on the students’ perception, an investigation was conducted in the recreational areas surrounding and within the science and technology faculty at BBA University, situated around 3 km southeast of the city (Figure 1).

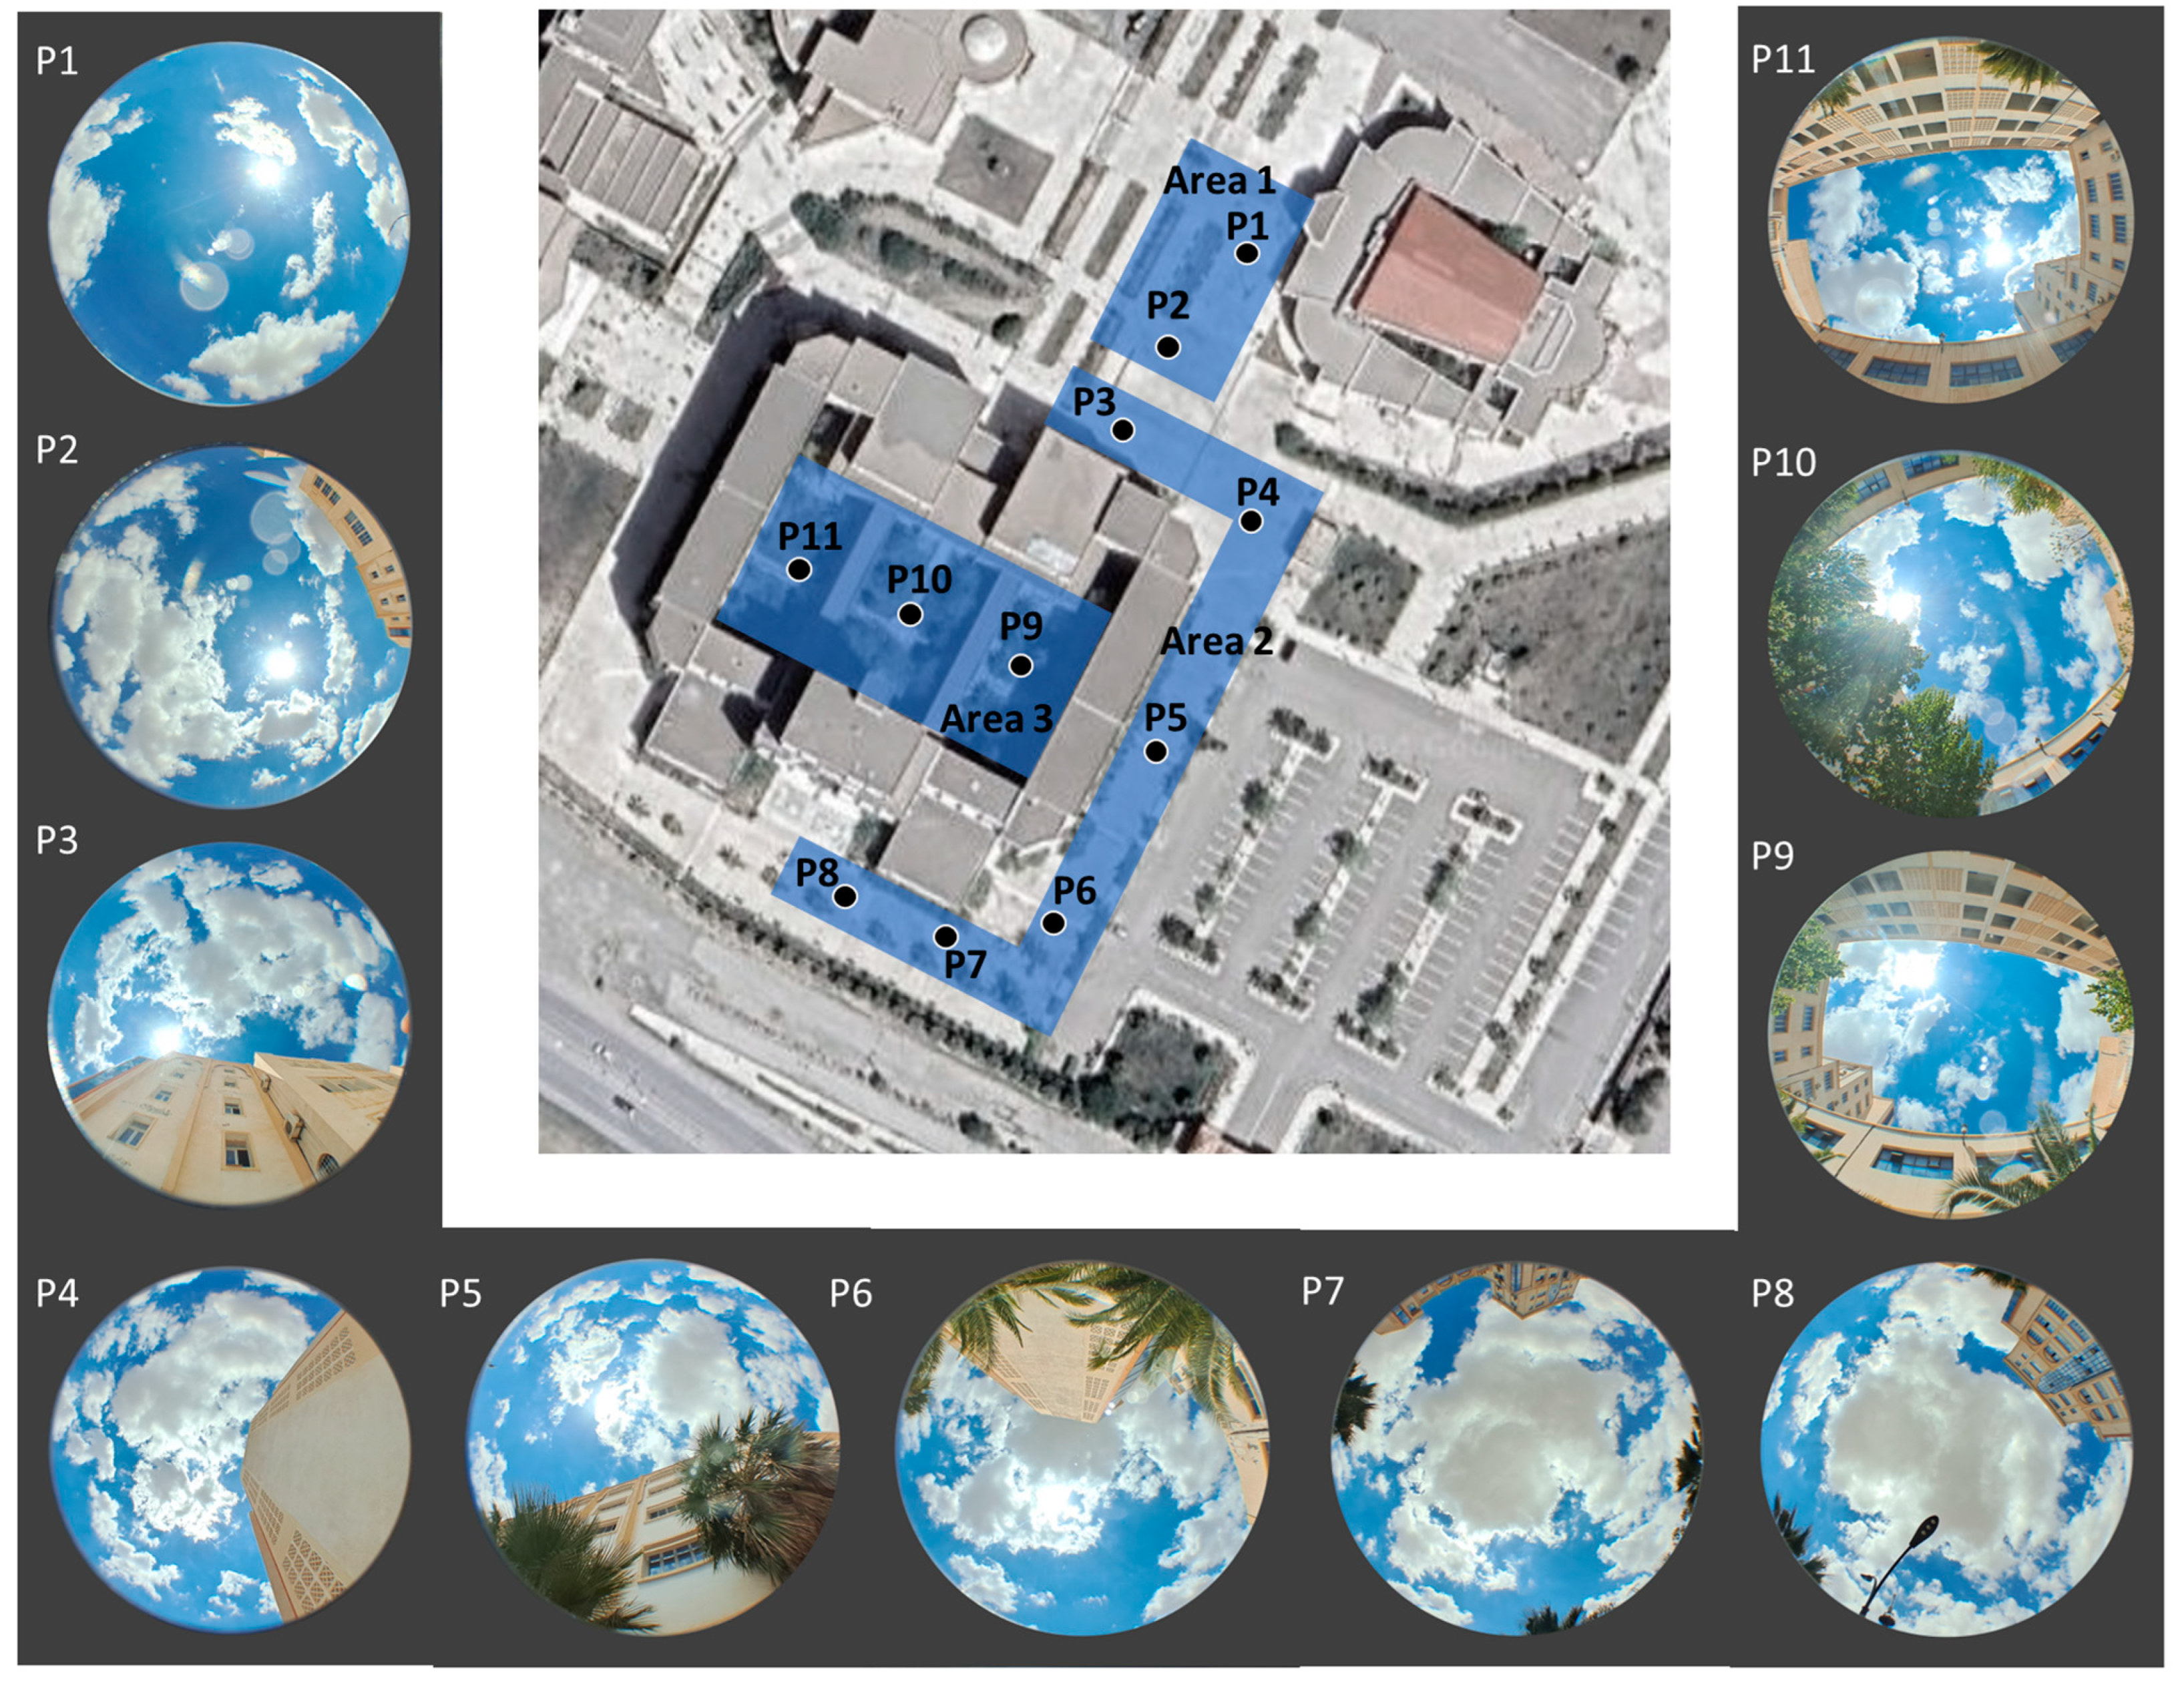
2.1. Physical Context

The context of this study was divided into three areas based on the sky view factor (SVF). The first area is considered an open space due to the significant distance from the surrounding buildings with SVF > 0.9, and the second area, with 0.6 < SVF > 0.7, is a dense core positioned very near to the external walls of the faculty. The third area, a highly dense core with SVF < 0.6, represents the faculty’s patio [23]. The mixed-method approach was utilized to collect quantitative and qualitative data simultaneously [24] at eleven points where the students gathered across the three areas (Figure 2).
The methodology of this research was based on the methodologies used in some previous studies [10,16], and the contribution of this study lies in adding a multisensory fuzzy logic model by using the MATLAB R2024a software (Figure 3). The aim of the in-situ measurement of the physical dimensions of thermal, visual, and auditory environments was performed when the participants were responding to the questionnaire handed out to ensure the direct relationship between participants’ perception and physical dimensions, supporting real-time monitoring.

2.2. Objective Measurement and Material Used

The quantitative data collection operation was executed by measuring the different physical parameters of the environment (thermal, visual, and audible) through 11 measuring stations corresponding to the points identified as most valuable by the students (Figure 2). The first area covered stations one and two, stations three to eight were included in the second area, and the third area involved stations nine, ten, and eleven. The measurement was carried out systematically at every point for all the physical factors, as shown in Table 1, to ensure a rigorous and robust approach while achieving comparable results.
The sky view factor (SVF) was the primary dimension used to divide the recreational space into three areas depending on its variance, which ranged from 0.458 to 0.998. The method employed to calculate the SVF, which is based on fish-eye images and using the RAYMAN pro 1.2 software, has been adopted by numerous researchers [16,21,25,26].
A professional humidity meter was used to measure the ambient air temperature (Ta) and the relative humidity (RH) to assess the thermal environment. On the other hand, the soil surface temperature (Ts) was calculated using an infrared thermometer. In addition, an anemometer was employed to determine the wind velocity (Va). These parameters were used as inputs in the RAYMAN pro 1.2 software to calculate the mean radiant temperature (MRT) and the physiologically equivalent temperature (PET). Several studies have used this method considerably [16,21,27].
To evaluate the luminous environment, illuminance is regarded as one of the important indices in the field [28,29] and was quantified using a digital lux meter (MM-LM 01). Hence, CR2-format images were taken on site by a digital single-lens reflex (DSLR) camera (CANON EOS 5D Mark III, Canon, Japan) with a wide lens. This process aimed to calculate the daylight glare probability (DGP) with the support of the EVALGLAR plug-in incorporated with the AFTAB ALPHA 2.2 software [30,31].
Regarding the audible environment, the sound pressure level (SPL) measurement was carried out using a digital sound level meter. This was conducted to compute the equivalent sound pressure level (Leq), the percentile noise levels (L10, L50, L90), the noise climate (NC), and the noise pollution level (Lnp) due to their importance in the assessment of the impact of noise [21,32]. Furthermore, a stereo soundtrack was recorded at each station by a ZOOM H1 Sound Recorder [33,34].

2.3. Perceptual Dimensions and Questionnaire

Along with evaluating the physical dimensions and the measurement of the parameters, a subjective assessment was carried out to analyze the multisensory perceptual dimensions and determine the students’ perceptions in the three recreational areas. For this reason, a questionnaire that included 12 semantic items was divided into four groups based on a seven-point bipolar rating scale assessment (Table 2). It was delivered to the participants after a detailed explanation to ensure clarity. The first group presented general perceptions, including comfort, suitability, and mood, which served as the dependent variables in the ordinal regression analysis. This group was adapted from a previous study that addressed multisensory interactions between thermal, auditory, and visual environments [17]. The second group covered the thermal environment, involving heat (cold–hot), used in the thermal sensation vote (TSV) [35,36], humidity (dry–humid), used in humidity sensation vote (HSV) [37], and wind conditions (windy–mild), which were used previously as not windy–windy [17] as well as in a study that mentioned wind conditions in the questionnaire as an influent parameter [38]. The third group introduced the luminous environment, consisting of glare (no glare–glare), lighting (dark–light), and uniformity (non-uniform–uniform), which have been largely used in lightscape assessment questionnaires [16,17,39,40]. The last group covered the audible environment, comprising sound excitation (monotonous–exciting), calmness (chaotic–calm), and sound variety (simple–varied), which were obtained from studies that explored an interesting number of soundscape attributes [14,41].

2.4. Participants

This study included a sample size of 106 participants, comprising, 58 males (54.7%) and 48 females (45.3%), aged between 18 and 46 years, Table 3. The mean age of the participants was 21.85 years, with a standard deviation of 4.61 years, indicating a young group representative of university students. The participants were distributed across three areas, with 36 in the first area, 33 in the second area, and 37 in the third area. It is noteworthy that each respondent remained in the same position for 5 to 10 min before completing the questionnaire. It is essential to note that all the participants were in good health, and any medical condition or disease was registered.

2.5. Data Analysis

The statistical tests and data analysis were conducted utilizing the Statistical Package for the Social Science SPSS V.29 developed by the IBM Corporation (Armonk, NY, USA). The physical dimension data obtained from on-site measurements were processed by applying descriptive statistics. In terms of perceptual data, an ordinal regression analysis was executed to assess the effect of thermal, luminous, and audible perception variables on suitability, comfort, and mood. Finally, three correlation analyses were conducted to examine the relationships between the various dimensions. Pearson’s correlation was used to assess relationships among the physical dimensions, Kendall’s tau-b correlation was applied to evaluate associations among the perceptual dimensions, and Spearman’s correlation was utilized to explore the relationships between perceptual and physical dimensions.

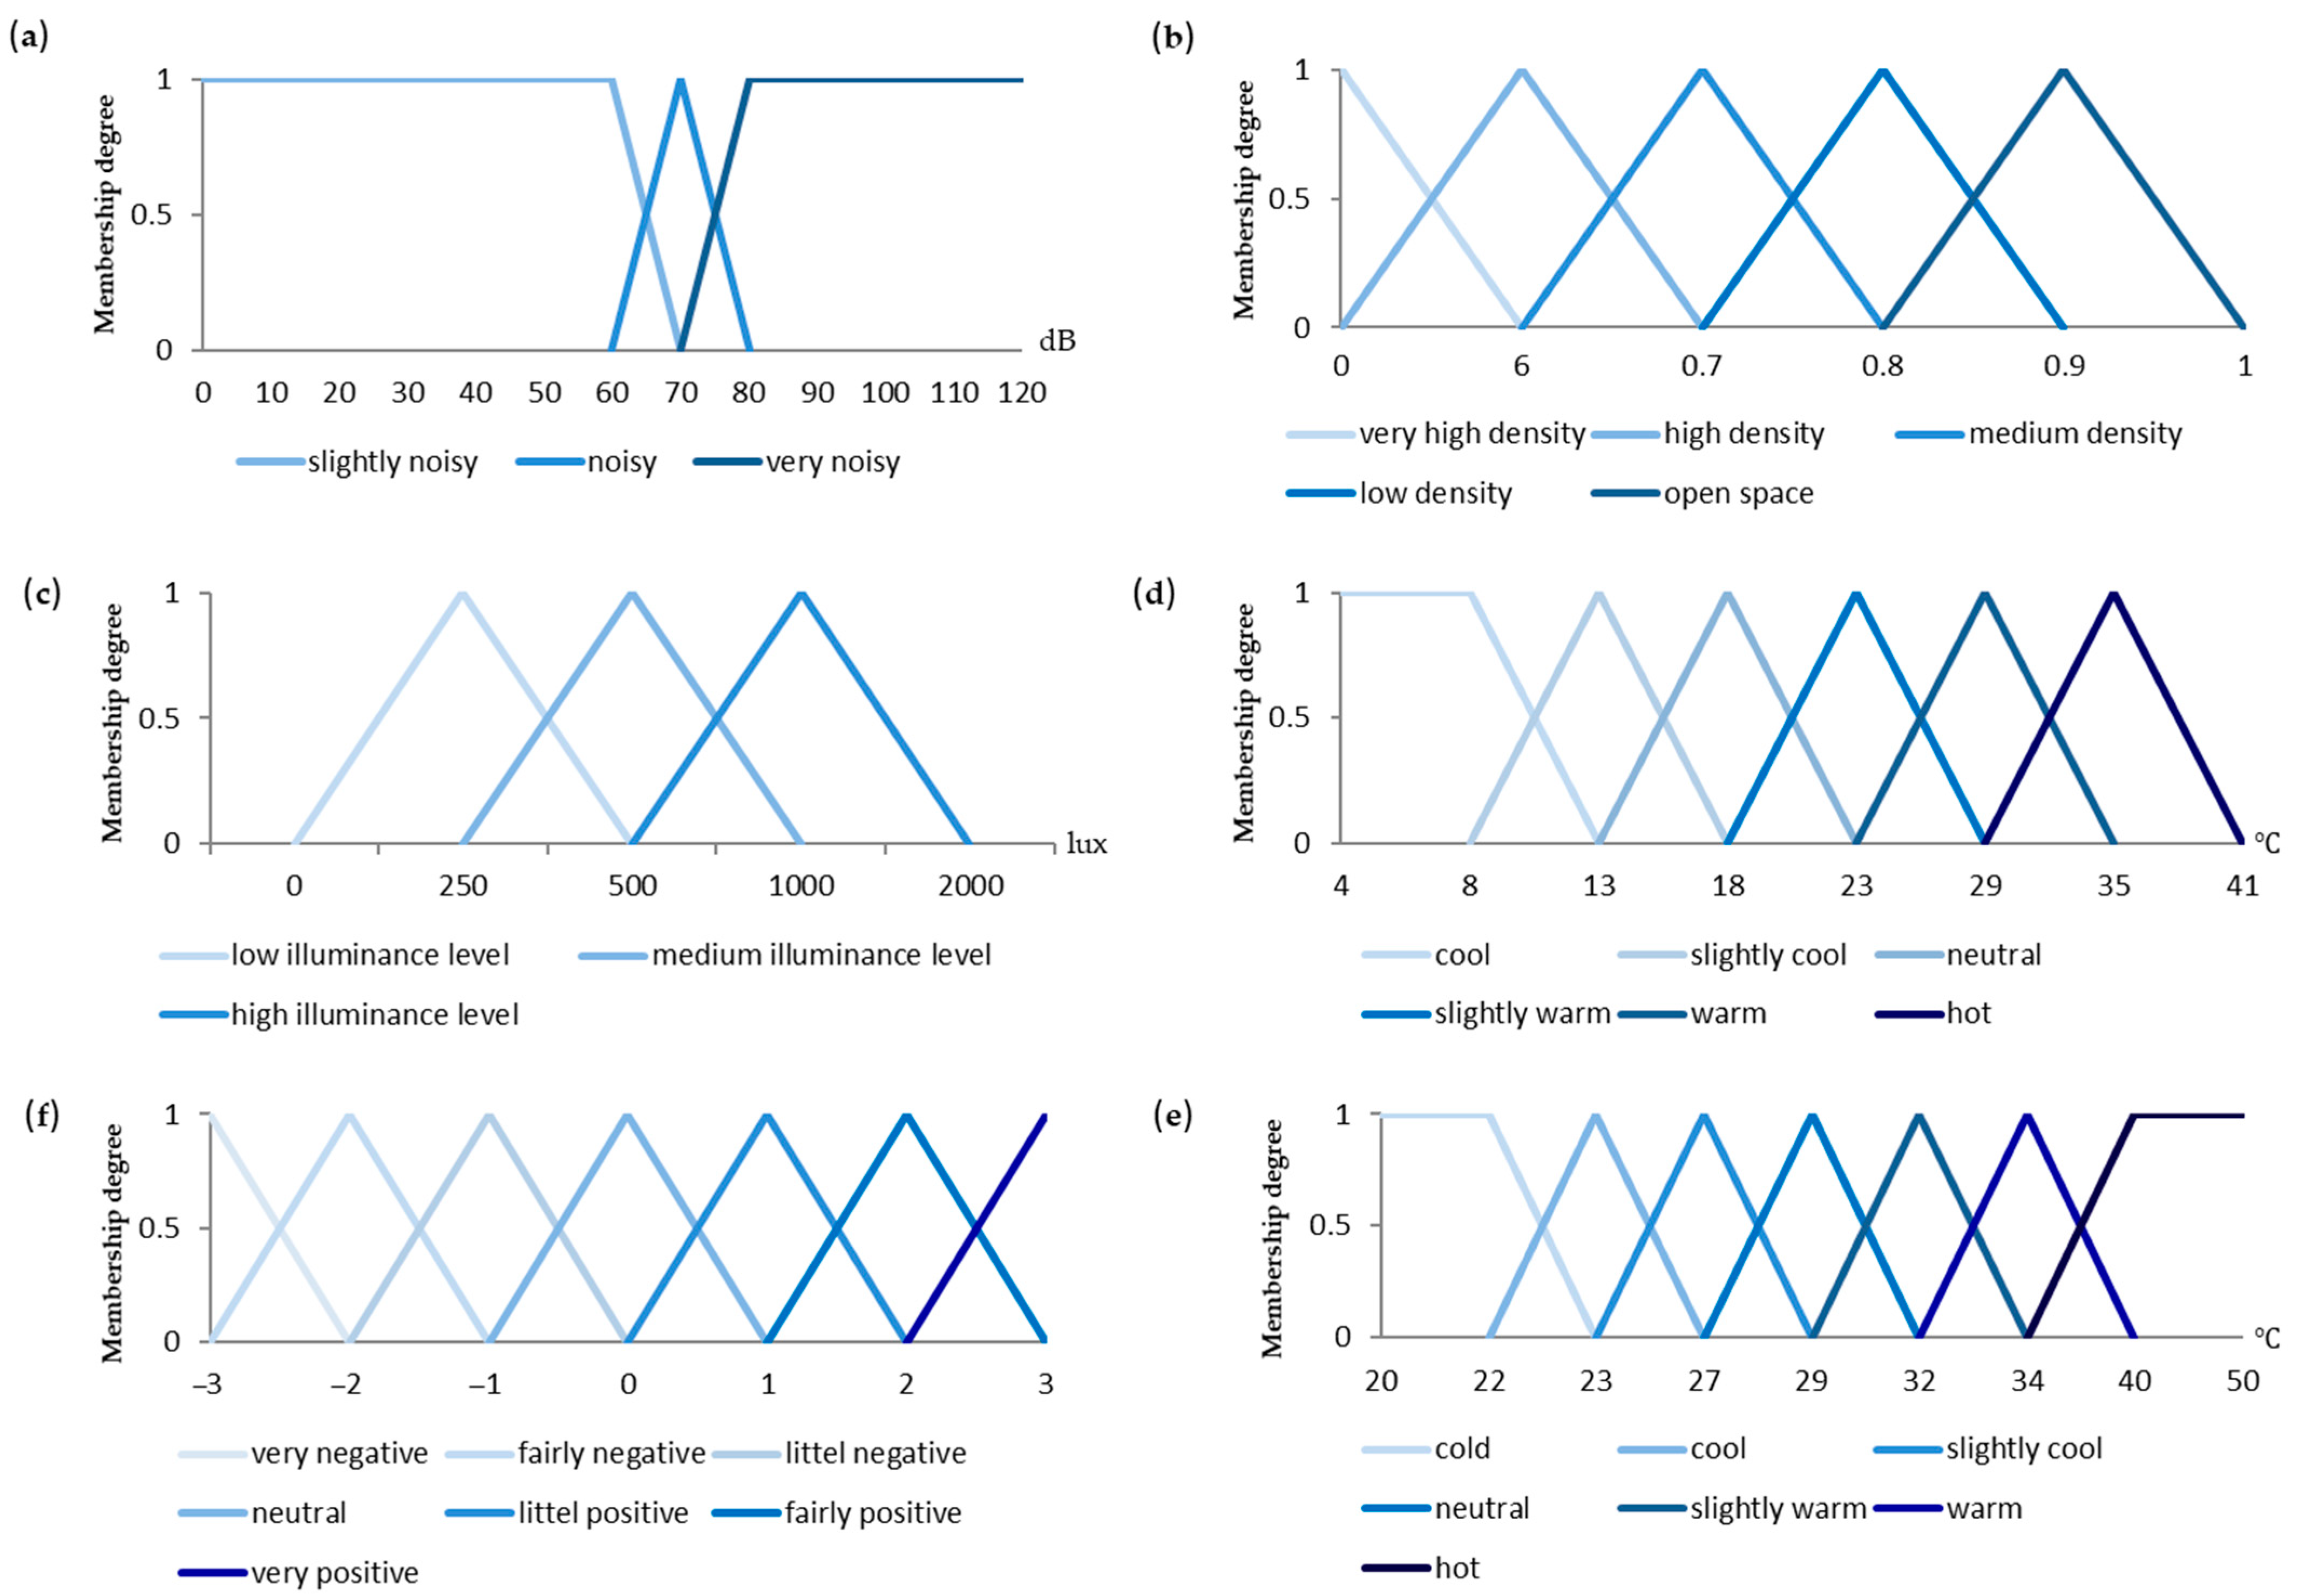
2.6. Fuzzy Logic Model

In urban planning, fuzzy logic, FL, has been deemed an effective tool in spatial evaluation. It can treat different memberships for complex uncertainty-related topics when addressing urban sustainability factors [39] and help make wise decisions [42]. The construction of the model encompasses four main steps: fuzzification, creating the rules, inference, and defuzzification [43]. In this study, the model was developed using the MATLAB software.
The fuzzification step represents the modeling of the input and output based on reference values obtained from previous studies. In light of this, the linguistic classification of the membership function of the equivalent sound pressure level (Leq) was taken from a study evaluating noise pollution’s impact on people’s health [44]. The physiologically equivalent temperature (PET) membership function was constructed based on a previous classification widely adopted in the literature [45]. The sky view factor (SVF) classification was inspired by research that explored the relationship between the sky view factor and land temperature [23]. Regarding illuminance, the linguistic classification was adapted from evaluating urban park lighting quality perception [29]. Finally, the mean radiant temperature (tMRT) was adjusted from a previous classification of the thermal comfort fuzzy logic model [46]. The membership functions of the input data were designed, as well as the three semantic items comfort, suitability, and mood that constituted the output variables, as shown in (Figure 4).
Rules production provided the relationships among the linguistic variables for both inputs and outputs, which was composed of precondition (If part) and consequence (Then part) [46]. In this case, the number of rules corresponded to the number of variations in the variables’ values, and the inference adopted was developed with the Mamdani’s fuzzy method (Table 4). The defuzzification consisted of translating the fuzzy output to the crisp value. The method employed in this model was centroid defuzzification.

3. Results

3.1. Physical Dimensions

Following the on-site measurements of thermal, luminous, and audible dimensions, descriptive statistics analyses were performed with the IBM SPSS V.29 software, and the results are presented in Table 5. The values of the SVF calculated at the different station measurements ranged from 0.458 to 0.998, with a mean of 0.71 and an SD of ±0.22. The notable difference in SVF values reflects the diversity in spatial morphology across the three areas. Concerning the thermal environment, the physiologically equivalent temperature (PET), varying between 20.7 °C and 32.2 °C, was generally considered as comfortable to slightly warm, with a mean of 27.8 °C and an SD of ±3.2 [45]. In addition, the mean radiant temperature (tMRT) ranged between 29.4 °C and 44.4 °C, with a mean value of 38.7 and an SD of ±3. The wide range of values in the thermal dimensions highlights the impact of morphology on thermal comfort. Additionally, orientation and tree cover can influence thermal sensation through direct sun exposure and shading. Regarding the luminous environment, the average illuminance measured was 1137.47 lux, with minimum and maximum values of 206 lux and 1880 lux, respectively, and an SD of ±627. This variation underscores the lack of light uniformity, which can adversely affect visual comfort [47]. The daylight glare probability (DGP) values ranged from 0.123 to 0.269, with a mean of 0.22 and a standard deviation (SD) of ±0.04. As the glare values did not exceed 0.4, the glare phenomenon may be not disturbing for users [16]. Regarding the audible environment, the sound equivalent level (Leq) values oscillated between 63.6 dB and 90.8 dB, with a mean of 71.8 and an SD of ±7.3. Based on the mean Leq, the sound environment was perceived as noisy, as its value exceeded 66 dB, which is the recommended limit for urban areas [48]. The noise climate (NC) values ranged from 8.5 dB and 21.4 dB, with a mean of 13.8 (±3.3). The notable values of the noise climate explain the gap between the background sound and the peak sound levels, suggesting that the peak levels may be considered as noise pollutants. Furthermore, the mean noise pollution level (Lnp) was 84.5 dB, with minimum and maximum values of 67.2 dB and 109 dB, respectively, and an SD of ±10.7. Considering the permissible limit for Lnp, which is 88 dB [32,49], the recorded values suggest that the sound environment was noisy, particularly given the maximum value of 109 dB, which significantly exceeded the allowable limit. Overall, the audible environment showed excessive values compared to the comfort thresholds, followed by the thermal environment. In contrast, the luminous environment values remained below the recommended limits, as illustrated in Figure 5.

3.2. Perceptual Dimensions

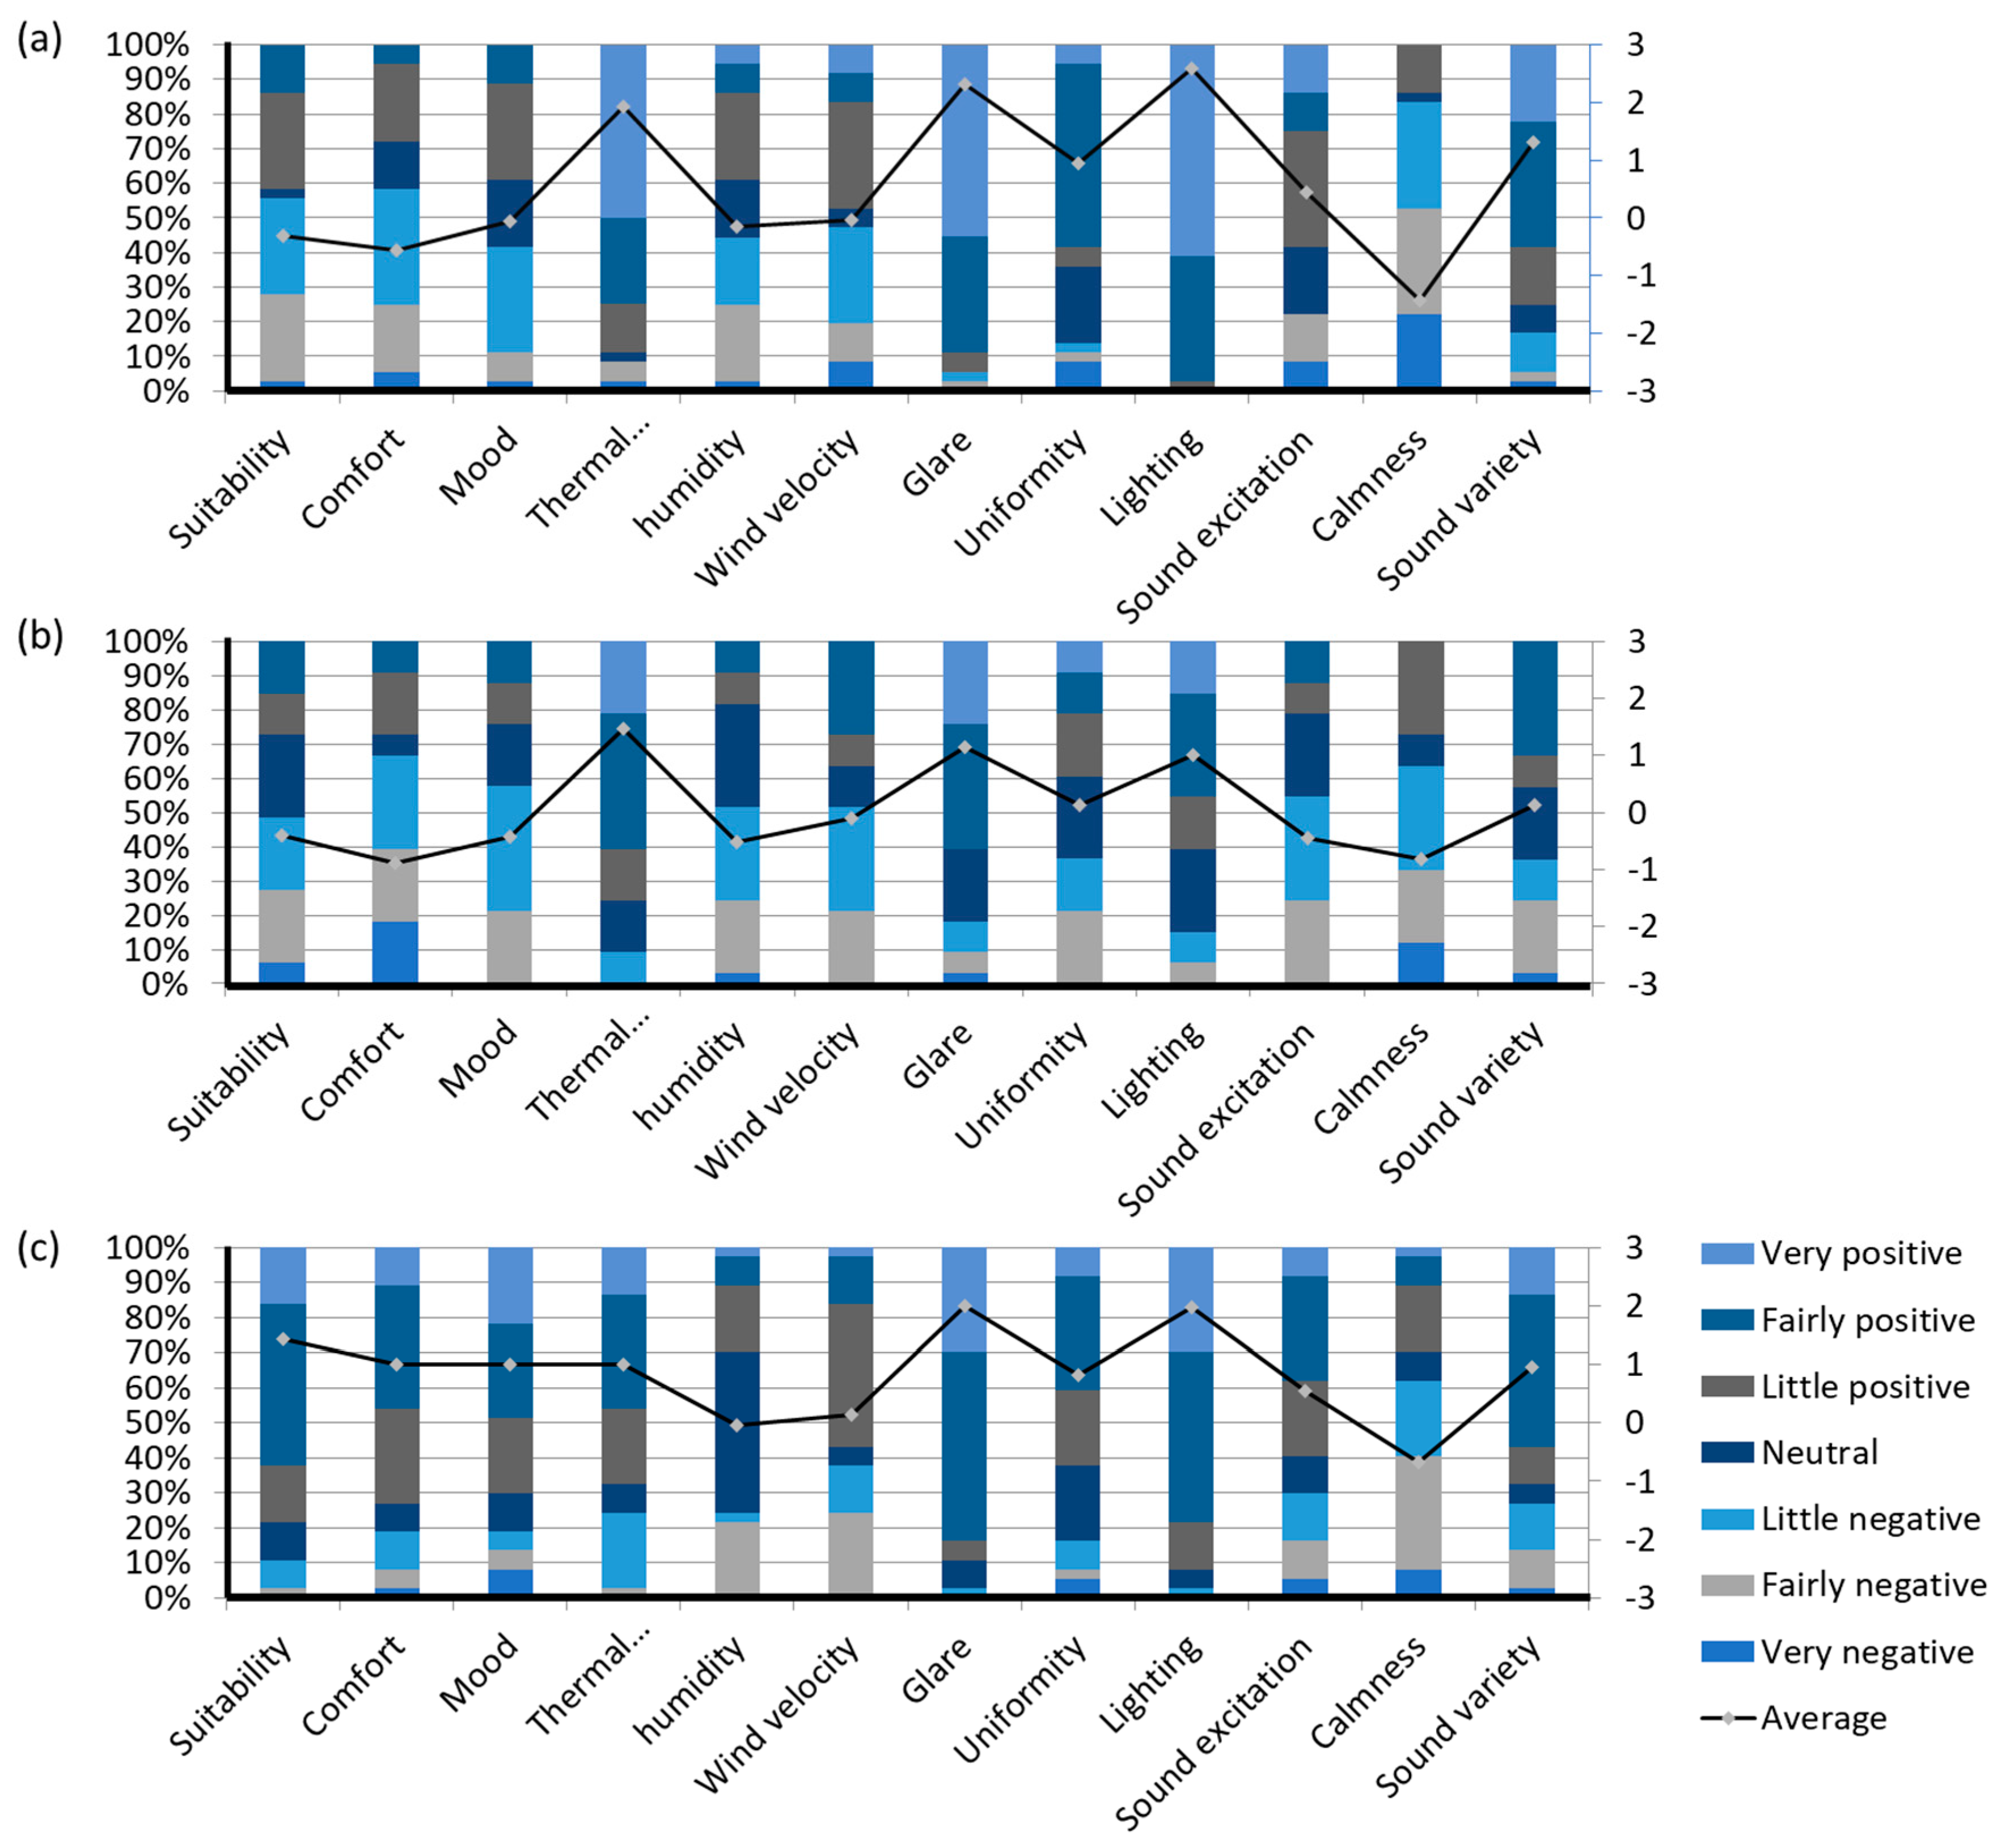
3.2.1. Overall Perception of the Space: Responses Analysis

To analyze the perceptual data, an analysis of the average scores and the percentage of the semantic difference was conducted after processing the descriptive statistics to examine the students’ perceptions across the three areas, as shown in Figure 6. Concerning the general perception of suitability, comfort, and mood, the first and the second spaces were perceived closely alike, with a little non-suitable, a little uncomfortable, and neutral for the mood, and a little non-suitable, relatively uncomfortable, and a little depressive, respectively. However, the third area was perceived as reasonably suitable, comfortable, and cheerful. Regarding the thermal sensation, the first area was perceived as very hot compared to the second and third spaces, which were perceived as reasonably hot. Regarding the luminous environment, the first and the third areas were perceived as significantly glared and light, while the second spaces were perceived as relatively glared and reasonably light. Regarding audible perception, the first and the third areas were perceived as reasonably chaotic, whereas the second space was perceived as a little chaotic.

3.2.2. General Perception Dependence: Ordinal Regression Model

Ordinal regression was performed to identify which semantics of the thermal, luminous, and audible environment perception influenced the suitability, comfort, and mood through the three areas, yielding the results reported in Table 6.
Regarding zone 1, the results indicate the dominance of thermal and sound factors influencing the suitability of spaces. In this zone, thermal sensation (p = 0.01) and noise excitation (p = 0.006) were critical factors, showing that extreme temperatures and noise levels directly affected the usability perception of the space. This indicates that excessive heat caused significant discomfort, confirming Nikolopoulou and Steemers’ previous study associating high temperatures with lower space usability [50]. In terms of noise levels, relaxation was affected, reducing the suitability of the space for recreational activities. Furthermore, the results show that thermal sensation was the only predictor of comfort (p = 0.013), underlining the preponderant influence of thermal stress in zone 1. This suggests that thermal conditions were the primary determinant of overall comfort and could be more important than other environmental factors. Emotional ambience, however, was influenced by the uniformity of light (p = 0.011) and sound excitation (p = 0.000). This confirms that non-uniform lighting probably caused visual discomfort, reducing positive emotional responses, in line with research associating uniform light with relaxation and safety [47]. Furthermore, the strong association between noise excitation and emotional ambience (p = 0.000) indicates that noise not only affected the space’s suitability but also detracted from its emotional atmosphere.
Regarding zone 2, the suitability and comfort in this area were influenced by a combination of thermal sensation, light uniformity, sound excitation, and calmness, with additional impacts from lighting conditions (dark/light), representing the contrast phenomena on suitability and glare on comfort. Direct sun exposure likely exacerbated heat stress, consistent with studies on the effects of solar radiation on outdoor comfort [51]. Light uniformity positively influenced perceptions, enhancing the sense of suitability, while glare detracted from comfort, emphasizing the need for balanced lighting solutions. The auditory environment showed a dual impact, where noise from nearby traffic or parking areas conflicted with moments of calmness provided by wind or quieter intervals, reflecting a complex soundscape. These diverse factors highlight the vulnerability of this space to environmental challenges because its open orientation and proximity to noise sources created a challenging environment for users.
Regarding zone 3, wind speed (p = 0.03) and light uniformity (p = 0.01) were identified as significant predictors of suitability, highlighting their positive contribution to the usability of the outdoor space. Perceived wind likely enhanced comfort and usability by providing natural cooling and masking unwanted noise, consistent with findings on the role of wind in enhancing outdoor experiences [52]. Similarly, uniform lighting enhances security and appropriateness, particularly in shaded areas. Comfort was strongly influenced by calmness (p = 0.001), underlining the essential role of a calm auditory environment in promoting comfort, as confirmed by the findings of Kang and Zhang [14]. The mood was influenced by wind speed (p = 0.026) and sound excitation (p = 0.000). The wind positively impacted mood by improving thermal and auditory conditions. At the same time, the strong association with sound excitation underlined the direct influence of auditory stimulation, whether pleasant or intrusive, on emotional responses. These results underline the importance of integrating the elements of wind and light while minimizing auditory disturbance to create more comfortable, emotionally supportive outdoor spaces.

3.3. Correlation Analysis

Figure 7 illustrates the interrelationships network, highlighting significant correlations between physical and perceptual dimensions across Kendall’s tau-b, Pearson’s, and Spearman’s analyses.
The results of Kendall’s tau-b correlation analysis reveal statistically significant relationships between certain perceptual dimensions. A weak but significant correlation was found between humidity sensation and glare perception (τ = 0.162, p < 0.05). Similarly, a weak yet statistically significant correlation was observed between calmness and wind conditions (τ = 0.185, p < 0.05).
However, Pearson’s correlation shows significant interactions between physical dimensions. Surface temperature (Ts) exhibited weak correlations with illuminance (r = 0.213, p < 0.05) and the uniformity coefficient (UC) (r = 0.217, p < 0.05), indicating limited influence on these luminous parameters. Similarly, wind velocity (V) strongly correlated with the equivalent sound pressure level (Leq) (r = 0.743, p < 0.01), noise climate (NC) (r = 0.455, p < 0.01), and noise pollution level (Lnp) (r = 0.677, p < 0.01), highlighting its role in shaping the acoustic environment. Illuminance (Illum) demonstrated a strong correlation with the sky view factor (SVF) (r = 0.801, p < 0.01) while also showing moderate associations with thermal variables such as the mean radiant temperature (tMRT) (r = 0.199, p < 0.05) and predicted mean vote (PET) (r = 0.226, p < 0.05). Interestingly, illuminance showed a negative correlation with Leq (r = −0.340, p < 0.01) and Lnp (r = −0.236, p < 0.05), indicating potential trade-offs between luminous and acoustic environments. Furthermore, SVF strongly correlated with the daylight glare probability (DGP) (r = 0.698, p < 0.01) and UC (r = 0.850, p < 0.01), suggesting its critical role in luminous uniformity and glare.
Thermal dimensions also displayed noteworthy relationships. The mean radiant temperature (tMRT) negatively correlated with NC (r = −0.315, p < 0.01) and Lnp (r = −0.227, p < 0.05), while PET exhibited strong negative correlations with Leq (r = −0.539, p < 0.01), NC (r = −0.322, p < 0.01), and Lnp (r = −0.489, p < 0.01). PET also had a weak positive correlation with DGP (r = 0.238, p < 0.05), linking thermal comfort to glare perception. Acoustic and luminous dimensions showed important interactions. Leq negatively correlated with DGP (r = −0.332, p < 0.01) and UC (r = −0.196, p < 0.05), indicating that high sound levels may reduce luminous comfort. NC was positively correlated with DGP (r = 0.265, p < 0.01) and UC (r = 0.363, p < 0.01), reinforcing its influence on visual parameters. Lastly, Lnp showed a weak negative correlation with DGP (r = −0.219, p < 0.05), further linking acoustic and luminous dimensions.
The results of Spearman’s correlation analysis indicate several significant relationships between perceptual and physical dimensions. Thermal sensation was positively correlated with surface temperature (Ts) (r = 0.288, p < 0.01), wind velocity (r = 0.282, p < 0.01), illuminance (r = 0.283, p < 0.01), the sky view factor (SVF) (r = 0.373, p < 0.01), daylight glare probability (DGP) (r = 0.278, p < 0.01), and the uniformity coefficient (UC) (r = 0.203, p < 0.05). These correlations suggest that a higher surface temperature, wind velocity, and illuminance levels, as well as more open sky exposure and higher daylight glare probability, intensify thermal sensation. Uniformity also played a subtle role in influencing thermal sensation. Conversely, humidity perception had a negative correlation with surface temperature (r = −0.236, p < 0.05), indicating that higher surface temperatures may reduce the perception of humidity.
In the realm of sound perception, wind velocity exhibited a weak negative correlation with sound excitation (r = −0.237, p < 0.05), suggesting that higher wind velocity slightly dampens the perception of sound excitation. Additionally, the equivalent sound pressure level (Leq) showed a weak positive correlation with sound variety (r = 0.191, p < 0.05), indicating that higher sound levels marginally increase the perception of sound variety.
For glare perception, significant positive correlations were observed with illuminance (r = 0.334, p < 0.01), daylight glare probability (r = 0.325, p < 0.01), and uniformity coefficient (r = 0.329, p < 0.01). These findings indicate that higher illuminance, DGP, and uniformity contribute to increased glare perception. Meanwhile, lighting perception was strongly associated with illuminance (r = 0.446, p < 0.01), daylight glare probability (r = 0.441, p < 0.01), and the uniformity coefficient (r = 0.515, p < 0.01), with a moderate correlation with the sky view factor (r = 0.267, p < 0.01). These results suggest that uniformity, illuminance, and DGP are critical factors in shaping perceptions of lighting and glare.

4. Discussion

The physical dimensions of the environment are considered a significant criterion in assessing the quality of urban spaces [10,53]. The descriptive statistics of the physical dimensions suggest that the thermal perception based on PET balanced between comfortable without thermal stress and warm with moderate heat stress [45]. In addition, based on the measured illuminance values, the luminous environment in terms of daylight was classified as beneficial [54,55,56]. Concerning the audible environment, the soundscape was considered slightly noisy to very noisy due to the Leq values, which balanced between 63 dB and 90.8 dB [44]. The findings from the descriptive statistics of the participant responses mention that the three recreational spaces in the university were perceived differently in terms of general perception (suitability, comfort, and mood). Hence, the third area was perceived as more suitable, comfortable, and cheerful than the first and second spaces.
To provide a comprehensive clarification about the reasons for this difference, an ordinal regression was carried out to reveal the impact of the environmental components on the general perception. As a result, different factors contributed to the difference in the general perception of each area. Thermal sensation affected suitability and comfort in the first and second spaces, where the average was around very hot. In contrast to the third space, which was perceived as reasonably hot with an average near to a little hot, the thermal sensation effect was absent. A correlation between thermal sensation, the sky view factor, and surface temperature explains the variation in perception within the different spaces [23,57]. The audible perception significantly affected the general perception through the three areas by sound excitation and calmness, as well as the wind condition, which was perceived as an audible factor in the third space due to its relationship with calmness. The complex relationship among wind velocity, audible dimensions, calmness, sound excitation, and wind conditions can justify the effect of winds on audible perception [58,59]. Regarding the luminous perception, the light uniformity perception affected mood in the first area and suitability in the third area. Moreover, the correlation between the perceived and measured uniformity suggests a direct effect. Conforming to this, several studies have highlighted that light uniformity promotes relaxation and safety feeling [47,60].
The findings from the ordinal regression analysis also emphasize that the second area was affected by many factors, with numerous conditions causing its fragility. Spatial orientation may contribute to its vulnerability in terms of thermal and luminous environments owing to direct sun exposure [61]. The adjacency to the external wall of the faculty could also be a factor in this susceptibility [62]. Relating to the acoustic conditions, the proximity of the space to the university parking area and the direct and wide orientation to the high-traffic road W42 increase the possibility of its sensitivity [63]. This study revealed the significant impact of the audible environment in recreational space compared to the luminous and thermal environments. In support of this, previous studies in the literature have outlined similar results in assessments of indoor and outdoor environments [17,64].
Supporting the ordinal regression results, three types of correlations were conducted to explore the relationships between the various dimensions. For the physical dimensions, the sky view factor (SVF) was found to correlate with luminous dimensions (DGP, illuminance, and the uniformity coefficient), as well as with noise climate (NC). Similarly, surface temperature (Ts) exhibited a correlation with illuminance and the uniformity coefficient. The relationship between the SVF, luminous, and thermal dimensions has been demonstrated in previous studies [17,65]. Regarding wind velocity (v), its strong correlation with audible dimensions (NC, Lnp, and Leq) underscores its significant role in shaping the audible environment [58,59].
Regarding the perceptual dimensions, thermal sensation and humidity sensation had a correlation with thermal dimensions, the SVF, and luminous dimensions [66,67]. Additionally, luminous perception correlated with the measured luminous dimensions, particularly glare perception and uniformity perception, which were associated with daylight glare probability and the uniformity coefficient, respectively. In the audible environment, sound variety correlated with the equivalent sound pressure level (Leq), while sound excitation showed a correlation with sound variety and wind velocity. Calmness, on the other hand, was correlated with wind conditions. These findings suggest that wind plays a significant role in shaping the soundscape experience, as further supported by the strong correlation between wind velocity and all the aforementioned audible dimensions.
Due to the ambiguity and complexity of the multisensory interaction between the thermal, luminous, and audible environments, a multisensory fuzzy logic model was established to clarify the combined effect of these environments on the students’ perception. Based on this study’s results, this model predicted the users’ perceived experience. It should be noted that the precision of the model’s results relied on the number of rules.
The findings of this study offer several valuable insights for architects, urban planners, and designers. They provide a foundation for optimizing outdoor spaces on university campuses and beyond. By linking these results to the broader literature, we can highlight their practical significance and contribute to the evolution of user-centered design practices.
This study demonstrates the critical role of thermal perception in influencing user comfort and suitability, particularly in spaces with varying thermal sensations. Spaces with higher thermal stress (e.g., the first and second areas) were perceived as less comfortable, reinforcing the importance of mitigating thermal stress through design strategies. Practitioners can incorporate tree canopies, pergolas, or shade sails to reduce direct sun exposure, improving thermal comfort, as supported by Tablada et al. [68,69]. Orienting spaces to maximize natural ventilation could also be used to reduce heat buildup and enhance the thermal environment [50].
The findings also highlight the significant influence of the auditory environment on overall user perception, aligning with prior studies on soundscapes [14]. Noise from traffic and adjacent university facilities negatively impacted perceptions, while wind conditions in the third space were linked to improved calmness and auditory satisfaction. It is suggested that practitioners design buffers like vegetative screens or architectural barriers to mitigate noise pollution from high-traffic roads and parking areas. As Brown et al. noted, incorporating water features, wind chimes, or other calming auditory elements can enhance positive soundscapes [70]. Placing recreational areas farther from noise-generating facilities can improve auditory perception.
This study underscores the complexity of interactions between thermal, luminous, and auditory factors, with significant implications for the design of multisensory environments. Developing the fuzzy logic model provided an innovative tool for predicting user perceptions based on combined sensory inputs, addressing a critical gap in existing design practices.
A multisensory design is necessary to enhance the user experience in outdoor spaces, particularly within university campuses. This approach should integrate sensory evaluations, utilizing fuzzy logic models to predict and optimize user comfort by considering the complex interplay of thermal, luminous, and auditory stimuli. Furthermore, data-driven design should be employed. This involves collecting on-site data related to thermal comfort, lighting levels, and sound conditions. Complementing this quantitative approach, user engagement through participatory design processes is crucial.
While this research focused on university campuses, the findings have broader implications for the design of urban parks, plazas, and other recreational spaces. The identified principles advocate for incorporating urban greenery, such as trees and green infrastructure, to improve thermal and auditory conditions while simultaneously enhancing the aesthetic quality of the space and contributing to psychological well-being.
This research also stresses the importance of site-specific solutions. Recognizing the unique challenges of different spatial contexts, such as proximity to high-traffic roads, is crucial for developing tailored interventions. Finally, this study emphasizes the need for climate-sensitive design. Applying these findings across diverse climatic regions can enhance global urban design practices by providing strategies to address region-specific environmental challenges.

Limitations of the Study

This study significantly contributes to multisensory assessment in outdoor design, particularly in university recreational spaces. A notable strength lies in its mixed-methods approach, combining quantitative and qualitative methodologies to explore the influence of thermal, luminous, and auditory environments on students’ perceptions. By integrating field surveys with on-site environmental measurements, this research provides a comprehensive understanding of how environmental factors shape user experiences.
Moreover, introducing a fuzzy logic model to predict user perceptions marks a novel contribution. While previous studies often focused on individual environmental factors, this research applied fuzzy logic to a multisensory context, setting a new benchmark for predictive modeling in outdoor design. Consistency with earlier studies in terms of the methodology and findings further validates the credibility of the results despite differences in context and analytical approaches.
While this study presents several strengths, it is crucial to acknowledge its limitations to provide a balanced perspective. This research was conducted within the recreational spaces at Bordj Bou Arreridj University. This localized context may limit the generalizability of the findings to other university campuses with differing spatial, cultural, or environmental characteristics. For instance, the design and use of recreational spaces in regions with contrasting climates or cultural practices may yield different results.
This research was conducted over a short period in late April 2023. This limited time frame captured only a snapshot of environmental conditions and user perceptions, potentially excluding seasonal variations that could influence thermal, luminous, and auditory environments. Extended studies across different times of the year could provide a more holistic understanding of these factors. Furthermore, this study focused exclusively on thermal, luminous, and auditory environments, neglecting other sensory factors impacting user experiences. For example, olfactory stimuli, such as vegetation or nearby odor sources, are critical in shaping comfort and mood in outdoor spaces. Previous research emphasizes the importance of smellscapes in environmental perception, suggesting that future studies should incorporate this dimension for a more comprehensive multisensory assessment [71].
The sample consisted of 106 participants distributed across specific areas of the campus. While sufficient for preliminary analysis, a more extensive and diverse sample could enhance the robustness of the findings, capturing a broader range of user perceptions. Although the fuzzy logic model is a novel contribution, it relies on the quality and range of input data. The exclusion of certain environmental variables, such as wind speed or tactile factors, may constrain the model’s ability to fully predict user perceptions in complex outdoor settings.

5. Conclusions

This study aimed to provide a detailed understanding of students’ multisensory perceptions in a university’s recreational area, identifying which environments among the thermal, luminous, and audible environments have an interesting impact. The mixed method covers quantitative and qualitative approaches and was adopted to evaluate the relationship between physical dimensions and students’ perceptions across three different spaces. A series of statistical tests were used to process the collected data, and the results reported that the three areas were experienced differently, in addition to the second space, which was considered vulnerable due to its direct exposure to sunlight and noise sources. This study’s most influential environment was the audible environment, surpassing the thermal and luminous environments.
On the other hand, to explore the relationships between physical and perceptual dimensions, various types of correlation analyses were conducted, revealing a network of interrelationships between participants’ sensations and physical dimensions. The findings highlighted key factors such as wind velocity, the sky view factor, and illuminance in shaping thermal, luminous, and acoustic perceptions. These results underscore the importance of integrating such analyses into outdoor spatial design to optimize user comfort and experience.
This paper also provides a multisensory fuzzy logic model to predict users’ responses based on the results obtained from the data analysis. This model was developed using the MATLAB software, and the linguistic classifications of the membership functions were inspired by previous studies that utilized fuzzy logic. Finally, this research’s findings provide meaningful information about the multisensory interaction between thermal, luminous, and audible environments and their impact on students’ perceptions within the university’s recreational area.

Author Contributions

Conceptualization, H.T., D.B. and T.A.K.B.; methodology, D.B., T.A.K.B. and H.T.; software, H.T.; validation, H.T.; formal analysis, H.T., D.B., T.A.K.B., S.K. and M.M.G.; investigation, H.T.; resources, H.T., D.B., T.A.K.B. and S.K.; data curation, H.T. and S.K.; writing—original draft preparation, H.T., D.B., T.A.K.B., S.K. and M.M.G.; writing—review and editing, H.T., D.B., T.A.K.B., S.K. and M.M.G.; visualization, H.T.; supervision, D.B., T.A.K.B. and S.K.; project administration, D.B., T.A.K.B., and S.K.; funding acquisition, H.T., D.B., T.A.K.B., S.K. and M.M.G. All authors have read and agreed to the published version of the manuscript.

Funding

We thank the Vice Presidency for Graduate Studies, Research & Business at Dar Al-Hekma University in Jeddah, Saudi Arabia for funding this research project and for offering their technical support.

Institutional Review Board Statement

Not applicable.

Informed Consent Statement

Not applicable.

Data Availability Statement

The data presented in this study are available on request from the corresponding author.

Conflicts of Interest

The authors declare no conflicts of interest.

References

  1. Li, S.; Zhang, Y.; Zhang, Q.; Xue, P.; Wu, H.; Xu, W.; Ye, J.; Chen, L.; He, T.; Zheng, Y. Exploring the Multi-Sensory Coupling Relationship of Open Space on a Winter Campus. Forests 2024, 15, 876. [Google Scholar] [CrossRef]
  2. Li, Y.; Wu, S.; Qiu, J.; Wei, T. Sustainable University Campuses: Temporal and Spatial Characteristics of Lightscapes in Outdoor Spaces. Sustainability 2024, 16, 7355. [Google Scholar] [CrossRef]
  3. Ning, S.; Jing, W.; Ge, Z. Sunlight perception and outdoor thermal comfort in college campuses: A new perspective. Sci. Rep. 2023, 13, 16112. [Google Scholar] [CrossRef] [PubMed]
  4. Ma, X.; Tian, Y.; Du, M.; Hong, B.; Lin, B. How to design comfortable open spaces for the elderly? Implications of their thermal perceptions in an urban park. Sci. Total Environ. 2021, 768, 144985. [Google Scholar] [CrossRef]
  5. Spence, C. Senses of place: Architectural design for the multisensory mind. Cogn. Res. Princ. Implic. 2020, 5, 46. [Google Scholar] [CrossRef] [PubMed]
  6. Vasilikou, C.; Nikolopoulou, M. Outdoor thermal comfort for pedestrians in movement: Thermal walks in complex urban morphology. Int. J. Biometeorol. 2020, 64, 277–291. [Google Scholar] [CrossRef]
  7. Gomaa, M.M.; Othman, E.; Mohamed, A.F.; Ragab, A. Quantifying the Impacts of Courtyard Vegetation on Thermal and Energy Performance of University Buildings in Hot Arid Regions. Urban Sci. 2024, 8, 136. [Google Scholar] [CrossRef]
  8. Li, G.; Liu, C.; He, Y. The effect of thermal discomfort on human well-being, psychological response and performance. Sci. Technol. Built Environ. 2021, 27, 960–970. [Google Scholar] [CrossRef]
  9. Santos Nouri, A.; Costa, J.P.; Santamouris, M.; Matzarakis, A. Approaches to outdoor thermal comfort thresholds through public space design: A review. Atmosphere 2018, 9, 108. [Google Scholar] [CrossRef]
  10. Xu, M.; Hong, B.; Jiang, R.; An, L.; Zhang, T. Outdoor thermal comfort of shaded spaces in an urban park in the cold region of China. Build. Environ. 2019, 155, 408–420. [Google Scholar] [CrossRef]
  11. Shooshtarian, S.; Rajagopalan, P.; Sagoo, A. A comprehensive review of thermal adaptive strategies in outdoor spaces. Sustain. Cities Soc. 2018, 41, 647–665. [Google Scholar] [CrossRef]
  12. Erfanian, M.; Mitchell, A.J.; Kang, J.; Aletta, F. The psychophysiological implications of soundscape: A systematic review of empirical literature and a research agenda. Int. J. Environ. Res. Public Health 2019, 16, 3533. [Google Scholar] [CrossRef] [PubMed]
  13. Fiebig, A.; Jordan, P.; Moshona, C.C. Assessments of acoustic environments by emotions–the application of emotion theory in soundscape. Front. Psychol. 2020, 11, 573041. [Google Scholar] [CrossRef]
  14. Kang, J.; Zhang, M. Semantic differential analysis of the soundscape in urban open public spaces. Build. Environ. 2010, 45, 150–157. [Google Scholar] [CrossRef]
  15. Boiné, K.; Demers, C.M.; Potvin, A. Spatio-temporal promenades as representations of urban atmospheres. Sustain. Cities Soc. 2018, 42, 674–687. [Google Scholar] [CrossRef]
  16. Berkouk, D.; Bouzir, T.A.K.; Boucherit, S.; Khelil, S.; Mahaya, C.; Matallah, M.E.; Mazouz, S. Exploring the Multisensory Interaction between Luminous, Thermal and Auditory Environments through the Spatial Promenade Experience: A Case Study of a University Campus in an Oasis Settlement. Sustainability 2022, 14, 4013. [Google Scholar] [CrossRef]
  17. Nitidara, N.P.A.; Sarwono, J.; Suprijanto, S.; Soelami, F.N. The multisensory interaction between auditory, visual, and thermal to the overall comfort in public open space: A study in a tropical climate. Sustain. Cities Soc. 2022, 78, 103622. [Google Scholar] [CrossRef]
  18. Sanchez, G.M.E.; Van Renterghem, T.; Sun, K.; De Coensel, B.; Botteldooren, D. Using Virtual Reality for assessing the role of noise in the audio-visual design of an urban public space. Landsc. Urban Plan. 2017, 167, 98–107. [Google Scholar] [CrossRef]
  19. Nie, X.; Wang, Y.; Zhang, C.; Zhao, Y.; Kirkwood, N. The varied restorative values of campus landscapes to students’ well-being: Evidence from a Chinese University. BMC Public Health 2024, 24, 487. [Google Scholar] [CrossRef]
  20. Ribeiro, H.; Santana, K.V.d.S.; Oliver, S.L. Natural Environments in University Campuses and Students’ Well-Being. Int. J. Environ. Res. Public Health 2024, 21, 413. [Google Scholar] [CrossRef] [PubMed]
  21. Boucherit, S.; Maffei, L.; Masullo, M.; Berkouk, D.; Bouzir, T.A.K. Assessment of sighted and visually impaired users to the physical and perceptual dimensions of an oasis settlement urban park. Sustainability 2023, 15, 7014. [Google Scholar] [CrossRef]
  22. Derdous, O.; Tachi, S.E.; Bouguerra, H. Spatial distribution and evaluation of aridity indices in Northern Algeria. Arid Land Res. Manag. 2021, 35, 1–14. [Google Scholar] [CrossRef]
  23. Scarano, M.; Sobrino, J. On the relationship between the sky view factor and the land surface temperature derived by Landsat-8 images in Bari, Italy. Int. J. Remote Sens. 2015, 36, 4820–4835. [Google Scholar] [CrossRef]
  24. Palinkas, L.A.; Aarons, G.A.; Horwitz, S.; Chamberlain, P.; Hurlburt, M.; Landsverk, J. Mixed method designs in implementation research. Adm. Policy Ment. Health Ment. Health Serv. Res. 2011, 38, 44–53. [Google Scholar] [CrossRef] [PubMed]
  25. Sun, S.; Xu, X.; Lao, Z.; Liu, W.; Li, Z.; García, E.H.; He, L.; Zhu, J. Evaluating the impact of urban green space and landscape design parameters on thermal comfort in hot summer by numerical simulation. Build. Environ. 2017, 123, 277–288. [Google Scholar] [CrossRef]
  26. Matallah, M.E.; Alkama, D.; Ahriz, A.; Attia, S. Assessment of the outdoor thermal comfort in oases settlements. Atmosphere 2020, 11, 185. [Google Scholar] [CrossRef]
  27. Antoniadis, D.; Katsoulas, N.; Papanastasiou, D.Κ. Thermal environment of urban schoolyards: Current and future design with respect to children’s thermal comfort. Atmosphere 2020, 11, 1144. [Google Scholar] [CrossRef]
  28. Hu, S.; He, M.; Liu, G.; Lu, M.; Liang, P.; Liu, F. Correlation between the visual evoked potential and subjective perception at different illumination levels based on entropy analysis. Build. Environ. 2021, 194, 107715. [Google Scholar] [CrossRef]
  29. Masullo, M.; Cioffi, F.; Li, J.; Maffei, L.; Ciampi, G.; Sibilio, S.; Scorpio, M. Urban Park Lighting Quality Perception: An Immersive Virtual Reality Experiment. Sustainability 2023, 15, 2069. [Google Scholar] [CrossRef]
  30. Bellia, L.; Cesarano, A.; Iuliano, G.F.; Spada, G. Daylight glare: A review of discomfort indexes. Vis. Qual. Energy Effic. Indoor Light. Today Tomorrow 2008, 31, 1–10. [Google Scholar]
  31. Yacine, S.M.; Noureddine, Z.; Piga, B.E.; Morello, E.; Safa, D. Towards a new model of light quality assessment based on occupant satisfaction and lighting glare indices. Energy Procedia 2017, 122, 805–810. [Google Scholar] [CrossRef]
  32. Kalawapudi, K.; Singh, T.; Vijay, R.; Goyal, N.; Kumar, R. Effects of COVID-19 pandemic on festival celebrations and noise pollution levels. Noise Mapp. 2021, 8, 89–93. [Google Scholar] [CrossRef]
  33. Hong, J.Y.; He, J.; Lam, B.; Gupta, R.; Gan, W.-S. Spatial audio for soundscape design: Recording and reproduction. Appl. Sci. 2017, 7, 627. [Google Scholar] [CrossRef]
  34. Hong, J.Y.; Jeon, J.Y. Comparing associations among sound sources, human behaviors, and soundscapes on central business and commercial streets in Seoul, Korea. Build. Environ. 2020, 186, 107327. [Google Scholar] [CrossRef]
  35. He, X.; An, L.; Hong, B.; Huang, B.; Cui, X. Cross-cultural differences in thermal comfort in campus open spaces: A longitudinal field survey in China’s cold region. Build. Environ. 2020, 172, 106739. [Google Scholar] [CrossRef]
  36. Li, B.; Liu, J.; Yao, R. Investigation and analysis on classroom thermal environment in winter in Chongqing. J. Heat. Vent. Air Cond. 2007, 37, 115–117. [Google Scholar]
  37. Fang, Z.; Zheng, Z.; Feng, X.; Shi, D.; Lin, Z.; Gao, Y. Investigation of outdoor thermal comfort prediction models in South China: A case study in Guangzhou. Build. Environ. 2021, 188, 107424. [Google Scholar] [CrossRef]
  38. Andrade, H.; Alcoforado, M.-J.; Oliveira, S. Perception of temperature and wind by users of public outdoor spaces: Relationships with weather parameters and personal characteristics. Int. J. Biometeorol. 2011, 55, 665–680. [Google Scholar] [CrossRef]
  39. Castilla, N.; Llinares, C.; Bisegna, F.; Blanca-Giménez, V. Affective evaluation of the luminous environment in university classrooms. J. Environ. Psychol. 2018, 58, 52–62. [Google Scholar] [CrossRef]
  40. Portnov, B.A.; Saad, R.; Trop, T.; Kliger, D.; Svechkina, A. Linking nighttime outdoor lighting attributes to pedestrians’ feeling of safety: An interactive survey approach. PLoS ONE 2020, 15, e0242172. [Google Scholar] [CrossRef]
  41. Axelsson, Ö.; Nilsson, M.E.; Berglund, B. A principal components model of soundscape perception. J. Acoust. Soc. Am. 2010, 128, 2836–2846. [Google Scholar] [CrossRef] [PubMed]
  42. Hanoon, S.K.; Abdullah, A.F.; Shafri, H.Z.; Wayayok, A. Comprehensive vulnerability assessment of urban areas using an integration of fuzzy logic functions: Case study of Nasiriyah City in South Iraq. Earth 2022, 3, 699–732. [Google Scholar] [CrossRef]
  43. Pedrycz, W.; Gomide, F. Fuzzy Systems Engineering: Toward Human-Centric Computing; John Wiley & Sons: Hoboken, NJ, USA, 2007. [Google Scholar]
  44. Bressane, A.; Mochizuki, P.S.; Caram, R.M.; Roveda, J.A.F. A system for evaluating the impact of noise pollution on the population’s health. Cad. De Saude Publica 2016, 32, e00021215. [Google Scholar]
  45. Matzarakis, A.; Mayer, H.; Iziomon, M.G. Applications of a universal thermal index: Physiological equivalent temperature. Int. J. Biometeorol. 1999, 43, 76–84. [Google Scholar] [CrossRef] [PubMed]
  46. Feriadi, H.; Hien, W.N. Modelling thermal comfort for tropics using fuzzy logic. In Proceedings of the Building Simulation, Eindhoven, The Netherlands, 11–14 August 2003; pp. 323–330. [Google Scholar]
  47. Wänström Lindh, U.; Jägerbrand, A.K. Perceived lighting uniformity on pedestrian roads: From an architectural perspective. Energies 2021, 14, 3647. [Google Scholar] [CrossRef]
  48. Al-Ghonamy, A. Analysis and evaluation of road traffic noise in Al-Dammam: A business city of the eastern province of KSA. J. Environ. Sci. Technol. 2010, 3, 47–55. [Google Scholar] [CrossRef]
  49. Robinson, D.W. The concept of noise pollution level. J. Occup. Environ. Med. 1971, 13, 602. [Google Scholar] [CrossRef]
  50. Nikolopoulou, M.; Steemers, K. Thermal comfort and psychological adaptation as a guide for designing urban spaces. Energy Build. 2003, 35, 95–101. [Google Scholar] [CrossRef]
  51. Spagnolo, J.; De Dear, R. A field study of thermal comfort in outdoor and semi-outdoor environments in subtropical Sydney Australia. Build. Environ. 2003, 38, 721–738. [Google Scholar] [CrossRef]
  52. Beranek, L.L.; Blackstock, D.T. Acoustics, 1986 Edition by Leo L. Beranek; Acoustical Society of America: Melville, NY, USA, 1988. [Google Scholar]
  53. Yilmaz, S.; Külekçi, E.A.; Mutlu, B.E.; Sezen, I. Analysis of winter thermal comfort conditions: Street scenarios using ENVI-met model. Environ. Sci. Pollut. Res. 2021, 28, 63837–63859. [Google Scholar] [CrossRef] [PubMed]
  54. Nabil, A.; Mardaljevic, J. Useful daylight illuminances: A replacement for daylight factors. Energy Build. 2006, 38, 905–913. [Google Scholar] [CrossRef]
  55. Michael, A.; Heracleous, C. Assessment of natural lighting performance and visual comfort of educational architecture in Southern Europe: The case of typical educational school premises in Cyprus. Energy Build. 2017, 140, 443–457. [Google Scholar] [CrossRef]
  56. Reinhart, C.F.; Mardaljevic, J.; Rogers, Z. Dynamic daylight performance metrics for sustainable building design. Leukos 2006, 3, 7–31. [Google Scholar] [CrossRef]
  57. Liu, Y.; Yu, Z.; Song, Y.; Yu, X.; Zhang, J.; Song, D. Psychological influence of sky view factor and green view index on daytime thermal comfort of pedestrians in Shanghai. Urban Clim. 2024, 56, 102014. [Google Scholar] [CrossRef]
  58. Fluitt, K.F.; Mermagen, T.J.; Letowski, S.; Letowski, T. Auditory Perception in an Open Space: Detection and Recognition; Army Research Laboratory (US): Adelphi, MD, USA, 2015. [Google Scholar]
  59. Daugintis, R. Effect of Wind on Self-Audition of Human Voice. Master’s Thesis, Aalto University, Espoo, Finland, 2021. [Google Scholar]
  60. Stokkermans, M.; Vogels, I.; de Kort, Y.; Heynderickx, I. A Comparison of Methodologies to Investigate the Influence of Light on the Atmosphere of a Space. Leukos 2018, 14, 167–191. [Google Scholar] [CrossRef]
  61. Hegazy, I.R.; Qurnfulah, E.M. Thermal comfort of urban spaces using simulation tools exploring street orientation influence of on the outdoor thermal comfort: A case study of Jeddah, Saudi Arabia. Int. J. Low-Carbon Technol. 2020, 15, 594–606. [Google Scholar] [CrossRef]
  62. Yuan, J.; Masuko, S.; Shimazaki, Y.; Yamanaka, T.; Kobayashi, T. Evaluation of outdoor thermal comfort under different building external-wall-surface with different reflective directional properties using CFD analysis and model experiment. Build. Environ. 2022, 207, 108478. [Google Scholar] [CrossRef]
  63. Paiva, K.M.; Cardoso, M.R.A.; Zannin, P.H.T. Exposure to road traffic noise: Annoyance, perception and associated factors among Brazil’s adult population. Sci. Total Environ. 2019, 650, 978–986. [Google Scholar] [CrossRef]
  64. Yang, W.; Moon, H.J. Combined effects of acoustic, thermal, and illumination conditions on the comfort of discrete senses and overall indoor environment. Build. Environ. 2019, 148, 623–633. [Google Scholar] [CrossRef]
  65. Guedouh, M.S.; Zemmouri, N. Courtyard building’s morphology impact on thermal and luminous environments in hot and arid region. Energy Procedia 2017, 119, 153–162. [Google Scholar] [CrossRef]
  66. Chinazzo, G.; Pastore, L.; Wienold, J.; Andersen, M. A field study investigation on the influence of light level on subjective thermal perception in different seasons. In Proceedings of the tenth Windsor Conference, Windsor Great Park, UK, 12–15 April 2018; pp. 12–15. [Google Scholar]
  67. Yang, W.; Moon, H.J. Cross-modal effects of illuminance and room temperature on indoor environmental perception. Build. Environ. 2018, 146, 280–288. [Google Scholar] [CrossRef]
  68. Tablada, A.; Carmeliet, J.; Baelmans, M.; Saelens, D. Exterior louvers as a passive cooling strategy in a residential building. In Proceedings of the 26th Conference on Passive and Low Energy Architecture, Quebec City, QC, Canada, 22–24 June 2009. [Google Scholar]
  69. Tablada, A.; De Troyer, F.; Blocken, B.; Carmeliet, J.; Verschure, H. On natural ventilation and thermal comfort in compact urban environments–the Old Havana case. Build. Environ. 2009, 44, 1943–1958. [Google Scholar] [CrossRef]
  70. Brown, A.L. Advancing the concepts of soundscapes and soundscape planning. In Proceedings of the Conference of the Australian Acoustical Society (Acoustics 2011), Gold Coast, Australia, 2–4 November 2011. [Google Scholar]
  71. Henshaw, V. Urban Smellscapes: Understanding and Designing City Smell Environments; Routledge: London, UK, 2013. [Google Scholar]
Figure 1. Case study area: (a) Bordj Bou Arreridj BBA localization, (b) university localization, (c) Bordj Bou Arreridj University.
Atmosphere 16 00150 g001
Figure 2. Distribution of measurement stations.
Atmosphere 16 00150 g002
Figure 3. Methodological framework.
Atmosphere 16 00150 g003
Figure 4. Membership functions: (a) Leq. (b) SVF. (c) Illuminance. (d) PET. (e) tMRT. (f) Participant responses (output).
Atmosphere 16 00150 g004
Figure 5. Minimum, maximum, and mean of PET, Leq, Lnp, and DGP values compared to the permissible limits.
Atmosphere 16 00150 g005
Figure 6. Average scores and percentage of semantic difference analysis. (a) First area, (b) second area, and (c) third area.
Atmosphere 16 00150 g006
Figure 7. Interrelationships network between the main influencer variables.
Atmosphere 16 00150 g007
Table 1. Measurement stations information.
AreasStationsImage TypeTime RangeRecording Duration (min)Factors MeasuredStation Elevation (m)
Area 11, 2-SVF Hemispherical Image
-HDR image
12:30–12:403 min per stationTs, Ta, RH, V, SPL, Illuminance1.5 m above the ground
Area 23–812:50–13:40
Area 39–1113:50–14:10
Table 2. Questionnaire used in the subjective assessment.
Environments VeryFairlyLittleNeutralLittleFairlyVery
General perceptionUncomfortable−3−2−10123Comfortable
Not-suitable−3−2−10123Suitable
Depressive−3−2−10123Cheerful
Thermal environmentCold−3−2−10123Hot
Dry−3−2−10123Humid
Windy−3−2−10123Mild
Luminous environmentNo glare−3−2−10123Glare
Non-uniform−3−2−10123Uniform
dark−3−2−10123light
Audible environmentMonotonous−3−2−10123Exciting
Chaotic−3−2−10123Calm
simple−3−2−10123varied
Table 3. Descriptive statistics of participants by gender and age.
StatisticTotalMalesFemales
Number of Participants1065848
Minimum Age181818
Maximum Age464645
Mean Age21.8522.3621.25
Standard Deviation4.614.594.606
Table 4. If–then rules of the fuzzy logic model.
Rules IlluminanceSVFPETLeqtMRT SuitabilityComfortMood
1IfHighOpen spaceSlightly warmNoisyHotThenLittle not suitableLittle uncomfortableLittle depressive
2IfHighOpen spaceSlightly warmNoisyHotThenFairly not suitableFairly uncomfortableLittle depressive
3IfHighMedium densityNeutralNoisyHotThenLittle not suitableLittle uncomfortableLittle depressive
4IfLowMedium densitySlightly coolVery noisyWarmThenFairly not suitableFairly uncomfortableLittle depressive
5IfMediumHigh densitySlightly warmNoisyHotThenLittleLittle uncomfortableLittle depressive
suitable
6IfLowMedium densitySlightly warmNoisyHotThenLittleLittle comfortableLittle cheerful
suitable
7IfHighOpen spaceSlightly warmNoisyHotThenLittle not suitableVery uncomfortableLittle depressive
8IfMediumVery high densityWarmNoisyHotThenFairly suitableLittle comfortableLittle cheerful
9IfHighHigh densitySlightly warmNoisyHotThenFairly suitableFairly comfortableFairly cheerful
10IfMediumVery high densitySlightly warmNoisyHotThenFairly suitableLittle comfortableFairly cheerful
11IfMediumVery high densityNeutralNoisyNeutralThenVery
suitable
Fairly comfortableLittle depressive
12IfLowHigh densityNeutralNoisyNeutralThenLittle
suitable
Little comfortableLittle cheerful
13IfLowHigh densitySlightly coolNoisyNeutralThenLittle not suitableFairly comfortableNeutral
Table 5. Descriptive statistics of the physical dimensions.
VariablesObsMinimumMaximumMeanSD
Thermal environmentSVF110.4580.9980.710.22
PET (°C)1120.732.227.83.2
tMRT (°C)1129.444.438.73
Luminous environmentDGP110.1230.2690.220.04
Luminance (lux)1120618801137.47627
Audible environmentLeq (dB)1163.690.871.87.3
NC (dB)118.521.413.83.3
Lnp (dB)1167.210984.510.7
Table 6. Ordinal regression results.
Area 1Area 2Area 3
Dependent VariablesPredictorsp ValueModel InfoPredictorsp ValueModel InfoPredictorsp ValueModel Info
SuitabilityThermal sensation0.01Model Fitting sig = 0.000
pR2 = 1
Parallel lines test = 1
thermal sensation
uniformity
0.000
0.018
Model Fitting sig = 0.000
pR2 = 0.635
Parallel lines test = 1
wind condition
uniformity
0.03
0.01
Model Fitting sig = 0.05
pR2 = 0.397
Parallel lines test = 0.105
Sound excitation0.006lighting
sound excitation
0.034
0.033
calmness0.013
ComfortThermal sensation0.013Model Fitting sig = 0.000
pR2 = 1
Parallel lines test = 1
thermal sensation
glare
0.006
0.013
Model Fitting sig = 0.012
pR2 = 0.491
Parallel lines test = 0.99
calmness0.001Model Fitting sig = 0.003
pR2 = 0.519
Parallel lines test = 0.998
uniformity
sound excitation
0.033
0.027
calmness0.021
MoodUniformity0.011Model Fitting sig = 0.000
pR2 = 0.939
Parallel lines test = 0.68
glare0.026Model Fitting sig = 0.037
pR2 = 0.478
Parallel lines test = 1
wind condition0.026Model Fitting sig = 0.033
pR2 = 0.4
Parallel lines test = 0.925
Sound excitation0.000calmness0.012sound excitation0.026
Disclaimer/Publisher’s Note: The statements, opinions and data contained in all publications are solely those of the individual author(s) and contributor(s) and not of MDPI and/or the editor(s). MDPI and/or the editor(s) disclaim responsibility for any injury to people or property resulting from any ideas, methods, instructions or products referred to in the content.

