Article

Exploring the Holiday Effect on Elevated Traffic-Related Air Pollution with Hyperlocal Measurements in Chengdu, China

1
State Key Laboratory of Pollution Control and Resource Reuse, Tongji University, Shanghai 200092, China
2
College of Environmental Science and Engineering, Tongji University, Shanghai 200092, China
3
School of Customs and Public Administration, Shanghai Customs College, Shanghai 201204, China
4
School of Environment, State Key Joint Laboratory of Environment Simulation and Pollution Control, Tsinghua University, Beijing 100084, China
5
Shanghai Urban Investment Ring Expressway Construction and Development Co., Ltd., No. 3066, Huaxu Highway, Qingpu District, Shanghai 201804, China
6
The Key Laboratory of Road and Traffic Engineering, Ministry of Education, Tongji University, 4800 Caoan Road, Shanghai 201804, China
*
Authors to whom correspondence should be addressed.
These authors contributed equally to this work.
Atmosphere 2025, 16(2), 171; https://doi.org/10.3390/atmos16020171
Submission received: 8 January 2025 / Revised: 27 January 2025 / Accepted: 29 January 2025 / Published: 2 February 2025

Abstract

:
Traffic-related air pollutants (TRAPs) pose significant health risks in megacities, yet fixed monitoring sites often fail to capture their complexity. To characterize the TRAP concentrations which fixed sites cannot address, we employed a mobile platform to effectively capture real-time hyperlocal-scale TRAP variations in Chengdu, China. A 17-day sampling campaign was conducted covering the National Holiday of China and collected ~1.2 × 10⁵ 1 Hz paired data. We measured particle number concentration (PNC), black carbon (BC), and nitrogen oxides (NOx) across urban and rural freeway environments to assess the impact of reduced heavy-duty diesel vehicles (HDDVs) during the holiday (i.e., holiday effect). No clear impact of wind direction on TRAP concentrations was found in this study. However, substantial differences (two times) were observed when comparing non-holiday to holiday campaigns. Spearman correlations (0.21–0.56) between TRAPs persistently exceeded Pearson correlations (0.14–0.41), indicating non-linear relationships and suggesting the necessity for data transformations (e.g., logarithms) in TRAP analysis. The comparison of the background subtracted TRAPs concentrations between non-holiday and holidays, revealing approximately a 50% reduction in TRAPs across microenvironments. Among the TRAPs, NOx emerged as a reliable indicator of HDDV emissions. The study provides insights into vehicle fleet composition impacts, paving the way for enhanced exposure assessment strategies.

Graphical Abstract

1. Introduction

Traffic-related air pollutants (TRAPs) have emerged as a significant public health concern, particularly in urban areas where high population densities are near roadways [1]. TRAPs manifests in various forms, including ultrafine particles (UFPs; aerodynamic diameter <100 nm), black carbon (BC), and nitrogen oxides (NOx; NO + NO2) [2,3,4]. These pollutants have been linked to significant adverse effects on human health, particularly in terms of respiratory, cardiovascular, and brain diseases [5,6,7,8].
Air pollution assessments in urban environments predominantly rely on regulatory fixed monitoring sites. While these regulatory sites provide valuable data, they often fall short in capturing the complexities of urban air quality, particularly concerning TRAPs [9,10,11]. This limitation arises from the nature of vehicle operations, which causes vehicle emissions to disperse throughout the city. Furthermore, many TRAPs, such as UFPs and BC, are not adequately monitored by these regulatory sites. To aid in addressing this limitation, mobile monitoring has been increasingly employed to characterize hyper-localized traffic-related air pollutant concentrations [9,10,12,13,14,15,16]. By utilizing mobile monitoring strategies, researchers can collect data that reflects real-time variations in pollutant concentrations, thereby enhancing our understanding of their spatial distribution—an aspect that regulatory fixed sites cannot sufficiently address.
The variability of TRAPs is heavily influenced by the vehicle emissions and local environmental conditions [17,18]. A simple way to evaluate to what extent traffic patterns affect the air pollutants is to compare the pollutant concentration differences between non-holiday and holiday periods—since traffic is generally higher and composed of more diesel vehicles on non-holidays, it is sensible to expect that weekday concentrations will be greater on average [19,20,21]. Previous research has indicated that changes in human activity patterns, such as those occurring during public holidays or special events, lead to changes in traffic patterns and consequently can dramatically affect local air quality [22,23,24]. Additionally, holiday festivities might also result in increased emissions from recreational activities and construction, which could complicate the overall impact [25,26]. Moreover, local environmental conditions (e.g., meteorological conditions) can further affect the concentrations of TRAPs by influencing the dispersion of the vehicle emissions [27,28,29,30]. Therefore, a comprehensive evaluation of the holiday effect requires consideration of both vehicle emissions and environmental conditions.
Considering the characteristics of TRAPs, monitoring TRAP concentrations in different microenvironments with high spatiotemporal resolution is essential for quantifying impact of vehicle emissions on TRAP concentrations. The aim of the study is to quantify holiday effects on the concentration variations in TRAPs in different microenvironments and explore the reliable indicator of HDDV emissions. We conducted a sampling campaign that employed a car-based mobile platform to measure TRAP concentrations in Chengdu, China. The mobile platform provides opportunities to conduct measurements in microenvironments that stationary measurements cannot address and hence advance our understanding of TRAP concentrations. Two microenvironments (rural freeway, urban freeway) were included to explore the impact of microenvironment types in TRAP concentrations. To account for the holiday effects on the variability of TRAP concentrations, our sampling campaign covered one of the most important holidays in China, the National Holiday. Besides the characterization of TRAP concentrations, the implication of the interrelationship between the TRAPs as well as the distribution of them are discussed. The National Holiday provides a distinct case study to observe TRAP levels in scenarios with reduced vehicle emissions, such as those from heavy-duty diesel vehicles (HDDVs). Understanding the association between holiday effects on TRAPs and HDDV emissions can serve as a valuable reference for assessing the potential effects on future pollution levels if stringent emission regulations are applied to HDDVs in megacities.

2. Materials and Methods

2.1. Instrumentation

We conducted a field measurement to collect traffic-related air pollutant (TRAP) samples in Chengdu, a mega city with more than 20 million inhabitants and 5.2 million registered vehicles in 2020 in southwest China [31]. Chengdu has a national air quality monitoring network that measures six criteria air pollutants (O3, NO2, CO, PM2.5, PM10, and SO2) in accordance with China’s Ambient Air Quality Standards (GB 3095-2012) [32]. However, these monitors may not adequately capture the specific characteristics of Traffic-Related Air Pollutants (TRAPs) within the city. The study was conducted under the Chengdu Air Pollution Evaluation (CAPE) project, utilized a mobile platform (gasoline-powered Buick GL8) to measure TRAP concentrations and at 1 Hz resolution, with a Global Positioning System (GPS) for speed and geolocation tracking at 1 s intervals [33,34,35]. We measured three types of pollutant concentrations: particle number concentration (PNC), BC, and NOx. These pollutants were selected due to the significant role that traffic sources play in their emissions and concentrations. A condensation particle counter (CPC3007, size range: 10–1000 nm) was used to measure the total particle number concentrations (PNC, particles cm−3). PNC is often used as a proxy measure of UFPs since the contribution of UFPs to particle mass is considered negligible [36,37,38]. BC concentrations were measured by an aethalometer (AE33) that provided real-time loading compensation using dual-spot technology that eliminates the need for correction for filter loading [39]. We selected the BC mass concentrations at 880 nm wavelength to represent the BC concentrations’ (ng m−3) origin from the vehicle emissions. Real-time analyzers for NOx (nCLD66) were employed to measure concentrations of NOx (ppb). Time synchronization was conducted for all instruments before each sampling day.

2.2. Study Domain and Monitoring Conditions

The routes of mobile measurements and types of roadways are indicated in Figure 1. Overall, approximately 4000 km of driving was conducted across 400 km of roadway. Our sampling campaign coincided with one of China’s major holidays, the National Holiday (1–8 October 2020). During the National Holiday, significant changes occurred in traffic conditions, in particular a substantial reduction in heavy-duty diesel vehicles (HDDVs). As a result, the measurements were divided into two distinct campaigns: one for the non-holiday period (21–30 September and 9–10 October) and another for the holiday period (1–8 October), in the year 2020. There were ~6.6 × 10⁴ and ~5.8 × 10⁴ 1 Hz paired data collected during non-holiday and holiday campaigns, respectively. Categorizing the data into two sampling campaigns enables the evaluation of pollutant concentration variability and interrelationships, particularly due to the diverse vehicle fleet composition and reduced HDDV presence during holidays. The TRAPs were measured across an area of 3800 km2 with various emission-source influences. In this study, the TRAPs measured on the inner ring-road were considered representative of the urban freeway (red), while results from outer ring-road and radial arterial were representative of the rural freeway (green). This classification was based on the demographic data derived from the Seventh National Census of China [40].
Meteorological information (wind speed and direction, relative humidity, and ambient temperature) was taken from an airport weather tower located within the study domain, as shown in Figure 1. The average temperatures during the non-holiday (70.5 ± 5.6 °F) and holiday (68.0 ± 3.4 °F) sampling campaigns were similar, as were the relative humidity (non-holiday: 82.5 ± 14.4%, holiday: 77.9 ± 11.7%). Average wind speeds were near 2.0 m s−1 for both non-holiday (1.8 ± 1.2 m s−1) and holiday sampling campaigns (2.2 ± 1.6 m s−1), with the prevailing wind direction being from the north. The similar wind speed and persistent wind direction indicates that the wind speed was unlikely to be a key factor influencing the variations in TRAP concentrations. According to the municipal planning of Chengdu [41], the primary industrial zones are situated 60 to 80 km south and southeast of the city, downwind from prevailing wind. The distance between the industrial areas and the nearest sampling route is roughly 10 km. Given this spatial arrangement, industrial activities may not have a substantial impact on the concentrations of TRAPs in the study domain. Furthermore, all field measurements were carried out exclusively under conditions of neutral (class D) or stable (class E) atmospheric stability.
To evaluate the holiday impact on heavy-duty diesel vehicle (HDDV) flow rates, traffic fleet information (e.g., total vehicle flow rate and HDDV flow rate) was derived from traffic monitors in urban freeway and rural freeway microenvironments, as detailed in prior studies [35]. While the total vehicle flow rates were similar during non-holiday and holiday campaigns (~5000 veh h−1), HDDV flow on the urban freeway dropped from 680 to 154 veh h−1 during holiday campaign. In contrast, rural freeways showed little change, with HDDV flow rates of 24 and 22 veh h−1 during non-holiday and holiday campaigns, respectively.

2.3. Quality Assurance and Data Processing

The quality assurance processes involved checks of flow rates and concentrations for all instruments before each experimental trip. For instruments measuring PNC and BC, we adhered to the manufacturer’s guidelines for instrument maintenance. For NOx, a zero-span calibration method was utilized on a daily basis, with span calibrations performed following the zeroing of the instruments. Calibration was carried out using T-shaped, high-density Teflon tubing, where the main circuit was linked to both the standard gas source and the ambient atmosphere, while the branch circuit connected with the calibration equipment to draw the standard gas as per specific calibration needs. During the sampling campaigns, we excluded the 1 s measurements if any of the following criteria were met: (1) the inlet flow rate deviated by a factor of two above or below the manufacturer’s specifications, (2) GPS data (including longitude, latitude, and vehicle speed) was unavailable, or (3) TRAP concentrations fell below zero. To reduce measurement bias from self-pollution, TRAP data were also discarded if the mobile platform’s speed dropped below 5 km h−1. Additionally, measurements taken while following closely (i.e., 30 m) [42] behind another vehicle were omitted from the analysis to limit interference from adjacent vehicles. The time series data for TRAP measurements underwent manual inspection for any anomalies and were cross-referenced with field technician logs. A total of 1.2 × 10⁵ pairs of 1 s measurements were collected to ensure sufficient data. The mobile platform traversed the sampling routes in both clockwise and counterclockwise directions to mitigate biases arising from different sampling durations. The sampling routes were covered at least three times during the sampling campaign. The platform sampled at the speed of surrounding traffic, with an average speed of ~76.3 (±24.3) km h−1 and ~76.9 (±29.5) km h−1 during non-holiday and holiday campaigns.
The interrelationship relationship between TRAP concentrations was explored through Pearson and Spearman correlation analyses during sampling campaigns on both non-holiday and holidays. Unlike direct measurements of the emission sources (e.g., tailpipe measurements), the data collected from these two microenvironments allowed for an assessment of the interrelationship under actual conditions, taking into account the relative significance of various pollution sources. Therefore, the interrelationship evaluation of the correspondence between the TRAP concentrations can be instrumental in formulating air pollution control strategies (e.g., end-of-pipe control policies) from a public health perspective. The analysis encompassed three scenarios: (1) all data, (2) urban freeway, and (3) rural freeway conditions. The interrelationship was evaluated based on 1 s mobile measurements. In this study, Pearson correlation was utilized to quantify the linear relationships between TRAPs, while Spearman correlation was applied to evaluate their monotonic relationships.
To illustrate the relationship between TRAP concentrations in the near-source field, temporal adjustments were applied to the TRAP concentrations measured in different microenvironments. This quantifies the incremental TRAP concentrations (delta TRAP concentrations), owing to changes in local emissions and dispersion between different sample days. The mobile platform measurements of PNC, BC, and NOx were adjusted by subtracting the 5 min rolling minimum as calculated background concentrations:
Δ T R A P i = T R A P i m i n ( T R A P i , 5 m i n )
where T R A P i is the measurement of i species of TRAP concentrations (e.g., PNC, BC and NOx). Δ T R A P i are the temporal adjusted TRAP concentrations that accounted for local emissions. Applying the adjustment to the data could result in Δ T R A P i equal to zero. In this study, we considered Δ T R A P i equal to zero representing the baseline TRAP concentrations of the microenvironments. All the zero values were removed to avoid underestimation of Δ T R A P i .

3. Results and Discussion

3.1. Monitoring Conditions

Mobile monitoring took place over 17 distinct days from 21 September 2020 to 10 October 2020, with each session lasting between 8 and 9 h. Hourly averaged meteorological data were recorded by a weather tower located within the study domain. Under calm wind conditions (wind speed less than 0.5 m s−1), 11.0% of the total mobile monitoring data were collected. The majority, 48.2% of the mobile monitoring was conducted with northerly wind patterns, while 24.6% of the data were collected during southerly wind conditions.
In this study, no clear variation patterns were identified between TRAP concentrations and wind direction. However, a significant difference (p < 0.05, double-sided t-test) was observed when comparing TRAP concentrations from non-holiday to holiday measurements. Here, the median of the concentrations obtained from mobile measurements was utilized for the discussion of results, as it is less affected by extreme concentration values. Significant holiday effects are found in Figure 2a; the average of the median PNC was 2.0 times higher during non-holidays (2.4 × 10⁴ particles cm−3) compared to during holidays (1.2 × 10⁴ particles cm−3). For meteorological conditions where both non-holiday and holiday data were available, this holiday effect remained consistent across different meteorological conditions. Similar concentration trends were found for BC (Figure 2b) and NOx (Figure 2c). Specifically, the BC concentrations during the non-holiday campaign were 7500 ng m−3, approximately double the concentrations observed during the holiday (3700 ng m−3). Additionally, NOx concentrations exhibited a 2.2-fold increase when comparing non-holiday levels (104.3 ppb) to those during holidays (227.3 ppb).
TRAP concentrations were found to be independent of wind conditions, likely due to the consistent meteorological environment during the sampling campaigns (refer to Method section). Notably, all of the TRAP concentrations were approximately two times higher during the non-holiday campaign compared to the holiday campaign. Given the tremendous emissions of TRAPs from heavy-duty diesel vehicles (HDDVs) [4,43,44,45,46], it is expected that the reduced HDDVs flow rate during the National Holiday would lead to lower TRAP concentrations. However, the observed consistent reduction rate of around two times in TRAP concentrations further indicates that HDDVs are the predominant factor influencing TRAP levels in urban microenvironments.

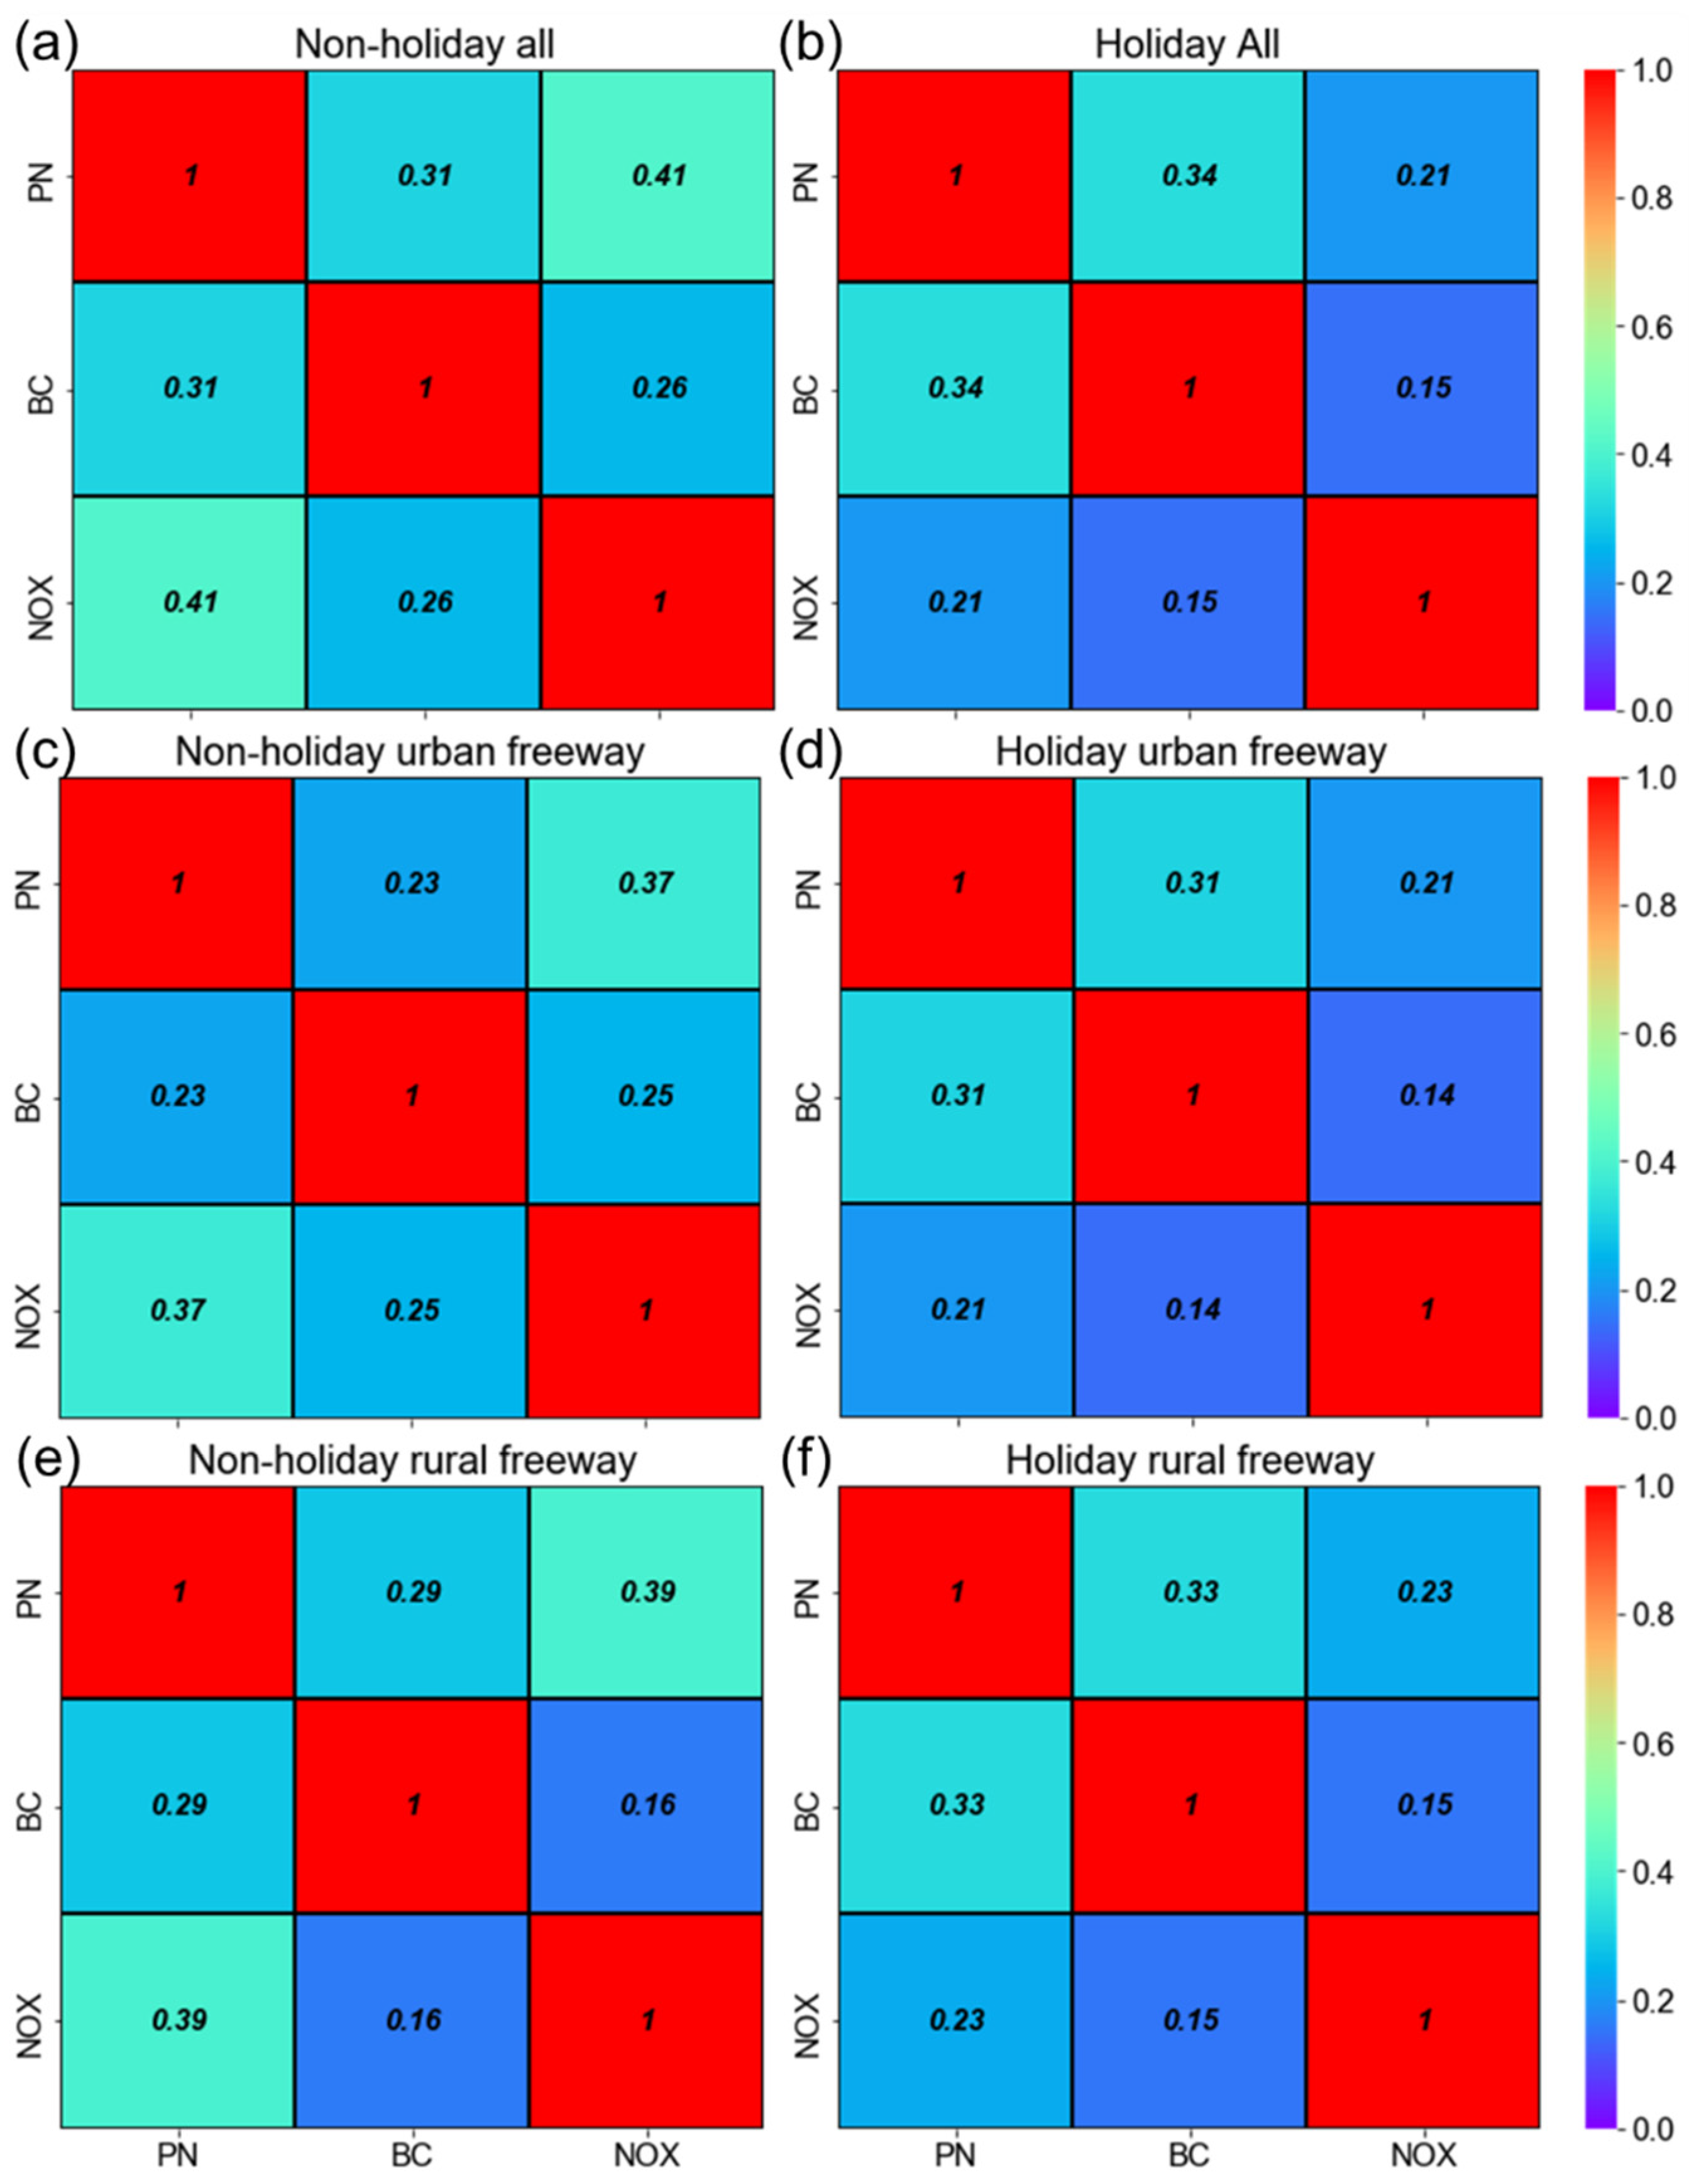
3.2. Traffic-Related Air Pollutants’ Intercorrelation

Figure 3 shows the Pearson correlation coefficients between PNC, BC, and NOx across different microenvironments. The Pearson correlation between the TRAPs did not exceed 0.41 (ranged from 0.14 to 0.41), suggesting a weak correlation. During the non-holidays (depicted in the left panel), the strongest Pearson correlation was found between PNC vs. NOx (0.37–0.41). On the other hand, the holiday results (shown in the right panel) showed the strongest correlation between PNC and BC (0.31–0.34). The weakest Pearson correlation was found between BC and NOx across both the all-data scenario and rural freeway scenario. In the urban freeway scenarios, comparable Pearson correlation was noted for the following pairs: PNC vs. BC (0.23) and BC vs. NOx (0.25). When comparing results during non-holiday to holiday, all pairs of TRAPs showed persistently stronger Pearson correlation, except for the pair PNC vs. BC.
Figure 4 shows the Spearman correlation coefficients between the TRAPs across different microenvironments, with values ranging from 0.21 to 0.56. The patterns observed in the Spearman correlations align with those in Figure 3 but indicate generally higher correlation coefficients. For example, the non-holidays (left panel) showed the strongest Spearman correlation was between PNC vs. NOx (0.48–0.56), while the holiday results (right panel) showed the strongest correlation between PNC and BC (0.42–0.52). Additionally, a comparison of non-holiday and holiday results indicates that all TRAP pairs exhibited consistently stronger Spearman correlations, except for the PNC vs. BC pair, which is similar to the findings in Figure 3.
It is acknowledged that correlations between TRAPs substantially increase with longer aggregation time scales (e.g., daily) [47]. However, this study focuses on characterizing TRAP variability through hyperlocal measurements, which necessitates maintaining a 1 s time scale for the analysis of TRAP interrelationships. The elevated Spearman correlation coefficients suggest that the relationships among the TRAPs may not be linear. This implies that applying a data transformation, such as a natural logarithm [48,49,50], may be necessary when analyzing linear relationships in TRAP concentrations. Considering that the number of HDDVs decreased during holiday campaigns, the elevated Spearman correlation coefficients may also be attributed to the reduced presence of aged TRAPs during non-holiday periods. Moreover, the relatively higher correlations (i.e., PNC vs. NOx and BC vs. Nox) during the non-holiday period serve as a reliable indicator for TRAPs.

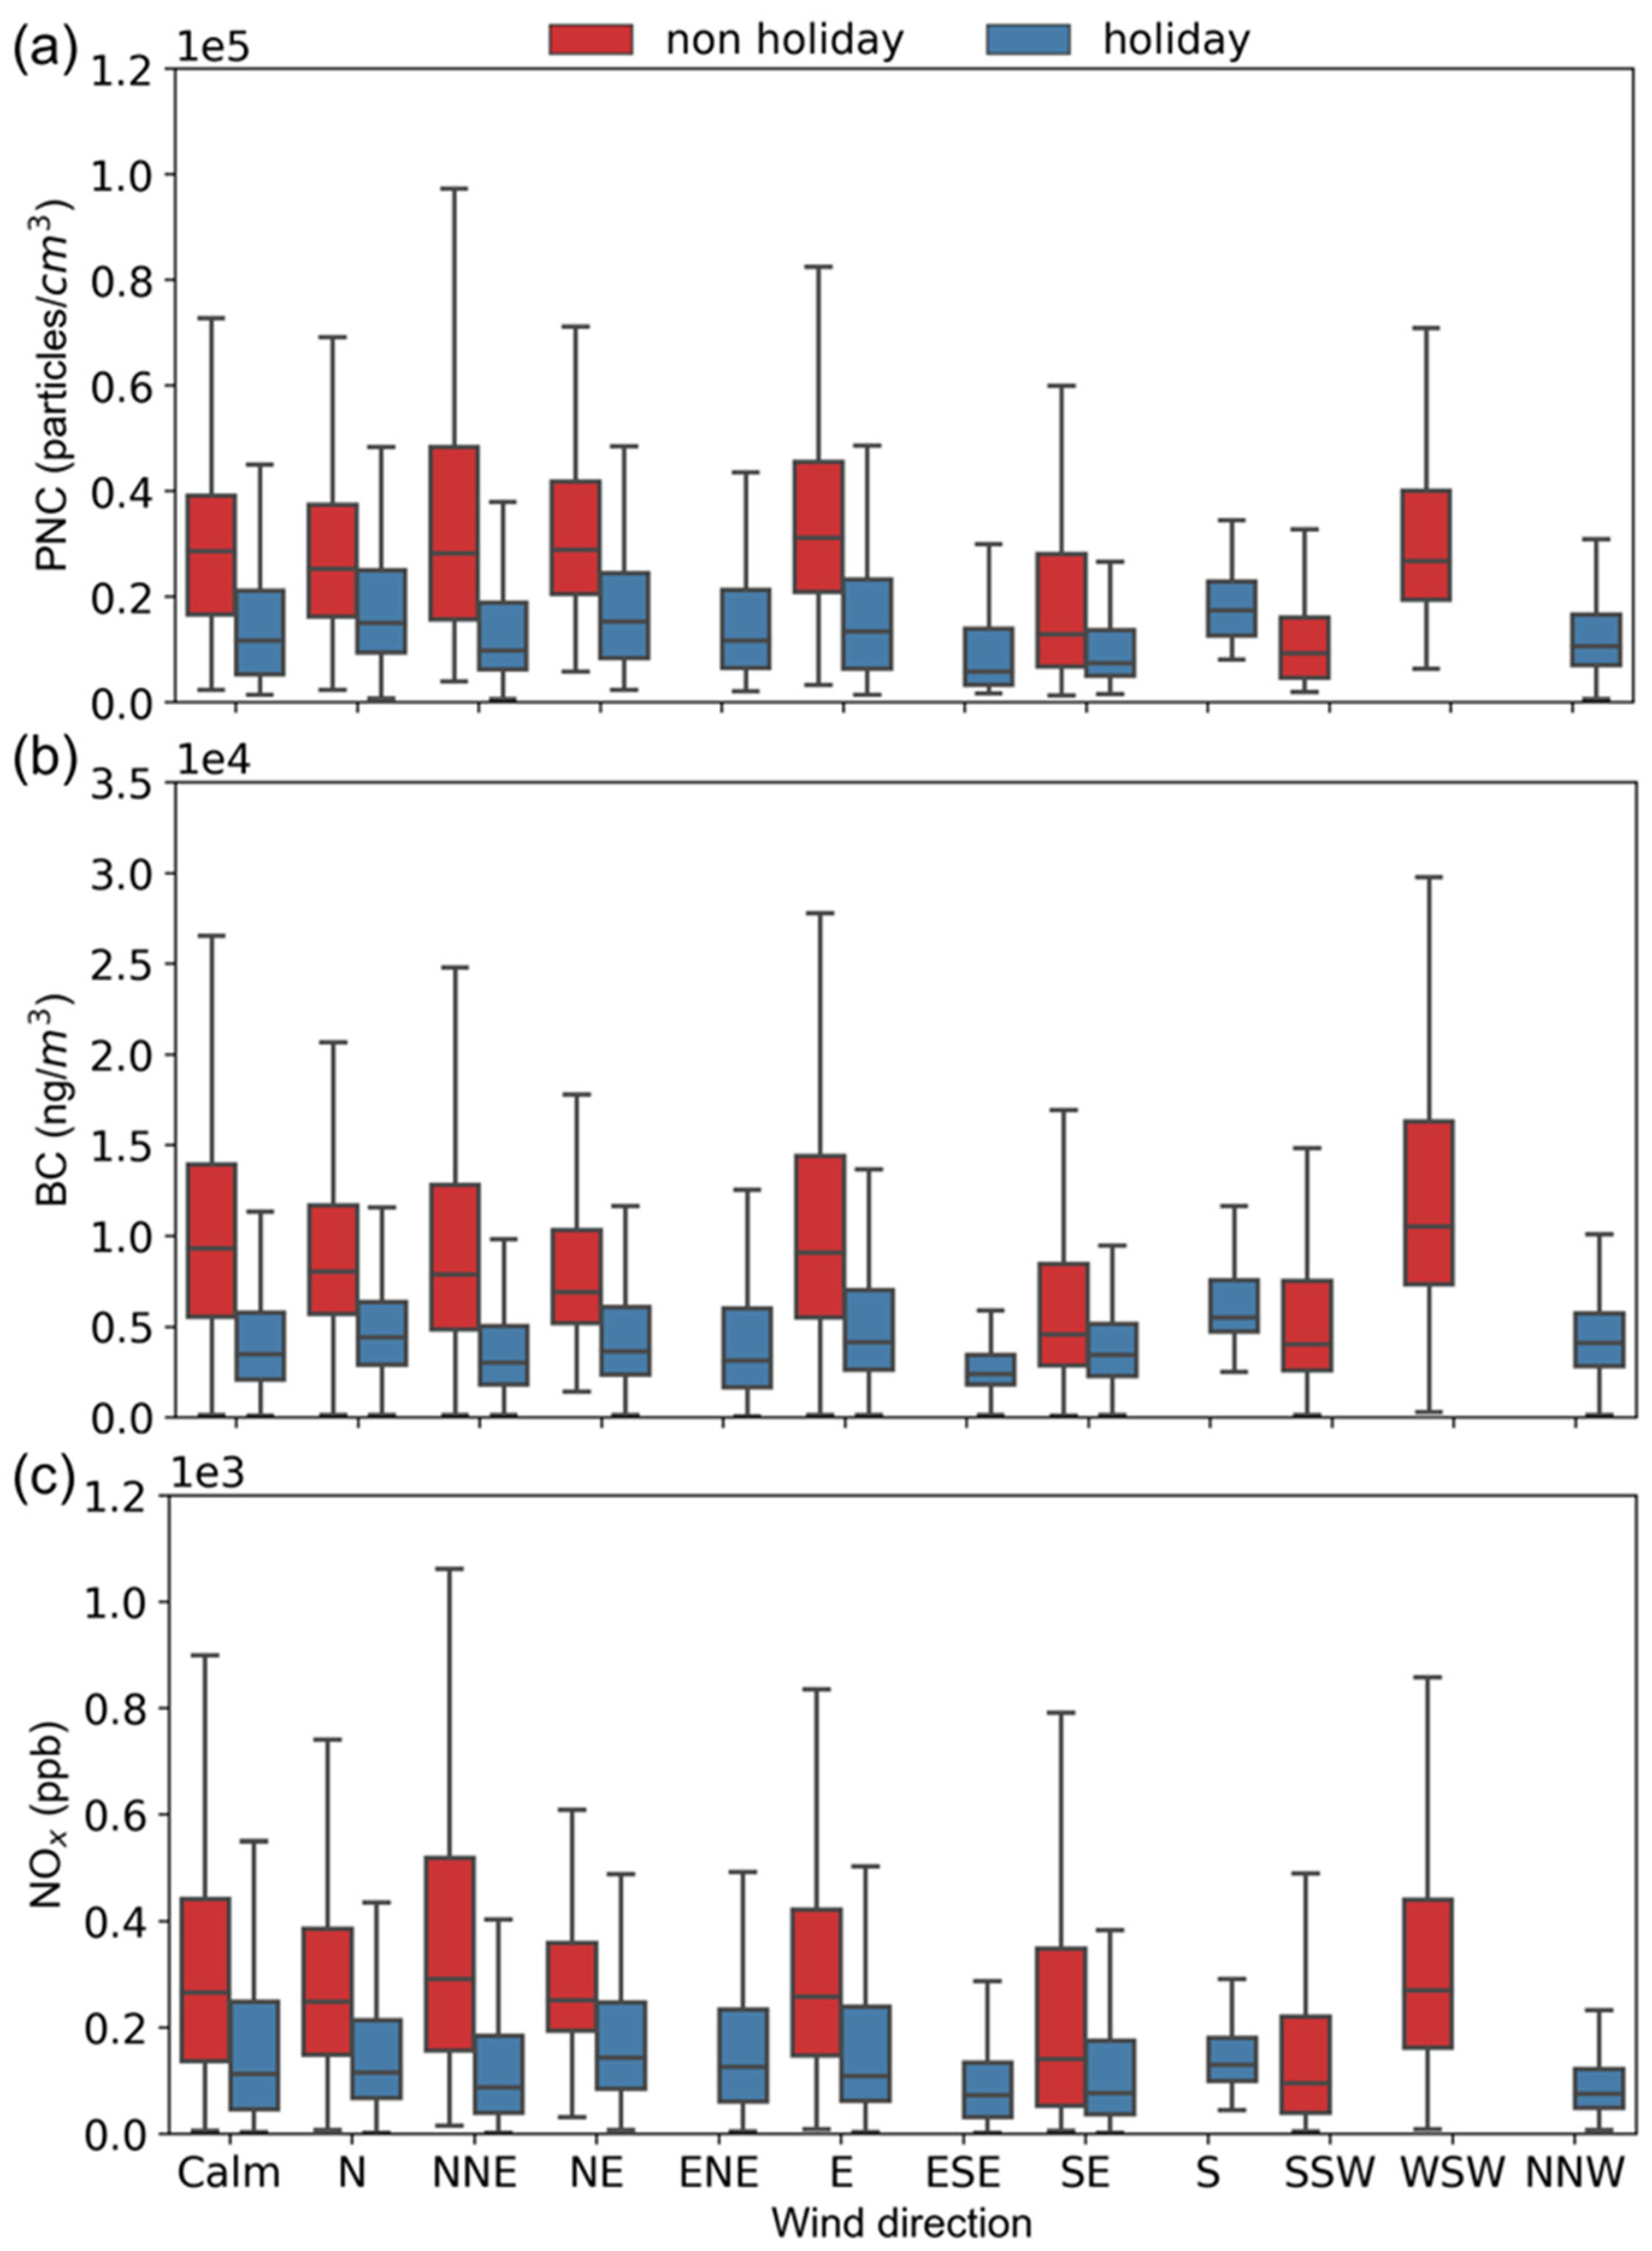
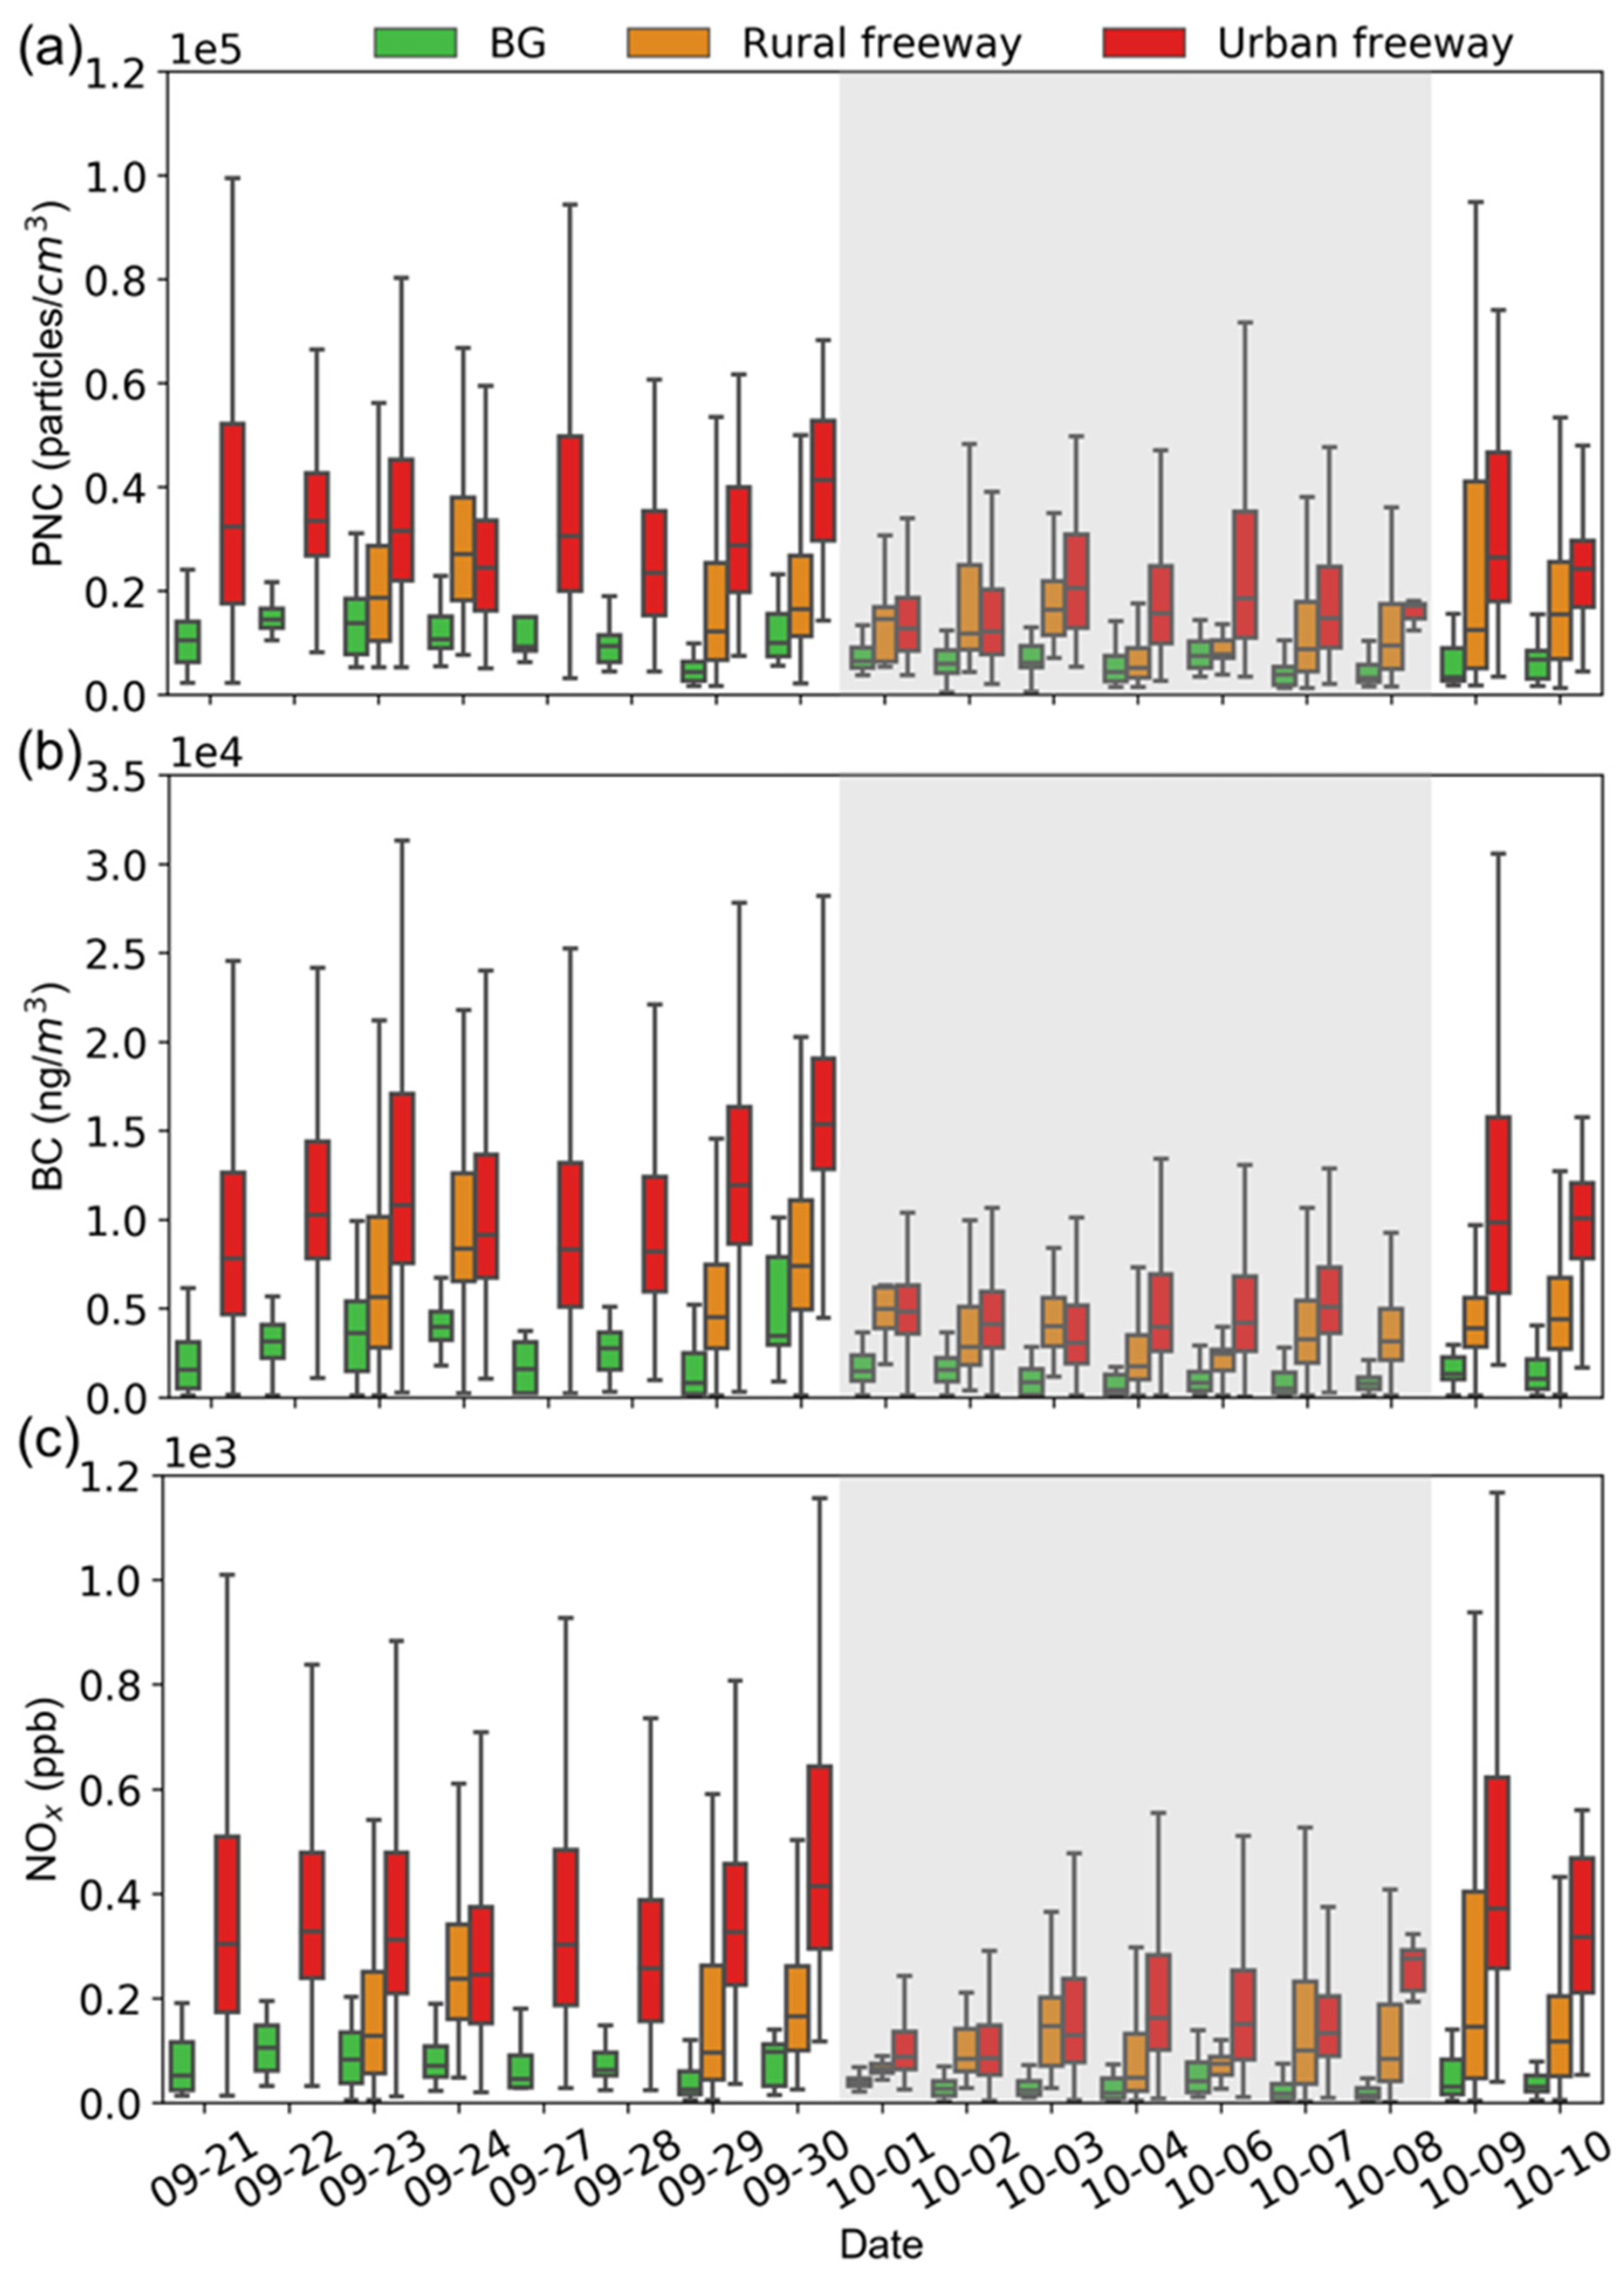
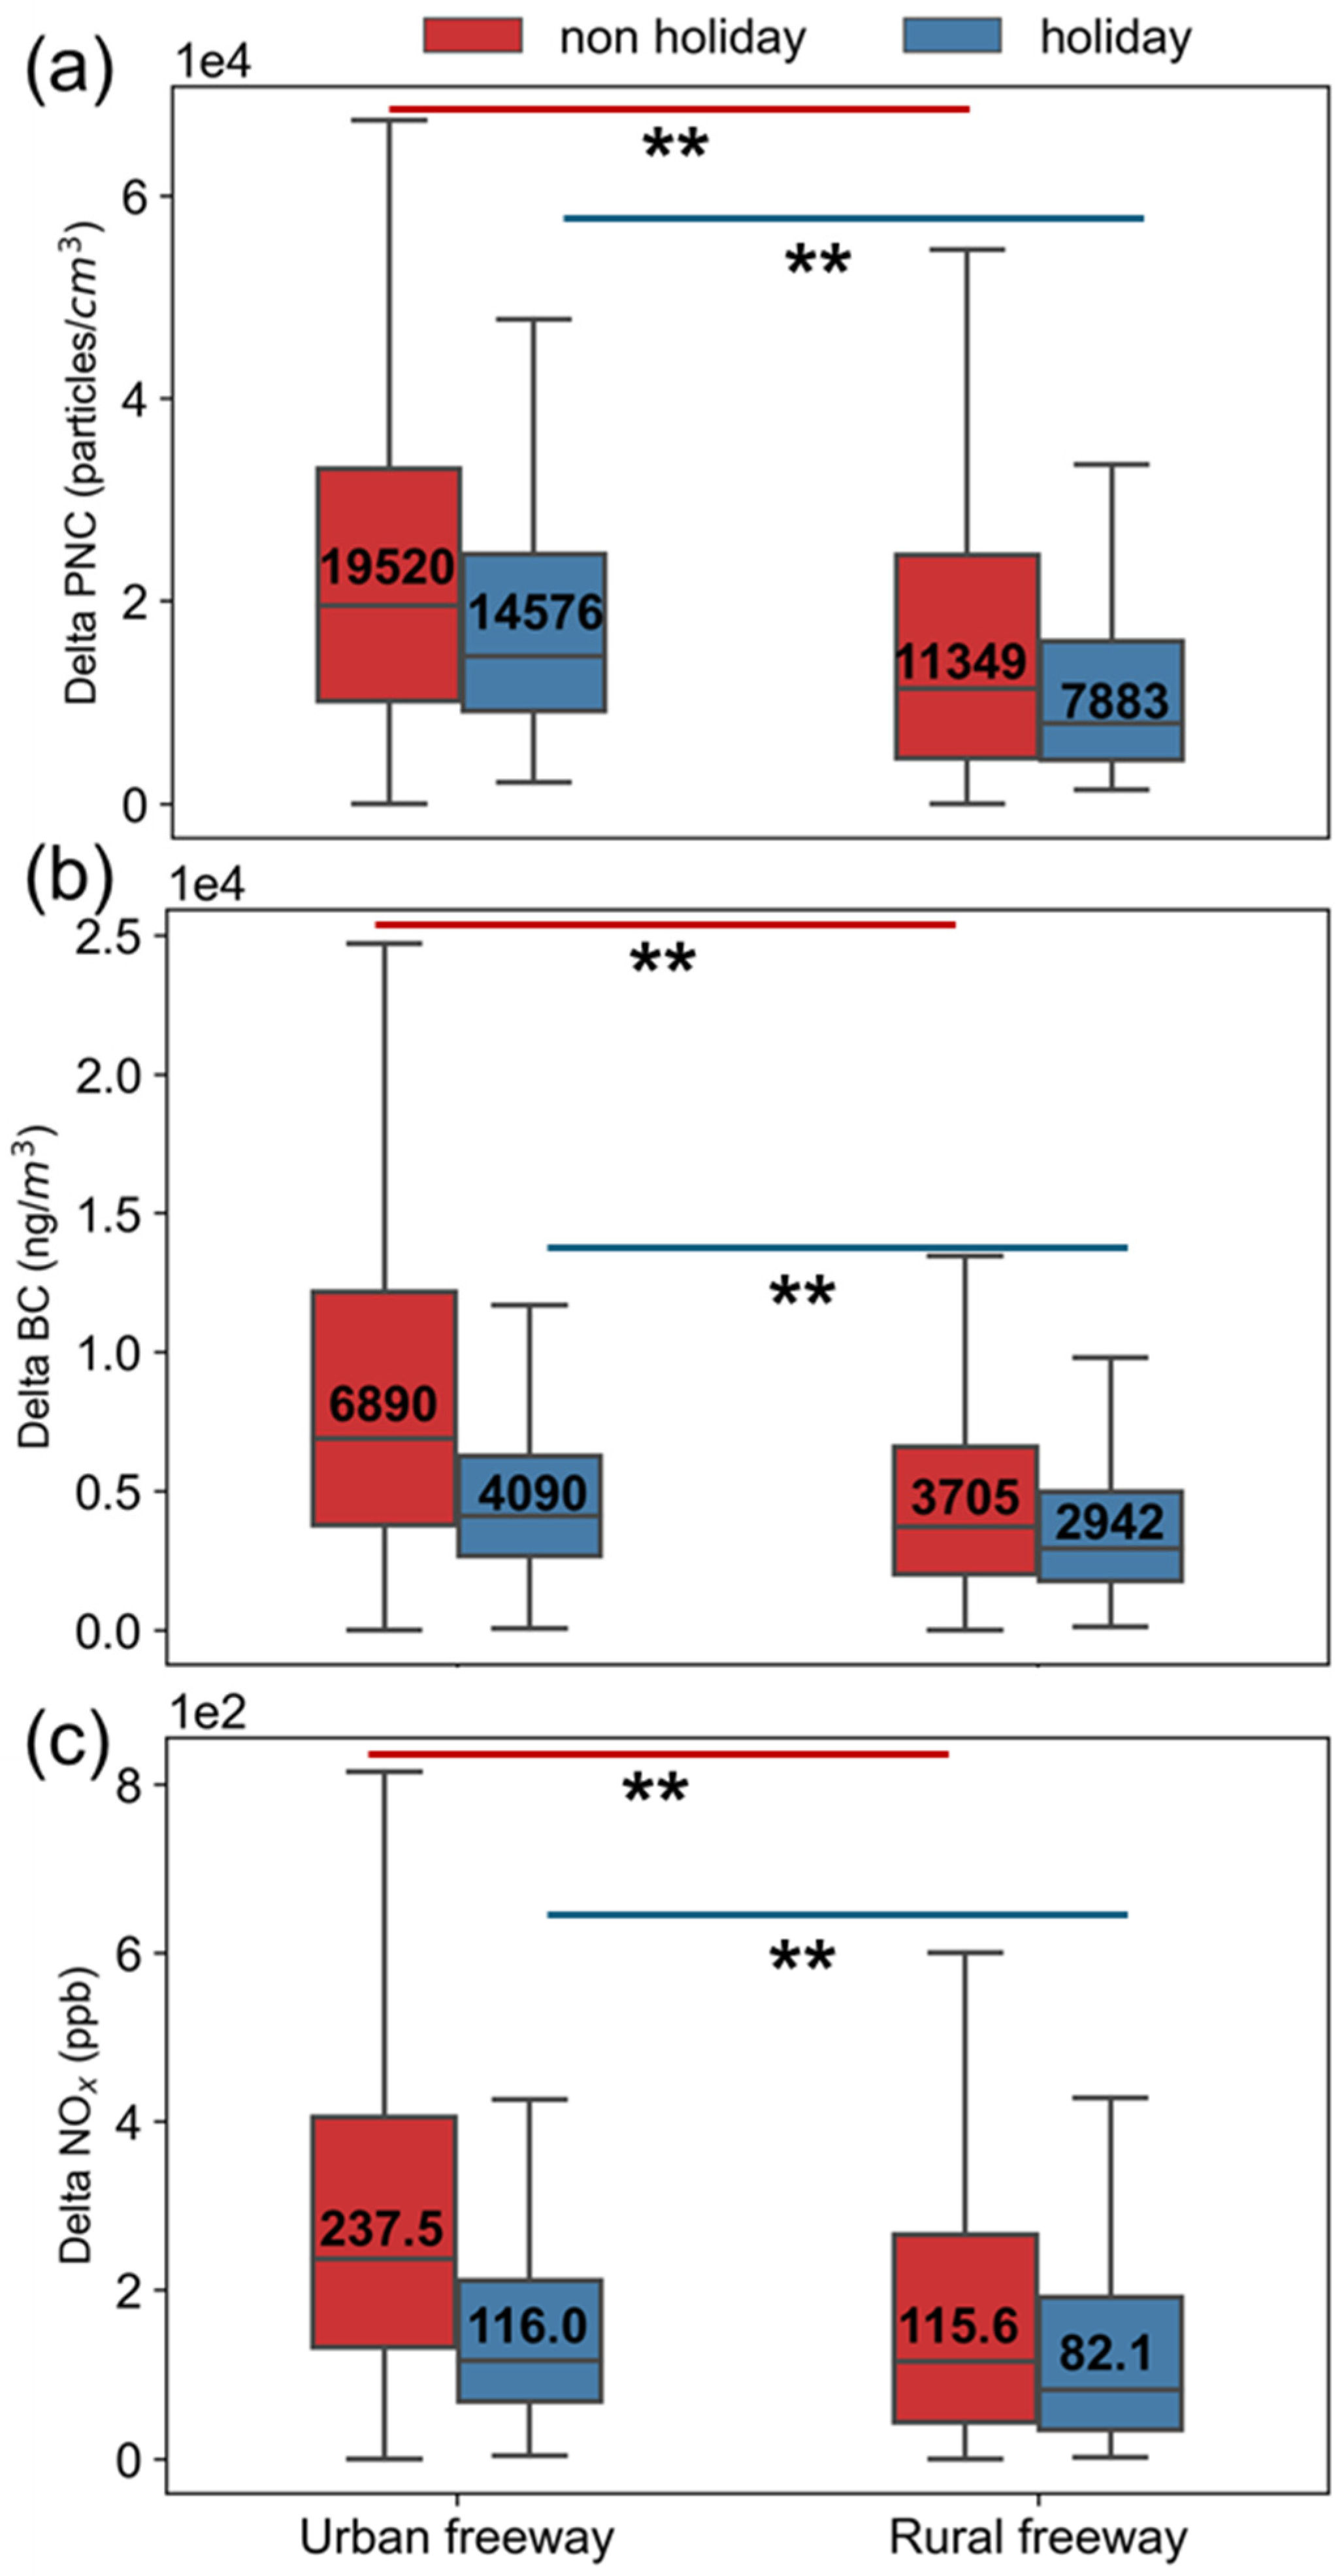
3.3. Temporal-Spatial Variations

As illustrated in Figure 5, the holiday effect showed a considerable impact on TRAP concentrations. Specifically, the average of the median PNC on the estimated background during non-holiday and holiday campaigns were 9307 (±3600) particles cm−3 and 5426 (±1559) particles cm−3, respectively. Within each sampling day, the higher TRAP median concentrations mostly occurred in urban freeway microenvironments across the whole sampling campaign. During the non-holiday period, the average of the median PNC on the urban freeway and rural freeway were 17080 (±5476) particles cm−3 and 29,719 (±5475) particles cm−3, respectively. Similarly to the results in the estimated background, a substantial reduction in TRAP concentrations also occurred during the holiday campaign. The average of the median PNC on the urban freeway and rural freeway reduced to 10,609 (±3912) particles cm−3 and 15,981 (±3049) particles cm−3, respectively. The same patterns were also found in the variations in BC and NOx concentrations (see Table 1).
In this study, the holiday effect leads to an approximate 50% reduction in TRAP concentrations under different microenvironments, even in the background estimation. It is expected that the TRAP concentration during the non-holiday period was higher than during holiday due to the changes in HDDV flow rate. On the other hand, one would think that the estimated background should not be strongly related to the holiday effects. As demonstrated in the Methods section, the background concentrations were estimated as the 5 min rolling minimum concentrations. Therefore, the estimated background concentrations represented the concentration baseline of the roadway. This concentration baseline is considered to be combination of pollutants from regional transport and fresh emissions from nearby sources (e.g., dispersed emissions from vehicles pass by). Thus, the background concentrations reported in this study were expected to be higher than other studies that employed upwind stationary monitoring [4,51,52,53]. Overall, on average, the concentrations of background and TRAPs during the non-holiday period were nearly two times higher than those during the holiday campaign. The similar rate of changes (i.e., two times) in the estimated background is a result of the TRAP concentration emissions from vehicle passing by, the amount of which could be strongly related to holiday effect [54,55].
Figure 6 illustrates the delta TRAP concentrations (concentration increments) calculated under urban freeway and rural freeway microenvironments. The data consistently indicate significantly higher TRAP concentration increments in urban freeway microenvironments. The holiday effect showed a similar impact across these pollutants, with statistical tests (Mood’s median test) revealing significant differences at the 1% level for all data groups (p < 0.01). This indicates that holiday effects induce statistically significant changes in TRAP concentration increments across different roadway types.
In urban freeway microenvironments, PNC, BC, and NOx concentrations during the non-holiday campaign were elevated by 34%, 68%, and 105%, respectively, compared to the holiday campaign. The impact on NOx was the most significant among the TRAPs, which underscores its potential as a reliable indicator for HDDV emissions, reinforcing findings from interrelation analyses (Figure 4). For rural freeway microenvironments, reduction ratios for PNC, BC, and NOx were 44%, 26%, and 41%, respectively. The disparity in reduction ratios between urban and rural freeway microenvironments indicates that holiday effects on TRAP concentrations persist under rural freeway microenvironment, albeit to a lesser extent due to fewer HDDVs.
Despite significant differences between non-holiday and holiday campaigns within each microenvironment, an intriguing observation was that NOx median concentrations during holidays on the urban freeway were similar (p = 0.75) to those during non-holidays on the rural freeway. This is because of the fact that the HDDV flow rate was substantially reduced under urban freeway microenvironments during holiday campaign, aligning them with rural freeway HDDV flow rates. The PNC and BC concentrations, however, could be more affected by instant non-HDDV sources (residential emissions), indicating a broader spectrum of influences beyond HDDV emissions.

4. Conclusions

This study demonstrates the effectiveness of a mobile monitoring platform characterizing hyperlocal-scale spatiotemporal variations in TRAP in a megacity. Although the impact of climatic factors (e.g., seasonal variability) were not included in this study, our 17-day mobile monitoring campaign spanned the National Holiday, allowing us to capture TRAP concentrations with holiday effects accounted for. By conducting a 17-day mobile monitoring campaign that spanned the National Holiday, we were able to measure TRAP concentrations while factoring in the unique influences of holiday effects. Our findings revealed significant variations in TRAP concentrations, which were closely associated with these holiday dynamics. We also found that the Spearman correlation was an effective metric for analyzing the interrelationships between TRAPs in real-world microenvironments, with NOx emerging as a robust tracer for TRAP concentrations.
Our study focused on evaluating the holiday effect by comparing TRAP concentrations during non-holiday and holiday periods, revealing significantly higher concentrations during non-holidays. In this study, the highest concentrations of TRAPs were observed in the urban freeway microenvironment during the non-holiday period, which could be largely attributed to changes in HDDVs flow rate. Given that NOx showed the highest correlation coefficient with TRAPs (p < 0.01) and the largest reduction ratio when comparing non-holiday to holiday concentrations, we suggest that NOx could serve as a reliable proxy for measuring chronic exposure to TRAPs in cities with a substantial presence of HDDVs. Although Spearman’s correlation coefficients were higher than Pearson’s coefficients, indicating non-linear relationships among TRAPs, this does not undermine the reliability of our results. The interrelationships among TRAPs, whether linear or non-linear, help us to understand the nature of these relationships but do not affect our main conclusions about the holiday effect on TRAP concentrations. The findings from this study are valuable for quantifying the impact of variations in vehicle fleet composition by exploring holiday effects, thus providing a foundational basis for enhanced exposure assessment strategies.
The impact of vehicle flow rate due to the holiday effect on TRAP concentrations was quantified in this study. However, we were unable to establish a direct relationship between TRAP concentrations and vehicle flow rate. This limitation arose because we only had access to a limited number of traffic monitors, which did not provide real-time traffic flow data for the entire roadway network. Future studies should strive to collect dynamic vehicle flow information across the entire roadway network and integrate these data with mobile monitoring [56]. This approach will help to unveil the dynamic relationship between city-level vehicle operations and TRAP concentrations. Besides the impact of vehicle flow rate, the impact of NOx chemistry also needs to be considered. A recent study highlighted a significant dynamic interplay between O3 and NOx within vehicle exhaust plumes [57]. Building on this, future research should explore how this interrelationship affects NOx concentrations in transport microenvironments.

Author Contributions

Conceptualization, Y.Y. and H.L.; data curation, S.X., J.Y. (Jiaojiao Yu), P.Z., T.Z. and J.Y. (Jingsong Yue); formal analysis, S.X. and J.Y. (Jiaojiao Yu); methodology, S.X. and Y.T.Y.; project administration, Y.T.Y., Y.Y. and H.L.; writing—review and editing, S.X., J.Y. (Jiaojiao Yu), Y.T.Y., Y.Y. and H.L. All authors have read and agreed to the published version of the manuscript.

Funding

This research was funded by the National Key R&D Program of China (NO. 2023YFB3906900).

Institutional Review Board Statement

Not applicable.

Informed Consent Statement

Not applicable.

Data Availability Statement

The data presented in this study are available on request from the corresponding author.

Conflicts of Interest

Jingsong Yue and Yuanyuan Yang are employees of Shanghai Urban Investment Ring Expressway Construction and Development Co., Ltd. The paper reflects the views of the scientists and not the company.

Abbreviations

The following abbreviations are used in this manuscript:
TRAPsTraffic-related air pollutants
PNCParticle number concentration
BCBlack carbon
NOxNitrogen oxides
HDDVHeavy-duty diesel vehicle
UFPsUltrafine particles

References

  1. Panel, H. On the health effects of long-term exposure to traffic-related air pollution. In Systematic Review and Meta-Analysis of Selected Health Effects of Long-Term Exposure to Traffic-Related Air Pollution; Health Effects Institute: Boston, MA, USA, 2022. [Google Scholar]
  2. Zhu, Y.; Hinds, W.C.; Kim, S.; Sioutas, C. Concentration and size distribution of ultrafine particles near a major highway. J. Air Waste Manag. Assoc. 2002, 52, 1032–1042. [Google Scholar] [CrossRef] [PubMed]
  3. Ban-Weiss, G.A.; McLaughlin, J.P.; Harley, R.A.; Lunden, M.M.; Kirchstetter, T.W.; Kean, A.J.; Strawa, A.W.; Stevenson, E.D.; Kendall, G.R. Long-term changes in emissions of nitrogen oxides and particulate matter from on-road gasoline and diesel vehicles. Atmos. Environ. 2008, 42, 220–232. [Google Scholar] [CrossRef]
  4. Krecl, P.; Targino, A.C.; Landi, T.P.; Ketzel, M. Determination of black carbon, PM2.5, particle number and NOx emission factors from roadside measurements and their implications for emission inventory development. Atmos. Environ. 2018, 186, 229–240. [Google Scholar] [CrossRef]
  5. Kwon, D.; Paul, K.C.; Yu, Y.; Zhang, K.; Folle, A.D.; Wu, J.; Bronstein, J.M.; Ritz, B. Traffic-related air pollution and Parkinson’s disease in central California. Environ. Res. 2024, 240, 117434. [Google Scholar] [CrossRef] [PubMed]
  6. Janssen, N.A.; Hoek, G.; Simic-Lawson, M.; Fischer, P.; Van Bree, L.; Ten Brink, H.; Keuken, M.; Atkinson, R.W.; Anderson, H.R.; Brunekreef, B. Black carbon as an additional indicator of the adverse health effects of airborne particles compared with PM10 and PM2.5. Environ. Health Perspect. 2011, 119, 1691–1699. [Google Scholar] [CrossRef]
  7. Delfino, R.J. Epidemiologic evidence for asthma and exposure to air toxics: Linkages between occupational, indoor, and community air pollution research. Environ. Health Perspect. 2002, 110, 573–589. [Google Scholar] [CrossRef]
  8. Olstrup, H.; Flanagan, E.; Persson, J.-O.; Rittner, R.; Krage Carlsen, H.; Stockfelt, L.; Xu, Y.; Rylander, L.; Gustafsson, S.; Spanne, M. The Long-Term Mortality Effects Associated with Exposure to Particles and NOx in the Malmö Diet and Cancer Cohort. Toxics 2023, 11, 913. [Google Scholar] [CrossRef]
  9. Apte, J.S.; Manchanda, C. High-resolution urban air pollution mapping. Science 2024, 385, 380–385. [Google Scholar] [CrossRef]
  10. Apte, J.S.; Messier, K.P.; Gani, S.; Brauer, M.; Kirchstetter, T.W.; Lunden, M.M.; Marshall, J.D.; Portier, C.J.; Vermeulen, R.C.; Hamburg, S.P. High-resolution air pollution mapping with Google street view cars: Exploiting big data. Environ. Sci. Technol. 2017, 51, 6999–7008. [Google Scholar] [CrossRef]
  11. Li, Z.; Yim, S.H.L.; He, X.; Xia, X.; Ho, K.-F.; Yu, J.Z. High spatial resolution estimates of major PM2.5 components and their associated health risks in Hong Kong using a coupled land use regression and health risk assessment approach. Sci. Total Environ. 2024, 907, 167932. [Google Scholar] [CrossRef]
  12. Van den Bossche, J.; Peters, J.; Verwaeren, J.; Botteldooren, D.; Theunis, J.; De Baets, B. Mobile monitoring for mapping spatial variation in urban air quality: Development and validation of a methodology based on an extensive dataset. Atmos. Environ. 2015, 105, 148–161. [Google Scholar] [CrossRef]
  13. Li, H.Z.; Gu, P.; Ye, Q.; Zimmerman, N.; Robinson, E.S.; Subramanian, R.; Apte, J.S.; Robinson, A.L.; Presto, A.A. Spatially dense air pollutant sampling: Implications of spatial variability on the representativeness of stationary air pollutant monitors. Atmos. Environ. X 2019, 2, 100012. [Google Scholar] [CrossRef]
  14. Chambliss, S.E.; Pinon, C.P.; Messier, K.P.; LaFranchi, B.; Upperman, C.R.; Lunden, M.M.; Robinson, A.L.; Marshall, J.D.; Apte, J.S. Local-and regional-scale racial and ethnic disparities in air pollution determined by long-term mobile monitoring. Proc. Natl. Acad. Sci. USA 2021, 118, e2109249118. [Google Scholar] [CrossRef]
  15. Yu, Y.T.; Xiang, S.; Li, R.; Zhang, S.; Zhang, K.M.; Si, S.; Wu, X.; Wu, Y. Characterizing spatial variations of city-wide elevated PM10 and PM2.5 concentrations using taxi-based mobile monitoring. Sci. Total Environ. 2022, 829, 154478. [Google Scholar] [CrossRef] [PubMed]
  16. Yu, Y.T.; Xiang, S.; Zhang, T.; You, Y.; Si, S.; Zhang, S.; Wu, Y. Evaluation of City-Scale Disparities in PM2.5 Exposure Using Hyper-Localized Taxi-Based Mobile Monitoring. Environ. Sci. Technol. 2022, 56, 13584–13594. [Google Scholar] [CrossRef] [PubMed]
  17. Velizarova, M.; Dimitrova, R.; Hristov, P.O.; Burov, A.; Brezov, D.; Hristova, E.; Gueorguiev, O. Evaluation of Emission Factors for Particulate Matter and NO2 from Road Transport in Sofia, Bulgaria. Atmosphere 2024, 15, 773. [Google Scholar] [CrossRef]
  18. Van Poppel, M.; Peters, J.; Vranckx, S.; Van Laer, J.; Hofman, J.; Vandeninden, B.; Vanpoucke, C.; Lefebvre, W. Exploring the Spatial Variability of Air Pollution Using Mobile BC Measurements in a Citizen Science Project: A Case Study in Mechelen. Atmosphere 2024, 15, 757. [Google Scholar] [CrossRef]
  19. Şahin, Ü.A.; Onat, B.; Akın, Ö.; Ayvaz, C.; Uzun, B.; Mangır, N.; Doğan, M.; Harrison, R.M. Temporal variations of atmospheric black carbon and its relation to other pollutants and meteorological factors at an urban traffic site in Istanbul. Atmos. Pollut. Res. 2020, 11, 1051–1062. [Google Scholar] [CrossRef]
  20. Zhang, G.; Sun, Y.; Xu, W.; Wu, L.; Duan, Y.; Liang, L.; Li, Y. Identifying the O3 chemical regime inferred from the weekly pattern of atmospheric O3, CO, NOx, and PM10: Five-year observations at a center urban site in Shanghai, China. Sci. Total Environ. 2023, 888, 164079. [Google Scholar] [CrossRef]
  21. Wang, Y.; Wen, Y.; Wang, Y.; Zhang, S.; Zhang, K.M.; Zheng, H.; Xing, J.; Wu, Y.; Hao, J. Four-month changes in air quality during and after the COVID-19 lockdown in six megacities in China. Environ. Sci. Technol. Lett. 2020, 7, 802–808. [Google Scholar] [CrossRef]
  22. Xiang, J.; Ghaffarpasand, O.; Pope, F.D. Assessing the Impact of Calendar Events upon Urban Vehicle Behaviour and Emissions Using Telematics Data. Smart Cities 2024, 7, 3071–3094. [Google Scholar] [CrossRef]
  23. Tan, P.-H.; Chou, C.; Liang, J.-Y.; Chou, C.C.-K.; Shiu, C.-J. Air pollution “holiday effect” resulting from the Chinese New Year. Atmos. Environ. 2009, 43, 2114–2124. [Google Scholar] [CrossRef]
  24. Levy, I. A national day with near zero emissions and its effect on primary and secondary pollutants. Atmos. Environ. 2013, 77, 202–212. [Google Scholar] [CrossRef]
  25. Brimblecombe, P.; Lai, Y. Effect of fireworks, Chinese new year and the COVID-19 lockdown on air pollution and public attitudes. Aerosol Air Qual. Res. 2020, 20, 2318–2331. [Google Scholar] [CrossRef]
  26. Lai, Y.; Brimblecombe, P. Changes in air pollutants from fireworks in chinese cities. Atmosphere 2022, 13, 1388. [Google Scholar] [CrossRef]
  27. Arya, S.P. Air Pollution Meteorology and Dispersion; Oxford University Press: New York, NY, USA, 1999; Volume 310. [Google Scholar]
  28. Yu, Y.T.; Xiang, S.; Noll, K.E. Evaluation of the Relationship between Momentum Wakes behind Moving Vehicles and Dispersion of Vehicle Emissions Using Near-Roadway Measurements. Environ. Sci. Technol. 2020, 54, 10483–10492. [Google Scholar] [CrossRef]
  29. Xiang, S.; Zhang, S.; Brimblecombe, P.; Yu, Y.T.; Noll, K.E.; Liu, H.; Wu, Y.; Hao, K. An Integrated Field Study of Turbulence and Dispersion Variations in Road Microenvironments. Environ. Sci. Technol. 2024, 58, 20566–20576. [Google Scholar] [CrossRef]
  30. Liu, H.; Gao, P.; Xiang, S.; Zhu, H.; Chen, J.; Fu, Q. A Python toolkit for integrating geographic information system into regulatory dispersion models for refined pollution modeling. Environ. Model. Softw. 2024, 183, 106219. [Google Scholar] [CrossRef]
  31. Chengdu Bureau of Statistics. Chengdu Statistical Yearbook; Chengdu Bureau of Statistics: Chengdu, China, 2019. [Google Scholar]
  32. Ministry of Environmental Protection. Ambient Air Quality Standards (GB 3095-2012). 2012. Available online: https://www.chinesestandard.net/PDF.aspx/GB3095-2012 (accessed on 27 January 2025).
  33. Xiang, S.; Zhang, S.; Wang, H.; Wen, Y.; Yu, Y.T.; Li, Z.; Wallington, T.J.; Shen, W.; Deng, Y.; Tan, Q. Mobile Measurements of Carbonaceous Aerosol in Microenvironments to Discern Contributions from Traffic and Solid Fuel Burning. Environ. Sci. Technol. Lett. 2021, 8, 867–872. [Google Scholar] [CrossRef]
  34. Xiang, S.; Zhang, S.; Wang, H.; Yu, Y.T.; Wallington, T.J.; Shen, W.; Kirchner, U.; Deng, Y.; Tan, Q.; Zhou, Z. Variability of NO2/NOx Ratios in Multiple Microenvironments from On-Road and Near-Roadway Measurements. ACS EST Eng. 2022, 2, 1599–1610. [Google Scholar] [CrossRef]
  35. Xiang, S.; Zhang, S.; Yu, Y.T.; Wang, H.; Deng, Y.; Tan, Q.; Zhou, Z.; Wu, Y. Evaluating Ultrafine Particles and PM2.5 in Microenvironments with Health Perspectives: Variability in Concentrations and Pollutant Interrelationships. Aerosol Air Qual. Res. 2023, 23, 230046. [Google Scholar] [CrossRef]
  36. Mejía, J.F.; Morawska, L.; Mengersen, K. Spatial variation in particle number size distributions in a large metropolitan area. Atmos. Chem. Phys. 2008, 8, 1127–1138. [Google Scholar] [CrossRef]
  37. Morawska, L.; Thomas, S.; Bofinger, N.; Wainwright, D.; Neale, D. Comprehensive characterization of aerosols in a subtropical urban atmosphere: Particle size distribution and correlation with gaseous pollutants. Atmos. Environ. 1998, 32, 2467–2478. [Google Scholar] [CrossRef]
  38. Hinds, W.C. Aerosol Technology: Properties, Behavior, and Measurement of Airborne Particles; John Wiley & Sons: Hoboken, NJ, USA, 1999. [Google Scholar]
  39. Drinovec, L.; Močnik, G.; Zotter, P.; Prévôt, A.; Ruckstuhl, C.; Coz, E.; Rupakheti, M.; Sciare, J.; Müller, T.; Wiedensohler, A. The “dual-spot” Aethalometer: An improved measurement of aerosol black carbon with real-time loading compensation. Atmos. Meas. Tech. 2015, 8, 1965–1979. [Google Scholar] [CrossRef]
  40. National Bureau of Statistics of China. Major Figures on 2020 Population Census of China. 2020. Available online: https://www.chinayearbooks.com/major-figures-on-2020-population-census-of-china.html (accessed on 27 January 2025).
  41. Chengdu Municipal Bureau of Planning and Natural Resources. Municipal Planning of Chengdu 2011–2020. Chengdu Municipal Bureau of Planning and Natural Resources. 2021. Available online: https://mpnr.chengdu.gov.cn/ghhzrzyj/ztgh/2019-07/14/content_39be6057b8194c4d89afde1e26625a69.shtml (accessed on 27 January 2025).
  42. Brimblecombe, P.; Townsend, T.; Lau, C.F.; Rakowska, A.; Chan, T.L.; Močnik, G.; Ning, Z. Through-tunnel estimates of vehicle fleet emission factors. Atmos. Environ. 2015, 123, 180–189. [Google Scholar] [CrossRef]
  43. Xiang, S.; Yu, Y.T.; Hu, Z.; Noll, K.E. Characterization of Dispersion and Ultrafine-particle Emission Factors Based on Near-roadway Monitoring Part I: Light Duty Vehicles. Aerosol Air Qual. Res. 2019, 19, 2410–2420. [Google Scholar] [CrossRef]
  44. Xiang, S.; Yu, Y.T.; Hu, Z.; Noll, K.E. Characterization of Dispersion and Ultrafine-particle Emission Factors Based on Near-roadway Monitoring Part II: Heavy Duty Vehicles. Aerosol Air Qual. Res. 2019, 19, 2421–2431. [Google Scholar] [CrossRef]
  45. Lau, C.F.; Rakowska, A.; Townsend, T.; Brimblecombe, P.; Chan, T.L.; Yam, Y.S.; Močnik, G.; Ning, Z. Evaluation of diesel fleet emissions and control policies from plume chasing measurements of on-road vehicles. Atmos. Environ. 2015, 122, 171–182. [Google Scholar] [CrossRef]
  46. Zhang, S.; Wu, X.; Zheng, X.; Wen, Y.; Wu, Y. Mitigation potential of black carbon emissions from on-road vehicles in China. Environ. Pollut. 2021, 278, 116746. [Google Scholar] [CrossRef]
  47. Patton, A.P.; Perkins, J.; Zamore, W.; Levy, J.I.; Brugge, D.; Durant, J.L. Spatial and temporal differences in traffic-related air pollution in three urban neighborhoods near an interstate highway. Atmos. Environ. 2014, 99, 309–321. [Google Scholar] [CrossRef]
  48. Patton, A.P.; Collins, C.; Naumova, E.N.; Zamore, W.; Brugge, D.; Durant, J.L. An hourly regression model for ultrafine particles in a near-highway urban area. Environ. Sci. Technol. 2014, 48, 3272–3280. [Google Scholar] [CrossRef] [PubMed]
  49. Crouse, D.L.; Goldberg, M.S.; Ross, N.A. A prediction-based approach to modelling temporal and spatial variability of traffic-related air pollution in Montreal, Canada. Atmos. Environ. 2009, 43, 5075–5084. [Google Scholar] [CrossRef]
  50. Riley, E.A.; Schaal, L.; Sasakura, M.; Crampton, R.; Gould, T.R.; Hartin, K.; Sheppard, L.; Larson, T.; Simpson, C.D.; Yost, M.G. Correlations between short-term mobile monitoring and long-term passive sampler measurements of traffic-related air pollution. Atmos. Environ. 2016, 132, 229–239. [Google Scholar] [CrossRef]
  51. Xiang, S.; Hu, Z.; Zhai, W.; Wen, D.; Noll, K.E. Concentration of Ultrafine Particles near Roadways in an Urban Area in Chicago, Illinois. Aerosol Air Qual. Res. 2018, 18, 895–903. [Google Scholar] [CrossRef]
  52. Wang, F.; Ketzel, M.; Ellermann, T.; Wåhlin, P.; Jensen, S.; Fang, D.; Massling, A. Particle number, particle mass and NO x emission factors at a highway and an urban street in Copenhagen. Atmos. Chem. Phys. 2010, 10, 2745–2764. [Google Scholar] [CrossRef]
  53. Hilker, N.; Wang, J.M.; Jeong, C.-H.; Healy, R.M.; Sofowote, U.; Debosz, J.; Su, Y.; Noble, M.; Munoz, A.; Doerksen, G. Traffic-related air pollution near roadways: Discerning local impacts from background. Atmos. Meas. Tech. 2019, 12, 5247–5261. [Google Scholar] [CrossRef]
  54. Xiang, S.; Zhang, S.; Yu, Y.T.; Wang, H.; Shen, Y.; Zhang, Q.; Wang, Z.; Wang, D.; Tian, M.; Wang, J. Evaluation of the Relationship between Meteorological Variables and NO x Emission Factors Based on Plume-Chasing Measurements. ACS EST Eng. 2023, 3, 417–426. [Google Scholar] [CrossRef]
  55. Brantley, H.; Hagler, G.; Kimbrough, E.; Williams, R.; Mukerjee, S.; Neas, L. Mobile air monitoring data-processing strategies and effects on spatial air pollution trends. Atmos. Meas. Tech. 2014, 7, 2169–2183. [Google Scholar] [CrossRef]
  56. Zheng, T.; Wen, Y.; Xiang, S.; Yang, P.; Zheng, X.; You, Y.; Zhang, S.; Wu, Y. Cost-Effective Mapping of Hyperlocal Air Pollution Using Large-Scale Mobile Monitoring and Land-Use Machine Learning. ACS EST Air 2025. [Google Scholar] [CrossRef]
  57. Xiang, S.; Zhang, S.; Yu, Y.T.; Wang, H.; Hao, K.; Wu, Y. Significant NO2 Formation in Truck Exhaust Plumes and Its Association with Ambient O3: Evidence from Extensive Plume-Chasing Measurements. Environ. Sci. Technol. 2025. [Google Scholar] [CrossRef]
Figure 1. Map of mobile monitoring routes in the study domain. Road types and location of weather tower are identified. The scale bar represents the scale in the main map.
Atmosphere 16 00171 g001
Figure 2. Mobile monitoring measurements categorized by wind sectors for (a) PNC, (b) BC, and (c) NOx during the sampling campaign. In the box plots, the solid line represents the median; the bottom and top of the box plots represent the 25th percentile and 75th percentile, respectively.
Atmosphere 16 00171 g002
Figure 3. Correlation matrix for TRAP measured during non-holiday and holiday sampling campaigns. Pearson’s correlation coefficients with statistical significance (p < 0.01) are shown.
Atmosphere 16 00171 g003
Figure 4. Correlation matrix for TRAPs measured during non-holiday and holiday sampling campaigns. Spearman’s correlation coefficients with statistical significance (p < 0.01) are shown.
Atmosphere 16 00171 g004
Figure 5. Distributions of pollutant concentrations from mobile monitoring at different dates for (a) PNC, (b) BC, and (c) NOx, respectively. In the box plots, the solid black line represents the median; the bottom and top of the box plots represent the 25th percentile and 75th percentile, respectively; and whiskers above and below represent the 90th and 10th percentiles, respectively.
Atmosphere 16 00171 g005
Figure 6. Delta pollutant concentrations on different road types for (a) PNC, (b) BC, and (c) NOx. Mood’s median test is applied for each road type. In the box plots, the solid black line represents the median; the bottom and top of the box plots represent the 25th percentile and 75th percentile, respectively; and whiskers above and below represent the 90th and 10th percentiles, respectively. Note: ** indicates statistically significant differences between the medians of the groups with p-values < 0.01.
Atmosphere 16 00171 g006
Table 1. Summary of the median concentrations of TRAPs under different microenvironments.
Date(mm-dd)BackgroundUrban FreewayRural Freeway
PNC * BC #NOx $PNC * BC #NOx $PNC *BC #NOx $
Non-holiday9-2110,517156152.632,3667808303.7n.a.n.a.n.a.
9-2214,5073152104.933,50710,256328.6n.a.n.a.n.a.
9-2313,863361182.831,57910,804312.618,6655627127.6
9-2410,738396971.224,4679138.5244.727,0828348237.8
9-279353158145.030,6208330302.5n.a.n.a.n.a.
9-289437277862.223,5318196257.3n.a.n.a.n.a.
9-29440582024.728,86111,929326.312,199452296.0
9-3010,022347497.741,45715,373415.316,5207407164.9
10-93440130631.026,5029847372.312,5253887145.3
10-106790106630.124,30010,059316.715,4924377116.8
Holiday10-16552146939.812,770482687.614,611498465.8
10-26020154626.812,193410485.811,841284984.0
10-3625884124.620,5983063129.416,3913989146.7
10-4441141719.315,6873975162.35261174247.4
10-6752481340.818,6154187150.57780245474.9
10-7394351517.014,8225091133.08816327499.7
10-8327279114.917,182n.a.275.59543316184.3
*: PNC unit: particles cm−3; #: BC unit: ng m−3; $: NOx unit: ppb.
Disclaimer/Publisher’s Note: The statements, opinions and data contained in all publications are solely those of the individual author(s) and contributor(s) and not of MDPI and/or the editor(s). MDPI and/or the editor(s) disclaim responsibility for any injury to people or property resulting from any ideas, methods, instructions or products referred to in the content.

