Article

Spatiotemporal Dynamics of PM2.5-Related Premature Deaths and the Role of Greening Improvement in Sustainable Urban Health Governance

by
Peng Tang
1,
Tianshu Liu
2,
Xiandi Zheng
1 and
Jie Zheng
2,*
1
School of Environmental Ecology, Jiangsu Open University, Nanjing 210019, China
2
School of Forestry and Landscape Architecture, Anhui Agricultural University, Hefei 230036, China
*
Author to whom correspondence should be addressed.
Atmosphere 2025, 16(2), 232; https://doi.org/10.3390/atmos16020232
Submission received: 13 January 2025 / Revised: 10 February 2025 / Accepted: 14 February 2025 / Published: 18 February 2025
(This article belongs to the Section Air Quality)

Abstract

:
Environmental particulate pollution is a major global environmental health risk factor, which is associated with numerous adverse health outcomes, negatively impacting public health in many countries, including China. Despite the implementation of strict air quality management policies in China and a significant reduction in PM2.5 concentrations in recent years, the health burden caused by PM2.5 pollution has not decreased as expected. Therefore, a comprehensive analysis of the health burden caused by PM2.5 is necessary for more effective air quality management. This study makes an innovative contribution by integrating the Enhanced Vegetation Index (EVI), Normalized Difference Vegetation Index (NDVI), and Soil-Adjusted Vegetation Index (SAVI), providing a comprehensive framework to assess the health impacts of green space coverage, promoting healthy urban environments and sustainable development. Using Nanjing, China, as a case study, we constructed a health impact assessment system based on PM2.5 concentrations and quantitatively analyzed the spatiotemporal evolution of premature deaths caused by PM2.5 from 2000 to 2020. Using Multiscale Geographically Weighted Regression (MGWR), we explored the impact of greening improvement on premature deaths attributed to PM2.5 and proposed relevant sustainable governance strategies. The results showed that (1) premature deaths caused by PM2.5 in Nanjing could be divided into two stages: 2000–2015 and 2015–2020. During the second stage, deaths due to respiratory and cardiovascular diseases decreased by 3105 and 1714, respectively. (2) The spatial variation process was slow, with the overall evolution direction predominantly from the southeast to northwest, and the spatial distribution center gradually shifted southward. On a global scale, the Moran’s I index increased from 0.247251 and 0.240792 in 2000 to 0.472201 and 0.468193 in 2020. The hotspot analysis revealed that high–high correlations slowly gathered toward central Nanjing, while the proportion of cold spots increased. (3) The MGWR results indicated a significant negative correlation between changes in green spaces and PM2.5-related premature deaths, especially in densely vegetated areas. This study comprehensively considered the spatiotemporal changes in PM2.5-related premature deaths and examined the health benefits of green space improvement, providing valuable references for promoting healthy and sustainable urban environmental governance and air quality management.

1. Introduction

With the rapid development of the social economy, a large number of anthropogenic pollutants has been emitted into the atmosphere, leading to severe air pollution [1], which has significant negative impacts on human health and the environment [2]. According to the Organization for Economic Cooperation and Development (OECD), air pollution is the leading environmental cause of “premature” death, with long-term exposure to high concentrations of PM2.5 causing respiratory and cardiovascular diseases [3,4,5], especially in the urban clusters of the Yangtze River Delta and the Pearl River Delta in China [6,7]. Despite the implementation of various air pollution control policies in China, premature deaths caused by PM2.5 pollution continue to rise [8]. Some studies suggest that health is a dynamic state, and the level of surrounding greening is positively correlated with individuals’ perceived health status [9]. The number of green spaces, along with their vegetation coverage and size (structural categories), has improved human well-being in various aspects, especially in terms of health [10]. Green spaces can encourage physical activity, mental health, and social interaction, addressing public health issues such as obesity and mental health disorders [11]. Additionally, urban livability has always been associated with health, but poor air quality may pose health risks to vulnerable groups [12]. This concept is based on the understanding that there is a connection between health, green spaces, and the living environment. Therefore, in order to reduce the health burden, we consider it important to incorporate green spaces into the assessment of the health impacts of urban living environments.
The impact of PM2.5 on health is represented by the exposure–response function in health impact assessment models (HIAMs) developed using epidemiology, typically expressed as the mortality rate attributable to PM2.5 [13]. Health Impact Assessments (HIAs) originated in Europe as part of Environmental Impact Assessments (EIAs), but as the importance of sustainable development grew, HIAs gradually became independent from EIAs, focusing on the quantitative analysis of policies and plans that may affect public health [14]. Examples of such applications include the U.S. Environmental Air Quality Standards [15] and the spatial planning in the U.K. [16]. The worsening of global air pollution has prompted epidemiologists to link air pollution with the incidence and mortality of respiratory diseases [17]. HIAs have evolved from being merely a tool for public policy decision-making into a multi-functional framework for quantifying the impact on public health. For instance, in Alberto Castro’s study, it was used to assess the health benefits of implementing clean air programs in cities [18]. He Q used this method to study the impact of air pollution on health [19]. Moreover, the effectiveness of such clean air programs heavily relies on the openness and accessibility of air quality and healthcare data. Studies have shown that the status of air quality reporting can serve as a reliable indicator of a city’s environmental data openness. Meanwhile, in modern healthcare, medical datasets are increasingly utilized to enhance patient care, including through population health analysis and the development of diagnostic machine learning algorithms [20,21].
However, quantifying PM2.5 exposure levels has always been a challenge. Traditional methods, based on ground monitoring station data, though commonly used, do not adequately capture long-term effects [22,23]. In China, the large-scale construction of monitoring stations only began in 2013, with most concentrated in urban areas, leaving rural and peri-urban regions under-monitored [24]. This limitation affects the comprehensive capture of spatiotemporal variations in PM2.5, as well as long-term studies on its health impacts [25], particularly comparisons between pre- and post-2013. With the advancement of satellite remote sensing technology, higher-precision spatial data can now be utilized to estimate long-term exposure to outdoor air pollution. Satellite-derived aerosol optical depth (AOD) products, when combined with ground-based observations and advanced modeling techniques, offer an effective solution for PM concentration estimation, especially in regions with limited monitoring stations. Studies have shown that integrating satellite data with sensor networks or machine learning models can significantly enhance the accuracy of particulate matter (PM) predictions. These advancements provide a valuable alternative for global air quality assessments and public health protection in areas lacking sufficient ground-based infrastructure [26,27,28].
PM2.5 has numerous adverse health effects, including triggering cardiovascular and respiratory diseases, and even leading to premature death [22]. Most studies attribute these effects to factors such as PM2.5 concentration, population, community size, economic level, or exposure extent [21,29,30,31,32], while overlooking another crucial environmental exposure: the impact of green space on PM2.5 and health. According to several proposed mechanisms, green spaces have been shown to promote health, including by increasing physical activity levels, reducing stress, and lowering exposure to noise and traffic-related air pollutants [33]. Some studies have found a negative correlation between green space exposure and all-cause mortality [34], and have demonstrated that changes in green space area can significantly affect PM2.5 concentrations [35]. On the one hand, one study showed that green spaces can effectively reduce the concentration of PM2.5; when the vegetation coverage increased by 10%, the PM2.5 concentration fell 6–8% [36] and PM2.5 deposition was effectively promoted. For example, leaves intercepted 20–40% of the PM2.5 and reducing the wind speed and increasing air humidity indirectly reduced PM2.5 resuspension, formed a local barrier, and reduced the traffic source particulate matter diffusion range by more than 50%. On the other hand, green spaces are beneficial to human health and well-being [37], with green space area having a positive effect on perceived human health [38]. One key potential pathway linking green spaces and health is the association between green areas and reduced exposure to air pollution. A large-scale analysis of 35 million Medicare enrollees in the U.S. directly studied the impact of green spaces on the relationship between long-term PM2.5 exposure and mortality [39].
Nevertheless, the mechanisms linking green spaces, health, and PM2.5 are still not well understood. Current studies commonly use tools such as the LUR model and the NDVI to assess the impact of green spaces on PM2.5 and its health consequences [40]. However, these tools often fail to fully reflect the actual effects of green spaces. Therefore, based on the NDVI, we combined the Soil-Adjusted Vegetation Index (SAVI) and the Enhanced Vegetation Index (EVI) to investigate the impact of greening on Health Impact Assessments (HIAs). The SAVI minimizes the influence of soil background, while the EVI enhances vegetation monitoring capabilities and is regarded as an effective improvement over the NDVI. According to Luo’s study, these indices have also shown certain health impacts [41]. Based on this evidence, we have reason to believe that the joint use of the NDVI, SAVI, and EVI to assess the impact of green spaces on PM2.5 concentrations and their effects on health will open up new research directions. This approach could provide more accurate data, helping scientists better understand and utilize the benefits of green spaces, thus playing a greater role in urban planning and public health.
The Yangtze River Delta region is one of the areas in China where the composite air pollution is particularly severe. Nanjing, as a core city of the Yangtze River Delta, is an important comprehensive industrial production base in China [42]. Due to its geographical location and urban characteristics, Nanjing experiences significant air pollution caused by industrial emissions. As a mega-city in the Yangtze River Delta and a key central city in the eastern region, Nanjing’s rapid urbanization has triggered a noticeable regional spillover effect, with rapid growth in both transportation and population in the city and its surrounding areas, further exacerbating the air pollution issues [43]. This is compounded by the fact that population concentration also leads to an increase in the incidence and mortality of diseases caused by air pollution, a common challenge that most cities in central and eastern China have faced in recent years.
This study focused on a Health Impact Assessment (HIA) of Nanjing and conducted health evaluations on two types of diseases related to PM2.5, with a particular focus on their dynamic evolution. Based on this, we selected three vegetation indices—the NDVI, EVI, and SAVI—and explored the spatial correlation between these vegetation indices and the HIA using Multiscale Geographically Weighted Regression (MGWR). The main objectives of this study included the following: (1) quantitatively describing the spatial distribution pattern in the HIA in Nanjing and analyzing its spatial correlation and (2) unlike previous studies, we accounted for spatial heterogeneity, conducting correlation analysis using variations through Multiscale Geographically Weighted Regression.

2. Materials and Methods
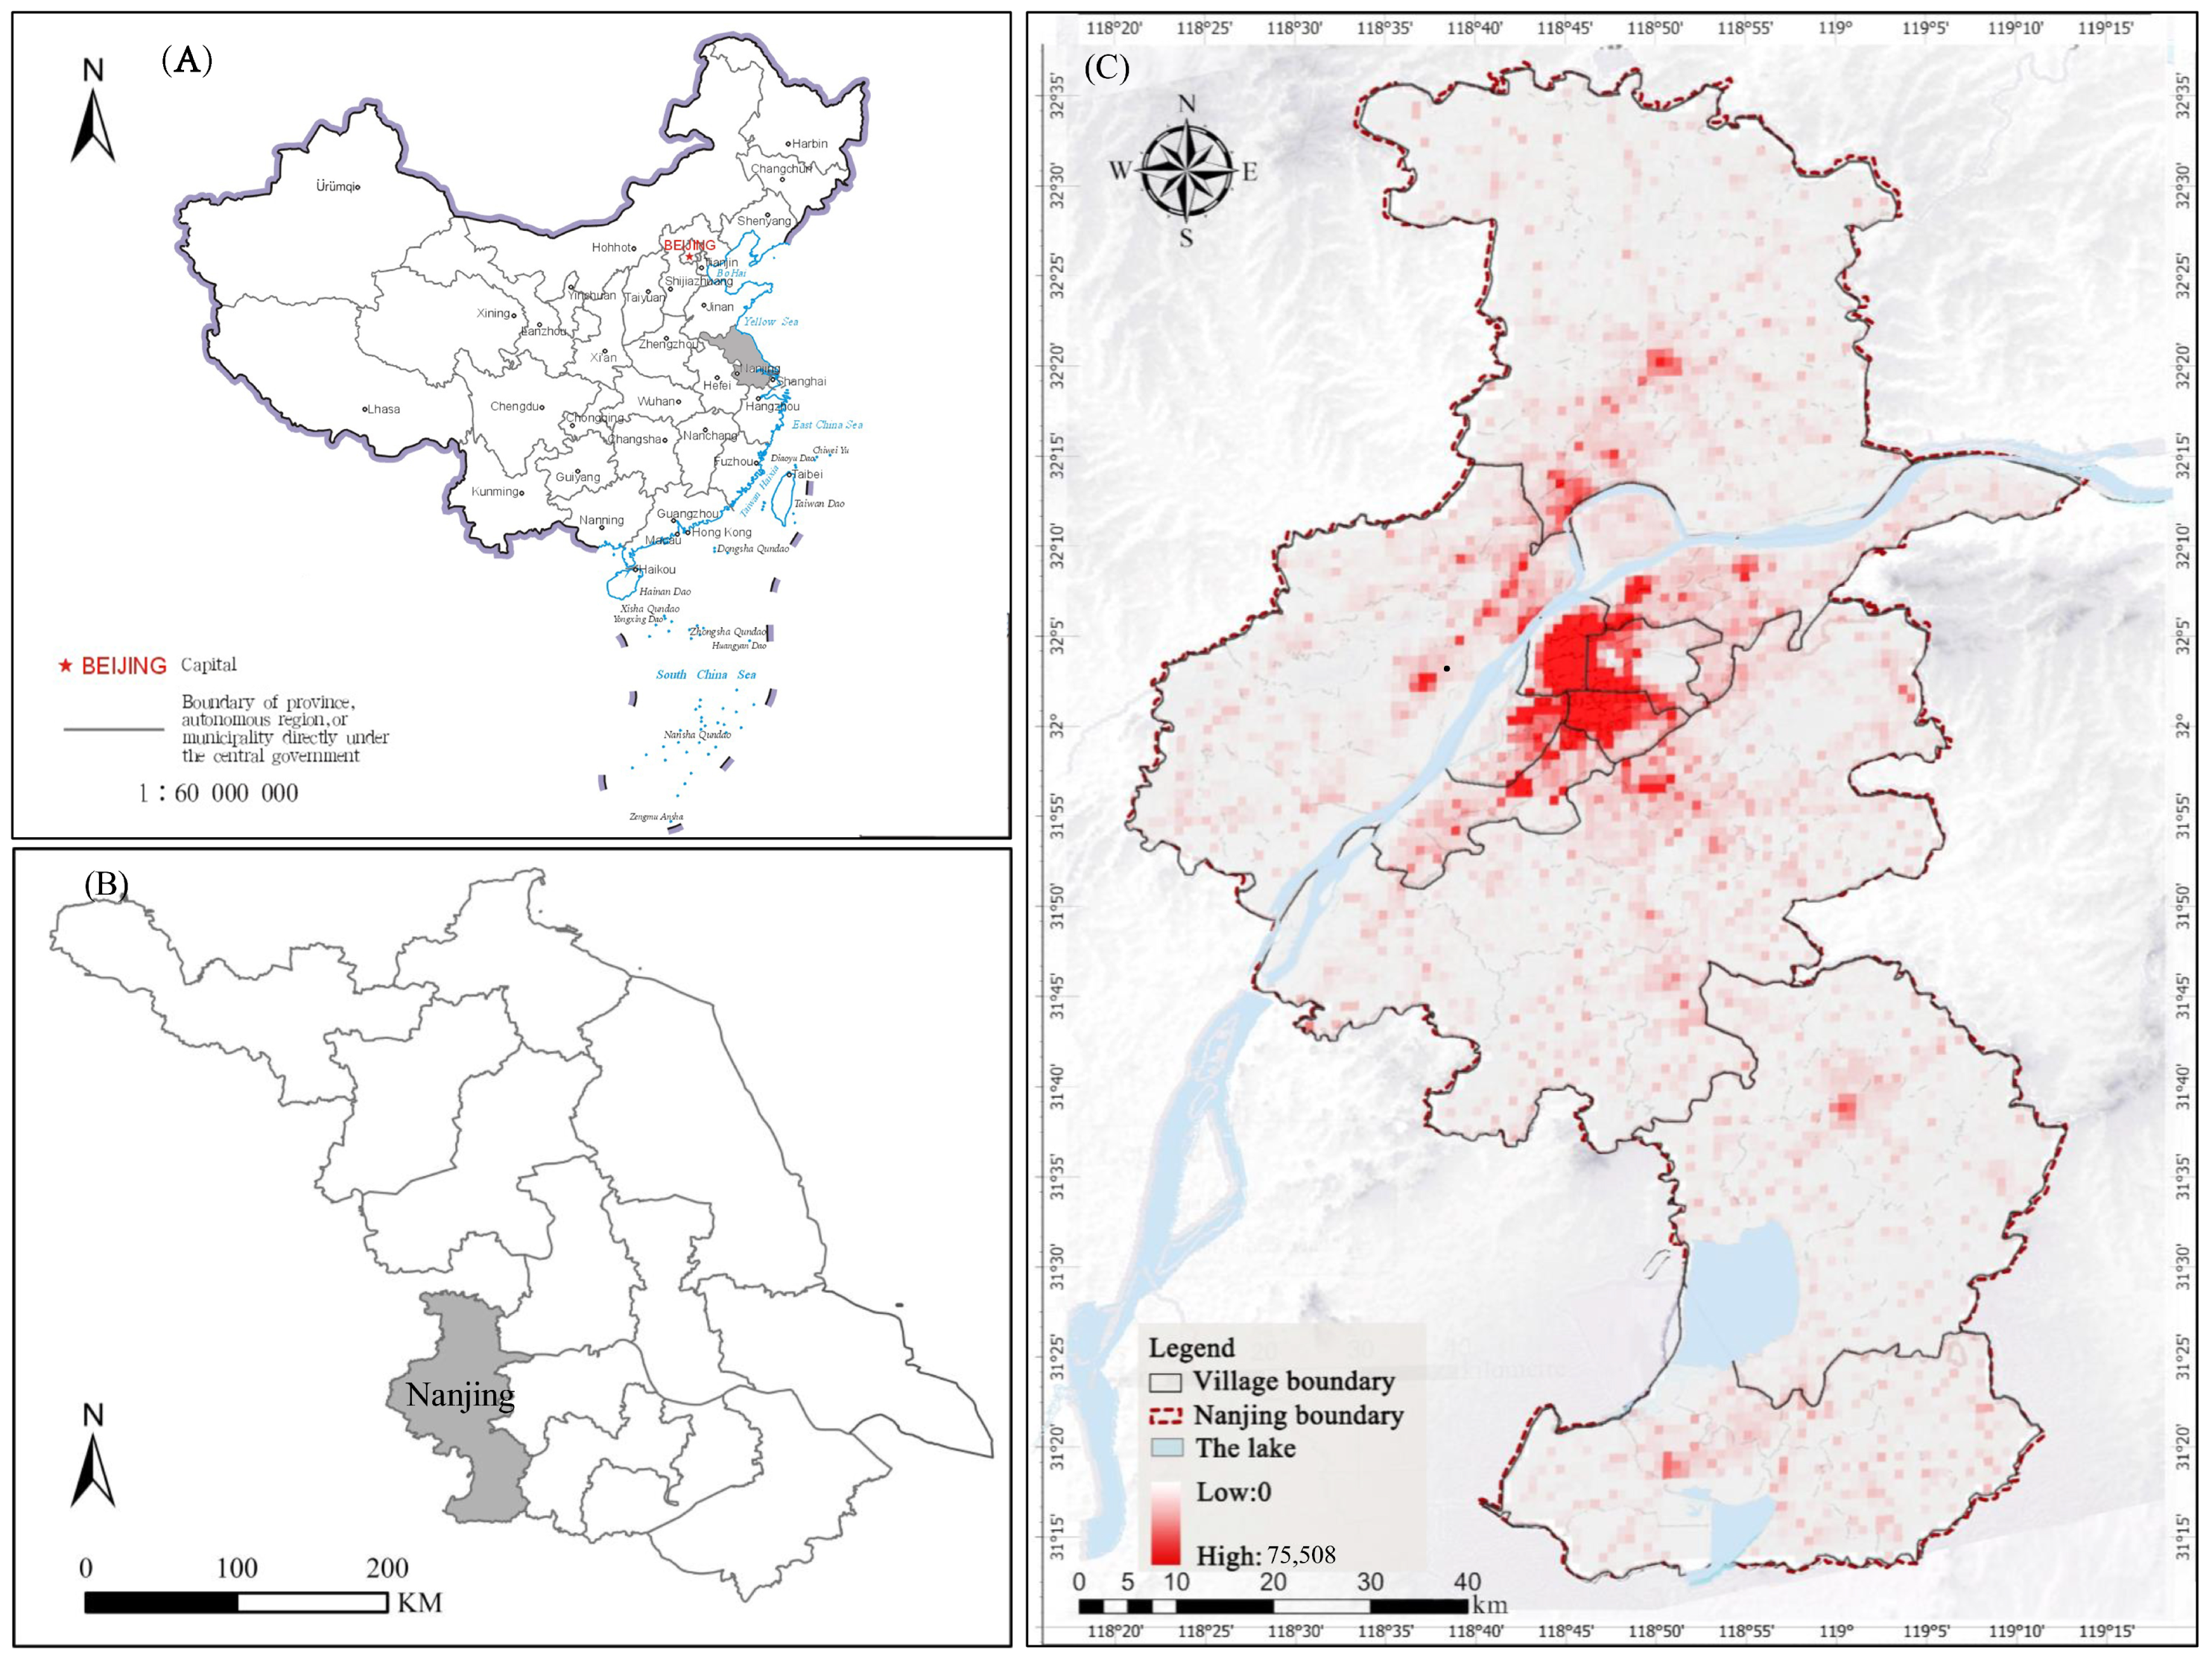
2.1. Research Area

Nanjing is located in the southwestern part of Jiangsu Province and is characterized by low mountains and gentle slopes (Figure 1). The total area of Nanjing is 6587.02 km2, and by the end of 2022, the population reached 9.4234 million, making it one of the most densely populated provincial capitals in China. The city boasts diverse vegetation, with a green space coverage rate of 45.16%, and is known for its distinctive features of “mountains, water, city, and forests”. Over the past thirty years, Nanjing, as a typical high-density city in the Yangtze River Delta, has experienced rapid urbanization driven by government policies and urban expansion, positioning Nanjing at the forefront of China’s urban development in terms of both scale and speed. This rapid urbanization has accelerated the growth and concentration of the surrounding traffic and population towards Nanjing, leading to a rapid expansion of the built-up area. At the same time, industrial development has surged, with large amounts of anthropogenic pollutants being emitted into the atmosphere. This has resulted in ecological issues such as reduced green spaces and severe air pollution, contributing to significant health burdens.

2.2. Data Source

The vector data for Nanjing were sourced from the National Geophysical Data Center of China (http://www.ngcc.cn, accessed on 15 May 2024), and the vegetation indices were extracted using the ENVI method from Landsat satellite data: the NDVI was determined using the red band (approximately 620–670 nm) and near-infrared band (approximately 780–900 nm); the EVI was determined using the blue band (approximately 450–500 nm), red band (approximately 620–670 nm), and near-infrared band (approximately 780–900 nm); and the SAVI was determined using the red band (approximately 620–670 nm) and near-infrared band (approximately 780–900 nm). The disease incidence data, in panel format, were sourced from the Global Burden of Disease (GBD) database. The spatial population distribution was based on data from Oak Ridge National Laboratory. The spatial distribution data for PM2.5 were obtained from the National Tibetan Plateau Scientific Data Center website (https://data.tpdc.ac.cn/home), which have a spatial resolution of 1 km.

2.3. Analysis Method

This study compared the relationship between green spaces and premature deaths caused by PM2.5 and the research process include the following steps: First, premature deaths from specific diseases in Nanjing due to PM2.5 exposure were quantified using a Health Impact Assessment (HIA). Second, the spatial evolution characteristics were explored through standard deviation ellipse and spatial autocorrelation analyses. Finally, the relationship between green spaces and premature deaths caused by PM2.5 in Nanjing was investigated using Multiscale Geographically Weighted Regression (MGWR), providing insights for urban health, green space planning, and air quality policy formulation.

2.3.1. Health Impact Assessment (HIA)

We reviewed the literature and based on several epidemiological studies, it was found that PM2.5 particles can enter the bloodstream through the respiratory system and have a negative impact on the cardiovascular system. PM2.5 can exacerbate arteriosclerosis, induce thrombosis, and trigger heart attacks, among other effects [5,44,45,46]. Therefore, our health impact assessment included two types of diseases: cardiovascular and respiratory diseases. To link fine particulate matter concentrations with adverse health outcomes, this study employed the Health Impact Assessment (HIA) methodology, which calculates the premature deaths caused by PM2.5 at the spatial grid scale based on estimated PM2.5 concentrations, exposure–response coefficients, and the spatial population distribution. The calculation formula was as follows:
i , t = f t × R i , t × X i , t
In Equation (1), i , t represents the number of premature deaths for each health endpoint caused by PM2.5 in grid i for year t, f t refers to the baseline incidence rate of specific diseases in Jiangsu Province for year t, R i , t indicates the exposed population in grid i for year t, and X i , t denotes the attributable fraction in grid i for year t.
The calculation formula for χ i , t was as follows:
X i , t = R R 1 R R
RR represents the relative risk of PM2.5 on health outcomes.
R R = e x p [ β ( C C 0 ) ]
Here, C represents the annual average concentration of air pollutants, while C0 is the reference safe threshold concentration for health risks associated with pollutants, based on the air quality guidelines of the World Health Organization [47]. β is the exposure–response coefficient, indicating the percentage increase in health impacts for every 10 µg/m³ increase in the concentration of a specific air pollutant. The β value was derived from the results of a meta-analysis of recent relevant literature on Chinese residents [48]. Furthermore, the coefficient results have been validated in other studies. For instance, the WHO Global Air Quality Guidelines (2021) provide a reference value for the β coefficient of the association between PM2.5 and mortality, derived from a comprehensive meta-analysis (HR = 1.08 per 10 µg/m3). Additionally, a cohort study conducted by the American Cancer Society, analyzed using Cox models, showed that for every 10 μg/m3 increase in PM2.5, the overall mortality hazard ratio (HR) was 1.06. These results are closely aligned [49,50].

2.3.2. Spatial Autocorrelation Analysis

Professor Tobler proposed in his research that spatial autocorrelation should be primarily used to analyze the relationships of geographic factors in spatial distributions [51]. To examine the overall trend in the spatial correlation characteristics of the HIA results under different PM2.5 concentrations in Nanjing, this study employed both global and local spatial autocorrelation to summarize the degree of spatial dependence. The calculation formulas were as follows:
I = i = 1 n j = 1 n ω i j ( S i S ¯ ) ( S j S ¯ ) X 2 i = 1 n j = 1 n ω i j
In Equation (4), I represents Moran’s index; n denotes the number of regions in the study area; Sj and Si represent the ecological sensitivities of regions i and j, respectively, and represent the spatial weight matrix; X2 represents the variance of the ecological sensitivities; and S ¯ represents the mean of the ecological sensitivities.
Local spatial autocorrelation reflects the degree of similarity between a grid and its surrounding adjacent grids, as well as the spatial heterogeneity. To adequately capture the variation trends in premature deaths caused by PM2.5 among the different regions in Nanjing, this study employed hotspot analysis within local spatial autocorrelation to discuss the spatial heterogeneity. The calculation formula was as follows:
Z ( G i ) = G I E ( G I ) V a r ( G i )
In Equation (5), Z ( G i ) represents the Z-score, G I represents the Getis–Ord G I * statistic for the i-th region; E ( G I ) represents the expected value of the Getis–Ord G I * statistic; and V a r ( G i ) represents the standard deviation of the Getis–Ord G I * statistic.

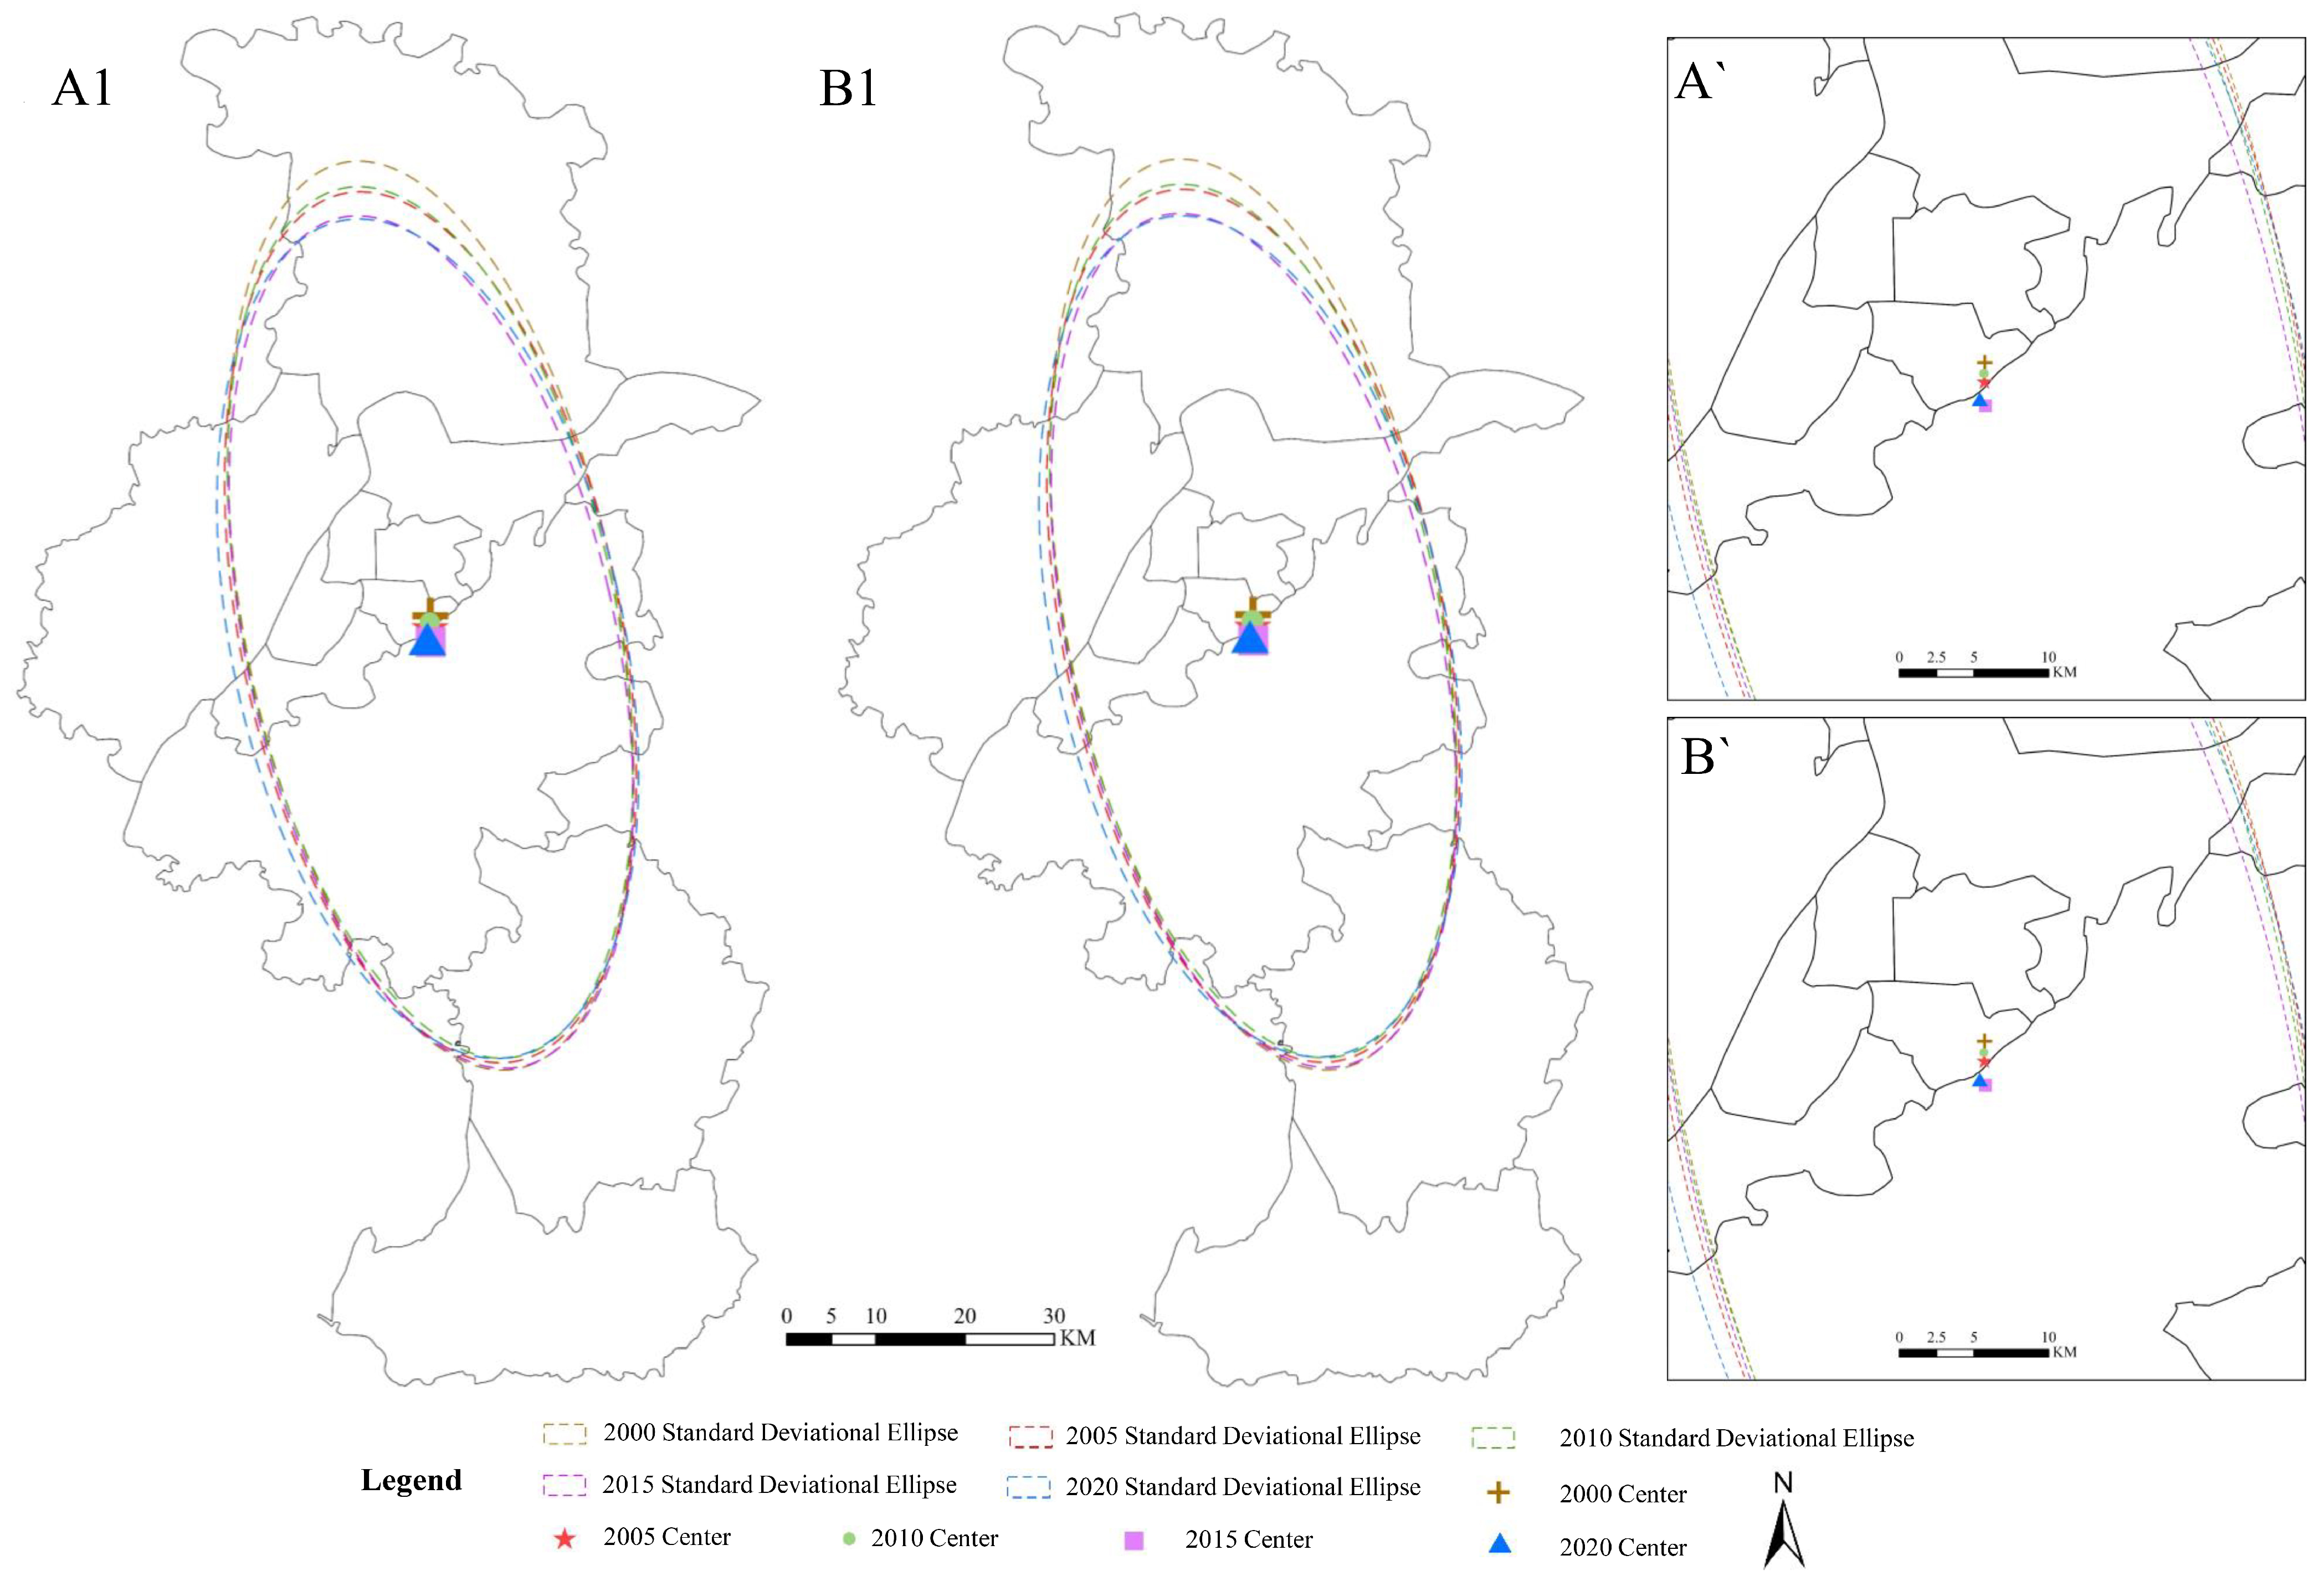
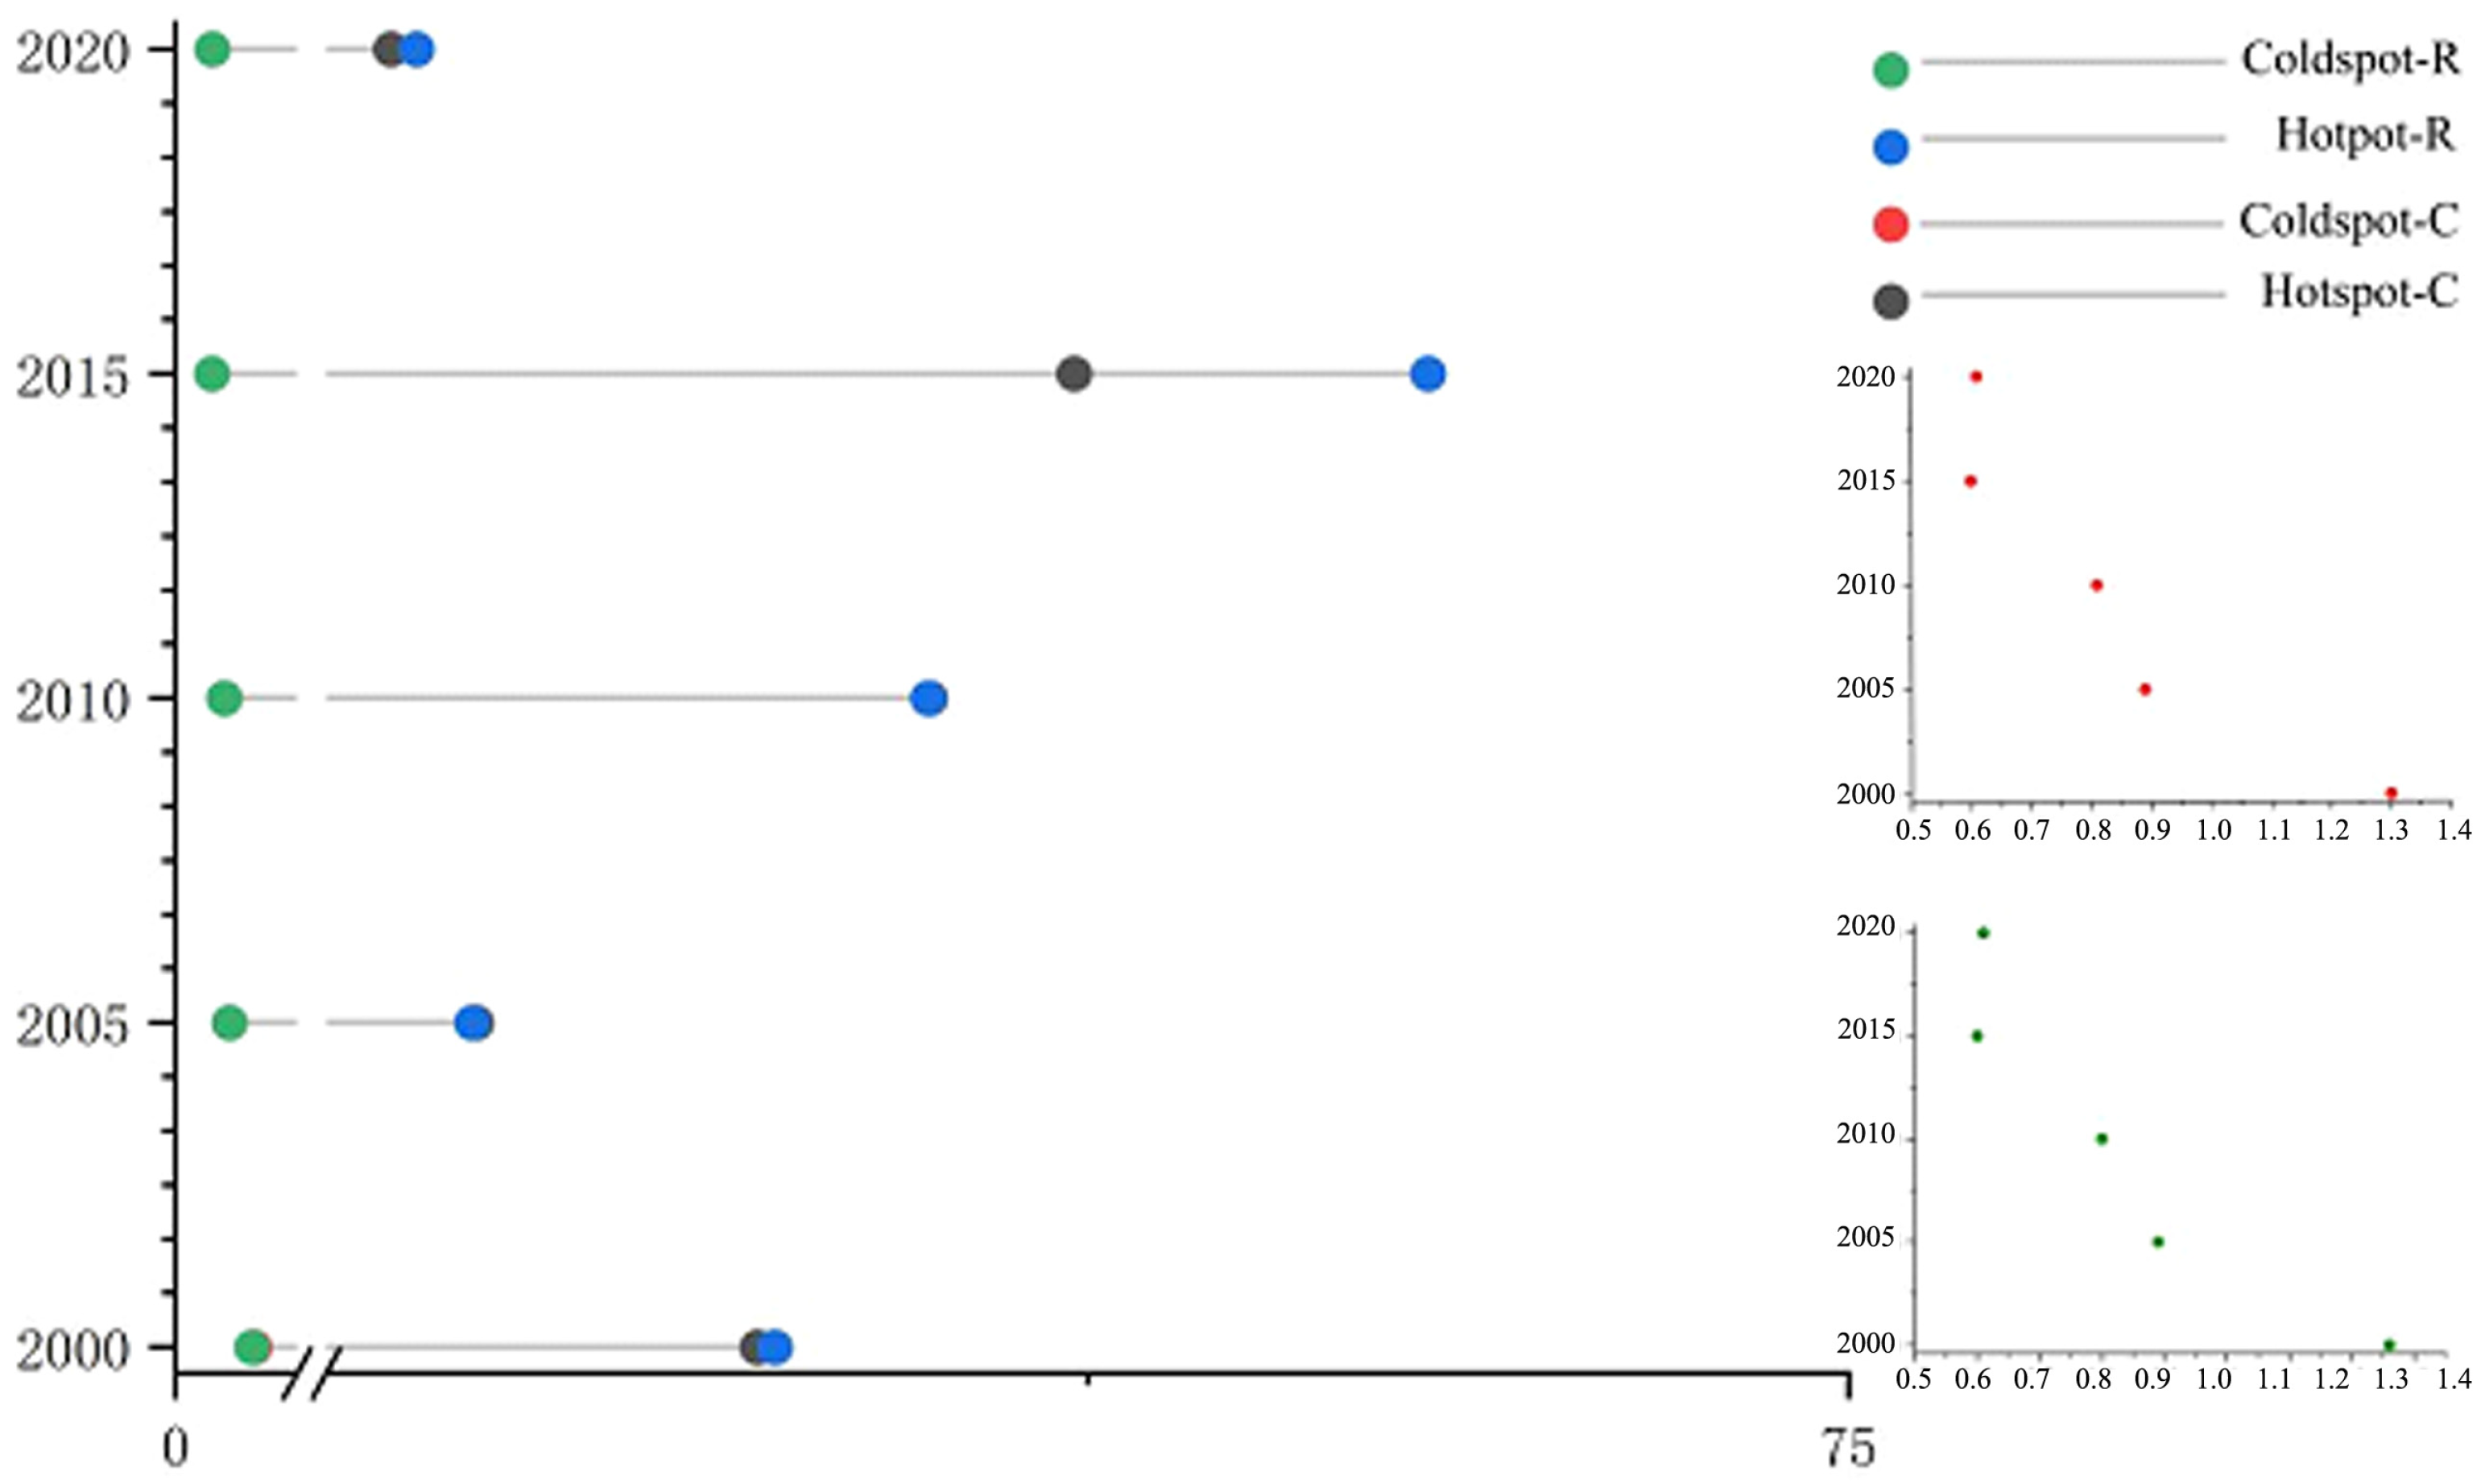
2.3.3. Standard Deviation Ellipse

The standard deviation ellipse provides a quantitative interpretation of the centrality, dispersion, orientation, and spatial morphology of geographic features from global and spatial perspectives [52]. This study utilized the spatial analysis capabilities of GIS and employed the standard deviation ellipse method to analyze the spatial development direction of premature deaths caused by PM2.5 in Nanjing [53]. The calculation formula was as follows:
tan   θ = i = 1 n ( X i X ¯ ) 2 i = 1 n ( Y i Y ¯ ) 2 + i = 1 n ( X i X ¯ ) 2 i = 1 n ( Y i Y ¯ ) 2 2 + 4 i = 1 n ( X i X ¯ ) 2 i = 1 n ( Y i Y ¯ ) 2 2 2 i = 1 n i = 1 n X i X i = 1 n Y i Y
The standard deviations for the X and Y axes were calculated using the following formulas:
σ X = i = 1 n X i X ¯ cos θ Y i Y ¯ sin θ 2 / n
σ Y = i = 1 n X i X ¯ sin θ Y i Y ¯ cos θ 2 / n
The centroid was calculated as follows:
X ¯ = i = 1 n x i E i i = 1 n E i , Y ¯ = i = 1 n y i E i i = 1 n E i
In Equations (6)–(9), θ is the azimuthal angle of the ellipse. σx and σy represent the standard deviations along the X and Y axes of the ellipse. (Xi, Yi) denotes the geographical coordinates of the i-th study object. The numbers of objects, X ¯ and Y ¯ , represent the geometric center.

2.3.4. Multiscale Geographically Weighted Regression (MGWR)

The distribution of PM2.5 and the ecological benefits of vegetation often show significant spatial non-stationarity. The MGWR model is the extension of geographic weighted regression, relative to a traditional global model such as OLS or a single-scale local model such as GWR; it allows the use of different bandwidths of explanatory variables, a local regression model, and specific bandwidths and can describe the space of the different variables and the local characteristics of explanatory variables, thus improving the accuracy of the regression results. We introduced the Multiscale Geographically Weighted Regression model to analyze the impact of changes in green space spatial patterns on health risks associated with PM2.5. The formula was as follows [54]:
Y o = β o ( u i ) + j = 1 n β k ( u i ) x i k + i
In Equation (10), Yo represents the dependent variable for the i-th observation; β o ( u i ) represents the intercept term for the i-th observation and the local regression coefficient for the i-th observation concerning the independent variable β k ( u i ) ; x i k represents the value of the k-th independent variable for the i-th observation; i represents the error term for the i-th observation; and u i represents the geographic location of the i-th observation.

3. Results

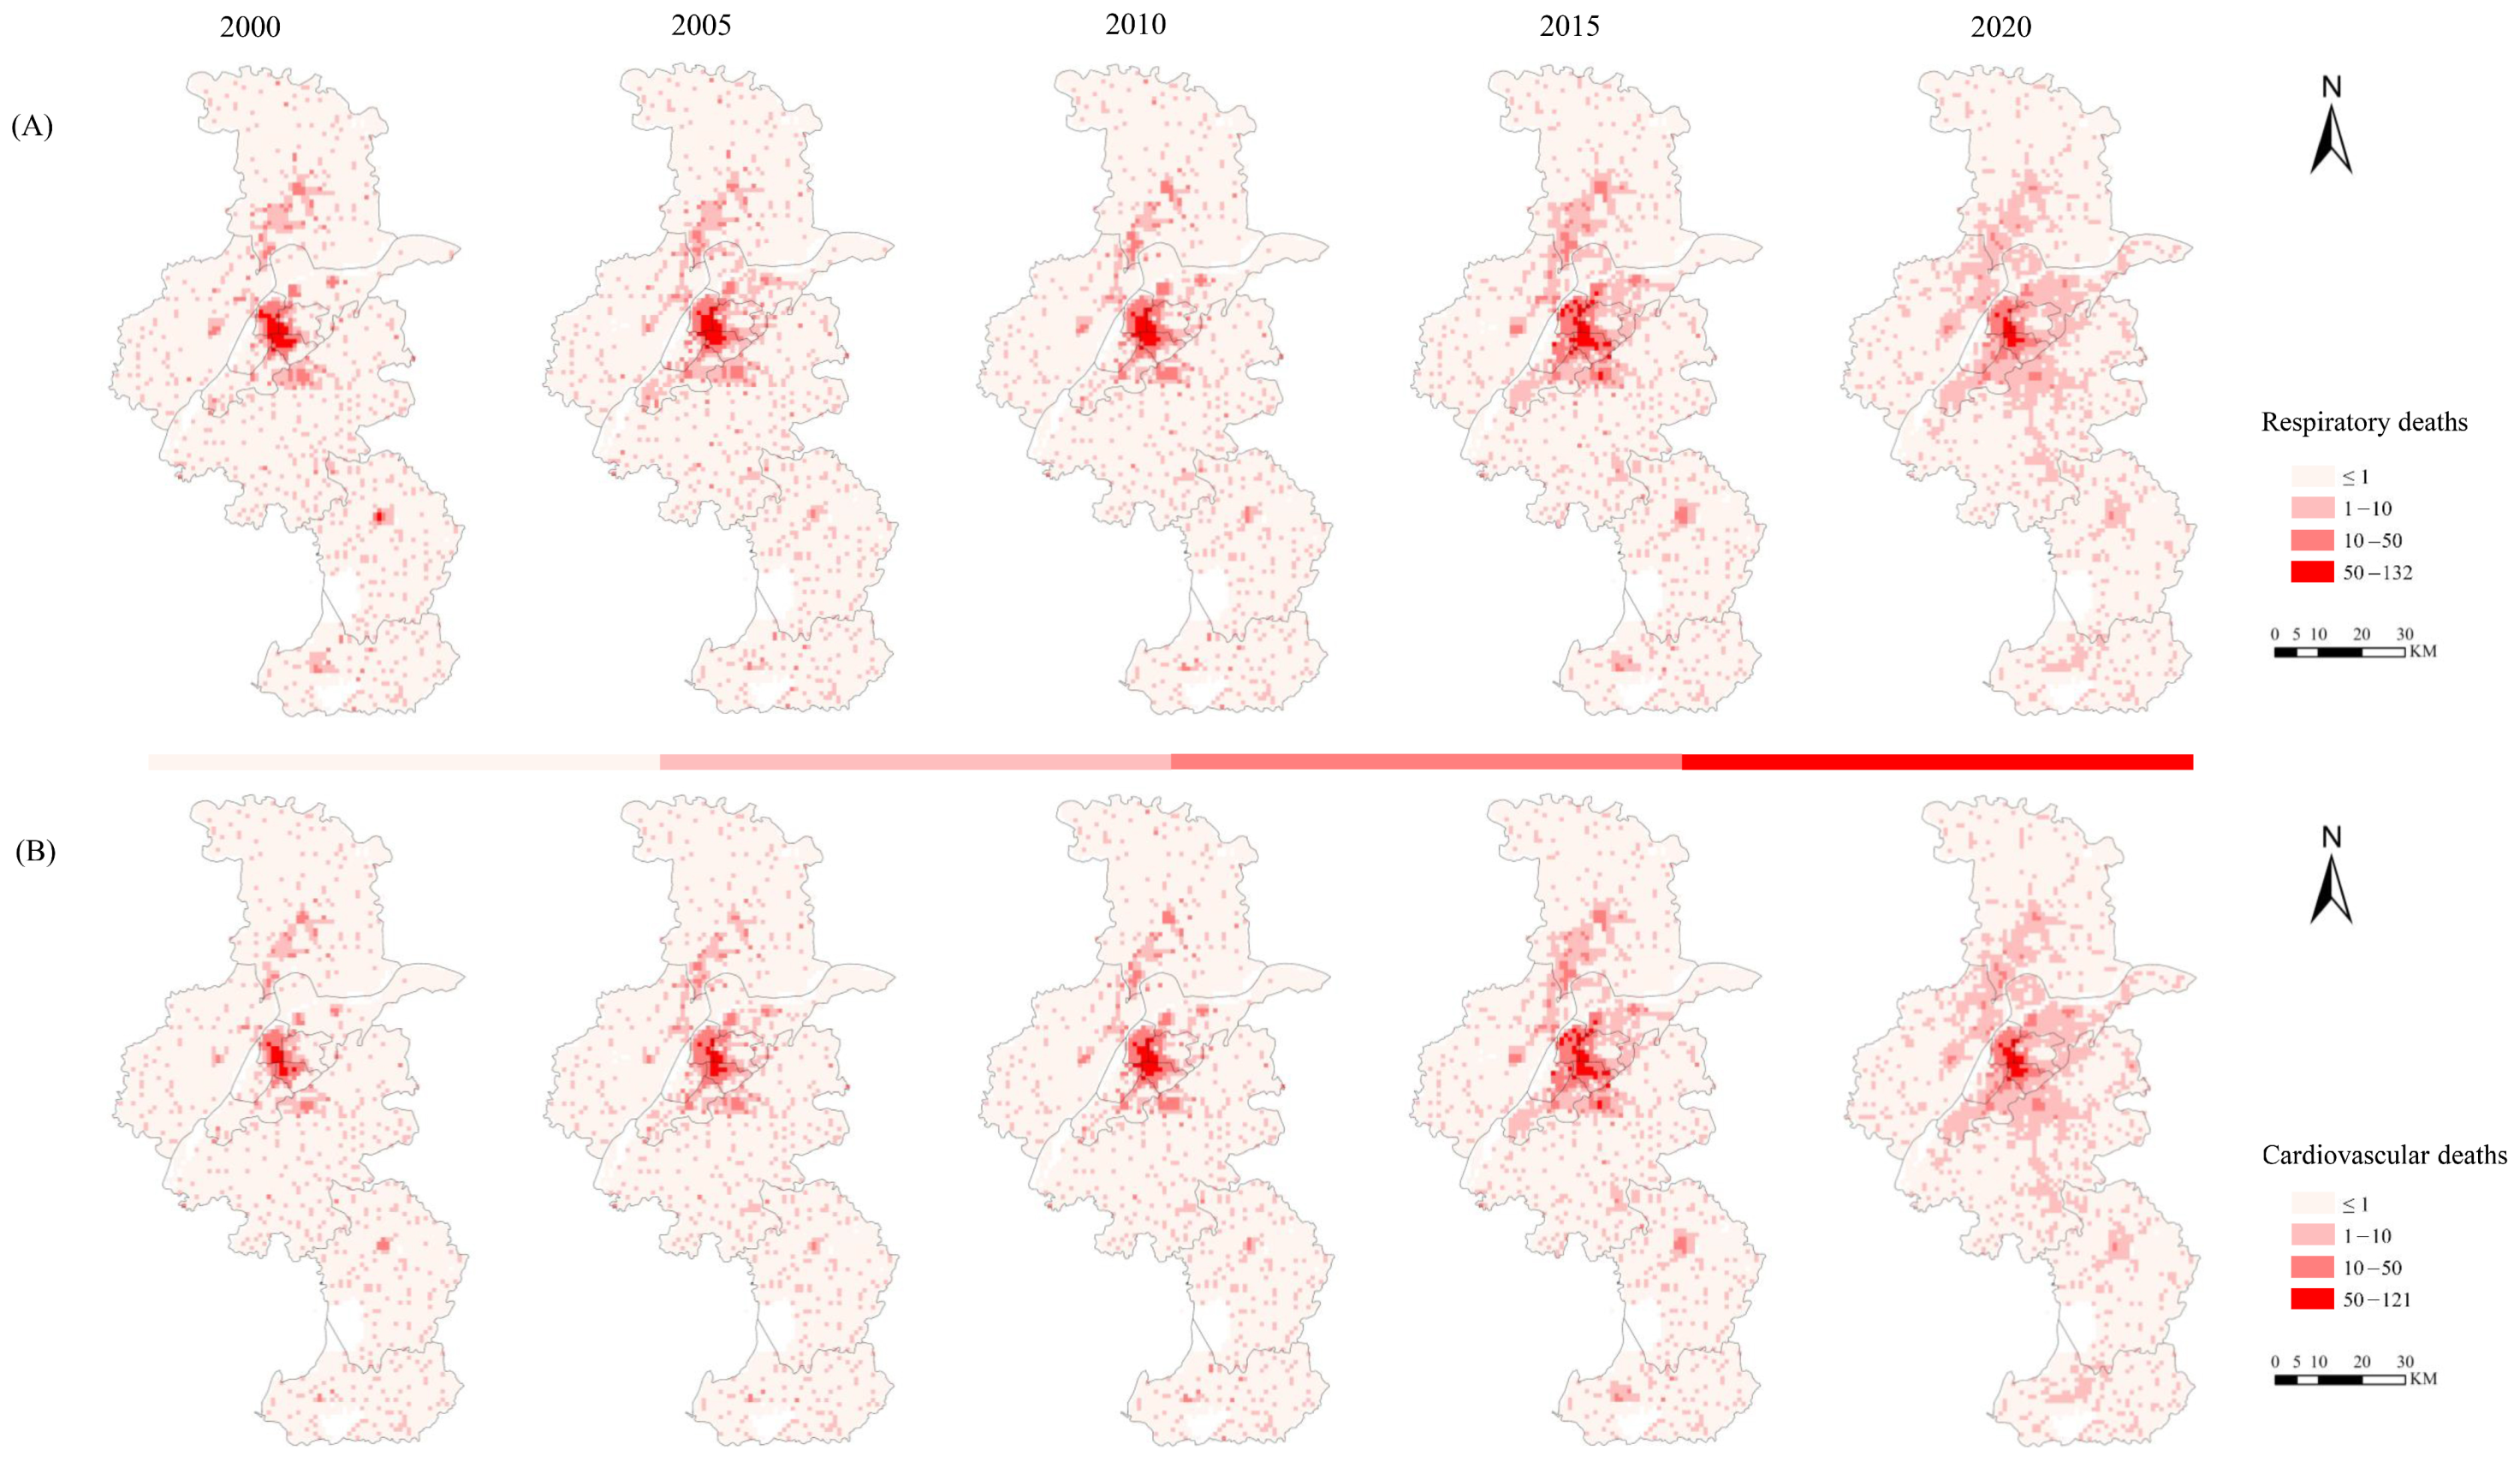
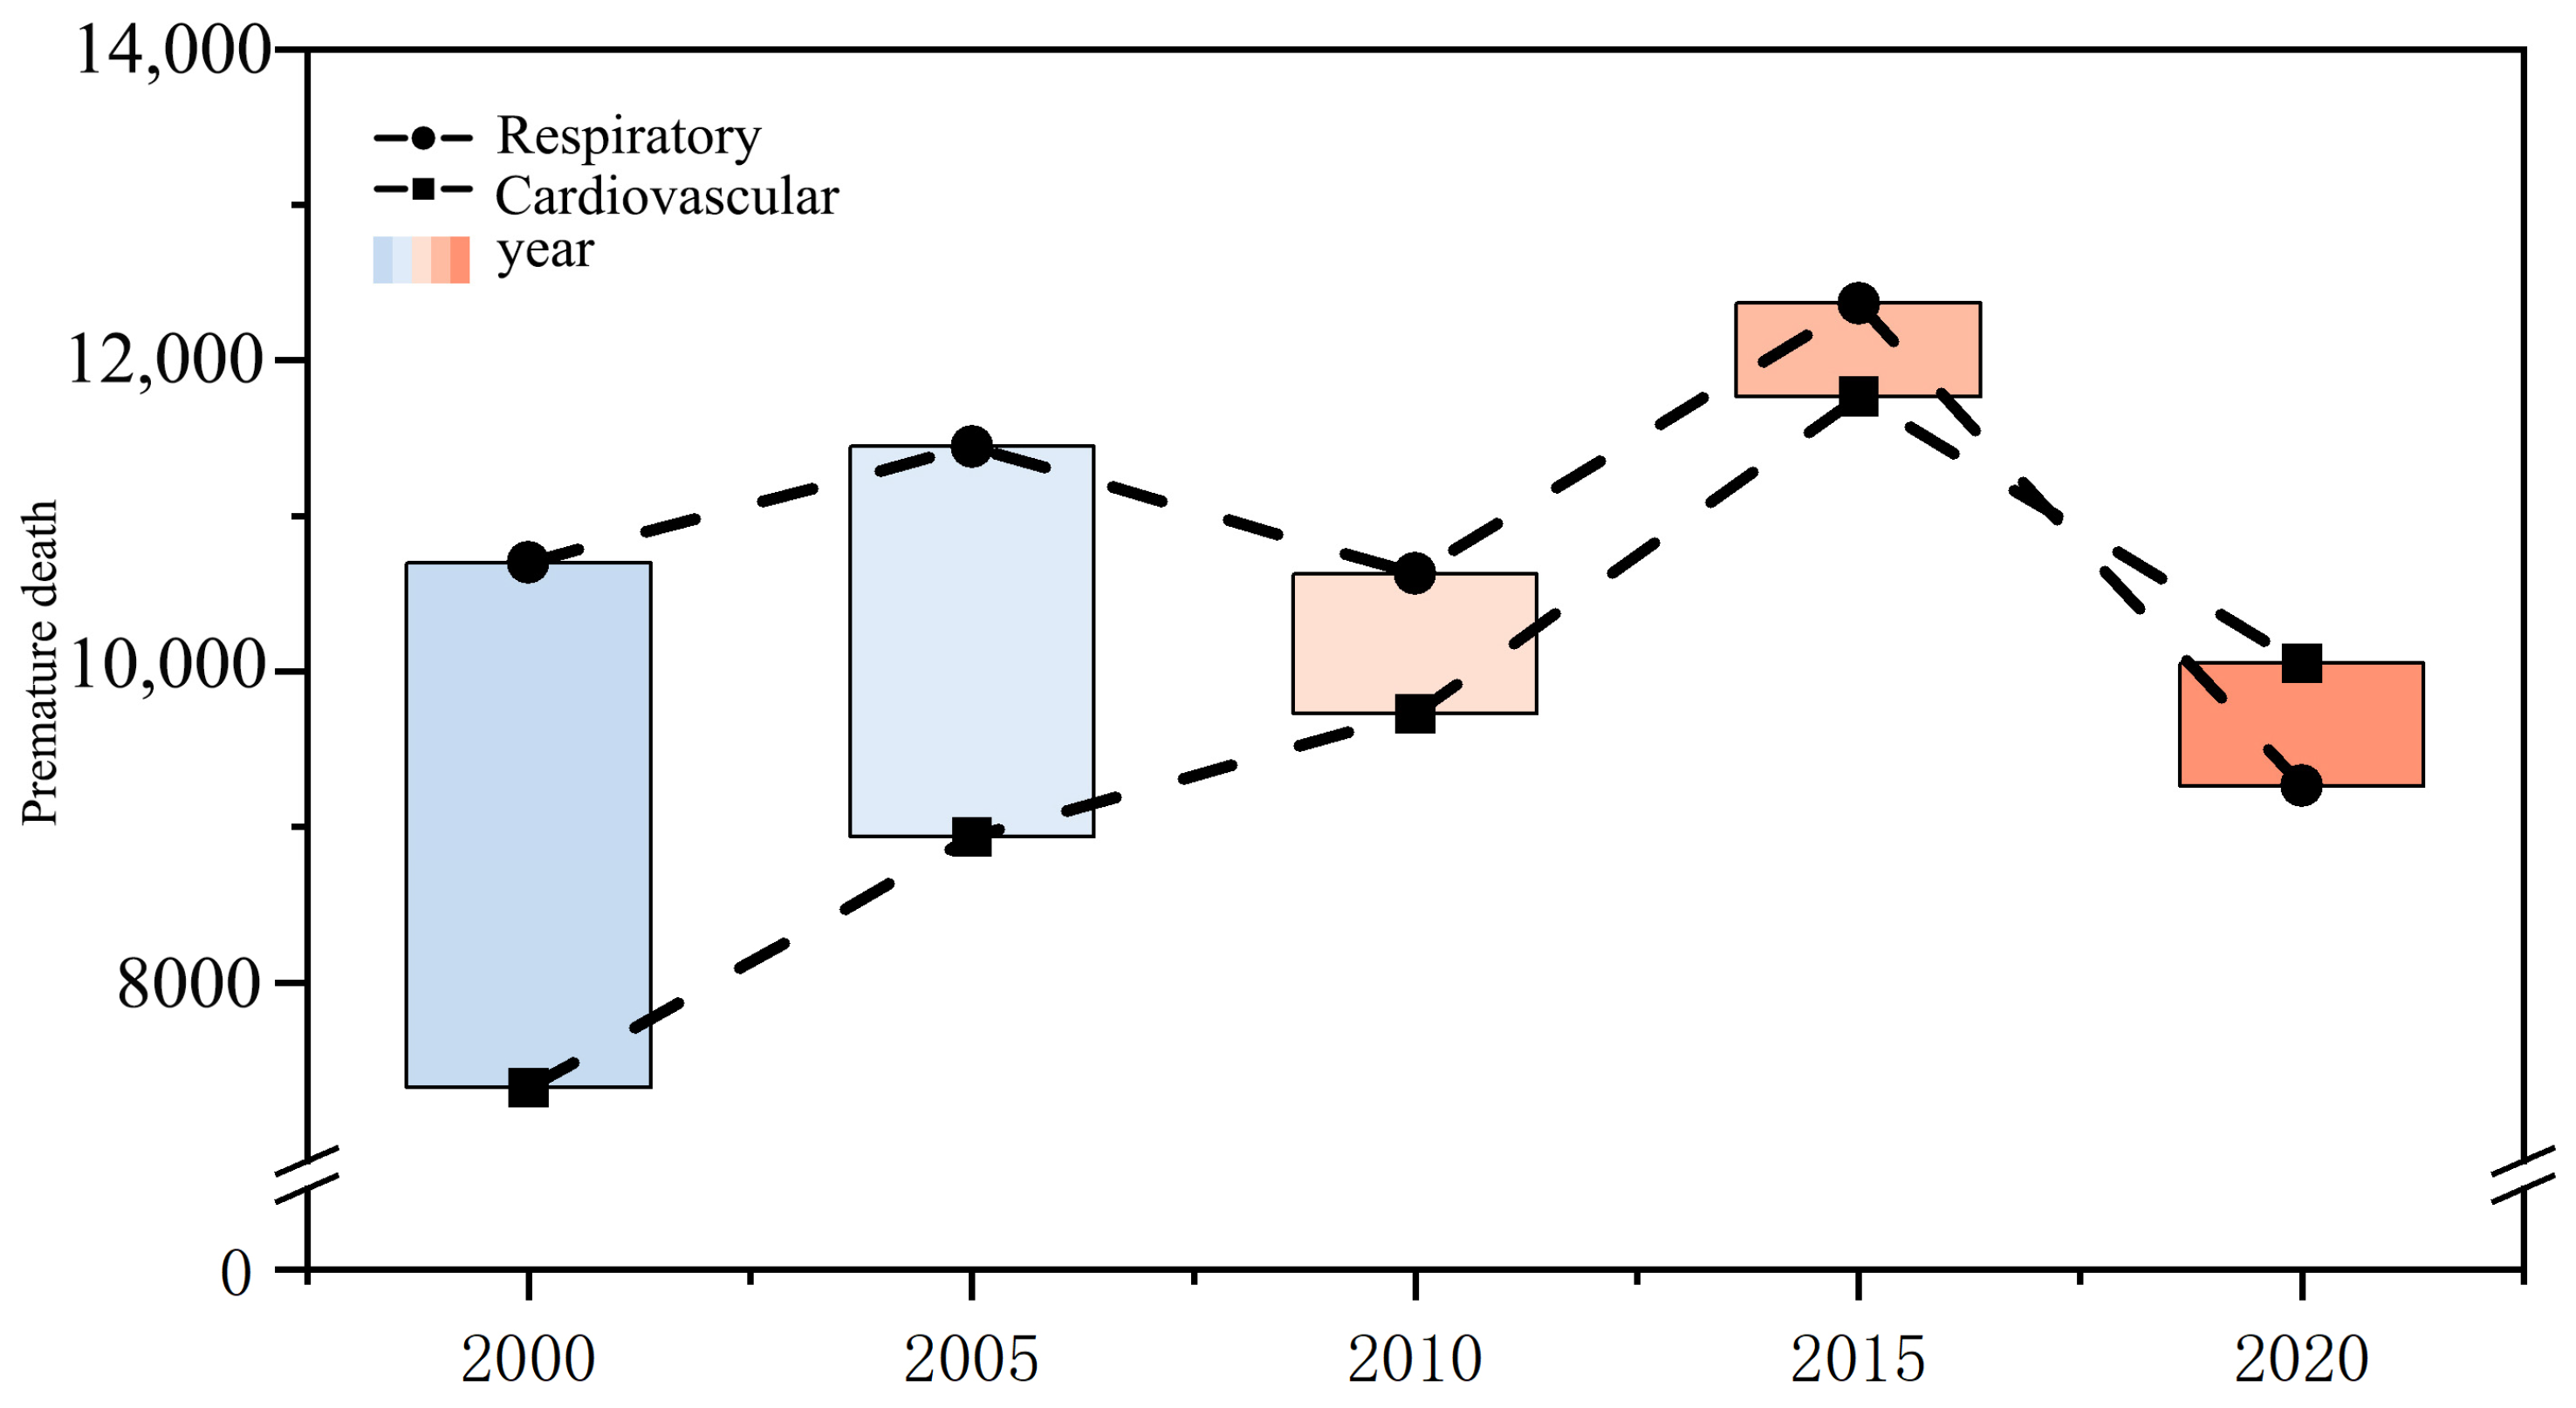
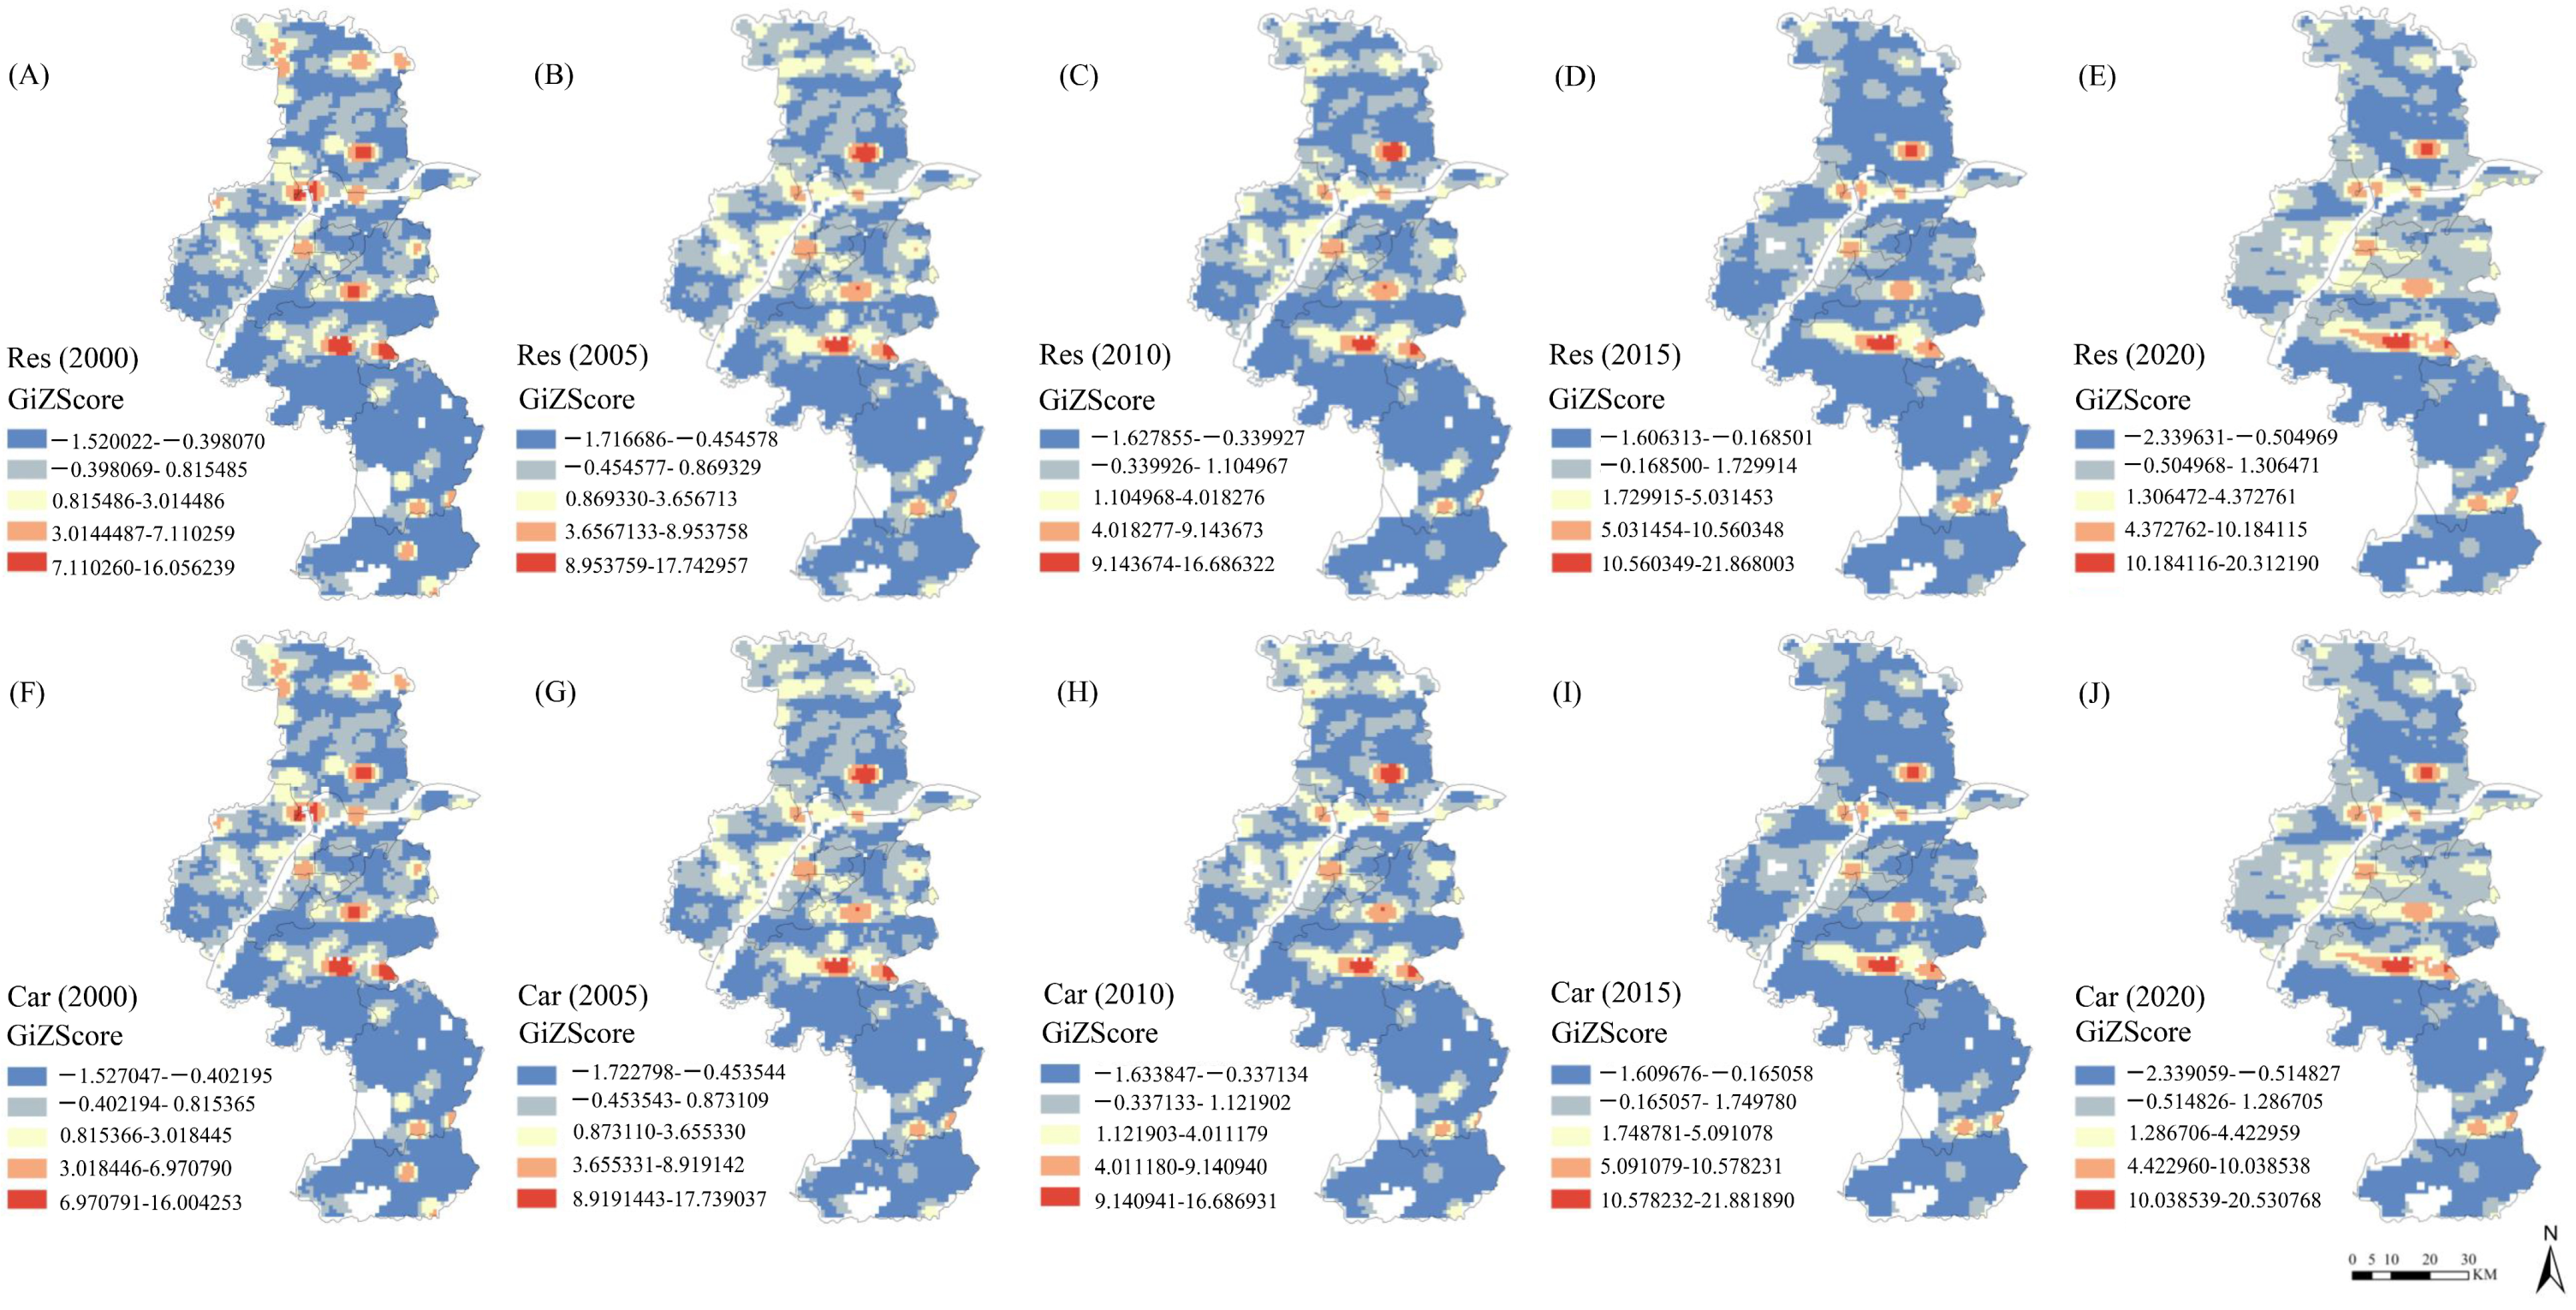
3.1. Spatiotemporal Changes in Premature Deaths Caused by PM2.5

We combined the concentration of air pollutants, population exposure information, and baseline disease incidence rates to determine the number of premature deaths attributed to the two types of diseases related to air pollution in the study area. As shown in Figure 2, the spatial variation in PM2.5-attributable premature deaths over the five research years showed a slow process of spatial change, with the affected area gradually expanding. The diffusion pattern was centered around the Qinhuai District and Gulou District in Nanjing, spreading out in layers and ultimately forming a pyramidal structure in its spatial distribution. In terms of the number of premature deaths, the Gulou District and Qinhuai District were the most significantly impacted, followed by the Yuhua District, Jianye District, and Qixia District. Regarding spatial distribution, due to population concentration, high-value areas were densely distributed in the Qinhuai District and Gulou District, while medium-value areas were sparsely distributed in regions outside of the Lishui District and Gaochun District.
According to Table 1, the changes in the number of premature deaths from respiratory diseases caused by PM2.5 over the five years of the study could be divided into two stages: from 2000 to 2015, there was a gradual increase characterized by fluctuations, followed by a significant decline in 2020. Throughout the study period, the total number of premature deaths decreased by 13%. This is particularly noteworthy in light of the stricter air emission policies implemented in recent years, which have led to a noticeable reduction in premature deaths from respiratory diseases caused by PM2.5, corroborating our research findings. In contrast, premature deaths related to cardiovascular diseases associated with PM2.5 rose from 7323 in 2000 to 10,053 in 2020, marking a 27% increase, conflicting with the results expected after the implementation of air intervention policies. Therefore, based on the total population of Nanjing, we calculated the premature deaths from cardiovascular diseases attributed to PM2.5 and found that, based on the total population, the overall change in the number of premature deaths from cardiovascular diseases due to PM2.5 from 2000 to 2020 was relatively small (Figure 3). However, in the second phase of respiratory diseases, the premature deaths attributed to cardiovascular diseases decreased by 0.04%. Overall, the incidence rates showed a general declining trend, which was particularly notable in the last five years, which paralleled the second phase of cardiovascular diseases, indicating that emission-related policies have improved health outcomes in the study area. Therefore, we believe that more risk factor interaction models need to be included in future planning to optimize targeted public health strategies.
From the spatial differentiation patterns revealed by the standard deviation ellipse method (Figure 4), the premature deaths attributed to PM2.5-related diseases predominantly exhibited a southeast–northwest orientation, with the overall spatial distribution center shifting southward. The center latitudes shifted from 32.006346 and 32.005652 to 31.983152 and 31.98367, respectively (Table 2 and Table 3). In terms of differentiation shape, the ratio of the short axis to the long axis of the standard deviation ellipses for the two disease HIAs showed a two-phase differentiation pattern: from 2000 to 2005, the ratio increased, while from 2010 to 2020, it continued to rise annually.
Regarding the differentiation direction, overall, the azimuth angle decreased from 167.711424 to 166.139144 between 2000 and 2020, showing a declining trend amidst fluctuations. From 2000 to 2015, the azimuth angle consistently narrowed, indicating that the influence of the southeastern region on the spatial pattern of the HIA results in Nanjing strengthened. From 2015 to 2020, although there was a slight increase in the azimuth angle, it was minimal, suggesting that the impact center gradually stabilized. After the influence of the southeastern region’s HIA results on the overall HIA spatial pattern of Nanjing strengthened, it began to stabilize. This finding suggests that planners should pay more attention to the planning direction of urban public health facilities and green space facilities in their future plans.
We obtained the spatial correlation characteristics of the premature deaths caused by PM2.5 in Nanjing, as shown in Table 4. In Nanjing, the spatial correlation characteristics of the premature deaths from two types of PM2.5-related diseases remained significant at the 1% level, with positive Moran’s I indices, indicating a positive spatial correlation. Additionally, over time, the Z-scores gradually increased, with the Moran’s I for respiratory diseases and cardiovascular diseases rising from 0.247251 and 0.240792 to 0.472201 and 0.468193, respectively. This suggests that the spatial clustering of the HIA results for diseases caused by PM2.5 in Nanjing showed a gradual strengthening trend.
From the changes in the spatial distribution of cold and hot spots (Figure 5), the clustering degree of cold and hot spots related to PM2.5-induced premature deaths in Nanjing shows a pattern where cold spots experience significant fluctuations and gradually decrease, while the area of hot spots continues to shrink. Overall, hot spots are present in various districts of Nanjing, while cold spots form contiguous patches within the city.
Temporally, from 2000 to 2005, the hot spot areas in the northern part of the Liuhe District decreased, as did the hot spot areas near the boundary between the Qixia District and Pukou District (Figure 6). Meanwhile, the transitional area with medium values increased in the Pukou District and Liuhe District. From 2005 to 2010, the overall changes were minor, maintaining a relatively stable pattern. Between 2010 and 2015, the hot spots continued to cluster towards central Nanjing, with an increase in hot spot areas at the junction of the Qixia, Pukou, and Liuhe Districts. While the overall hot spot area continued to shrink, the area of cold spots expanded. From 2015 to 2020, the sub-cold spot areas in northern Nanjing increased, while the sub-hot spot areas in the Jiangning District also expanded, and the Jianye District largely transitioned into a transitional area with reduced cold spot areas.
Combining the global spatial autocorrelation results and the overall cold and hot spot spatial distribution characteristics, it can be seen that the spatial clustering of PM2.5-related premature deaths from the two types of diseases in Nanjing gradually strengthened over time. This was characterized by a contiguous distribution of cold spots and clustered distribution of hot spots. Through the analysis of this part, in the future, differentiated zoning governance and spatial planning optimization can be implemented, such as the precise control of pollution sources in hot cluster areas, ecological red lines in cold spots, industrial expansion, etc.

3.2. Impact of Green Space on PM2.5-Induced Premature Deaths

We used vegetation indices (the EVI, NDVI, and SAVI) as explanatory variables to establish an exploratory analysis model to examine the regression relationship between green spaces and PM2.5-induced premature deaths. As shown in Table 5, through the use of an ordinary least squares regression analysis, it was found that the variance inflation factor for each spatial indicator was less than 7.5, indicating low multicollinearity among the variables. Consequently, we further employed the Geographically Weighted Regression (GWR) model and the Multiscale Geographically Weighted Regression (MGWR) model, and found that the MGWR results were superior to those of the other two models. Notably, when the MGWR method was applied, the R2 and adjusted R2 showed significant improvement. For urban planning, this means that policies and interventions can be tailored to specific regions within the city, addressing areas with higher vulnerability to PM2.5-related health issues.
We visualized the p values < 0.05 on the grid to represent the significant correlation range of the various indicators. It was evident that the three vegetation indices primarily exert a localized impact on specific areas. According to Figure 7, the values for the EVI, NDVI, and SAVI related to PM2.5-induced premature deaths in Nanjing were all negative, indicating that an increase in the vegetation indices had a strong negative effect and inhibitory impact on the HIA results. The areas where the EVI had a significant impact on the HIA results in Nanjing were mainly concentrated in the central districts of Gulou, Yuhuatai, and Jianye, as well as the southern parts of the Jiangning District and Liuhe District. The variation in the NDVI was primarily along the Yangtze River, with the highest impact intensity observed at the boundary between the Gulou and Liuhe Districts. The areas where the SAVI had a significant impact on premature deaths in Nanjing were more dispersed, appearing sporadically in the Gaochun District, the southern part of the Liuhe District, and the central area of the Jiangning District, with some distribution along the Yangtze River, all showing negative effects.
Our research results indicate that increasing green space and improving vegetation indices (the EVI, NDVI, and SAVI) can reduce premature deaths caused by PM2.5. Therefore, future urban planning should prioritize green space development, especially in heavily polluted areas. Additionally, spatial data analysis provides valuable support for data-driven decision-making, enhancing urban environmental quality and public health.

4. Discussion and Limitations

Rapid economic development has been accompanied by the emission of large amounts of pollutants into the air, significantly impacting human health. We utilized a high-resolution near-surface air pollution dataset to quantify the health impacts associated with PM2.5 pollution [55]. The data were collected utilizing artificial intelligence technology, and were combined with big data such as ground-based observations, atmospheric reanalysis, and emission inventories, to fill in the missing values of the satellite MODIS MAIAC AOD product, providing seamless ground-level PM2.5 data. For the first time, these data were simultaneously incorporated with three vegetation indices—the EVI, NDVI, and SAVI—to assess health effects. The spatial influence relationships were recalculated using Multiscale Geographically Weighted Regression (MGWR). We observed that the health risks posed by PM2.5 showed a significant negative correlation with the degree of greening only in densely populated areas. Given the protective role of green spaces on health, our study aimed to comprehensively understand the health impacts of different PM2.5 concentrations, explore the spatial and temporal trends in premature deaths caused by air pollution, and investigate the health benefits provided by green spaces in this context.

4.1. Premature Deaths Attributed to PM2.5

We conducted a localized analysis of the impact of air pollution on premature deaths to quantify the health effects associated with PM2.5 pollution. The study identified that changes in PM2.5 concentration, either increases or decreases, affect the rate of premature deaths attributed to it. The results showed that since 2000, the premature death rate in Nanjing continued to rise until a noticeable decline began in 2015. However, some discrepancies were observed. In our study, the number of premature deaths caused by PM2.5 in Nanjing showed an upward trend before 2015, while the PM2.5 concentrations started to decline rapidly following the enactment of the “Ten Measures for Air” in 2013. This mismatch suggests that premature mortality trends do not directly align with the reduction in PM2.5 levels. We suspect that PM2.5-attributable mortality is influenced by multiple factors, as mentioned in our introduction, such as improved medical facilities and other expected factors like population mobility and age structure [30,56]. Additionally, while premature deaths from PM2.5-induced cardiovascular diseases showed a decline in the second phase, the overall number of deaths continued to rise throughout the study period, indicating a negative trend. This could be linked to rapid urbanization and changes in lifestyle over the past decades, where adverse lifestyle factors increase the burden on cardiovascular health, with conditions like hyperglycemia and hypertension being key contributors to premature cardiovascular deaths [57]. For example, according to the “Analysis of Nanjing Residents’ Mortality Statistics”, in Nanjing, deaths attributable to high blood sugar accounted for 9.22% of all deaths in 2017, compared to 5.85% in 2011, showing an increase of approximately 42.77%. In 2015, the mortality rate from cerebrovascular diseases in Nanjing residents was 147.89 per 100,000, accounting for 24.28% of all deaths. These data indicate that factors such as high blood sugar and high blood pressure have had a significant impact on cardiovascular health in Nanjing. In contrast to cardiovascular diseases, premature deaths from respiratory diseases showed a fluctuating downward trend. This was expected, as respiratory disease triggers are not limited to PM2.5 pollution; other air chemical components and smoking could also contribute to premature mortality.
From a spatiotemporal perspective, premature deaths became increasingly concentrated in Nanjing’s city center over time. A plausible explanation is that, according to the exposure–response function, premature deaths caused by regional PM2.5 were influenced by the PM2.5 concentration, population density, and disease incidence rates. Over the past 20 years, long-term population changes have offset the positive impacts of PM2.5 reductions, as internal migration driven by rapid development and urbanization has pushed populations towards urban areas. Of course, this conclusion was drawn after we reviewed the literature on population migration in Nanjing and compared the spatial distribution of the PM2.5 concentrations and population density in Nanjing over the past 20 years [58,59]. Unfortunately, air pollution is often more severe in these urban areas. The rural-to-urban migration has resulted in more residents being exposed to higher PM2.5 levels, exacerbating PM2.5-attributable premature deaths.

4.2. Effects of Greening Improvement

Green spaces may mitigate the adverse health impacts of PM2.5 [60]. In this study, we incorporated three types of vegetation indices—the EVI, NDVI, and SAVI—into the analysis of the impact of PM2.5 exposure on health for the first time. Studies from Canadian and ELAPSE cohorts have demonstrated the protective effects of green space exposure on mortality rates [61,62]. These findings suggest that green spaces can reduce premature deaths caused by air pollution. However, air pollution is not limited to PM2.5; pollutants such as NO and PM10 also pose health risks. Initially, we did not observe a significant correlation between green space exposure and premature deaths from PM2.5. On the one hand, green spaces can reduce pollution concentrations through deposition [63], thereby lowering the risk of respiratory diseases. For example, a prospective cohort study found that for every one-quartile increase in the NDVI, the risk of developing chronic obstructive pulmonary disease (COPD) decreased by 8% [64]. On the other hand, increasing green spaces can modulate vascular aging, reduce aortic dilation and stiffening, and help lower cardiovascular disease risks [65], which are specific diseases related to PM2.5. Most studies have used the NDVI as a measure of green space levels; it is an effective indicator of greenness but it does not account for different types of natural or green areas. Therefore, we hypothesized at the outset that there could be synergistic effects among the SAVI, EVI, NDVI, and premature deaths caused by PM2.5. The SAVI incorporates a correction factor (L) to minimize soil brightness effects [66], while the EVI is primarily used for atmospheric correction [56]. Although the sensitivity of these three indices to vegetation varies, they are all designed to quantitatively assess the level of green space exposure. Integrating these indices allows for a more comprehensive analysis of whether green spaces can improve the health impacts of PM2.5.
Contrary to our expectations, our results indicate that the interaction between green spaces and premature deaths from air pollution is only significant in densely populated areas. Unlike previous studies [67], our findings showed that green space exposure was negatively correlated with mortality rates only within significant areas, suggesting that vegetation coverage has a clear inhibitory effect on health risks posed by air pollution, reflecting the complex relationships between air pollution, green spaces, and mortality. One possible explanation is that PM2.5-attributed premature deaths are influenced by a combination of air quality, population density, and disease incidence rates, which encompass a wide range of factors [19], such as population migration [68] and fertility rates. Moreover, Heikki’s research confirmed that while vegetation can purify air pollution, its effect is not unlimited [69]. Therefore, people living in these areas might face increased air pollution even when vegetation indices rise.
Furthermore, our long-term analysis indicated significant variations in vegetation coverage across Nanjing. From 2000 to 2010, urban vegetation shifted toward the surrounding counties [70], contrasting with the population flow toward the city center and paralleling the spatial changes in premature deaths caused by PM2.5. This indicates that in densely populated areas, a reduction in green spaces exacerbates PM2.5-related health risks. Meanwhile, the peripheral areas of Nanjing contained mostly insignificant regions characterized by high vegetation indices but low population densities, opposite to the conditions in the city center. Since the exposure–response function was calculated based on population density and PM2.5 concentration, we hypothesize that the inhibitory effect of green spaces on PM2.5-induced premature deaths requires a certain population density or PM2.5 concentration threshold to be effective.

4.3. Sustainable Management Strategies

Our study focused on the intersection of three driving factors: air quality changes, population changes, and green space changes. In terms of air quality, PM2.5 pollution in China has been significantly controlled and improved since 2013. At the national level, the Chinese government issued the Comprehensive Work Plan for the European Economic and Research Center, strengthening ECER measures, with a focus on improving air quality, beginning in 2013. The Special Plan for Air Pollution Prevention and Control, also known as the “Ten Measures for Air”, was implemented, leading to the control and improvement of PM2.5 pollution across China. In Nanjing, PM2.5 concentrations began to decrease rapidly after the introduction of the “Ten Measures for Air” in 2013. According to data from the Nanjing Municipal Bureau of Ecology and Environment, the annual average concentration of PM2.5 in Nanjing was 78 µg/m3 in 2013, and it decreased to 31.3 µg/m3 in 2020, a reduction of approximately 60%. To reduce air pollution and develop a “garden city”, Nanjing introduced the Air Quality Management Regulations and the Nanjing Green Space System Plan (2017–2035). As a result of these air quality regulations, the areas exposed to PM2.5 have significantly decreased, especially after 2015. These findings indicate that efforts to improve air quality have effectively alleviated the associated health burden; however, these efforts need to be maintained or even strengthened to further reduce premature deaths caused by PM2.5 in the future.
Green spaces can mitigate or prevent the adverse effects of PM2.5 exposure. Our data show that the distribution of green spaces in Nanjing’s rural areas is relatively homogeneous, with the population mainly concinnated in the city center. Therefore, the spatial distribution of premature deaths is similar to that of population density: primarily concentrated in central Nanjing, while peripheral areas have relatively lower levels. Likewise, green spaces have a significant inhibitory effect on health risks from PM2.5 only in densely populated areas. Based on these findings, we believe that to comprehensively reduce the health risks posed by PM2.5, in addition to continuously controlling air pollution, three sustainable management strategies can be implemented to improve health outcomes:
  • Increase and restore green spaces in densely populated areas and enhance regulatory actions. Research linking ecosystem services to urban areas has identified the important role of urban green spaces, such as urban forests, trees, or vegetation, in providing essential ecosystem services [71]. Meanwhile, green space can reduce PM2.5 concentrations to some extent, particularly at scales of 5 km or smaller [72].
  • Disperse populations from the city center. The high population density limits the development of higher environmental quality, as the increase in urban green space coverage and population density are generally seen as oppositional [73,74]. From an urban ecology perspective, population growth should be accompanied by an increase in vegetation density. However, most cases show that as population density increases, urban green space tends to deteriorate. Although new green spaces, such as parks or green roofs, may be integrated during urban development, they cannot prevent the overall decline in green space supply [75]. A reasonable explanation is that continuous population growth leads to the conversion of green space into residential and transportation infrastructure, negatively impacting urban green areas.
  • Encourage physical activity, improve unhealthy lifestyles, and reduce smoking. As socioeconomic development progresses, people’s living standards and lifestyles have undergone significant changes. Effects of unhealthy lifestyles and dietary habits, such as high serum cholesterol, contribute to cardiovascular diseases [76]. For respiratory diseases, the incidence rates are primarily associated with smoking and air pollution. Previous studies have shown that apart from air pollution, smoking may be the leading cause of premature mortality [77].

4.4. Limitations

Despite using optimized high-resolution pollutant datasets and spatial population distribution data to assess the health conditions in Nanjing, this study still had some uncertainties and limitations. The first source of uncertainty comes from the incidence rate data. We used original annual data for China from the GBD dataset from 2000 to 2020. Although this approach has been applied in other studies, our work initially focused on Jiangsu Province before extracting assessment results for Nanjing. However, uncertainty remained, as baseline incidence rates and their variations may differ among cities. The second source of uncertainty relates to population data. Due to data availability, we did not conduct more detailed sub-analyses based on factors such as age and gender. However, most studies indicate that the impact of PM2.5 varies depending on the population structure, including factors like population growth, aging, and different age distributions [31]. Third, our study may have underestimated the health burden of PM2.5, as we only included two types of diseases associated with PM2.5. Previous research has shown that exposure to ambient PM2.5 concentrations can also lead to preterm birth, asthma, and other conditions [78]. Nevertheless, the GBD report is periodically updated, and we expect to include a broader range of related diseases in the future. Additionally, a more comprehensive set of green space indices will be crucial to improving our study.

5. Conclusions

PM2.5 pollution continues to pose a major threat to public health worldwide, especially in rapidly urbanizing regions such as China. Despite significant reductions in PM2.5 concentrations through stricter air quality management policies, the expected decrease in the health burden has not materialized. Nanjing, as an industrial hub, remains deeply affected by PM2.5 pollution, demonstrating the need for a more nuanced approach to air quality management. This study quantified the premature deaths caused by PM2.5 in Nanjing between 2000 and 2020 and examined the potential of green spaces to mitigate these health impacts. By integrating vegetation indices such as the EVI, NDVI, and SAVI, we offer a more comprehensive framework for assessing the relationship between green space coverage and health outcomes. Our findings highlight a significant negative correlation between green space improvement and reductions in PM2.5-related premature deaths, particularly in densely vegetated areas.
The study reveals that, while premature deaths due to PM2.5 increased from 2000 to 2015, a noticeable decline occurred after 2015, suggesting that air quality policies have had some success in reducing mortality. However, these policies have not fully addressed the broader health impacts of PM2.5, particularly with regard to respiratory and cardiovascular diseases. Spatially, the burden of premature deaths is concentrated in areas with a high population density and high industrial activity, such as the Gulou and Qinhuai Districts. Over time, the distribution of premature deaths related to PM2.5 has shifted towards the city center. These findings emphasize the need for more targeted interventions that not only continue to reduce air pollution but also address the localized health risks posed by it.
Importantly, this study underscores the crucial role of green spaces in mitigating the health impacts of PM2.5 exposure. Our analysis showed that increases in vegetation indices were significantly correlated to reductions in premature deaths linked to PM2.5, especially in areas with a higher population density. To further reduce these health risks, urban air quality management policies should prioritize the expansion and maintenance of green spaces alongside efforts to control air pollution. Increasing the amount and quality of green spaces in urban areas can help alleviate the negative effects of PM2.5, particularly in the most vulnerable districts. Furthermore, proactive measures such as urban air purification should be integrated into long-term air quality improvement strategies. This research provides essential evidence for developing comprehensive air quality management policies that not only focus on pollutant reduction but also consider the role of urban green spaces in improving public health outcomes.

Author Contributions

Conceptualization, T.L. and P.T.; Methodology, J.Z.; Software, X.Z.; Validation, X.Z., T.L. and J.Z.; Formal Analysis, P.T.; Investigation, P.T.; Resources, X.Z.; Data Curation, T.L.; Writing—Original Draft Preparation, P.T.; Writing—Review And Editing, J.Z.; Visualization, T.L.; Supervision, J.Z.; Project administration, J.Z.; Funding acquisition, P.T. and J.Z. All authors have read and agreed to the published version of the manuscript.

Funding

This research was funded by the Natural Science Foundation of Jiangsu Universities (Grant No. 21KJB220004), Science and Technology Think Tank Young Talent Program of China Association for Science and Technology (Grant No. 2022-162), Social Science Application Research Coordinated Innovation Base Project of Jiangsu (22XTA-38), the Talent Research Grant of Anhui Agricultural University (Grant No. yj2022-52), and Anhui University Research Project (Grant No. 2023AH050968).

Data Availability Statement

The data for this study are available upon request from the authors.

Conflicts of Interest

The authors declare no conflicts of interest.

References

  1. Zhang, Q.; Zheng, Y.; Tong, D.; Shao, M.; Wang, S.; Zhang, Y.; Xu, X.; Wang, J.; He, H.; Liu, W.; et al. Drivers of improved PM2.5 air quality in China from 2013 to 2017. Proc. Natl. Acad. Sci. USA 2019, 116, 24463–24469. [Google Scholar] [CrossRef] [PubMed]
  2. Zhang, Y.; Sun, Q.; Liu, J.; Petrosian, O. Long-Term Forecasting of Air Pollution Particulate Matter (PM2.5) and Analysis of Influencing Factors. Sustainability 2024, 16, 19. [Google Scholar] [CrossRef]
  3. Organisation for Economic Co-Operation and Development. The Cost of Air Pollution: Health Impacts of Road Transport; OECD Publishing: Paris, France, 2014. [Google Scholar]
  4. Burnett, R.; Chen, H.; Szyszkowicz, M.; Fann, N.; Hubbell, B.; Pope, C.A.; Apte, J.S.; Brauer, M.; Cohen, A.; Weichenthal, S.; et al. Global estimates of mortality associated with long-term exposure to outdoor fine particulate matter. Proc. Natl. Acad. Sci. USA 2018, 115, 9592–9597. [Google Scholar] [CrossRef] [PubMed]
  5. Brook, R.D.; Rajagopalan, S.; Pope, C.A., III; Brook, J.R.; Bhatnagar, A.; Diez-Roux, A.V.; Holguin, F.; Hong, Y.; Luepker, R.V.; Kaufman, J.D. Particulate matter air pollution and cardiovascular disease: An update to the scientific statement from the American Heart Association. Circulation 2010, 121, 2331–2378. [Google Scholar] [CrossRef]
  6. Ming, L.; Jin, L.; Li, J.; Fu, P.; Yang, W.; Liu, D.; Zhang, G.; Wang, Z.; Li, X. PM2.5 in the Yangtze River Delta, China: Chemical compositions, seasonal variations, and regional pollution events. Environ. Pollut. 2017, 223, 200–212. [Google Scholar] [CrossRef]
  7. Huang, J.; Zhang, Z.; Tao, J.; Zhang, L.; Nie, F.; Fei, L. Source apportionment of carbonaceous aerosols using hourly data and implications for reducing PM2.5 in the Pearl River Delta region of South China. Environ. Res. Sect. A 2022, 210, 112960. [Google Scholar] [CrossRef]
  8. Tsurumi, T.; Managi, S. Health-related and non-health-related effects of PM2.5 on life satisfaction: Evidence from India, China and Japan. Econ. Anal. Policy 2020, 67, 114–123. [Google Scholar] [CrossRef]
  9. Mitchell, R.; Popham, F. Greenspace, Urbanity and Health: Relationships in England. J. Epidemiol. Community Health 2007, 61, 681–683. [Google Scholar] [CrossRef]
  10. Reyes-Riveros, R.; Altamirano, A.; De La Barrera, F.; Rozas-Vásquez, D.; Vieli, L.; Meli, P. Linking public urban green spaces and human well-being: A systematic review. Urban For. Urban Green. 2021, 61, 127105. [Google Scholar] [CrossRef]
  11. Russo, A. Urban Green Spaces and Healthy Living: A Landscape Architecture Perspective. Urban Sci. 2024, 8, 213. [Google Scholar] [CrossRef]
  12. Chi, Y.L.; Mak, H.W.L. From Comparative and Statistical Assessments of Liveability and Health Conditions of Districts in Hong Kong towards Future City Development. Sustainability 2021, 13, 8781. [Google Scholar] [CrossRef]
  13. Im, U.; Bauer, S.E.; Frohn, L.M.; Geels, C.; Tsigaridis, K.; Brandt, J. Present-Day and Future Pm2.5 and O3-Related Global and Regional Premature Mortality in the Evav6.0 Health Impact Assessment Model. Soc. Sci. Electron. Publ. 2023, 216 Pt 4, 114702. [Google Scholar]
  14. Zhao, R. Theoretical Evolution, Evaluation Methods, and Implementation Paths of the Health Impact Assessment System. Soft Sci. Health 2022, 36, 23–27. [Google Scholar]
  15. U.S. Environmental Protection Agency. Final Regulatory Impact Analysis (RIA) for the NO2 National Ambient Air Quality Standards (NAAQS); Office of Air Quality Planning and Standards: Washington, DC, USA, 2010. Available online: https://19january2021snapshot.epa.gov/no2-pollution/final-regulatory-impact-analysis-ria-no2-national-ambient-air-quality-standards-naaqs_.html#:~:text=This%20RIA%20provides%20illustrative%20estimates%2C%20as%20of%20January,NO%202%20NAAQS%20within%20the%20the%20existing%20community-wide (accessed on 8 February 2025).
  16. Sharma, M.; Netherton, A.; McLarty, K.; Petrokofsky, C.; Chang, M. Professional workforce training needs for Health Impact Assessment in spatial planning: A cross sectional survey. Public Health Pract. 2022, 3, 100268. [Google Scholar] [CrossRef]
  17. Fischer, P.H.; Marra, M.; Ameling, C.B.; Hoek, G.; Beelen, R.M.; de Hoogh, K.; Breugelmans, O.R.; Kruize, H.; Janssen, N.A.; Houthuijs, D.; et al. Air Pollution and Mortality in Seven Million Adults: The Dutch Environmental Longitudinal Study (DUELS). Environ. Health Perspect. 2015, 123, 697–704. [Google Scholar] [CrossRef]
  18. Castro, A.; Künzli, N.; Götschi, T. Health benefits of a reduction of PM10 and NO2 exposure after implementing a clean air plan in the Agglomeration Lausanne-Morges. Int. J. Hyg. Environ. Health 2017, 220, 829–839. [Google Scholar] [CrossRef] [PubMed]
  19. He, Q.; Gu, Y.; Yim, S. What drives long-term PM2.5-attributable premature mortality change? A case study in central China using high-resolution satellite data from 2003 to 2018. Environ. Int. 2022, 161, 107110. [Google Scholar] [CrossRef]
  20. Mak, H.W.L.; Lam, Y.F. Comparative assessments and insights of data openness of 50 smart cities in air quality aspects. Sustain. Cities Soc. 2021, 69, 102868. [Google Scholar] [CrossRef]
  21. Arora, A. Synthetic data: The future of open-access health-care datasets? Lancet 2023, 401, 997. [Google Scholar] [CrossRef]
  22. Atkinson, R.W.; Mills, I.C.; A Walton, H.; Anderson, H.R. Fine particle components and health-a systematic review and meta-analysis of epidemiological time series studies of daily mortality and hospital admissions. J. Expo. Sci. Environ. Epidemiol. 2015, 25, 208–214. [Google Scholar] [CrossRef]
  23. Burnett, R.T.; Pope, C.A., 3rd; Ezzati, M.; Olives, C.; Lim, S.S.; Mehta, S.; Shin, H.H.; Singh, G.; Hubbell, B.; Brauer, M. An Integrated Risk Function for Estimating the Global Burden of Disease Attributable to Ambient Fine Particulate Matter Exposure. Environ. Health Perspect. 2014, 122, 397–403. [Google Scholar] [CrossRef]
  24. Liu, J.; Han, Y.; Tang, X.; Zhu, J.; Zhu, T. Estimating adult mortality attributable to PM2.5 exposure in China with assimilated PM2.5 concentrations based on a ground monitoring network. Sci. Total Environ. 2016, 568, 1253–1262. [Google Scholar] [CrossRef]
  25. Ma, Z.; Liu, Y.; Zhao, Q.; Liu, M.; Zhou, Y.; Bi, J. Satellite-derived high resolution PM2.5 concentrations in Yangtze River Delta Region of China using improved linear mixed effects model. Atmos. Environ. 2016, 133, 156–164. [Google Scholar] [CrossRef]
  26. Lin, C.; Labzovskii, L.D.; Mak, H.W.L.; Fung, J.C.H.; Lau, A.K.H.; Kenea, S.T.; Bilal, M.; Hey, J.D.V.; Lu, X.; Ma, J. Observation of PM2.5 using a combination of satellite remote sensing and low-cost sensor network in Siberian urban areas with limited reference monitoring. Atmos. Environ. 2020, 227, 117410. [Google Scholar] [CrossRef]
  27. Imani, M. Particulate matter (PM2.5 and PM10) generation map using MODIS Level-1 satellite images and deep neural network. J. Environ. Manag. 2020, 281, 111888. [Google Scholar] [CrossRef]
  28. Wongnakae, P.; Chitchum, P.; Sripramong, R.; Phosri, A. Application of satellite remote sensing data and random forest approach to estimate ground-level PM2.5 concentration in Northern region of Thailand. Environ. Sc.I Pollut. Res. Int. 2023, 30, 88905–88917. [Google Scholar] [CrossRef] [PubMed]
  29. Ma, Z.; Hu, X.; Huang, L.; Bi, J.; Liu, Y. Estimating Ground-Level PM2.5 in China Using Satellite Remote Sensing. Environ. Sci. Technol. 2014, 48, 7436. [Google Scholar] [CrossRef]
  30. Stanaway, J.D.; Afshin, A.; Gakidou, E.; Lim, S.S.; Abate, D.; Abate, K.H.; Abbafati, C.; Abbasi, N.; Abbastabar, H.; Abd-Allah, F.; et al. Global, regional, and national comparative risk assessment of 84 behavioural, environmental and occupational, and metabolic risks or clusters of risks for 195 countries and territories, 1990–2017: A systematic analysis for the Global Burden of Disease Study 2017. Lancet 2018, 392, 1923–1994. [Google Scholar]
  31. Goudarzi, G.; Daryanoosh, S.M.; Godini, H.; Hopke, P.K.; Sicard, P.; De Marco, A.; Rad, H.D.; Harbizadeh, A.; Jahedi, F.; Mohammadi, M.J.; et al. Health risk assessment of exposure to the Middle-Eastern Dust storms in the Iranian megacity of Kermanshah. Public Health 2017, 148, 109–116. [Google Scholar] [CrossRef]
  32. Chen, L.; Lin, J.; Martin, R.; Du, M.; Weng, H.; Kong, H.; Ni, R.; Meng, J.; Zhang, Y.; Zhang, L.; et al. Inequality in historical transboundary anthropogenic PM2.5 health impacts. Sci. Bull. 2022, 67, 437–444. [Google Scholar] [CrossRef]
  33. Yang, B.Y.; Zhao, T.; Hu, L.X.; Browning, M.H.; Heinrich, J.; Dharmage, S.C.; Jalaludin, B.; Knibbs, L.D.; Liu, X.X.; Luo, Y.N.; et al. Greenspace and human health: An umbrella review. Innovation 2021, 2, 100164. [Google Scholar] [CrossRef]
  34. Rojas-Rueda, D.; Nieuwenhuijsen, M.J.; Gascon, M.; Perez-Leon, D.; Mudu, P. Green spaces and mortality: A systematic review and meta-analysis of cohort studies. Lancet Planet. Health 2019, 3, e469–e479. [Google Scholar] [CrossRef]
  35. Liu, J.; Zhai, J.; Zhu, L.; Yang, Y.; Liu, J.; Zhang, Z. Particle removal by vegetation: Comparison in a forest and a wetland. Environ. Sci. Pollut. Res. 2017, 24, 1597–1607. [Google Scholar] [CrossRef]
  36. Wang, F.; Sun, B.; Zheng, X.; Ji, X. Impact of block spatial optimization and vegetation configuration on the reduction of PM2.5 concentrations: A roadmap towards green transformation and sustainable development. Sustainability 2022, 14, 11622. [Google Scholar] [CrossRef]
  37. Pinto, L.V.; Inácio, M.; Ferreira, C.S.S.; Ferreira, A.D.; Pereira, P. Ecosystem Services and Well-Being Dimensions Related to Urban Green Spaces—A Systematic Review. Sustain. Cities Soc. 2022, 85, 104072. [Google Scholar] [CrossRef]
  38. Maas, J.; Verheij, R.A.; Groenewegen, P.P.; Vries, S.D.; Spreeuwenberg, P. Green space, urbanity, and health: How strong is the relation? J Epidemiol Community Health 2006, 60, 587–592. [Google Scholar] [CrossRef]
  39. Kioumourtzoglou, M.A.; Schwartz, J.; James, P.; Dominici, F.; Zanobetti, A. PM2.5 and Mortality in 207 US Cities: Modification by Temperature and City Characteristics. Epidemiology 2016, 27, 221–227. [Google Scholar]
  40. Simović, I.; Tomićević Dubljević, J.; Tošković, O.; Vujčić Trkulja, M.; Živojinović, I. Underlying Mechanisms of Urban Green Areas’ Influence on Residents’ Health—A Case Study from Belgrade, Serbia. Forests 2023, 14, 765. [Google Scholar] [CrossRef]
  41. Luo, S.; Chen, W.; Sheng, Z.; Wang, P. The impact of urban green space landscape on PM2.5 in the central urban area of Nanchang city, China. Atmos. Pollut. Res. 2023, 14, 101903. [Google Scholar] [CrossRef]
  42. Zhao, X.; Zhi, Z.; Peng, X.; Wu, Z.; Cao, W.; Cui, Y. Health Risk Assessment of Major Air Pollutants in Nanjing. Environ. Prot. Sci. Technol. 2023, 29, 21–26. [Google Scholar]
  43. Diao, Y.; Wang, H.; Shen, L.; Yang, M.; Shi, S. Atmospheric Pollution Characteristics and Pollution Case Studies in Nanjing from 2015 to 2021. Environ. Sci. Res. 2023, 36, 260–272. [Google Scholar]
  44. Pope, C.A.; Dockery, D.W. Health effects of fine particulate air pollution: Lines that connect. Environ. Health Perspect. 2006, 114, 713–723. [Google Scholar] [CrossRef]
  45. Pope, C.A., 3rd; Thun, M.J.; Namboodiri, M.M.; Dockery, D.W.; Evans, J.S.; Speizer, F.E.; Heath, C.W., Jr. Particulate air pollution as a predictor of mortality in a prospective study of US adults. Am. J. Respir. Crit. Care Med. 1995, 151, 669–674. [Google Scholar] [CrossRef]
  46. Künzli, N.; Jerrett, M.; Mack, W.J.; Beckerman, B.S.; Labree, L.D.; Gilliland, F.D.; Thomas, D.C.; Peters, J.M.; Hodis, H.N. Ambient air pollution and atherosclerosis in Los Angeles. Environ. Health Perspect. 2003, 111, 2021–2027. [Google Scholar] [CrossRef]
  47. Krzyzanowski, M. Global update of WHO air quality guidelines. Epidemiology 2006, 17, S80. [Google Scholar] [CrossRef]
  48. Mengting, Z.; Hui, S.; Huixia, W.; Zhen, Y.; Na, Z. Meta-analysis of Air Pollutant Exposure-Response Relationship and Its Application in Health Impact Assessment of Exposure to Air Pollutants in Xi’an. Environ. Sci. Technol. 2017, 40, 171–178. [Google Scholar]
  49. World Health Organization. Global Air Quality Guidelines: Update 2021. World Health Organization. 2021. Available online: https://www.who.int/news-room/questions-and-answers/item/who-global-air-quality-guidelines (accessed on 9 February 2025).
  50. Pope Iii, C.A.; Burnett, R.T.; Thun, M.J.; Calle, E.E.; Krewski, D.; Ito, K.; Thurston, G.D. Lung Cancer, Cardiopulmonary Mortality, and Long-term Exposure to Fine Particulate Air Pollution. Jama 2002, 287, 1132–1141. [Google Scholar] [CrossRef]
  51. Tobler, W.R. A Computer Movie Simulating Urban Growth in the Detroit Region. Econ. Geogr. 1970, 46 (Suppl. S1), 234–240. [Google Scholar] [CrossRef]
  52. Zhao, L.; Zhao, Z. A Study on the Spatial Differentiation of China’s Economy Based on Characteristic Ellipses. Geogr. Sci. 2014, 34, 979–986. [Google Scholar]
  53. Zhang, H.; Peng, Q.; Wang, R.; Qiang, W.; Zhang, J. Spatiotemporal Patterns and Influencing Factors of Carbon Sinks in China’s Counties. Acta Ecol. Sin. 2020, 40, 8988–8998. [Google Scholar]
  54. Hu, J.; Zhang, J.; Li, Y. Exploring the spatial and temporal driving mechanisms of landscape patterns on habitat quality in a city undergoing rapid urbanization based on GTWR and MGWR: The case of Nanjing, China. Ecol. Indic. 2022, 143, 109333. [Google Scholar] [CrossRef]
  55. Wei, J.; Li, Z. ChinaHighPM2.5: High-resolution and High-quality Ground-level PM2.5 Dataset for China (2000–2022); National Tibetan Plateau/Third Pole Environment Data Center: Bejing, China, 2023. [Google Scholar]
  56. Huete, A.R.; Didan, K.; Miura, T. Overview of the radiometric and biophysical performance of the MODIS vegetation indices. Remote Sens. Environ. 2002, 83, 195–213. [Google Scholar] [CrossRef]
  57. Hata, J.; Kiyohara, Y. Epidemiology of Stroke and Coronary Artery Disease in Asia. Circ. J. 2013, 77, 1923–1932. [Google Scholar] [CrossRef] [PubMed]
  58. Zhen, F.; Li, Z.; Xie, Z. Analysis of the spatial structure characteristics and influencing factors of urban areas based on population mobility: A case study of Nanjing. Geogr. Res. 2022, 41, 1525–1539. [Google Scholar] [CrossRef]
  59. Zeng, W.; Zhang, X.; Xiang, L.; Wang, Y. Study on the spatial change characteristics of population in the Nanjing metropolitan area from 2000 to 2010. Geogr. Sci. 2016, 36, 81–89. [Google Scholar] [CrossRef]
  60. Crouse, D.L.; Pinault, L.; Balram, A.; Brauer, M.; Weichenthal, S. Complex relationships between greenness, air pollution, and mortality in a population-based Canadian cohort. Environ. Int. 2019, 128, 292–300. [Google Scholar] [CrossRef]
  61. Bereziartua, A.; Chen, J.; de Hoogh, K.; Rodopoulou, S.; Andersen, Z.J.; Bellander, T.; Brandt, J.; Fecht, D.; Forastiere, F.; Gulliver, J.; et al. Exposure to surrounding greenness and natural-cause and cause-specific mortality in the ELAPSE pooled cohort. Environ. Int. 2022, 166, 107341. [Google Scholar] [CrossRef]
  62. Crouse, D.L.; Pinault, L.; Balram, A.; Hystad, P.; Peters, P.A.; Chen, H.; van Donkelaar, A.; Martin, R.V.; Ménard, R.; Robichaud, A.; et al. Urban greenness and mortality in Canada’s largest cities: A national cohort study. Lancet Planet. Health 2017, 1, e289–e297. [Google Scholar] [CrossRef]
  63. Janhall, S. Review on urban vegetation and particle air pollution—Deposition and dispersion. Atmos. Environ. 2015, 105, 130–137. [Google Scholar] [CrossRef]
  64. Zheng, L.; Wang, J. Association of residential greenness with incident pneumonia: A prospective cohort study. Sci. Total Environ. 2024, 940, 173731. [Google Scholar] [CrossRef]
  65. Dzhambov, A.M.; Dimitrova, D.D. Residential road traffic noise as a risk factor for hypertension in adults: Systematic review and meta-analysis of analytic studies published in the period 2011–2017. Environ. Pollut. 2018, 240, 306–318. [Google Scholar] [CrossRef] [PubMed]
  66. Huete, A.R. A soil-adjusted vegetation index (SAVI). Rem. Sens. Environ. 1988, 25, 295–309. [Google Scholar] [CrossRef]
  67. Xu, S.; Marcon, A.; Jacobsen Bertelese, R.; Benediktsdottir, B.; Brandt, J.; Engemann, K.; Frohn, L.M.; Geels, C.; Gislason, T.; Heinrich, J.; et al. Long-term exposure to low-level air pollution and greenness and mortality in Northern Europe. The Life-GAP project. Environ. Int. 2023, 181, 108257. [Google Scholar] [CrossRef]
  68. Shen, J. Explaining Interregional Migration Changes in China, 1985–2000, Using a Decomposition Approach. Reg. Stud. 2015, 49, 1176–1192. [Google Scholar] [CrossRef]
  69. Setaelae, H.; Viippola, V.; Rantalainen, A.L.; Pennanen, A.; Yli-Pelkonen, V. Does urban vegetation mitigate air pollution in northern conditions? Environ. Pollut. 2013, 183, 104–112. [Google Scholar] [CrossRef] [PubMed]
  70. Shi, C.; Nduka, I.C.; Yang, Y.; Huang, Y.; Yao, R.; Zhang, H.; He, B.; Xie, C.; Wang, Z.; Yim, S.H.L. Characteristics and meteorological mechanisms of transboundary air pollution in a persistent heavy PM (2.5) pollution episode in Central-East China. Atmos. Environ. 2020, 223, 117239. [Google Scholar]
  71. Bolund, P.; Hunhammar, S. Ecosystem services in urban areas. Ecol. Econ. 1999, 29, 293–301. [Google Scholar] [CrossRef]
  72. Wu, H.; Yang, C.; Chen, J.; Yang, S.; Lu, T.; Lin, X. Effects of Green space landscape patterns on particulate matter in Zhejiang Province, China. Atmos. Pollut. Res. 2018, 9, 923–933. [Google Scholar] [CrossRef]
  73. Wellmann, T.; Schug, F.; Haase, D.; Pflugmacher, D.; van der Linden, S. Green growth? On the relation between population density, land use and vegetation cover fractions in a city using a 30-years Landsat time series. Landsc. Urban Plan. 2020, 202, 103857. [Google Scholar] [CrossRef]
  74. Haaland, C.; Bosch, C.K.V.D. Challenges and strategies for urban green-space planning in cities undergoing densification: A review. Urban For. Urban Green. 2015, 14, 760–771. [Google Scholar] [CrossRef]
  75. Haase, D.; Jänicke, C.; Wellmann, T. Front and back yard green analysis with subpixel vegetation fractions from earth observation data in a city. Landsc. Urban Plan. 2019, 182, 44–54. [Google Scholar] [CrossRef]
  76. Critchley, J.; Liu, J.; Zhao, D.; Wei, W.; Capewell, S. Explaining the Increase in Coronary Heart Disease Mortality in Beijing Between 1984 and 1999. Circulation 2004, 110, 1236–1244. [Google Scholar] [CrossRef] [PubMed]
  77. Gao, S.; Li, N.; Wang, S.; Zhang, F.; Wei, W.; Li, N.; Bi, N.; Wang, Z.; He, J. Lung Cancer in People’s Republic of China. J. Thorac. Oncol. 2020, 15, 1567–1576. [Google Scholar] [CrossRef] [PubMed]
  78. Stieb, D.M.; Chen, L.; Eshoul, M.; Judek, S. Ambient air pollution, birth weight and preterm birth: A systematic review and meta-analysis. Environ. Res. 2012, 117, 100–111. [Google Scholar] [CrossRef]
Figure 1. Study Area. (A) the map of China. (B) the administrative boundary of Jiangsu Province. (C) the administrative boundary and population distribution of Nanjing City.
Atmosphere 16 00232 g001
Figure 2. Spatial distribution of premature deaths from pM2.5-related diseases (2000–2020). (A) is the spatial distribution of premature deaths caused by respiratory diseases due to PM2.5; (B) is the spatial distribution of premature deaths caused by cardiovascular diseases due to PM2.5.
Atmosphere 16 00232 g002
Figure 3. Changes in number of premature deaths from PM2.5-related diseases.
Atmosphere 16 00232 g003
Figure 4. Standard deviation ellipses (A1): respiratory diseases; (B1): cardiovascular diseases. (A`,B`) the change of the center of the standard deviation ellipse.
Atmosphere 16 00232 g004
Figure 5. Cold and hot spot analysis (AE): spatial distributions of cold and hot spots for PM2.5-induced premature deaths from respiratory diseases; (FJ): spatial distributions of cold and hot spots for PM2.5-induced premature deaths from cardiovascular diseases.The numbers in the image represent Z-scores. Positive values indicate high-value clusters, while negative values indicate low-value clusters.
Atmosphere 16 00232 g005
Figure 6. Change in proportions of cold and hot spot areas. R means the area proportion of respiratory system diseases; C means the area proportion of cardiovascular diseases.
Atmosphere 16 00232 g006
Figure 7. Multiscale Geographically Weighted Regression analysis of vegetation indices and HIA results. (AC) the regression results of respiratory diseases caused by PM2.5 and vegetation index. (DF) the regression results of cardiovascular diseases caused by PM2.5 and vegetation index.
Atmosphere 16 00232 g007
Table 1. Changes in the number and proportion of premature deaths.
20002005201020152020Change in Cases
Total Population (Ten Thousand)544.89595.8632.42653.4722.57
Respiratory Diseases (People)10,69711,44610,62812,3679262−13%
Proportion of Total Population0.20%0.19%0.17%0.19%0.13%
Cardiovascular Diseases (People)73238934972611,76710,05327%
Proportion of Total Population0.13%0.15%0.15%0.18%0.14%
Table 2. Changes in the standard deviation ellipse for cardiovascular diseases.
YearCenter Coordinate Longitude (°)Center Coordinate Latitude (°)Short
Semi-Axis (km)
Long
Semi-Axis (km)
Azimuth (°)Short Axis/Long Axis
2000118.85660332.0063460.2191810.467785167.7114240.468550723
2005118.85660331.9945850.2232940.448791167.0481150.497545628
2010118.85660331.8566030.2185220.449409166.9309220.486243044
2015118.85660331.9796390.2163900.440737166.1149910.490973075
2020118.85660331.9831520.2295050.433332166.1391440.529628553
Table 3. Changes in the standard deviation ellipse for respiratory diseases.
YearCenter Coordinate Longitude (°)Center Coordinate Latitude (°)Short
Semi-Axis (km)
Long
Semi-Axis (km)
Azimuth (º)Short Axis/Long Axis
2000118.85660332.0056520.2190990.467513167.6742860.468647931
2005118.85660331.9943360.2232250.448599167.0298270.497604765
2010118.85660331.9991330.2184390.449235166.9071940.486246619
2015118.85660331.9795710.2163770.440303166.0958830.491427494
2020118.85660331.9836740.2295600.433044166.1342600.530107795
Table 4. Moran’s I index.
20002005201020152020
Moran’s I
Respiratory diseases0.2472510.2681130.2946890.3938540.472201
Cardiovascular diseases0.2407920.2605820.2856350.386830.468193
Z(I)
Respiratory diseases420.5829455.6638497.3854669.4356804.8186
Cardiovascular diseases402.8562435.4892477.3977646.5534784.4625
p-value
Respiratory diseases00000
Cardiovascular diseases00000
Table 5. Model fit comparison.
Respiratory Diseases Cardiovascular Diseases
YearModelsR2Adjust R2AICcR2Adjust R2AICc
2000OLS0.14470.14420.14390.1435
GWR0.74220.639611,972.40220.74140.638411,991.9124
MGWR0.76430.705111,106.49530.76720.706811,130.9673
2005OLS0.11500.11450.11490.1145
GWR0.73060.621512,280.86370.72970.620212,300.4201
MGWR0.75390.690511,434.34410.75290.689311,457.6580
2010OLS0.12860.12820.12860.1282
GWR0.74850.645011,923.17850.74760.643811,942.9623
MGWR0.77730.722110,735.64380.77640.721010,759.4254
2015OLS0.12930.12890.12930.1288
GWR0.76390.664011,635.07770.76320.663211,650.1433
MGWR0.84080.78899687.39040.84040.78839703.9580
2020OLS0.19340.19300.19340.1930
GWR0.80190.862810,760.23350.80110.712810,785.3447
MGWR0.71400.81768853.21260.86240.81728867.7451
Disclaimer/Publisher’s Note: The statements, opinions and data contained in all publications are solely those of the individual author(s) and contributor(s) and not of MDPI and/or the editor(s). MDPI and/or the editor(s) disclaim responsibility for any injury to people or property resulting from any ideas, methods, instructions or products referred to in the content.

