Article

Precipitation Trends and Andean Snow Cover: Climate Interactions and Hydrological Impacts in the Acre River Basin (1982–2023)

by
Kennedy da Silva Melo
,
Rafael Coll Delgado
* and
Ana Pâmela Tavares Mendonça
Center of Biological and Natural Sciences, Federal University of Acre (UFAC), Rio Branco 69920-900, Brazil
*
Author to whom correspondence should be addressed.
Atmosphere 2025, 16(3), 249; https://doi.org/10.3390/atmos16030249
Submission received: 28 January 2025 / Revised: 11 February 2025 / Accepted: 20 February 2025 / Published: 22 February 2025
(This article belongs to the Section Climatology)

Abstract

:
The state of Acre, located in the Western Amazon, has been more intensely affected in recent years by extreme weather events, especially those of a hydrological nature. These are rainy seasons with major floods and record water levels and, later in the same year, severe droughts that last for more months than is normal for the dry season. In this sense, remote sensing acts as an important tool for monitoring the meteorological variables involved in this dynamic, and for predicting future climate trends. Different temporal lengths reflect the availability of reliable data for each variable, and statistical methods were applied separately to ensure robust analyses despite these differences. Our research used data on rainfall (1982–2023), air temperature (2001–2020), fire foci, vegetation, and snow cover (2001–2023) for these purposes. Snow cover data were obtained from the Moderate Resolution Imaging Spectroradiometer (MODIS) product MOD10CM (MODIS/Terra Snow Cover Monthly L3 Global Climate Modeling Grid). The MOD10CM product was used to quantify snow cover in an area close to the state, connected to one of the main river basins in Acre. The results showed an increase in the amount of rainfall for the month of February and a reduction in the amount for months of the dry season, as well as an extension of the same. A reduction in the percentage of snow cover was also observed in the region, which may have a direct impact on water availability for several populations, including the city of Rio Branco. The Mann–Kendall test reinforced this reduction, with a Z index of −1.98 for the month of June. Principal Component Analysis (PCA) highlighted key relationships among variables. For the first principal component (PC1), rainfall, snow cover, maximum temperature, and minimum temperature had the strongest contributions, capturing over 56% of the total variance across all datasets. A negative relationship was observed between rainfall and minimum temperature, indicating that higher minimum temperatures are associated with reduced rainfall in the region. Conversely, the second principal component (PC2), which explained approximately 29% of the variance, revealed a strong positive relationship between fire foci and maximum temperature, suggesting that higher maximum temperatures significantly increase the number of fire foci. These results reinforce the role of climatic extremes in shaping environmental dynamics in Acre. The level of statistical significance (p-value) adopted for the data was up to 0.10.

1. Introduction

The world has increasingly been experiencing extreme climatic events, which have significant impacts on food security, the economy, culture, and human health [1]. In the Amazon, these events are primarily characterized by prolonged droughts and extreme floods, both of which have intensified in frequency and severity over the past decades [2].
The state of Acre, located in the Brazilian Amazon, is among the regions most affected by these extreme climatic events. Until 2004, an average of one extreme event per year was recorded in the municipalities of Acre. However, after 2010, the occurrence of two or more extreme events within the same year and municipality became increasingly common, highlighting the growing challenge of environmental recovery in the region [3].
A notable episode of this change in pattern occurred in 2015, when the state capital (Rio Branco) suffered its largest flood in history, with estimated damages of up to USD 200 million. That year, the Acre River remained above flood level for 32 consecutive days and reached 18.4 m in depth [4].
An analysis of the hydrological behavior in the municipality of Rio Branco showed that in the last decade there was a greater concentration of flows with values above the average for the period from 1968 to 2017 [5]. The authors of this study emphasize that this behavior may be related to changes in the hydrological conditions of the river basin in question, or of adjacent regions. Several global climate models indicate more rain in the western part of the Amazon, resulting in flooding [6].
Given this scenario, studying the hydrological behavior of the region becomes essential, especially rainfall. According to [7], rainfall is the primary element of the hydrological system, being the starting point for several other processes that have impacted human activities since the first civilizations. Given its importance, the need to quantify and predict its occurrences has become essential for human development [8].
The Climate Hazards Infrared Precipitation with Stations (CHIRPS) dataset provides combined satellite precipitation estimates covering most global land regions. This dataset can be used in conjunction with land surface models to make effective drought predictions or to analyze recent changes in decadal precipitation in data-sparse regions [9]. Several studies carried out in different parts of the world, such as the Philippines [10], Turkey [11], Argentina [12] and Colombia [13], validate this data set as an accurate way of estimating rainfall, highlighting that this estimate is conditioned by the geographic and climatic characteristics of the region of interest.
In addition to precipitation, it is important to check the vegetation cover status of the region, since part of the rainfall is intercepted by vegetation and is retained above the soil surface [14]. In a study conducted by [15] in the Alto Juruá river basin, located in Acre, it was observed that interception has a strong relationship with vegetation cover. It was found that the replacement of forest cover by urbanized areas increased the annual rainwater that reaches the soil of the hydrographic basin by more than 1000 m3 h−1.
Finally, given Acre’s proximity to the Peru portion of the Andes Mountains, it is important to check the snow cover situation in this region, given that it can directly impact the Acre River basin. A study on all areas with frozen water on Earth estimated a shrinkage of approximately 87,000 km2 per year on average between 1979 and 2016, as a result of climate change [16]. Records from sensors show an accelerated decrease in the Andean cryosphere [17], but most studies focus on latitudes above 10° S of the Cordillera [18,19]. Therefore, a study aimed at discovering whether snow near the Amazon region is following global behavior and the influence of climate variables in this process becomes pertinent.
In this sense, the MODIS sensor offers products that assist in this monitoring, such as the MOD10CM, which provides the percentage of snow cover in the region of interest [20]. Therefore, the objective of this work was to investigate the behavior of rainfall and other climate variables along the Acre River basin and to verify whether the behavior of Andean snow has an influence on the region, through remote sensing tools.

2. Materials and Methods

2.1. Study Area

The study area encompasses the basins of the Acre, Purus, and Ucayali rivers, chosen for their climatic and hydrological interconnections, which play a crucial role in the regional hydrological cycle (Figure 1). Located within the Amazon biome, the state of Acre is predominantly characterized by an Equatorial climate, marked by high temperatures, elevated humidity throughout the year, and a well-defined dry season. The average annual precipitation is approximately 2050 mm, with March being the wettest month and July the driest. The average annual temperature is 25 °C, while the average annual relative humidity reaches around 85% [21]. The region’s vegetation consists mainly of dense tropical rainforest, with transitional areas that include open forest formations and campinarana, adapted to local drainage and humidity conditions [22]. Predominant soils include Latosols, Argisols, and Gleisols, reflecting the diversity of landscapes and hydrological regimes in the region, heavily influenced by interactions with vegetation and topography [23].
The main focus of this study is the Acre River basin, as it is the most representative for the state and central to the analyzed hydrological impacts. This basin is part of the larger Purus River basin, which plays a crucial role in the climatic dynamics of the Amazon region. Additionally, the Ucayali River basin, located entirely in Peru, has a significant connection to the hydrological cycle through the influence of Andean snow cover, which feeds water flows that eventually affect downstream basins, including those of Acre and Purus. While the detailed analysis focuses on the Acre River basin, data on snow cover from the Ucayali basin and part of the Purus basin were used to better understand the interactions between the climatic and hydrological variables impacting the region as a whole.
The Acre River basin covers an area of approximately 35,000 km2, with 23,000 km2 located upstream of Rio Branco, the state capital. Several cities occupy the banks of the Acre River, which originates in Peru and has its mouth in the city of Boca do Acre, in the state of Amazonas [24]. According to [25], the Acre River is a source of capture for the water supply of both the capital Rio Branco and other municipalities. The basin in question is part of a larger basin (the Purus basin), according to the classification level adopted by [26].
The Purus basin covers approximately 368,000 km2 and is distributed across the territories of Peru and Brazil, with more than 90% of its extension located in the states of Acre and Amazonas. The tributaries of the Purus River originate in central areas of tropical forests, specifically in the Departments of Ucayali and Madre de Dios, in southeastern Peru. Ucayali is located in the central-eastern part of the country, while Madre de Dios lies in the southeastern region, bordering Brazil and Bolivia. These tributaries have black or clear waters [27].
The Purus basin is classified in the group of basins that are still in a high state of conservation in the Brazilian Amazon. However, in recent years, livestock farming, the advance of the agricultural frontier mainly for soybean production, and associated deforestation have constituted a threat to aquatic ecosystems [28].
The Ucayali River basin is approximately 350,000 km2 and is located entirely in Peru, with more than 90% of its area concentrated in Loreto, Ucayali, and Cuzco. The Ucayali River stretches for approximately 2670 km, starting in the Andes Mountains and joining the Marañón River to form the Amazon River [29].
The three basins were used as study areas, depending on the data to be processed. For data on rainfall, elevation, air temperature, fire foci, and Enhanced Vegetation Index, the study area was the Acre River basin. For data on snow cover, the study area was an area covering part of the Purus basin and the entire Ucayali basin. The discrimination of the study area for each of the variables can be seen in Figure 2.

2.2. Rainfall Data and Digital Elevation Model

Rainfall data were obtained for the Acre River basin (Figure 2A). To do this, a 0.25° × 0.25° grid of points (approximately 25 km × 25 km) was generated within this basin. Then, 31 points close to the river course were selected (Figure 3). The points were later imported into R Studio for extraction of rainfall data.
The Climate Hazards Infrared Precipitation with Stations–CHIRPS dataset was used for this extraction. This quasi-global dataset spans over 35 years and is based on precipitation estimates from rain gauges and satellite observations [9]. Monthly mean values from 1982 to 2023 were extracted for each of the 31 data points within R Studio using the “chirps” library.
The Digital Elevation Model (DEM) of the Acre River basin region (Figure 2B) was derived from altimetric data provided by Alos Palsar, a synthetic aperture radar known for its global coverage and free accessibility for various applications [30]. Altitude data were extracted for 31 points along the Acre River basin to compare them with precipitation data and analyze the relationship between these variables. Based on altitude, these points were classified into three categories: highest elevation portion, medium elevation portion, and minimum elevation portion, as illustrated in Figure 3.

2.3. Air Temperature and Fire Foci Data

The minimum and maximum temperature data used in this study are derived from reanalysis datasets validated for the entire Brazilian territory, with a spatial resolution of 0.1° × 0.1° (approximately 10 km × 10 km) [31]. These are reanalysis data, widely used in studies of climate trends in the Amazon [32]. The data were obtained from reanalysis models that integrate meteorological observations and data assimilation techniques to ensure temporal and spatial consistency. The measurement frequency is daily, with values representing monthly averages calculated over the study period, from January 2001 to July 2020. For this study, the average maximum and minimum temperature values were extracted for 31 points distributed along the Acre River basin (Figure 3). The extraction was performed using R Studio software version 4.2.2, employing the “ncdf4” library.
Monthly fire foci from 2001 to 2023 were obtained through the Fire Information for Resource Management System (FIRMS) platform (https://firms.modaps.eosdis.nasa.gov/, accessed on 11 August 2024). The data are from the MCD14ML product of the MODIS sensor and have a spatial resolution of approximately 1 km × 1 km [33]. These foci were obtained for a rectangular polygon encompassing the Acre River basin (Figure 2D).

2.4. Enhanced Vegetation Index

The Enhanced Vegetation Index (EVI) was obtained through the MOD13C2 product of the MODIS sensor, coupled to the TERRA satellite. This product is monthly and provides a vegetation index value per pixel with a spatial resolution of 0.05° × 0.05° (approximately 5 km × 5 km) [34]. Monthly average values from 2001 to 2023 were extracted for points covering the entire Acre River basin (Figure 2E), within R Studio.

2.5. Snow Cover Data

Snow cover data were obtained from the MOD10CM product of the MODIS sensor, coupled to the TERRA satellite. This is a monthly product, in which snow cover is detected using the Normalized Difference Snow Index (NDSI) in a previous product (MOD10_L2). MOD10CM operates with a spatial resolution of 0.05° × 0.05° (approximately 5 km × 5 km) and its monthly data are generated by compositing 28 to 31 days of daily observations from MOD10C1 [20]. Table 1 presents the Scientific Data Sets (SDSs) included in the product.
Monthly mean values from 2001 to 2023 were extracted for points encompassing the Ucayali basin and part of the Purus basin (Figure 2F), using R Studio. The percentage of snow in each cell was calculated based on the fraction of the cell area covered by snow, as detected by the Normalized Difference Snow Index (NDSI) from the MOD10CM product of the MODIS sensor. This index represents monthly averages derived from daily observations, reflecting the availability of snow in the cell throughout the analysis period. The years 2001, 2002, 2003, 2016, and 2022 did not present values for the month of December.

2.6. Statistical Analysis

In order to analyze the trend of the values, the non-parametric Mann–Kendall test was used [35,36]. For the rainfall data, it was applied to each of the 31 extraction points. For the Enhanced Vegetation Index and snow cover data, the test was applied to the entire time series, regardless of the extraction points. The aforementioned statistics were calculated within R Studio, using the “kendall” library.
In order to examine the relationship between the rainfall and altitude (given by the DEM) variables, an Exponential Nonlinear Regression Analysis was performed in each of the portions of the Acre River basin.
The data on rainfall, maximum temperature, average temperature, minimum temperature, fire foci, Enhanced Vegetation Index (EVI), and snow cover were subjected to Principal Component Analysis (PCA) in each portion of the Acre River basin. The average temperature was calculated as the arithmetic mean of the maximum and minimum temperatures, obtained by summing these variables and dividing the result by two. This calculation was performed for the same points along the Acre River basin during the period from January 2001 to July 2020, with the resulting values used in subsequent analyses, including PCA. PCA is a multivariate statistical technique that transforms a set of original variables into another set of the same dimension called principal components [37].
The Principal Component Analysis method used in this paper is based on the prcomp() function in R studio. This method performs matrix decomposition using Singular Value Decomposition (SVD), a robust and widely used method for PCA. This approach is suitable for exploring the variance and correlation structure in the datasets (maximum, mean, and minimum elevation), providing insights into which variables contribute most significantly to the observed patterns in the data.
To enhance the clarity of the methodological approach, we have included a flowchart summarizing the key steps of the study (Figure 4). The flowchart illustrates the sequential stages of the research, starting from the identification of the study area and ending with the conclusion and recommendations.

2.7. Spatial Resolution of Data

The spatial resolution of the datasets used in this study imposes inherent limitations on the ability to capture climatic and hydrological variations at a local scale. CHIRPS provides precipitation estimates on a 0.25° × 0.25° (~25 km × 25 km) grid, resulting in average values for areas of approximately 625 km2. Fire hotspot data from the MODIS MCD14ML product has a spatial resolution of approximately 1 km × 1 km, allowing for a more detailed representation of fire event distribution. Andean snow cover data were extracted from the MOD10CM product (MODIS/Terra Snow Cover Monthly L3 Global Climate Modeling Grid), which operates at a spatial resolution of 0.05° × 0.05° (~5 km × 5 km).
This scale implies that the average snow values for each cell represent an aggregate of the fraction of the area covered by snow within that spatial range. Although these datasets were selected for their extensive temporal coverage and validation in different climatic contexts, we acknowledge that spatial resolution may limit the identification of local patterns, especially in regions with high topographic variability and microclimatic changes. In the case of Andean snow cover, for example, the spatial averaging may smooth out variations at minimum altitudes. Therefore, the results presented should be interpreted considering that spatial averages may not fully capture microclimates and mesoscale effects.
Future studies may explore the use of higher-resolution data, such as time series from local meteorological stations and high-resolution sensors, to complement and validate the patterns identified in this study.

3. Results

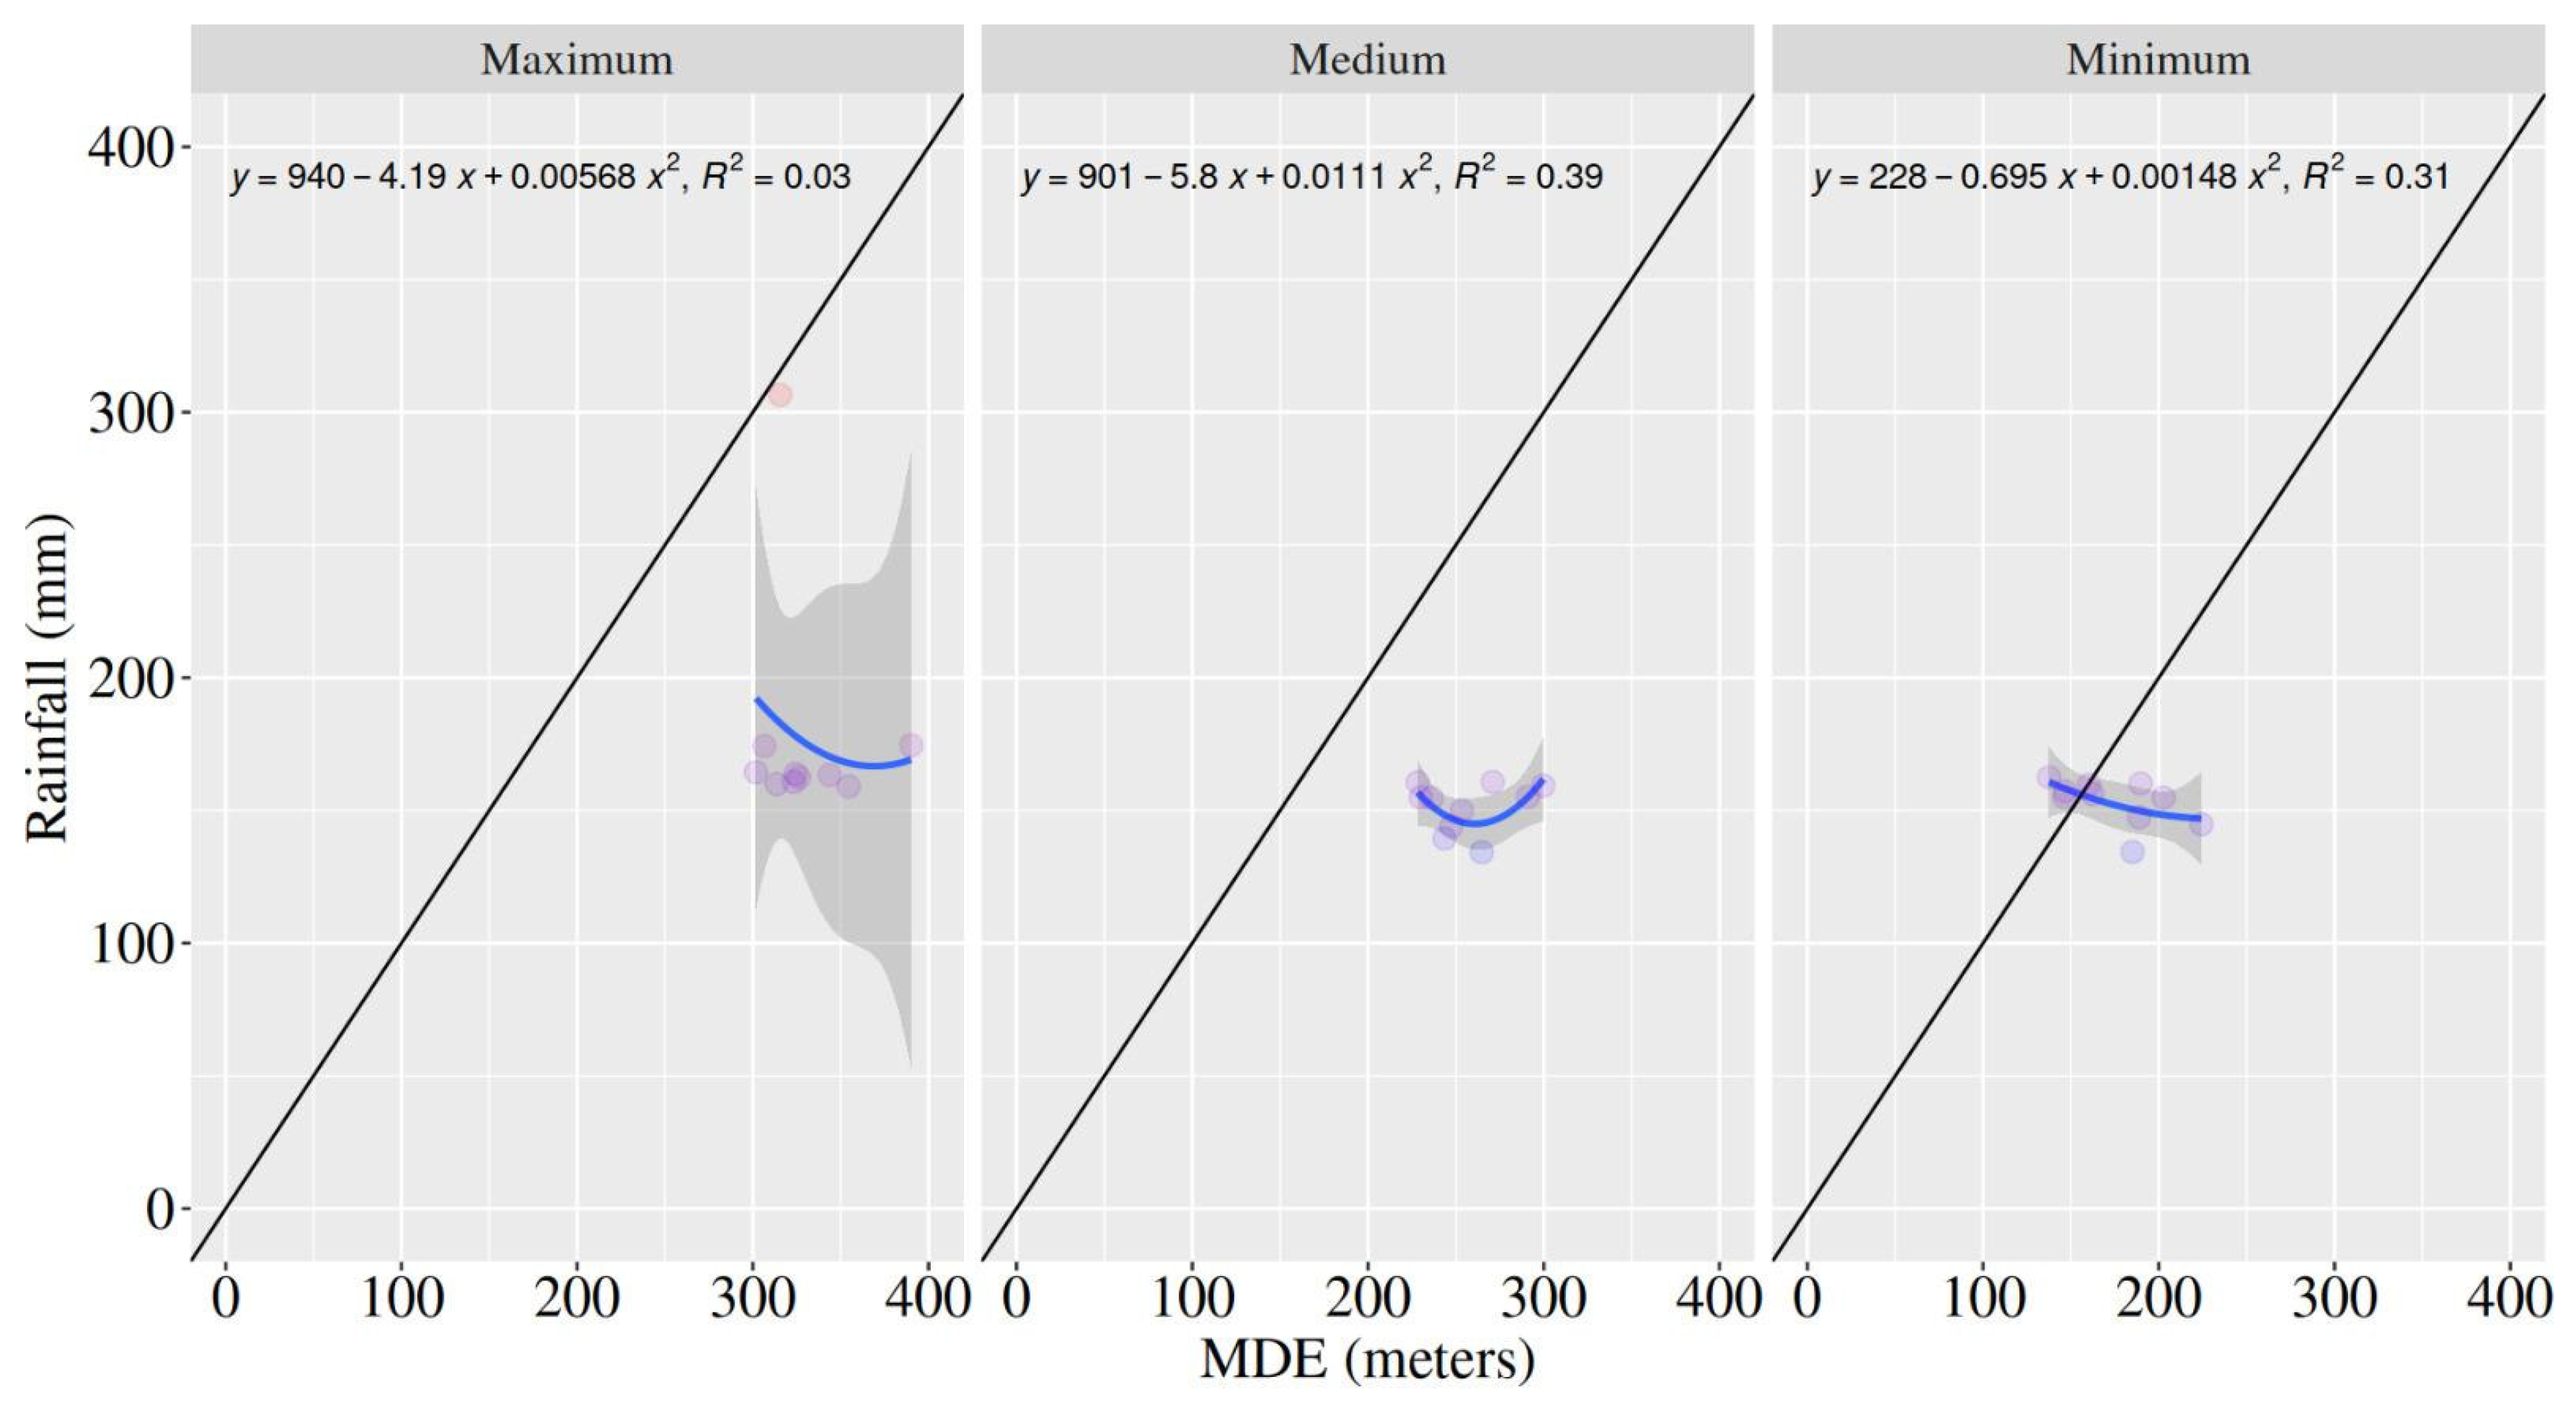
3.1. Rain in the Acre River Basin

The results of the seasonal analysis of the annual average precipitation in the Acre River basin corroborate the trends observed through the Mann–Kendall test (Figure 5). The annual average precipitation was estimated at 1983.43 mm, with the highest seasonal average values concentrated in DJF (December, January, February), corresponding to 256.59 mm, while the lowest values were recorded in JJA (June, July, August), with 42.29 mm. Data analysis revealed that February showed a significant increase at various points in the basin, as evidenced by the highest significant value recorded at P10 (Z = 2.60) and other points, totaling 14 significant increases during this month (Table 2). This pattern reinforces the intensification of the rainy season in the region, with the five highest precipitation averages observed in highest-altitude areas (>300 m), such as P01, which showed significant increases in February (Z = 2.49), March (Z = 1.73), May (Z = 1.82), June (Z = 1.66), and August (Z = 2.21).
On the other hand, significant reductions in dry-season months, such as July, September, and November, were more pronounced starting from P05, especially in minimum-altitude areas like P15, which recorded the lowest precipitation average (134.24 mm) at 264.75 m of altitude (Table 2). These results indicate not only the intensification of the rainy season but also the extension and severity of the dry season, highlighting the differentiated precipitation dynamics across the altitudinal portions of the basin. These patterns reflect the increasing impacts of climate change, which intensify extreme events and alter the hydrological balance of the region.
The models derived from the Regression Analysis for rainfall and altitude (DEM) are presented in Figure 6. The medium-elevation portion of the Acre River basin presented the highest Coefficient of Determination (R2) value, with 0.39. The highest-elevation portion, in turn, presented the lowest value, with 0.03.

3.2. Air Temperature, Fire, and Enhanced Vegetation Index in the Acre River Basin
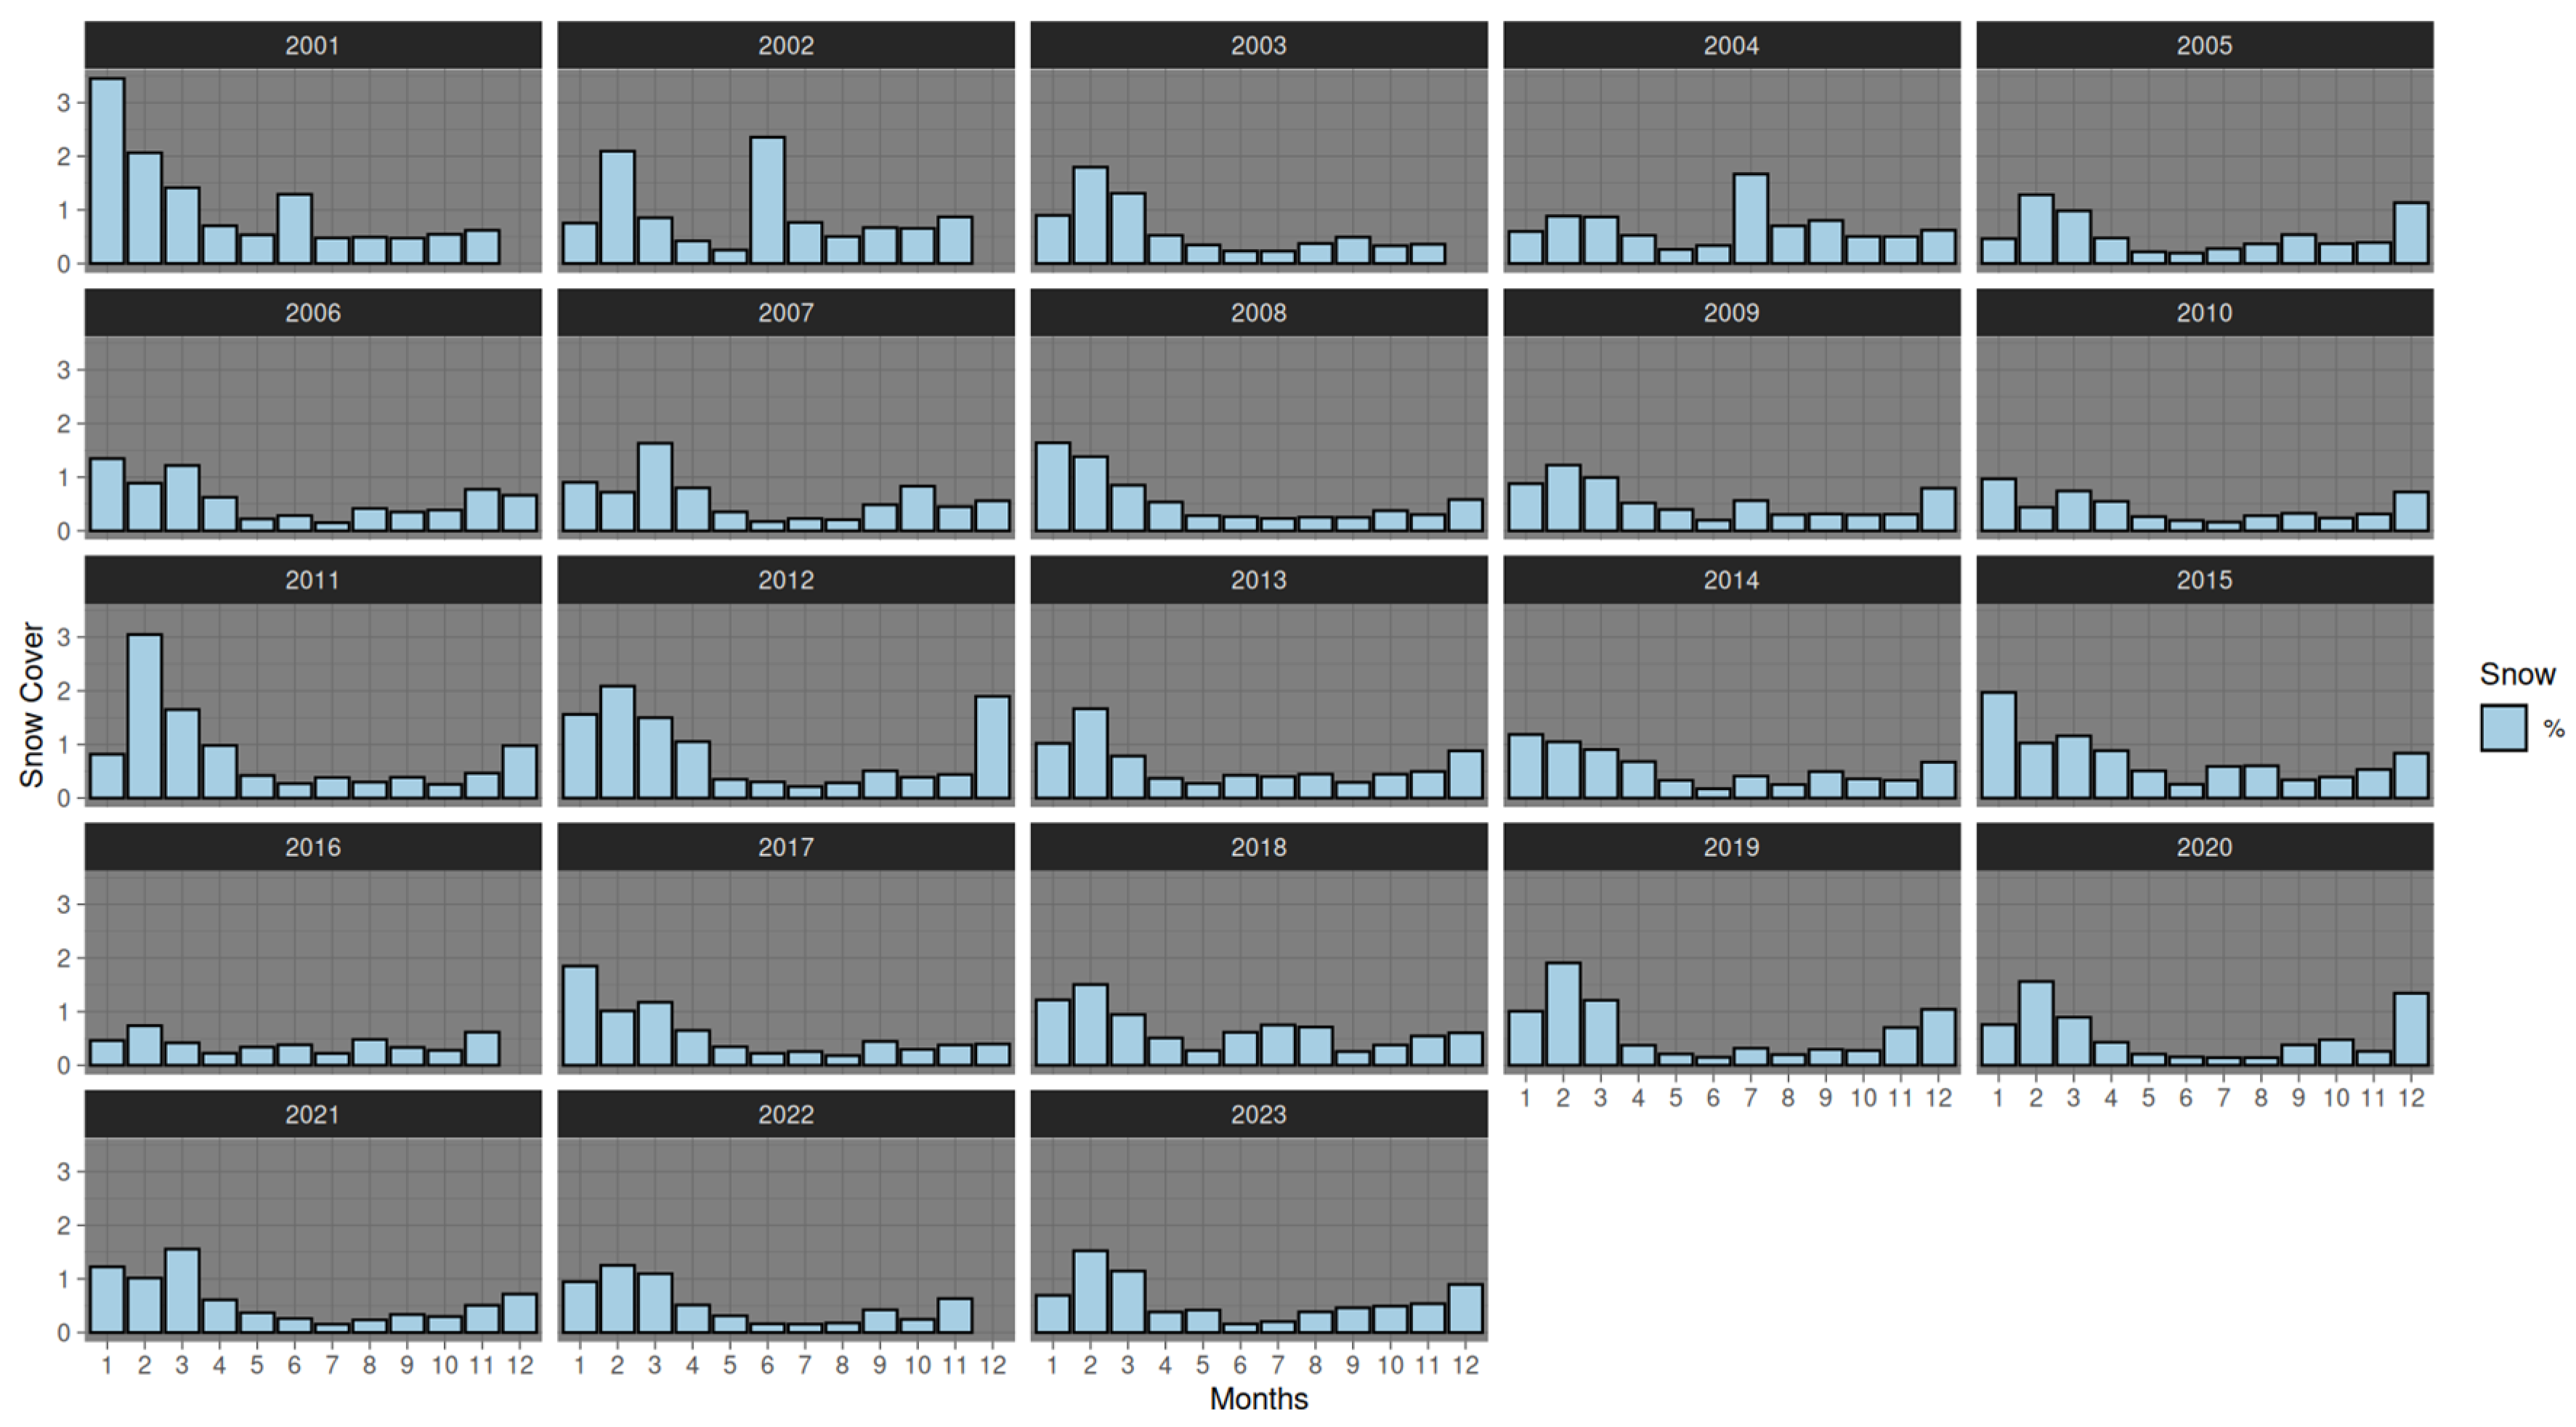
The results of the Mann–Kendall test for maximum temperature showed a significant increase for the months of April (Z = 1.85) and September (Z = 2.52). The highest significant value recorded in September indicates an intensification of maximum temperature in the future dry season. For minimum temperature, a significant increase was observed for the months of February (Z = 1.72) and November (Z = 1.68), indicating changes in the rainy season.
For fire, the test showed a significant increase for the months of January (Z = 1.89), May (Z = 1.72), June (Z = 2.04), August (Z = 1.69), and November (Z = 1.66). These results indicate an intensification of fire foci for the dry and rainy seasons in the future. For the Enhanced Vegetation Index, the test showed a significant reduction for the month of August (dry season), with the value Z = −2.06.

3.3. Snow Cover

The highest percentage of snow cover was observed in January 2001 (3.45%). The lowest percentage was observed in July 2020 (0.14%). In 2001, the lowest percentages were recorded in the months of August (0.49%), July (0.48%) and September (0.47%), that is, in the dry period of the year. In 2023, the lowest percentages were recorded in the months of April (0.38%), July (0.20%) and August (0.16%) (Figure 7).
Comparing the years 2001 and 2023 in relation to the highest percentages of snow cover, a decrease was observed. In 2001, the month of January had the highest coverage value with 3.45%. In 2023, the month of February had the highest coverage value with 1.52%. Since 2012, no month has had a percentage higher than 2.00%, showing a reduction in snow cover over the years (Figure 7). The Mann–Kendall test applied to the time series showed a significant reduction for the month of June (Z = −1.98), indicating that snow will decrease in the dry season.

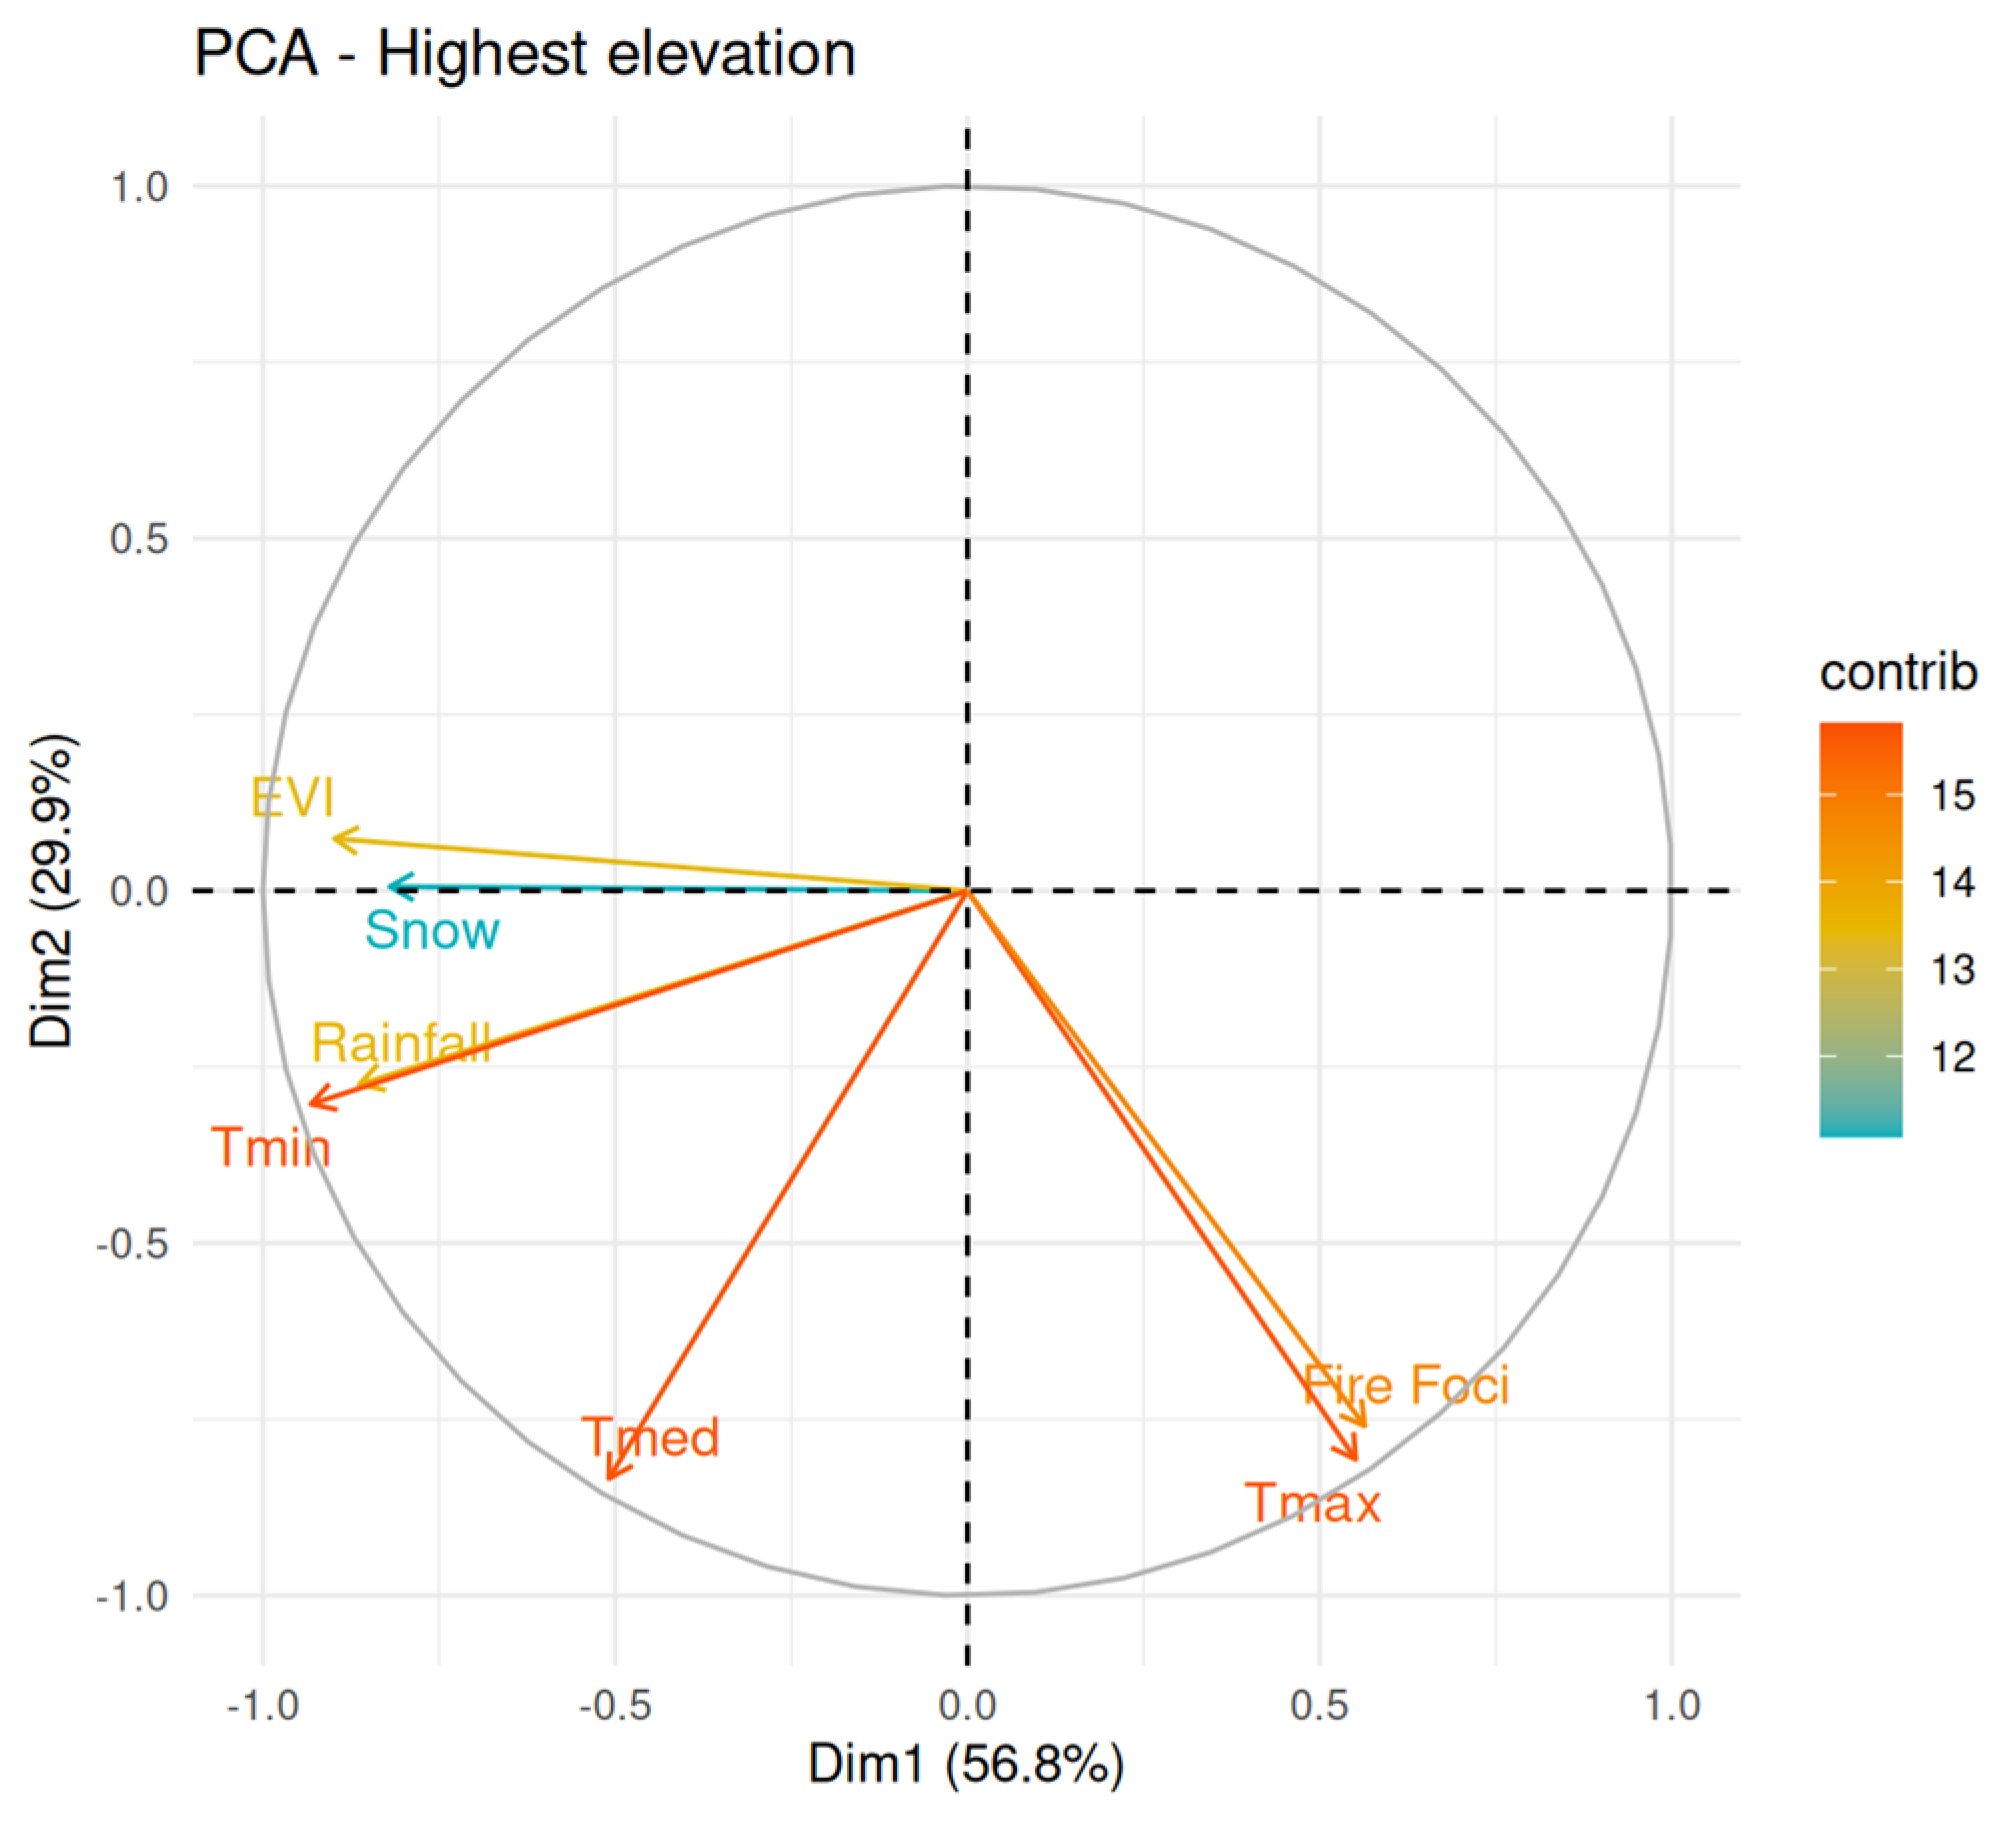
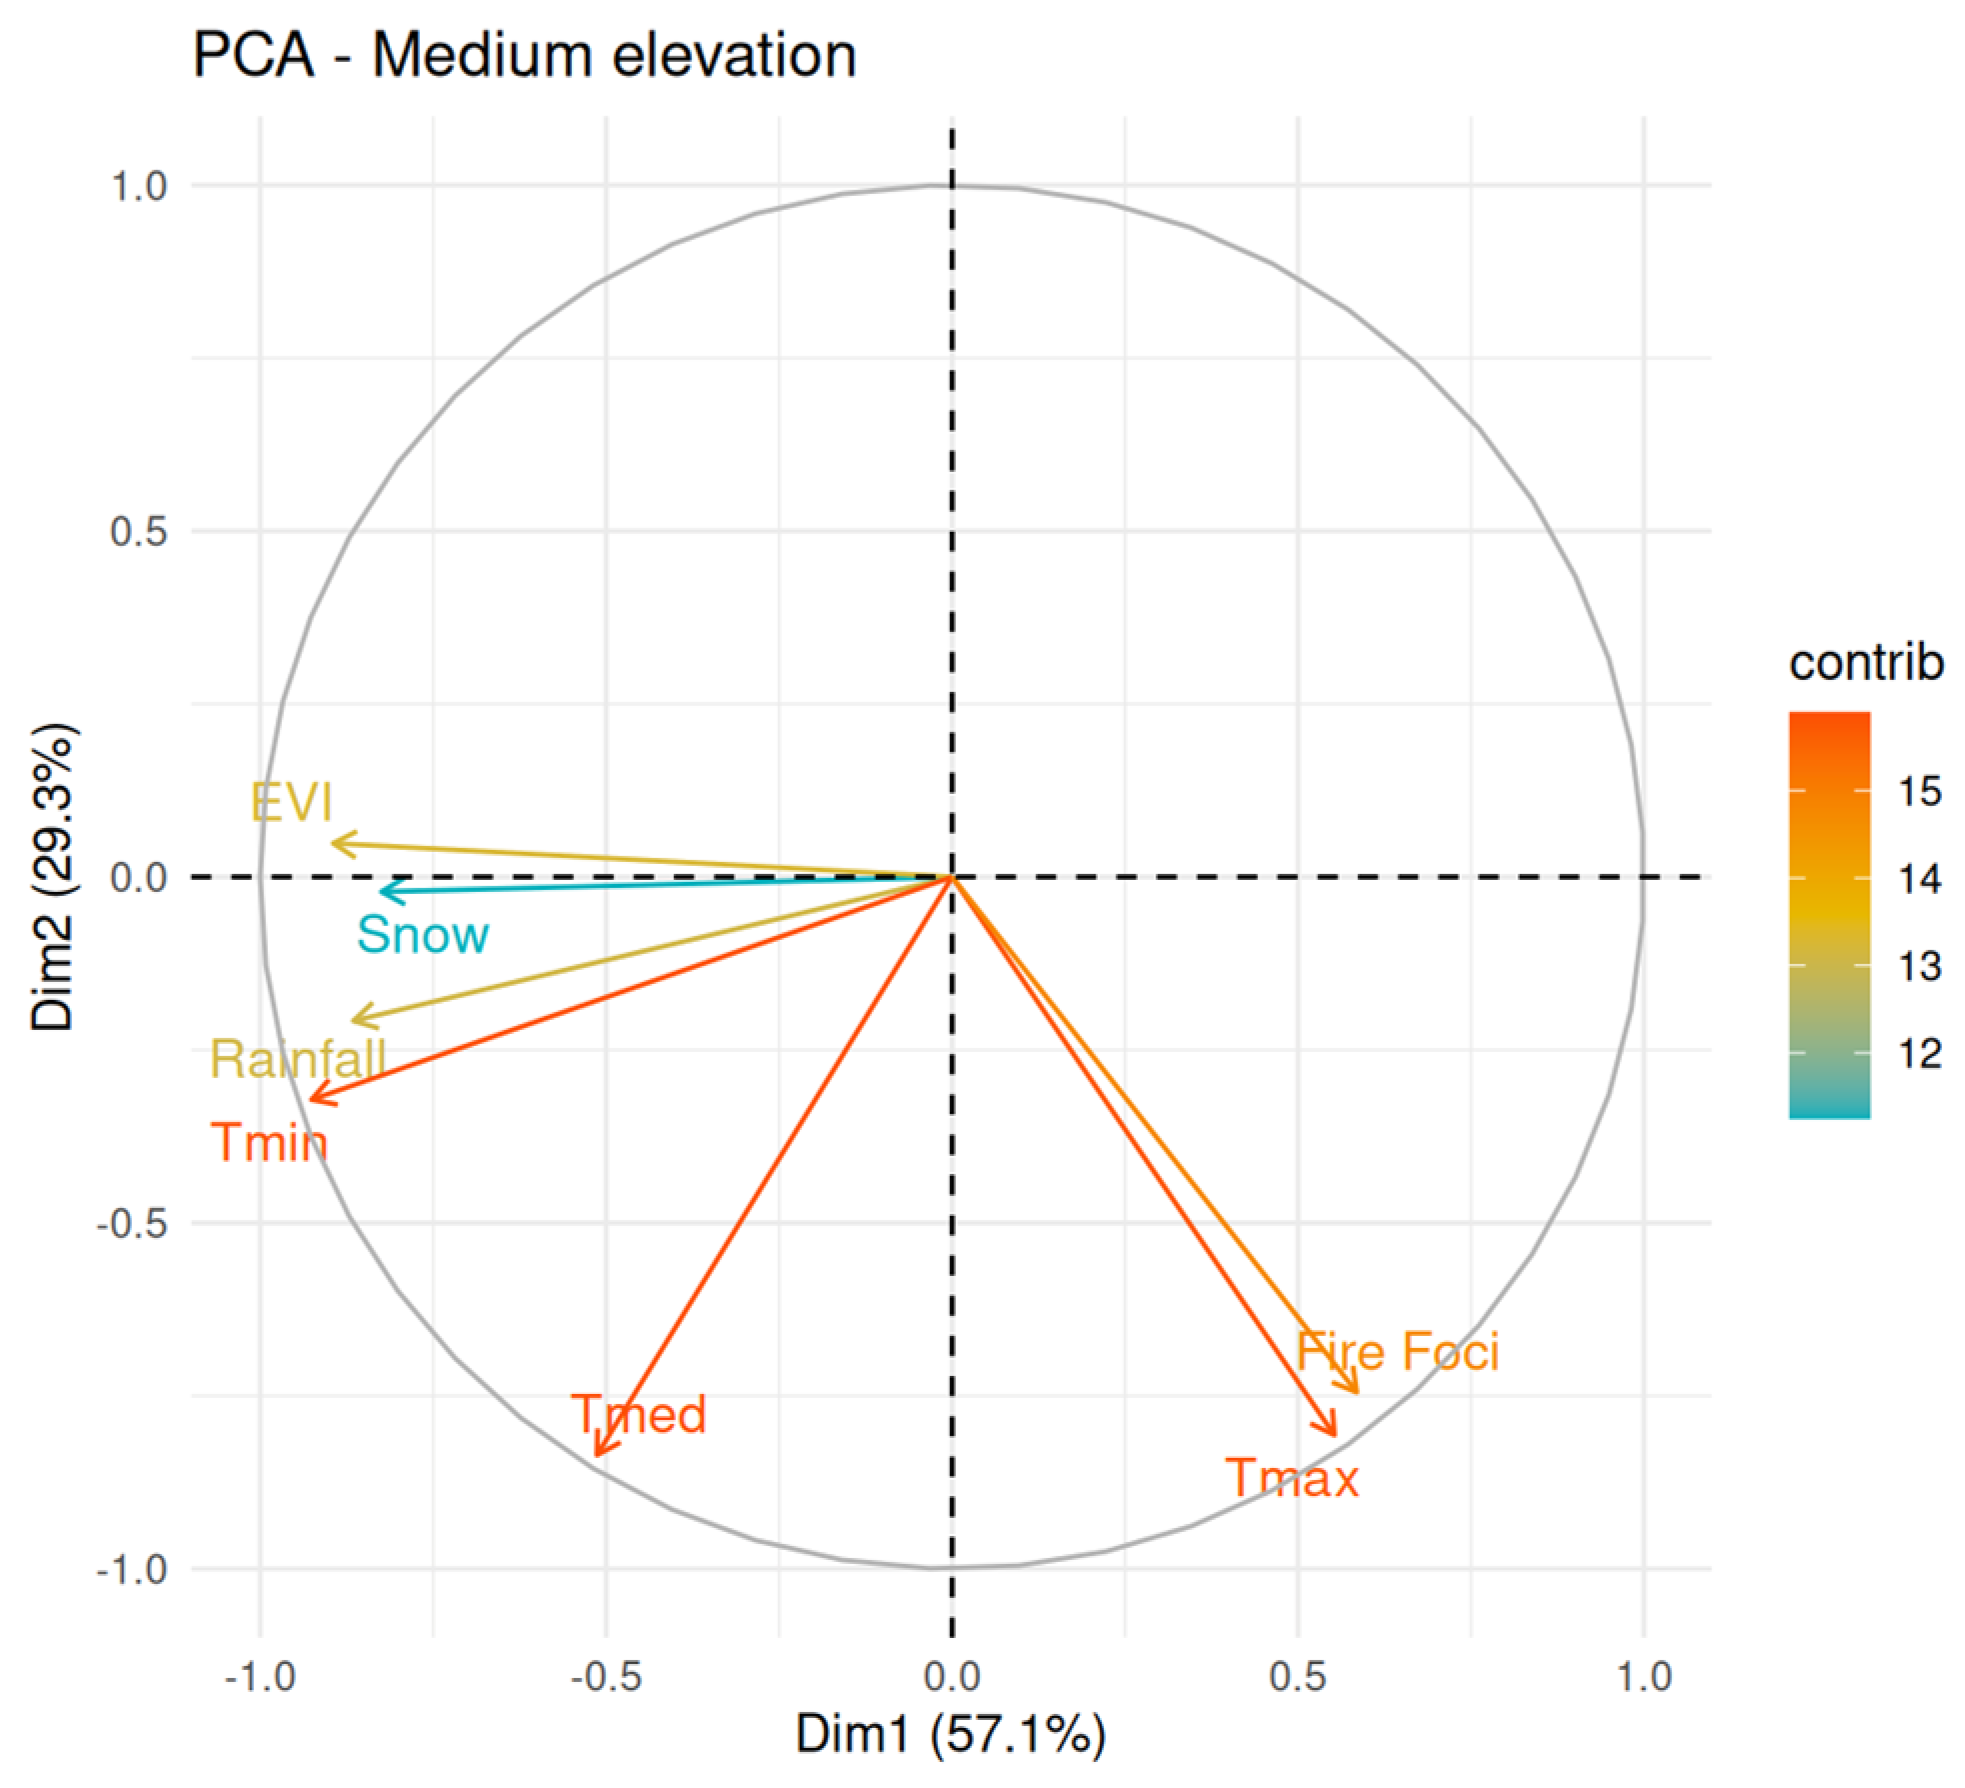
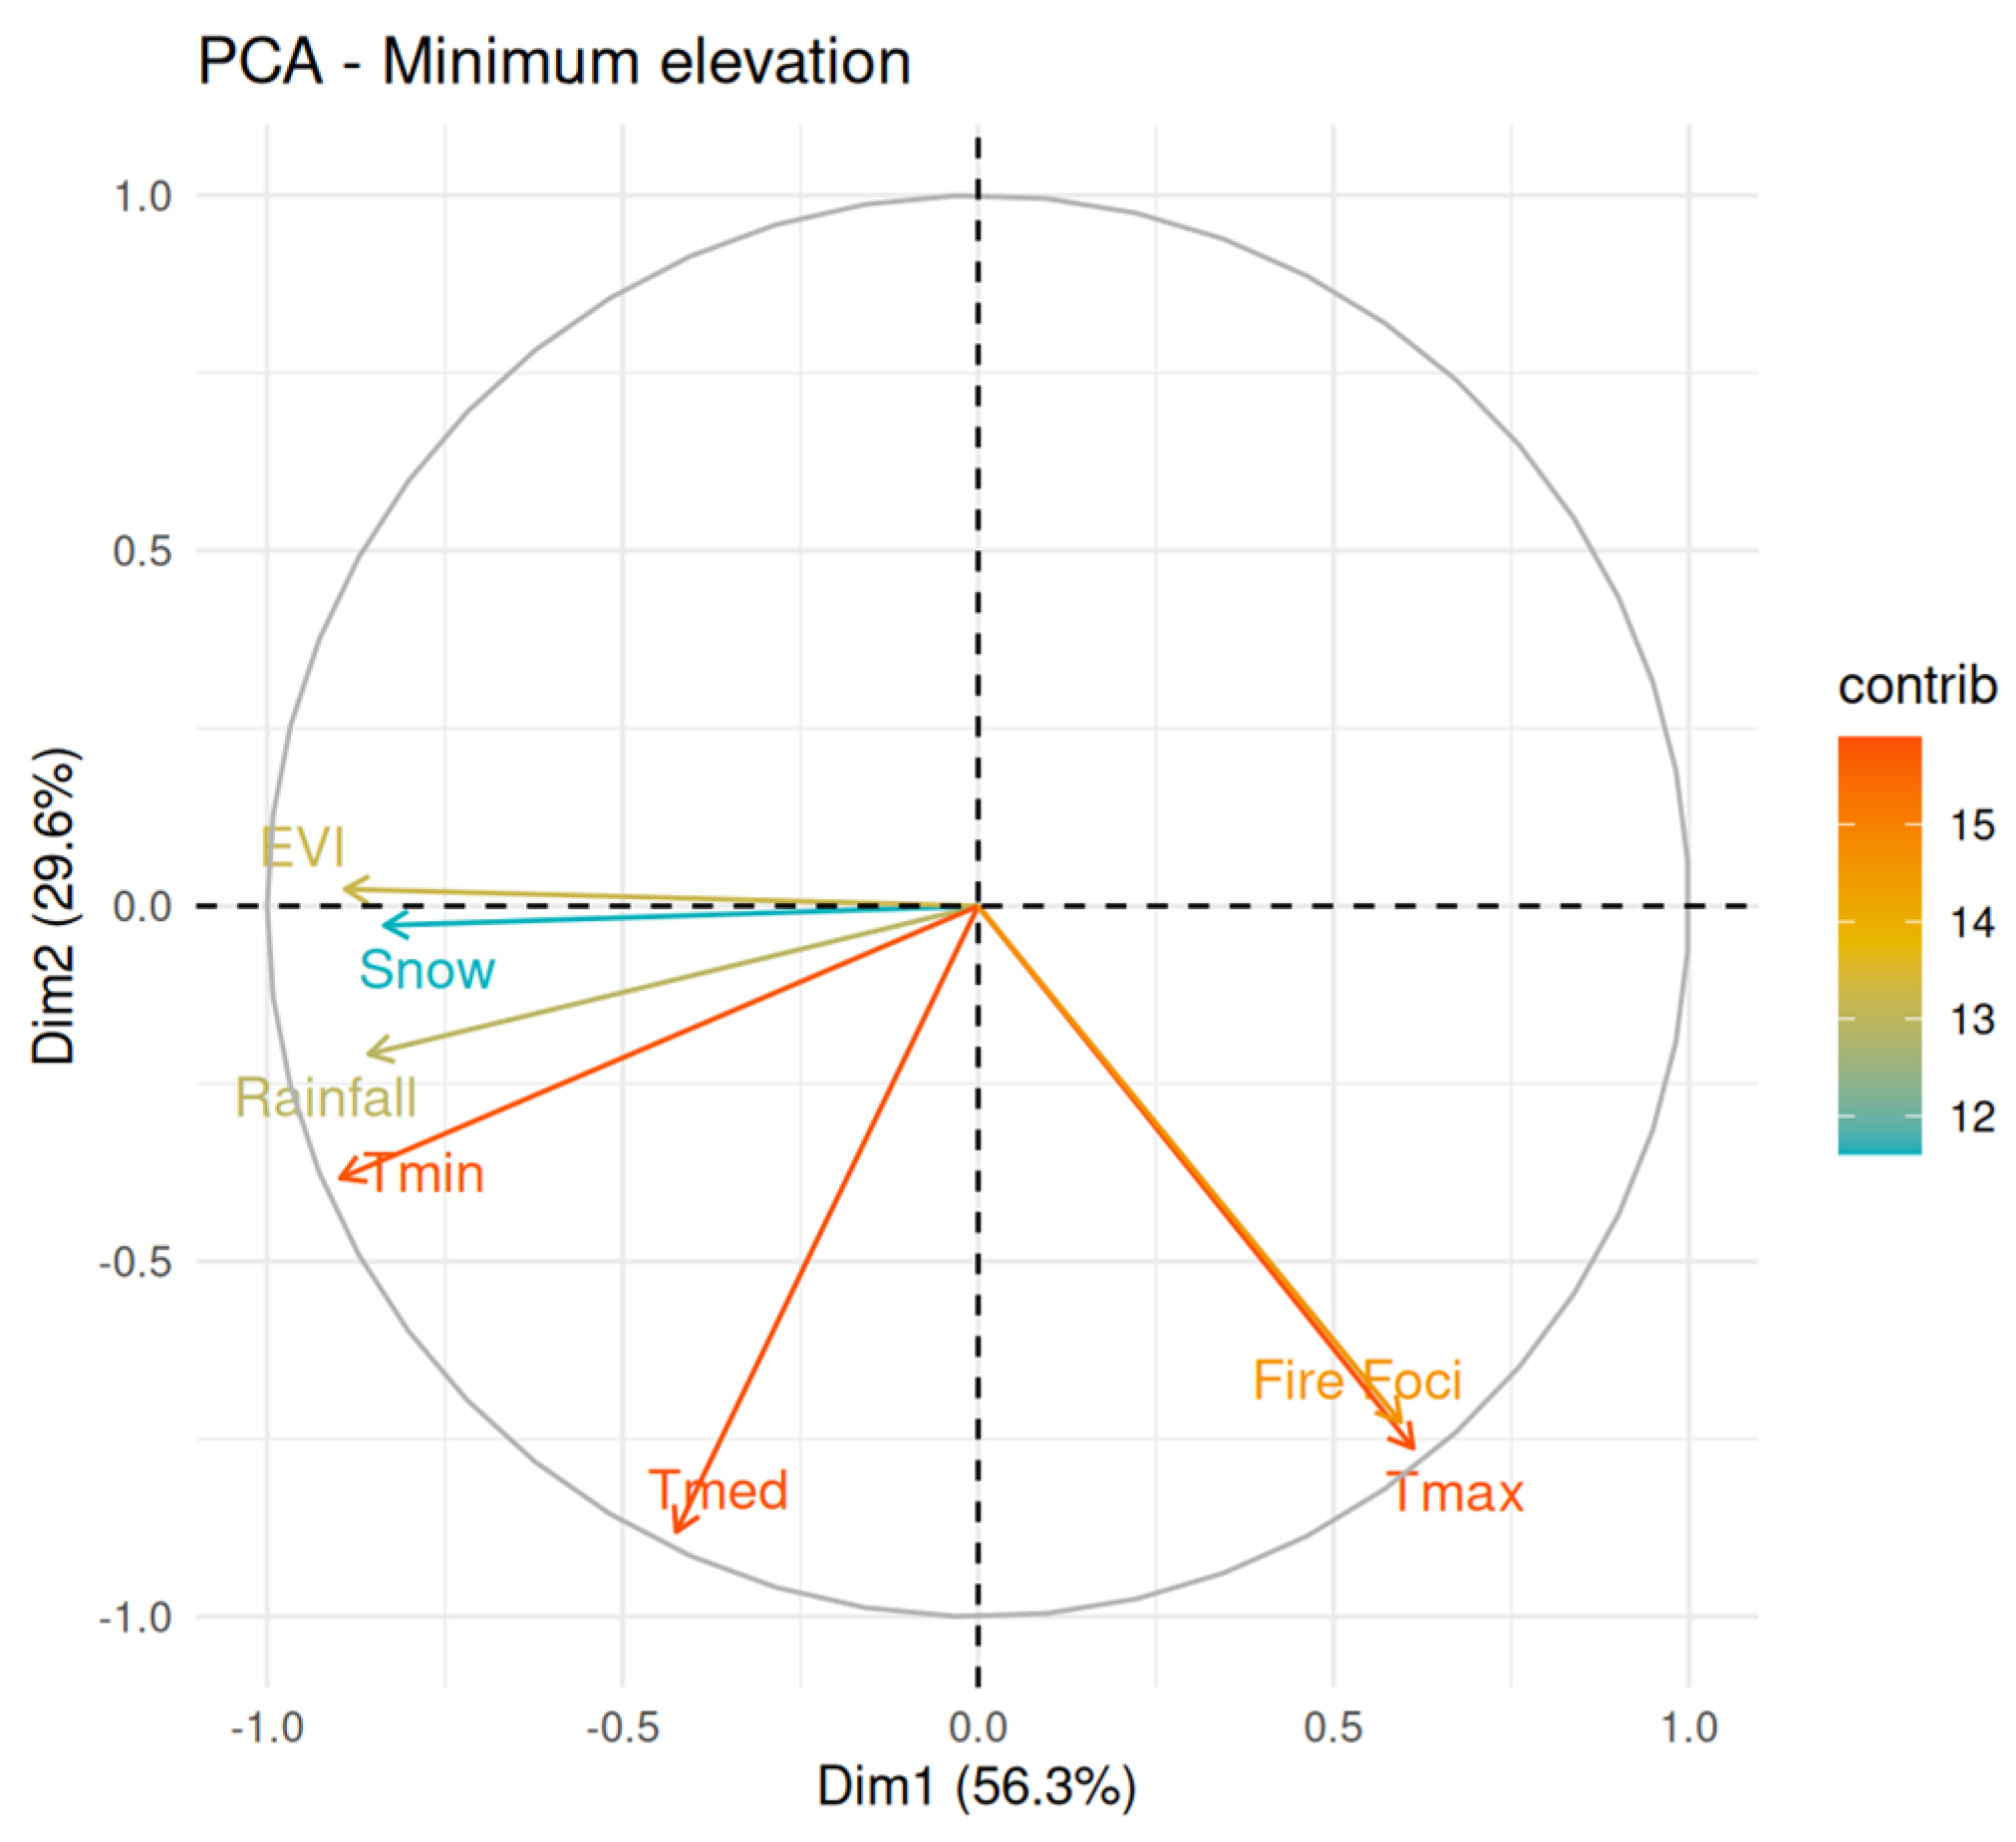
3.4. PCA in the Acre River Basin

In Figure 8, PC1 (Dim1) accounts for 56.75% of the total variance and is strongly influenced by the variables Rainfall, Snow, Tmax, and Tmin, all with high negative loadings. This indicates that extreme climatic conditions (maximum rainfall and extreme temperatures) dominate the primary variation, highlighting these factors as crucial drivers of environmental extremes. In PC2 (Dim2), which explains 29.93% of the variance, variables such as Fire Foci and Tmed contribute more positively, reflecting the sensitivity of fire foci to changes in average temperature. This interaction demonstrates that, under scenarios of climatic extremes, average temperatures can play an amplifying role, creating favorable conditions for the spread of fires, even when other factors, such as precipitation, remain high.
In Figure 9, PC1 (Dim1) explains 57.10% of the variance and also highlights the dominance of Rainfall, Snow, Tmax, and Tmin, with significant negative loadings. This demonstrates that, under average conditions, the same key climatic variables exert the greatest influence on the overall system behavior. However, PC2 (Dim2), which accounts for 29.33% of the variance, shows a more balanced contribution between Fire Foci and Tmed, suggesting that, in average scenarios, average temperatures and fire foci maintain a stable relationship. This stability may represent moderate conditions that still provide insights into how small variations in average temperature can directly affect fire patterns.
In Figure 10, PC1 (Dim1) explains 56.26% of the variance, once again with Rainfall, Snow, Tmax, and Tmin dominating the contributions. However, it is observed that under minimum conditions, external influences (such as reduced precipitation) may become more prominent, increasing the vulnerability of the environmental system. PC2 (Dim2), accounting for 29.65% of the variance, reinforces the relationship between Fire Foci and Tmed. Compared to other scenarios, it is possible that the lower variability of some climatic variables creates a situation where fire foci rely more on local or seasonal events, such as severe drought conditions or anthropogenic burning.

4. Discussion

4.1. Rainfall Behavior in the Acre River Basin

The results of this study show an increase in rainfall (mm) for the Acre River basin, mainly during the rainy season in the region. Conversely, the results show a reduction in rainfall (mm) for the same region during the dry season. A similar rainfall distribution pattern was observed in a study carried out by [38] in the city of Rio Branco (located within the same basin), which evaluated a historical series from 1970 to 2021, finding higher rainfall from November to March and lower rainfall from June to August.
The existence of significant rainfall reduction values (mm) for the month of November suggests an extension of the dry season in the Acre River basin region, given that this month marks the beginning of the rainy season, as shown in a study carried out by [39] in the Juruá basin, also located in the state of Acre. In it, the period from July to September presented the lowest rainfall records, evidencing a shorter dry season.
The extension of the dry season suggested above would directly affect the climate in other countries that contain the Amazon biome, given that Brazil is the largest supplier of rainfall to them. Up to a third of the total annual precipitation in the Amazon territories of Bolivia, Peru, Colombia, and Ecuador depends on water originating from the Brazilian portion of the Amazon rainforest [40].
Our results showed that February had an increase in rainfall (mm) compared to other months, suggesting an intensification of the rainy season and, consequently, of events such as floods. The rainy season, which includes the month in question, is considered the most likely to cause extreme flooding in other basins in the state [7].
In this decade alone, the Acre River has already recorded its second (2024) and third (2023) highest levels in history in the capital of the state of Acre, according to the Woodwell Climate Research Center (https://www.woodwellclimate.org/acres-communities-face-drinking-water-shortage-amid-amazon-drought/, accessed on 9 September 2024). Between 1987 and 2023, 254 extreme events were identified in the federative unit, 33% of which were flood events [3].
A study conducted by [41] on the Juruá River, in another region of Acre, showed that extreme floods occur approximately every decade, more precisely during La Niña events in February. With the intensification of rainfall in this month evidenced by our study, it is possible that there will be a greater frequency of floods in the region in the future. Furthermore, a study carried out on a global scale highlighted that precipitation extremes are more likely to increase than decrease in humid regions [42], as is the case in the region surrounding the study area.
In Greenland, the CMIP5 and CMIP6 models indicate similar trends of increasing precipitation, especially under high-emission scenarios (RCP8.5) [43]. Projections show significant increases in annual precipitation (277.9 to 281.3 Gt by the end of the century) and an intensification of near-surface temperatures (T2m), with an average increase of 5.7 °C in high-emission scenarios. These results parallel our findings of greater intensity in the rainy season in Acre, evidenced by the increase in February precipitation.
Extreme events, such as those identified in our study on rainfall, can pose significant challenges to initiatives like those in Malaysia for implementing photovoltaic systems [44]. The increase in rainfall and temperatures driven by climate change has the potential to compromise the performance and durability of these systems, hindering their energy efficiency and long-term economic viability.

4.2. Air Temperature, Fire, and Vegetation Trends in the Acre River Basin

Our results, evaluating the time series from January 2001 to July 2020, show an increase in maximum temperature in the dry season and an increase in minimum temperature in the rainy season. [39] found a significant positive trend for average air temperature during the dry season in the Juruá basin. Several climate models indicate more consecutive dry days and an increase in annual maximum temperatures of 2 to 4 °C in the Amazon region [45]. The PCA showed a strong relationship between maximum temperature and fire foci, especially in the lower part of the basin, which did not record high average rainfall values when compared to the higher part. Therefore, the increase in temperatures observed in our study will make the region more susceptible to forest fires.
Our results show an intensification of fire foci during the dry and rainy seasons, a behavior similar to that found by [32] in a study carried out in Rio Branco. These authors proposed a fire risk model for the capital and verified projections for the future, finding that there will be an increase in fire activity within the next 20 years in the region. In addition, they observed a greater significant increase (Z = 2.42) in fire foci in the formation of the Alluvial Open Ombrophilous Forest type, which is present on the banks of the Amazon rivers [46], indicating a greater susceptibility of the basin to fire in the future.
Regarding the composition of the landscape, our results indicate a reduction in vegetation for the month of August. This behavior is expected, given the dry season, but it may also be associated with the advance of deforestation in the region, as observed in another study [32]. The dry season is more prone to fires, given the greater accumulation of combustible material in the soil, low humidity, and high temperatures [47].
The study results suggest that climate change is intensifying hydrological extremes and associated risks in Acre and the western Amazon. Similar to patterns observed in California wildfires, where region-specific models demonstrated greater accuracy in predicting future fire patterns [48], the findings related to the Acre River basin underscore the importance of regional approaches to climate analysis. In the case of Acre, detailed analysis revealed increased precipitation during February, heightening the risk of floods, and reduced rainfall during the dry season, prolonging drought periods. This aligns with the increasing climate variability observed globally, such as the reduction in snow cover in the Andes, which directly impacts the regional hydrological cycle.
The trend of this season lengthening (with rising temperatures and reduced rainfall) observed in our study suggests a worsening of the climate situation in the Acre River basin region. In the southwestern Amazon, there is evidence that high temperatures and high percentages of deforested areas are some of the main factors in the occurrence of fires [49].

4.3. Reduction of Andean Snow and Impact on the Acre River Basin

The snow cover percentages we found did not exceed 3.5% during the entire period analyzed, which is an expected result, considering that, in the tropics, Andean snow is restricted to high elevations (>5000 m) [50]. Our results show a reduction in snow cover in the last decade. A study investigating the same variable using MODIS data in the Andean region, between 2000 and 2016, also found a reduction [18].
The aforementioned study found significant decreasing trends in snow cover, with results of 2 to 5 fewer days of snow each year. Another study conducted in the Andes region of Chile [51], between 2001 and 2021, found an average of 3.6 fewer days of snow cover per year.
The reduction in snow activity in the tropical Andean region may impact not only the glacial river basins in Peru and Bolivia, but also downstream basins that are fed by them, leading to a long-term reduction in river discharge. This decrease in snow is related to the high air temperatures observed in the region [52].
This relationship is reinforced by the results of our study, which indicate a trend of significant reduction in snowfall, especially in June, a dry month characterized by high temperatures and low humidity. A study on snow cover in the dry season carried out by [53], between latitudes 18° and 40° S of the Andes, showed a decreasing trend in the most tropical stratum of the region (between 18° and 23°), with a reduction of approximately −16% in coverage per decade.
Ref. [18] found a high correlation between the snow persistence variable and the air temperature and precipitation variables in the Andes. For air temperature, the relationship with snow persistence was inverse. Precipitation, in turn, had a direct relationship with the variable. Our results show a similar pattern, with the snow cover, minimum temperature, and rainfall variables showing a high relationship by PCA.
The reduction of tropical Andean ice is a concern for the Acre basins that are connected to the glacial basins of neighboring countries, such as the Purus basin (of which the Acre River basin is part), due to the potential impacts on the economy and the environment. The reduction of snow can cause harm to the use of water resources, impacting both those living in the tropical Andes and those living downstream, at minimum altitudes [54].
Understanding the factors that affect changes in snow cover is important for developing strategies to reduce the impacts of climate change. Thus, remote sensing products, such as those from the MODIS sensor, provide valuable data for monitoring snow cover [55]. Our study area showed climate trends that are favorable for the worsening of the situation, such as the extension of the dry season with high temperatures and decreased rainfall and a more concentrated rainy season, possibly indicating the occurrence of more extreme events for the Acre region in the future.
The observed decline in Andean snow cover aligns with findings from alpine and other high-altitude regions, such as those reviewed in the European Alps (1995–2024), which highlight the significant role of climate change in altering global snow and ice dynamics [56]. The results of our study, indicating a reduction in snow cover during the dry season, corroborate these global patterns. The connectivity between these Andean snow-fed basins and Amazonian tributaries, such as the Acre River, makes this issue critical for climate adaptation strategies.
The reduction in Andean snow cover and its impacts on the Acre basins highlight dynamics similar to those observed in the Himalayas, as demonstrated in the study of the Annapurna II glacier [57]. While the tropical Andes exhibit snow cover reduction associated with rising temperatures and variable precipitation, the Himalayas display glacial retreat patterns that directly influence the frequency and magnitude of snow-ice avalanches. Both regions demonstrate that climate change has significant effects on high-altitude ecosystems and downstream communities dependent on their water resources.
The findings of this study on hydrological dynamics in Acre and the reduction in Andean snow cover can be related to the global context presented in the abstract on climate change impacts on snow cover in ski regions [58]. Both analyses highlight that climate change is significantly altering snow and precipitation patterns, with severe impacts on mountain ecosystems and their ecological functions. In Acre, the reduction in Andean snow cover, combined with changes in temperature and precipitation patterns, directly affects the hydrological cycle of Amazonian basins, increasing the risks of climatic extremes such as floods and droughts. Similarly, the global study emphasizes the decreasing number of natural snow cover days, projecting a redistribution of skiable areas to less populated regions and the highest altitudes, accompanied by human interventions such as artificial snow production. In both cases, concerns arise regarding the ecological and economic impacts of these changes. In Acre, the reduction in snow threatens water availability and increases the risk of wildfires, while globally, high-altitude biodiversity faces risks due to the expansion of infrastructure to compensate for snow loss.

5. Conclusions

The present study confirmed highly relevant climatic and hydrological patterns for the Acre River basin region. A greater intensity of rainfall was observed in February, suggesting an increase in the frequency of floods during the rainy season. On the other hand, reduced precipitation in subsequent months, combined with the extension of the dry season, presents a concerning scenario characterized by high temperatures, an increase in fire foci, and a reduction in vegetation cover. The Principal Component Analysis (PCA) highlighted important relationships, such as the dominant contribution of extreme climatic variables, including precipitation, maximum and minimum temperatures, and snow cover in PC1 (explaining about 56% of the variance), and the positive relationship between average temperature and fire foci in PC2 (29% of the variance).
Furthermore, the reduction in Andean snow cover, evidenced by values below 2% over the past decade, reinforces the impact of climate change in the region. This decline could negatively affect water availability, particularly for populations dependent on connected hydrographic basins, such as the Acre River basin. Thus, strategies integrating climate monitoring and mitigation policies are essential to address the challenges associated with climatic extremes, including floods, droughts, and wildfires, while preserving the ecosystem services of the Western Amazon. This study contributes to the understanding of climatic dynamics and their impacts, fostering a necessary scientific dialogue to formulate more effective responses to global changes.

Author Contributions

Conceptualization, K.d.S.M. and R.C.D.; methodology, K.d.S.M. and R.C.D.; software, K.d.S.M., R.C.D. and A.P.T.M.; validation, K.d.S.M. and R.C.D.; formal analysis, K.d.S.M., R.C.D. and A.P.T.M.; investigation, K.d.S.M. and R.C.D.; resources, K.d.S.M. and R.C.D.; data curation, K.d.S.M. and R.C.D.; writing—original draft preparation, K.d.S.M., R.C.D. and A.P.T.M.; writing—review and editing, K.d.S.M., R.C.D. and A.P.T.M.; visualization, K.d.S.M., R.C.D. and A.P.T.M.; supervision, R.C.D.; project administration, R.C.D.; funding acquisition, K.d.S.M. and R.C.D. All authors have read and agreed to the published version of the manuscript.

Funding

Coordination for the Improvement of Higher Education Personnel (CAPES) Financing Code 001.

Institutional Review Board Statement

Not applicable.

Informed Consent Statement

Not applicable.

Data Availability Statement

Data are contained within the article.

Acknowledgments

The authors would like to thank the Federal University of Acre, the Post-graduate Program in Forestry Science–CIFLOR, and Integate Center for Agricultural and Forestry Meteorology–CIMAF for the facilities and workplace for data analysis.

Conflicts of Interest

The authors declare no conflicts of interest.

References

  1. IPCC. Climate Change 2022: Impacts, Adaptation and Vulnerability. Contribution of Working Group II to the Sixth Assessment Report of the Intergovernmental Panel on Climate Change. 2022. Available online: https://www.ipcc.ch/report/ar6/wg2/downloads/report/IPCC_AR6_WGII_SummaryVolume.pdf (accessed on 20 April 2024).
  2. Marengo, J.A.; Espinoza, J.C. Extreme seasonal droughts and floods in Amazonia: Causes, trends and impacts. Int. J. Climatol. 2016, 36, 1033–1050. [Google Scholar] [CrossRef]
  3. da Silva, S.S.; Brown, F.; de Oliveira Sampaio, A.; Silva, A.L.C.; dos Santos, N.C.R.S.; Lima, A.C.; de Souza Aquino, A.M.; da Costa Silva, P.H.; do Vale Moreira, J.G.; Oliveira, I.; et al. Amazon climate extremes: Increasing droughts and floods in Brazil’s state of Acre. Perspect. Ecol. Conserv. 2023, 21, 311–317. [Google Scholar] [CrossRef]
  4. Dolman, D.I.; Brown, I.F.; Anderson, L.O.; Warner, J.F.; Marchezini, V.; Santos, G.L.P. Re-thinking socio-economic impact assessments of disasters: The 2015 flood in Rio Branco, Brazilian Amazon. Int. J. Disaster Risk Manag. 2018, 31, 212–219. [Google Scholar] [CrossRef]
  5. Oliveira, A.V.d.; Serrano, R.O.P.; Mesquita, A.A.; Moreira, J.G.d.V. Temporal trend and estimation of the hydrological risk of maximum rainfall and flow extremes in the City of Rio Branco, Acre, Brazil. Rev. Bras. Meteorol. 2022, 36, 749–758. [Google Scholar] [CrossRef]
  6. Sorribas, M.V.; Paiva, R.C.D.; Melack, J.M.; Bravo, J.M.; Jones, C.; Carvalho, L.; Beighley, E.; Forsberg, B. Projections of climate change effects on discharge and inundation in the Amazon basin. Clim. Change 2016, 136, 555–570. [Google Scholar] [CrossRef]
  7. Silva, J.R.D.S.; Taveira, M.K.; Mesquita, A.A.; Serrano, R.O.P.; Moreira, J.G.d.V. Caracterização temporal da precipitação pluviométrica na cidade de Cruzeiro do Sul, Acre, Brasil. Uáquiri 2021, 3, 64–75. [Google Scholar] [CrossRef]
  8. Moreto, V.B.; Aparecido, L.E.O.; Rolim, G.S.; Moraes, J.R.S.C. Agrometeorological models for estimating sweet cassava yield. Pesqui. Agropecu. Trop. 2018, 48, 43–51. [Google Scholar] [CrossRef]
  9. Funk, C.; Peterson, P.; Landsfeld, M.; Pedreros, D.; Verdin, J.; Shukla, S.; Husak, G.; Rowland, J.; Harrison, L.; Hoell, A.; et al. The climate hazards infrared precipitation with stations—A new environmental record for monitoring extremes. Sci. Data 2015, 2, 150066. [Google Scholar] [CrossRef]
  10. Alejo, L.A.; Alejandro, A.S. Validating CHIRPS ability to estimate rainfall amount and detect rainfall occurrences in the Philippines. Their. Appl. Climatol. 2021, 145, 967–977. [Google Scholar] [CrossRef]
  11. Aksu, H.; Akgul, M.A. Performance evaluation of CHIRPS satellite precipitation estimates over Turkey. Theor. Appl. Climatol. 2020, 142, 71–84. [Google Scholar] [CrossRef]
  12. Rivera, J.A.; Marianetti, G.; Hinrichs, S. Validation of CHIRPS precipitation dataset along the Central Andes of Argentina. Atmos. Res. 2018, 213, 437–449. [Google Scholar] [CrossRef]
  13. López-Bermeo, C.; Montoya, R.D.; Caro-Lopera, F.J.; Díaz-García, J.A. Validation of the accuracy of the CHIRPS precipitation dataset at representing climate variability in a tropical mountainous region of South America. Phys. Chem. Earth (Pt A B C) 2022, 127, 103184. [Google Scholar] [CrossRef]
  14. Brasil, J.B.; Palácio, H.A.D.Q.; Neto, J.R.D.A.; Filho, J.C.R.; de Andrade, E.M. Características das chuvas e interceptação vegetal no Bioma Caatinga. Irriga 2017, 22, 560–574. [Google Scholar] [CrossRef]
  15. Farias, C.F.d.S.; José, J.V.; Leite, K.N.; Souza, M.D.; Amaral, M.A.C.M.; Silva, S.S.d. Rainfall interception mapping in the Alto Juruá hydrographic basin, Acre. Res. Soc. Dev. 2022, 11, e6711124343. [Google Scholar] [CrossRef]
  16. Peng, X.; Zhang, T.; Frauenfeld, O.W.; Du, R.; Jin, H.; Mu, C. A holistic assessment of 1979–2016 global cryospheric extent. Earth’s Future 2021, 9, e2020EF001969. [Google Scholar] [CrossRef]
  17. Braun, M.H.; Malz, P.; Sommer, C.; Farías-Barahona, D.; Sauter, T.; Casassa, G.; Soruco, A.; Skvarca, P.; Seehaus, T.C. Constraining glacier elevation and mass changes in South America. Nat. Clim. Change 2019, 9, 130–136. [Google Scholar] [CrossRef]
  18. Saavedra, F.A.; Kampf, S.K.; Fassnacht, S.R.; Sibold, J.S. Changes in Andes snow cover from MODIS data, 2000–2016. Cryosphere 2018, 12, 1027–1046. [Google Scholar] [CrossRef]
  19. Malmros, J.K.; Mernild, S.H.; Wilson, R.; Tagesson, T.; Fensholt, R. Snow cover and snow albedo changes in the central Andes of Chile and Argentina from daily MODIS observations (2000–2016). Remote Sens. Environ. 2018, 209, 240–252. [Google Scholar] [CrossRef]
  20. Hall, D.K.; Riggs, G.A. MODIS/Terra Snow Cover Monthly L3 Global 0.05Deg CMG, Version 61 MOD10CM; NASA National Snow and Ice Data Center Distributed Active Archive Center: Boulder, CO, USA, 2021. [Google Scholar] [CrossRef]
  21. Alvares, C.A.; Stape, J.L.; Sentelhas, P.C.; Gonçalves, J.D.M.; Sparovek, G. Köppen’s climate classification map for Brazil. Meteorol. Z. 2013, 22, 711–728. [Google Scholar] [CrossRef]
  22. Silva Júnior, L.A.S.; Delgado, R.C.; Pereira, M.G.; Teodoro, P.E.; da Silva Junior, C.A. Fire dynamics in extreme climatic events in western amazon. Environ. Dev. 2019, 32, 100450. [Google Scholar] [CrossRef]
  23. Amaral, E.F.; Lani, J.L.; Bardales, N.G.; de Araújo, E.A. Origem, formação e diversidade dos solos do Acre. 2021. Available online: https://www.researchgate.net/profile/Edson-Araujo/publication/353914416_Origem_Formacao_e_Diversidade_dos_Solos_do_Acre/links/61189bae1e95fe241ad18859/Origem-Formacao-e-Diversidade-dos-Solos-do-Acre.pdf (accessed on 24 January 2025).
  24. Duarte, A.F. Climatologia das chuvas e efeitos antrópicos da urbanização na bacia do Rio Acre, Amazônia Ocidental. Bol. Do Obs. Ambient. Alberto Ribeiro Lamego 2017, 11, 199–213. [Google Scholar] [CrossRef]
  25. Tamwing, D.S.; Montefusco C de, L.A.; Serrano, R.O.P.; Mesquita, A.A.; Moreira, J.G.d.V. Characterization of the fluvial regime of the Acre river basin. Res. Soc. Dev. 2021, 10, e93101724461. [Google Scholar] [CrossRef]
  26. Catálogo de Metadados da ANA. Base Hidrográfica Ottocodificada Multiescalas 2017 (BHO 2017). Available online: https://metadados.snirh.gov.br/geonetwork/srv/por/catalog.search#/metadata/0c698205-6b59-48dc-8b5e-a58a5dfcc989 (accessed on 18 April 2024).
  27. Aliança Águas Amazônicas. Purus. Available online: https://pt.aguasamazonicas.org/bacia/bacias-principais/purus (accessed on 15 September 2024).
  28. Ríos-Villamizar, E.A.; Piedade, M.T.; Junk, W.J.; Waichman, A.V. Surface water quality and deforestation of the Purus river basin, Brazilian Amazon. Int. Aquat. Res. 2017, 9, 81–88. [Google Scholar] [CrossRef]
  29. Aliança Águas Amazônicas. Ucayali. Available online: https://pt.aguasamazonicas.org/bacia/bacias-principais/ucayali (accessed on 15 September 2024).
  30. Deng, F.; Rodgers, M.; Xie, S.; Dixon, T.H.; Charbonnier, S.; Gallant, E.A.; Vélez, C.M.L.; Ordoñez, M.; Malservisi, R.; Voss, N.K. High-resolution DEM generation from spaceborne and terrestrial remote sensing data for improved volcano hazard assessment—A case study at Nevado del Ruiz, Colombia. Remote Sens. Environ. 2019, 233, 111348–111452. [Google Scholar] [CrossRef]
  31. Xavier, A.C.; Scanlon, B.R.; King, C.W.; Alves, A.I. New improved Brazilian daily weather gridded data (1961–2020). Int. J. Climatol. 2022, 42, 8390–8404. [Google Scholar] [CrossRef]
  32. Melo, K.d.S.; Delgado, R.C.; Pereira, M.G.; Ortega, G.P. The Consequences of Climate Change in the Brazilian Western Amazon: A New Proposal for a Fire Risk Model in Rio Branco, Acre. Forests 2024, 15, 211. [Google Scholar] [CrossRef]
  33. Giglio, L.; Schroeder, W.; Hall, J.V.; Justice, C.O. MODIS Collection 6 Active Fire Product User’s Guide Revision C; Department of Geographical Sciences, University of Maryland: College Park, MD, USA, 2020; pp. 1–63. [Google Scholar]
  34. Didan, K. MODIS/Terra Vegetation Indices Monthly L3 Global 0.05Deg CMG V061 MOD13C2; NASA EOSDIS Land Processes Distributed Active Archive Center: Sioux Falls, SD, USA, 2021. [Google Scholar] [CrossRef]
  35. Mann, H.B. Nonparametric tests against trend. Econometrica 1945, 13, 245–259. [Google Scholar] [CrossRef]
  36. Kendall, K. Thin-film peeling-the elastic term. J. Phys. D Appl. Phys. 1975, 8, 1449–1452. [Google Scholar] [CrossRef]
  37. Hongyu, K.; Sandanielo, V.L.M.; de Oliveira Junior, G.J. Análise de Componentes Principais: Resumo Teórico, Aplicação e Interpretação. E&S Eng. Sci. 2016, 5, 83–90. [Google Scholar] [CrossRef]
  38. Taveira, M.K.; Costa, J.S.D.; Melhorança Filho, A.L.; Nascimento, L.D.O.; Serrano, R.O.P.; Mesquita, A.A.; Moreira, J.G.D.V. Rain Probability for the City of Rio Branco in the Western Brazilian Amazon. Rev. Bras. Meteorol. 2024, 38, e38230037. [Google Scholar] [CrossRef]
  39. da Silva Abel, E.L.; Delgado, R.C.; Vilanova, R.S.; Teodoro, P.E.; da Silva Junior, C.A.; Abreu, M.C.; Silva, G.F.C. Environmental dynamics of the Juruá watershed in the Amazon. Environ. Dev. Sustain. 2020, 23, 6769–6785. [Google Scholar] [CrossRef]
  40. Flores, B.M.; Montoya, E.; Sakschewski, B.; Nascimento, N.; Staal, A.; Betts, R.A.; Levis, C.; Lapola, D.M.; Esquível-Muelbert, A.; Jakovac, C.; et al. Critical transitions in the Amazon forest system. Nature 2024, 626, 555–564. [Google Scholar] [CrossRef] [PubMed]
  41. Mantovani, J.; Alcântara, E.; Marengo, J.A.; Londe, L.; Park, E.; Cunha, A.P.; Tomasella, J. Flood Risk Mapping during the Extreme February 2021 Flood in the Juruá River, Western Brazilian Amazonia, State of Acre. Sustainability 2024, 16, 2999. [Google Scholar] [CrossRef]
  42. Donat, M.G.; Angélil, O.; Ukkola, A.M. Intensification of precipitation extremes in the world’s humid and water-limited regions. Environ. Res. Lett. 2019, 14, 065003. [Google Scholar] [CrossRef]
  43. Zhang, Q.; Huai, B.; Ding, M.; Sun, W.; Liu, W.; Yan, J.; Zhao, S.; Wang, Y.; Wang, Y.; Wang, L.; et al. Projections of Greenland climate change from CMIP5 and CMIP6. Glob. Planet. Change 2024, 232, 104340. [Google Scholar] [CrossRef]
  44. Ibrahim, N.A.; Alwi, S.R.W.; Abd Manan, Z.; Mustaffa, A.A.; Kidam, K. Climate change impact on solar system in Malaysia: Techno-economic analysis. Renew Sustain Energy Rev. 2024, 189, 113901. [Google Scholar] [CrossRef]
  45. IPCC. Climate Change 2021: The Physical Science Basis. 2021. Available online: https://www.ipcc.ch/report/ar6/wg1/#FullReport (accessed on 9 September 2024).
  46. Perigolo, N.A.; de Medeiros, M.B.; Simon, M.F. Vegetation types of the upper Madeira River in Rondônia, Brazil. Brittonia 2017, 69, 423–446. [Google Scholar] [CrossRef]
  47. de Faria, B.L.; Brando, P.M.; Macedo, M.N.; Panday, P.K.; Soares-Filho, B.S.; Coe, M.T. Current and future patterns of fire-induced forest degradation in Amazonia. Environ. Res. Lett. 2017, 12, 095005. [Google Scholar] [CrossRef]
  48. Syphard, A.D.; Velazco, S.J.E.; Rose, M.B.; Franklin, J.; Regan, H.M. The importance of geography in forecasting future fire patterns under climate change. Proc. Natl. Acad. Sci. USA 2024, 121, e2310076121. [Google Scholar] [CrossRef]
  49. Ferreira, I.J.; Campanharo, W.A.; Barbosa, M.L.; Silva, S.S.D.; Selaya, G.; Aragão, L.E.; Anderson, L.O. Assessment of fire hazard in Southwestern Amazon. Front. For. Glob. Change 2023, 6, 1107417. [Google Scholar] [CrossRef]
  50. Hammond, J.C.; Saavedra, F.A.; Kampf, S.K. Global snow zone maps and trends in snow persistence 2001–2016. Int. J. Climatol. 2018, 38, 4369–4383. [Google Scholar] [CrossRef]
  51. Aranda, F.; Medina, D.; Castro, L.; Ossandón, Á.; Ovalle, R.; Flores, R.P.; Bolaño-Ortiz, T.R. Snow persistence and snow line elevation trends in a snowmelt-driven basin in the central Andes and their correlations with hydroclimatic variables. Remote Sens. 2023, 15, 5556. [Google Scholar] [CrossRef]
  52. Vuille, M.; Carey, M.; Huggel, C.; Buytaert, W.; Rabatel, A.; Jacobsen, D.; Suroco, A.; Villacis, M.; Yarleque, C.; Timm, O.E.; et al. Rapid decline of snow and ice in the tropical Andes–Impacts, uncertainties and challenges ahead. Earth-Sci. Rev. 2018, 176, 195–213. [Google Scholar] [CrossRef]
  53. Cordero, R.R.; Asencio, V.; Feron, S.; Damiani, A.; Llanillo, P.J.; Sepulveda, E.; Jorquera, J.; Carrasco, J.; Casassa, G. Dry-season snow cover losses in the Andes (18°-40°S) driven by changes in large-scale climate modes. Sci. Rep. 2019, 9, 16945. [Google Scholar] [CrossRef]
  54. Escanilla-Minchel, R.; Alcayaga, H.; Soto-Alvarez, M.; Kinnard, C.; Urrutia, R. Evaluation of the impact of climate change on runoff generation in an andean glacier watershed. Water 2020, 12, 3547. [Google Scholar] [CrossRef]
  55. Calizaya, E.; Laqui, W.; Sardón, S.; Calizaya, F.; Cuentas, O.; Cahuana, J.; Mindani, C.; Huacani, W. Snow cover temporal dynamic using MODIS product, and its relationship with precipitation and temperature in the Tropical Andean Glaciers in the Alto Santa sub-basin (Peru). Sustainability 2023, 15, 7610. [Google Scholar] [CrossRef]
  56. Jacquemart, M.; Weber, S.; Chiarle, M.; Chmiel, M.; Cicoira, A.; Corona, C.; Eckert, N.; Gaume, J.; Giacona, F.; Hirschberg, J.; et al. Detecting the impact of climate change on alpine mass movements in observational records from the European Alps. Earth-Sci. Rev. 2024, 258, 104886. [Google Scholar] [CrossRef]
  57. Li, Y.; Cui, Y.F.; Hao, J.S.; Zhang, Z.T.; Wang, H.; Guo, J.; Wang, S.F. Frequency and size change of ice–snow avalanches in the central Himalaya: A case from the Annapurna II glacier. Adv. Clim. Change Res. 2024, 15, 464–475. [Google Scholar] [CrossRef]
  58. Mitterwallner, V.; Steinbauer, M.; Mathes, G.; Walentowitz, A. Global reduction of snow cover in ski areas under climate change. PLoS ONE 2024, 19, e0299735. [Google Scholar] [CrossRef]
Figure 1. Geographical location of the study area, highlighting the hydrographic basins of the Acre, Purus, and Ucayali rivers. The Acre River basin is represented in yellow, including the municipality of Rio Branco, which is highlighted in red. The Acre River, the main component of the basin, is marked in purple. The Purus River basin is displayed in light blue, while the Ucayali River basin, located in Peru, is shown in dark blue, emphasizing its climatic and hydrological connection to the other basins. The gray areas delineate the state of Acre and its neighboring regions, with black borders representing the political boundaries between states and countries. The inset in the lower right corner provides a broader geographical context, locating the study area within Brazil and South America.
Atmosphere 16 00249 g001
Figure 2. Delimitation of the study area and variables analyzed in the Acre, Purus, and Ucayali river basins. (A) Distribution of precipitation data collection points in the Acre River basin, indicated by black circles along the main river course. (B) Representation of the Digital Elevation Model (DEM) for the Acre River basin, aiming to correlate altitudes with climatic variables. (C) Study area for air temperature data in the Acre River basin, with evenly distributed collection points. (D) Spatial delimitation for fire hotspot analysis, highlighted by a red border covering the entire Acre River basin. (E) Study area for the Enhanced Vegetation Index (EVI) in the Acre River basin, depicted in dark green tones. (F) Delimitation of the study area for snow cover analysis, encompassing part of the Purus River basin and the entire Ucayali River basin, shown in light blue and dark blue tones, respectively.
Atmosphere 16 00249 g002
Figure 3. Distribution of the 31 data extraction points along the Acre River basin.
Atmosphere 16 00249 g003
Figure 4. Methodological flowchart summarizing the research process, from study area identification (Acre, Purus, and Ucayali basins) to data acquisition (precipitation, fire foci, vegetation, snow cover), preprocessing, statistical analysis (Mann–Kendall, PCA), and synthesis of results and recommendations.
Atmosphere 16 00249 g004
Figure 5. Mann–Kendall test values for rainfall data along the Acre River basin. In the legend, (Z−) indicates reduction, (Z−)* indicates statistically significant reduction, (Z+) indicates increase, (Z+)* indicates statistically significant increase, and (Z=) indicates neutrality.
Atmosphere 16 00249 g005
Figure 6. Regression analysis of data observed in the three portions of the Acre River basin.
Atmosphere 16 00249 g006
Figure 7. Snow cover percentages from 2001 to 2023 by month.
Atmosphere 16 00249 g007
Figure 8. Principal Component Analysis in the highest portion of the Acre River basin.
Atmosphere 16 00249 g008
Figure 9. Principal Component Analysis in the medium portion of the Acre River basin.
Atmosphere 16 00249 g009
Figure 10. Principal Component Analysis in the minimum portion of the Acre River basin.
Atmosphere 16 00249 g010
Table 1. MOD10CM product details.
ParameterDescriptionValues
Snow_Cover_Monthly_CMGAverage monthly snow cover0–100: percent of snow in cell
Adapted from [20].
Table 2. Average altitude (DEM) and rainfall values for the 31 points along the Acre River basin.
PortionPointsAltitude 1Rainfall 2
Highest elevationP31595.25156.72
P2390.00174.45
P5354.50159.04
P6343.75163.41
P9326.25162.39
P8324.25163.79
P3323.25160.73
P1315.50306.61
P7313.50159.94
P4306.50174.17
P10301.75164.42
medium elevationP12299.75159.35
P11291.00155.13
P14271.00160.76
P15264.75134.24
P20253.50149.89
P17247.50144.01
P19243.50139.36
P13236.25154.68
P24230.00154.90
P16228.25160.58
P12299.75159.35
minimum elevationP22224.25144.78
P25202.75154.79
P26189.50160.14
P21188.75147.44
P18185.00134.37
P28162.25156.12
P30160.25159.74
P23146.50157.23
P27146.25154.98
P29137.50162.40
1 Meters (m), 2 Millimeters (mm).
Disclaimer/Publisher’s Note: The statements, opinions and data contained in all publications are solely those of the individual author(s) and contributor(s) and not of MDPI and/or the editor(s). MDPI and/or the editor(s) disclaim responsibility for any injury to people or property resulting from any ideas, methods, instructions or products referred to in the content.

