

Investigating Meteorological Factors Influencing Pollutant Concentrations and Copernicus Atmosphere Monitoring Service (CAMS) Model Forecasts in the Tehran Metropolis


Abstract
:1. Introduction
2. Material and Methods
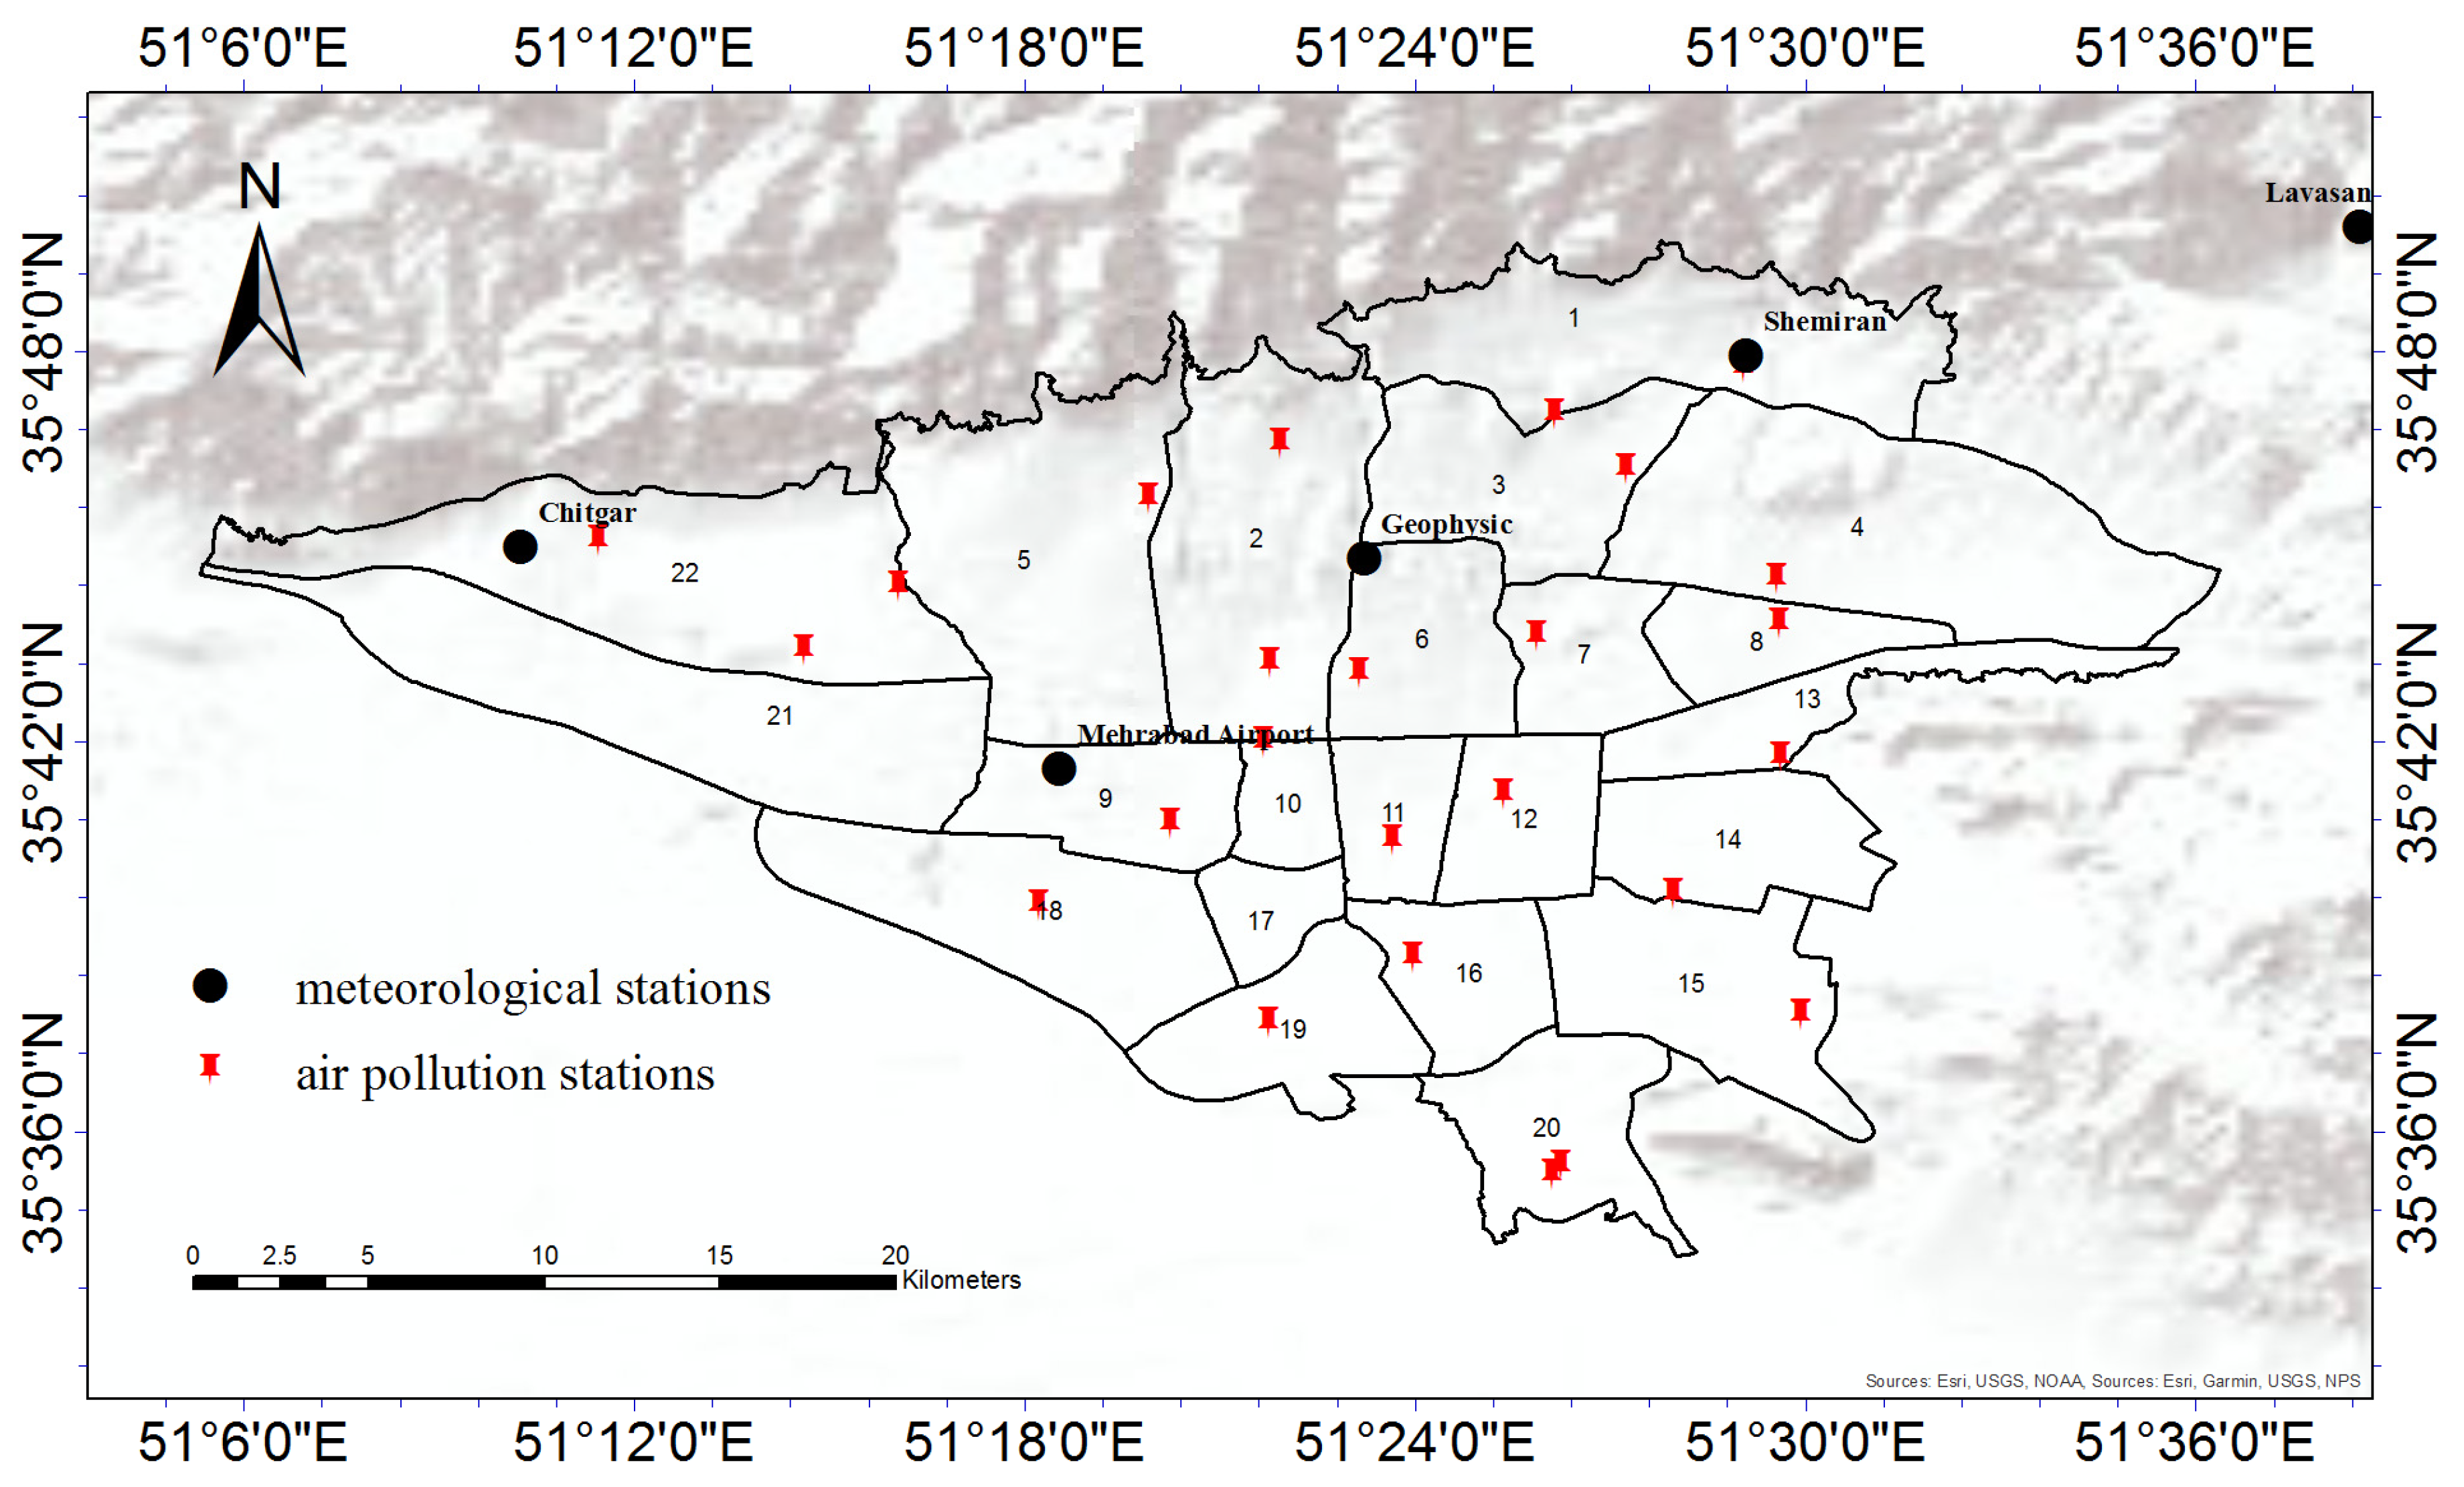
2.1. Study Area
2.2. Data
2.2.1. Meteorological Data
2.2.2. Air Pollution Data
2.3. Methodology
CAMS Model
3. Discussion and Results
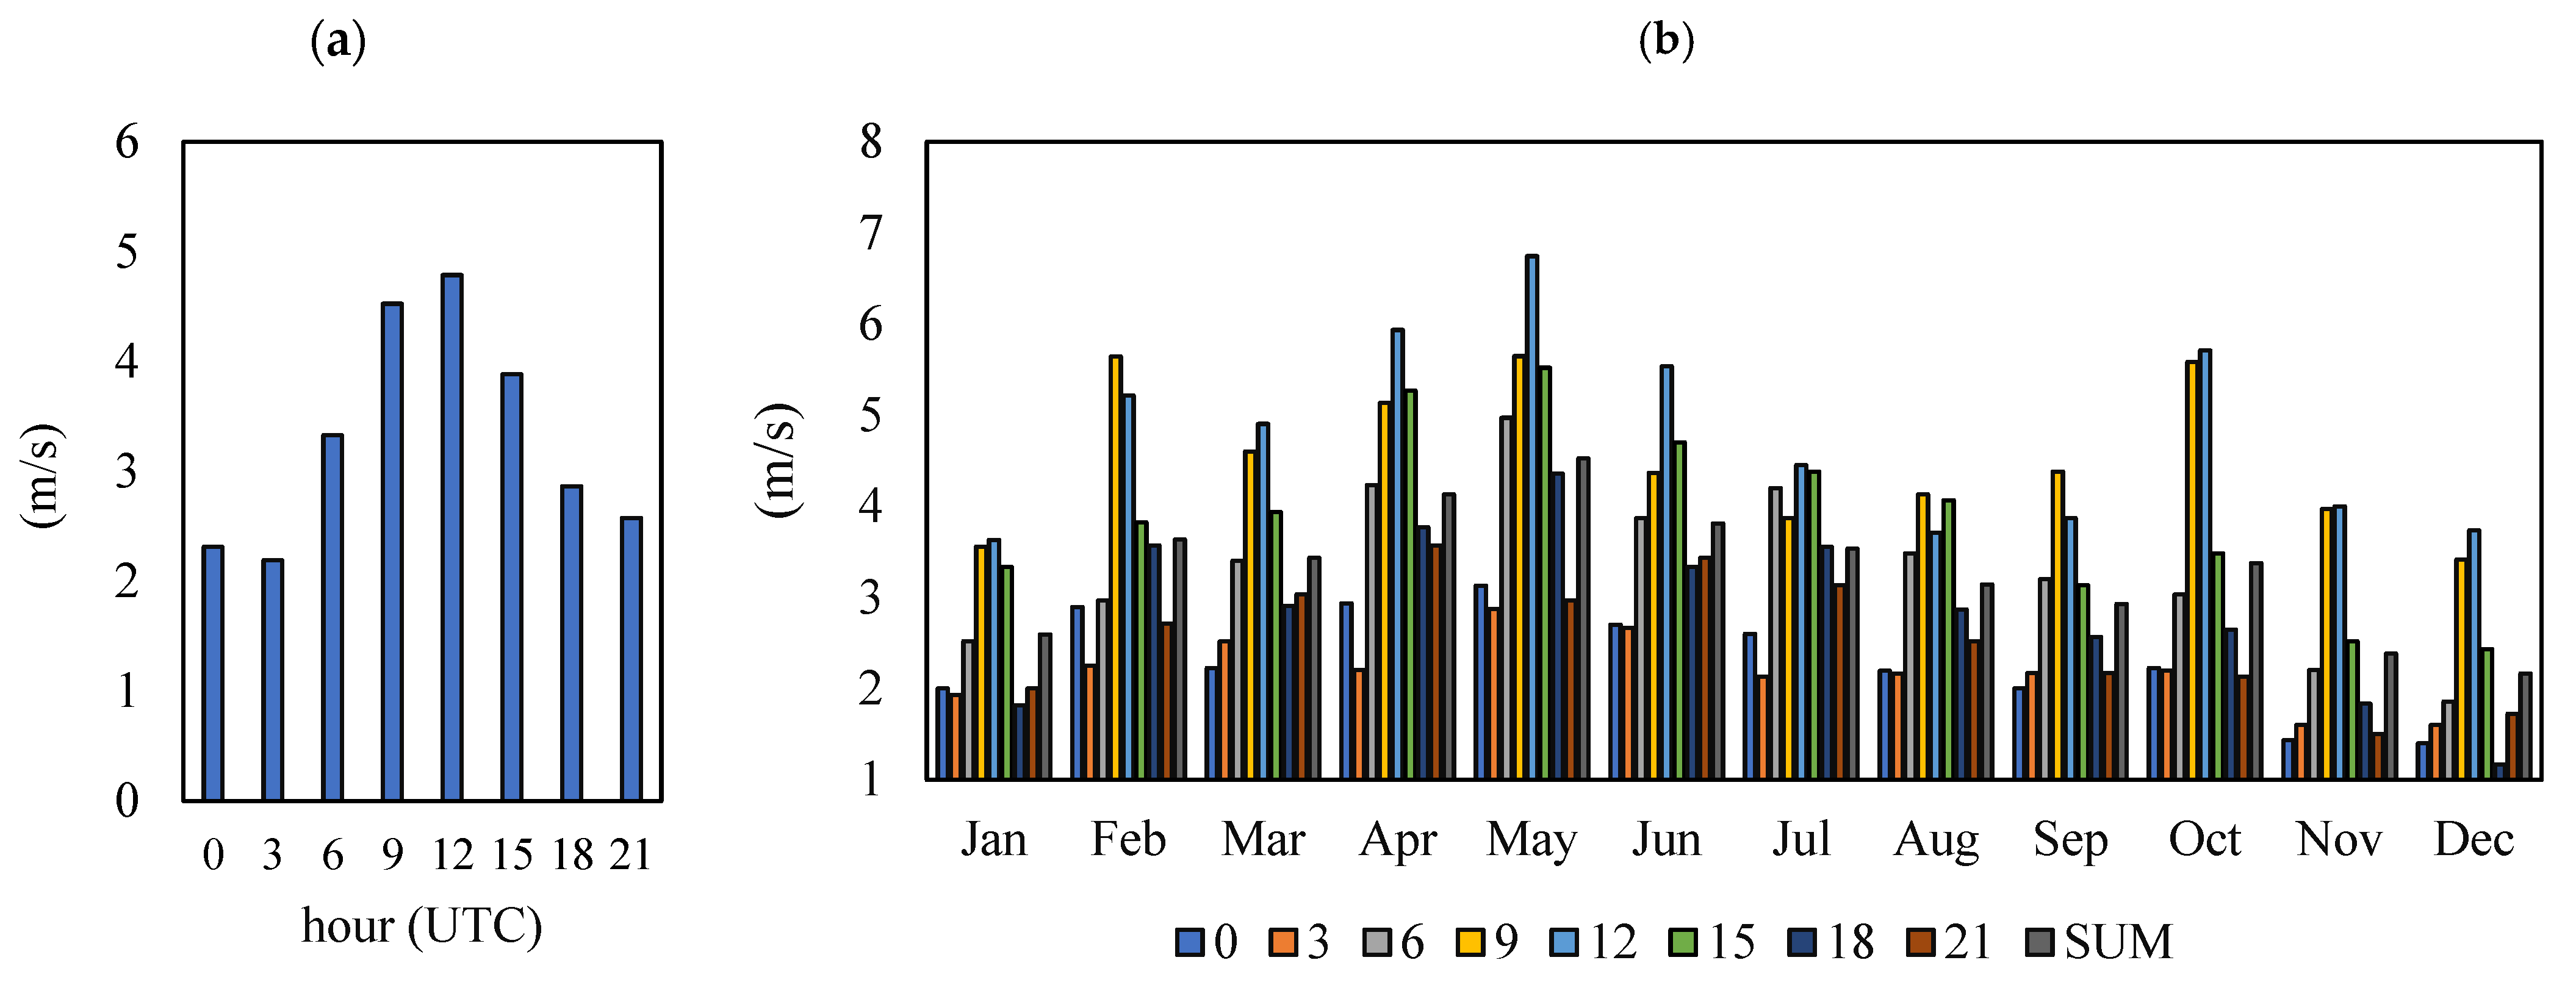
3.1. Mehrabad Airport Synoptic Station Data
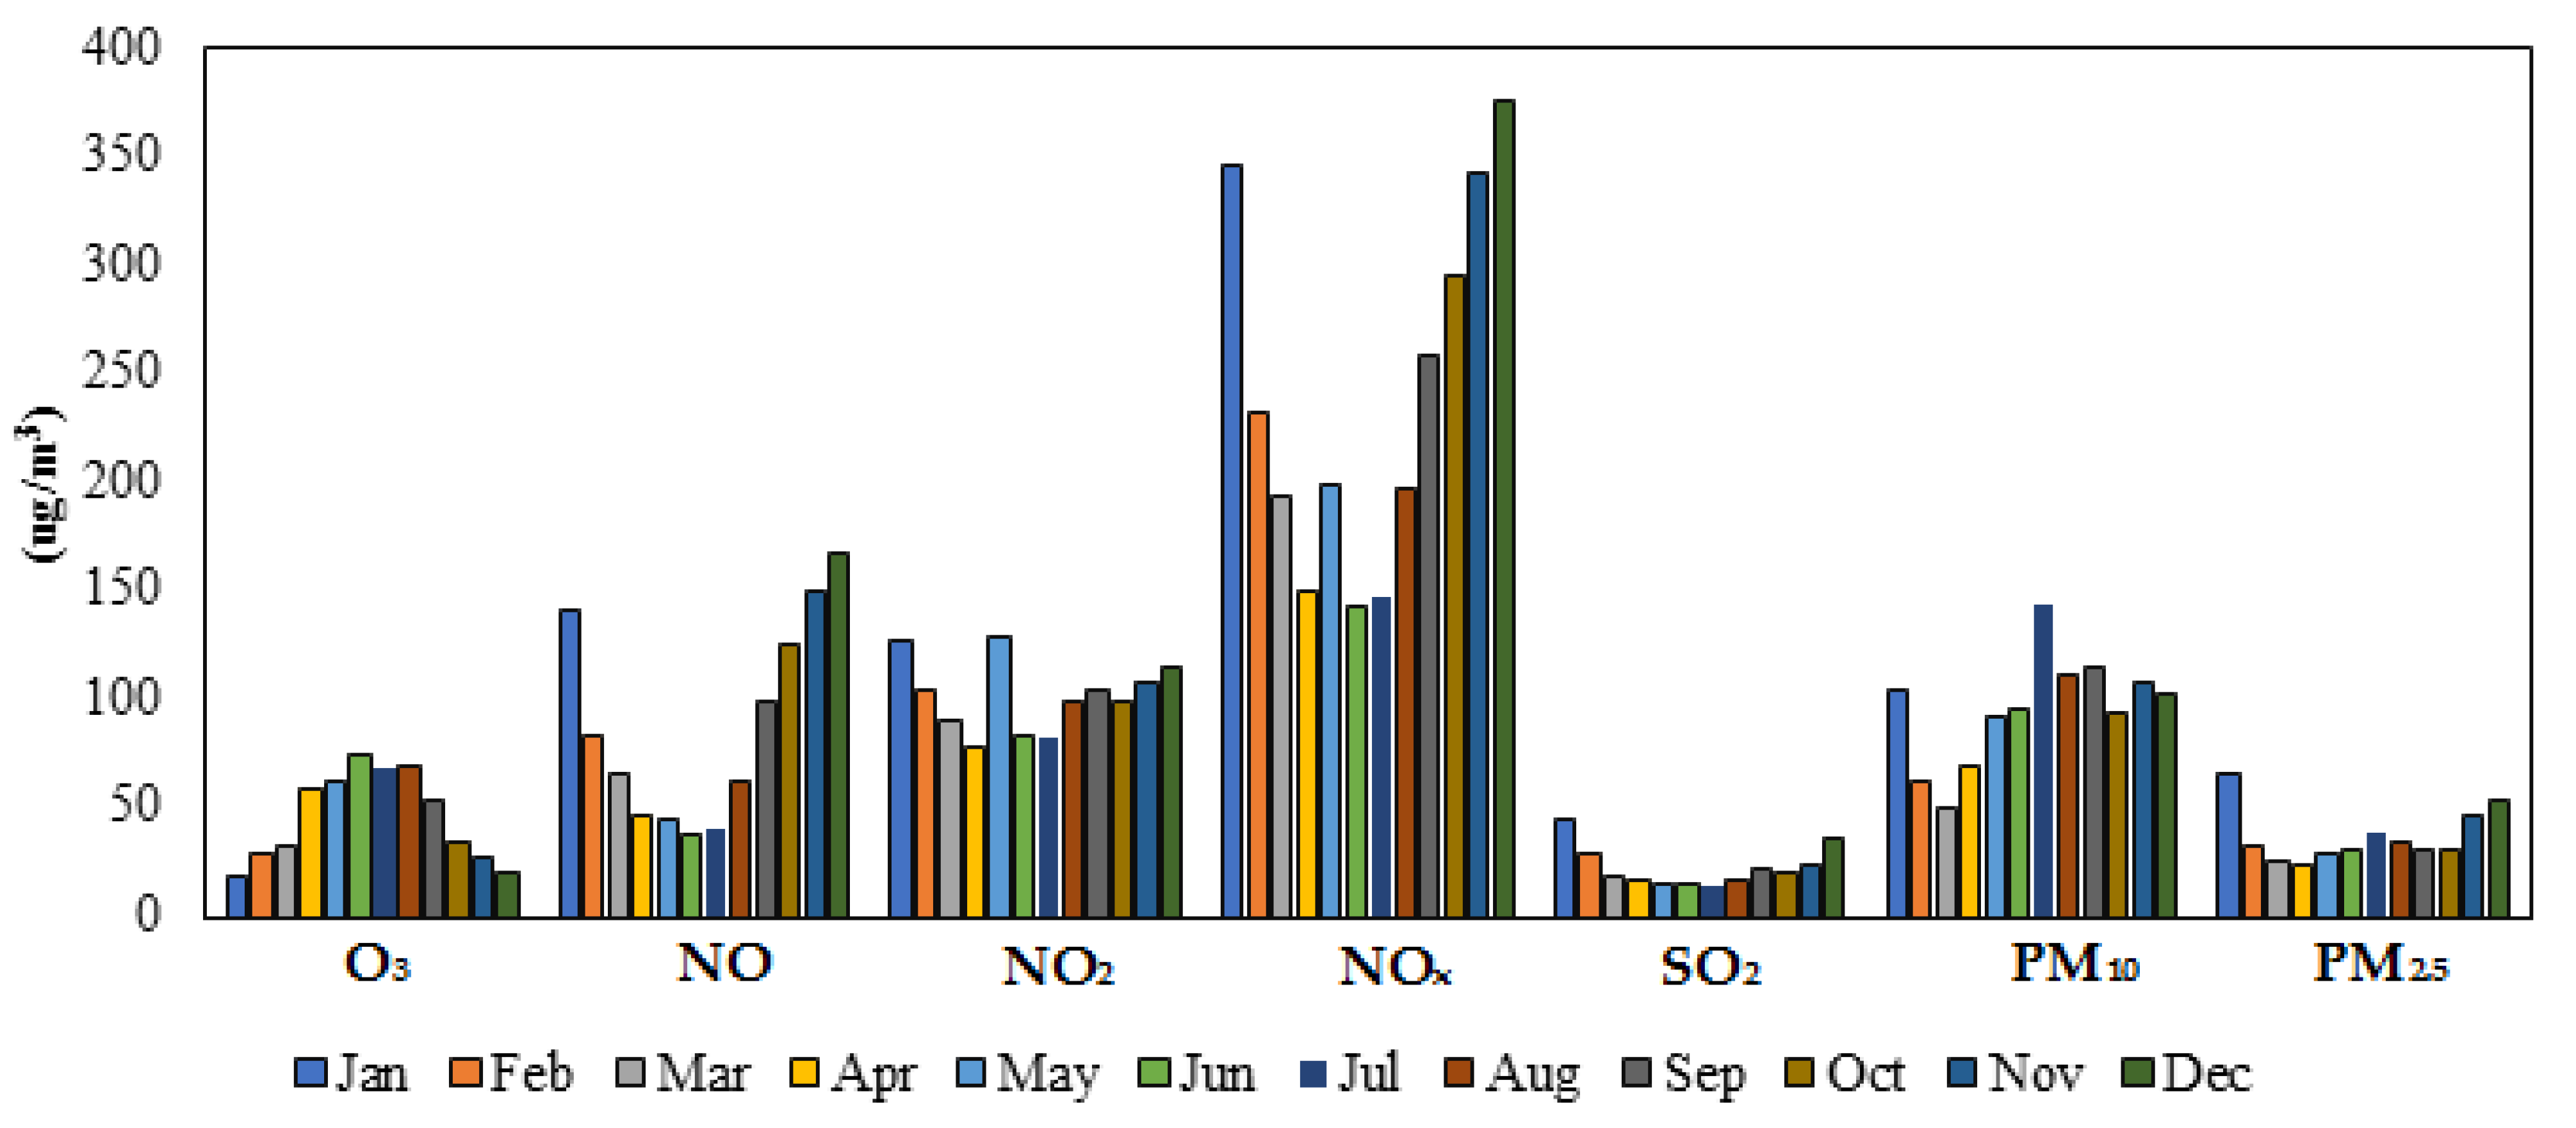
3.2. Shadabad Air Pollution Monitoring Station Data
3.3. The Monthly Average Concentration of Pollutants at Different Hours of the Day
3.3.1. PM10 Pollutant
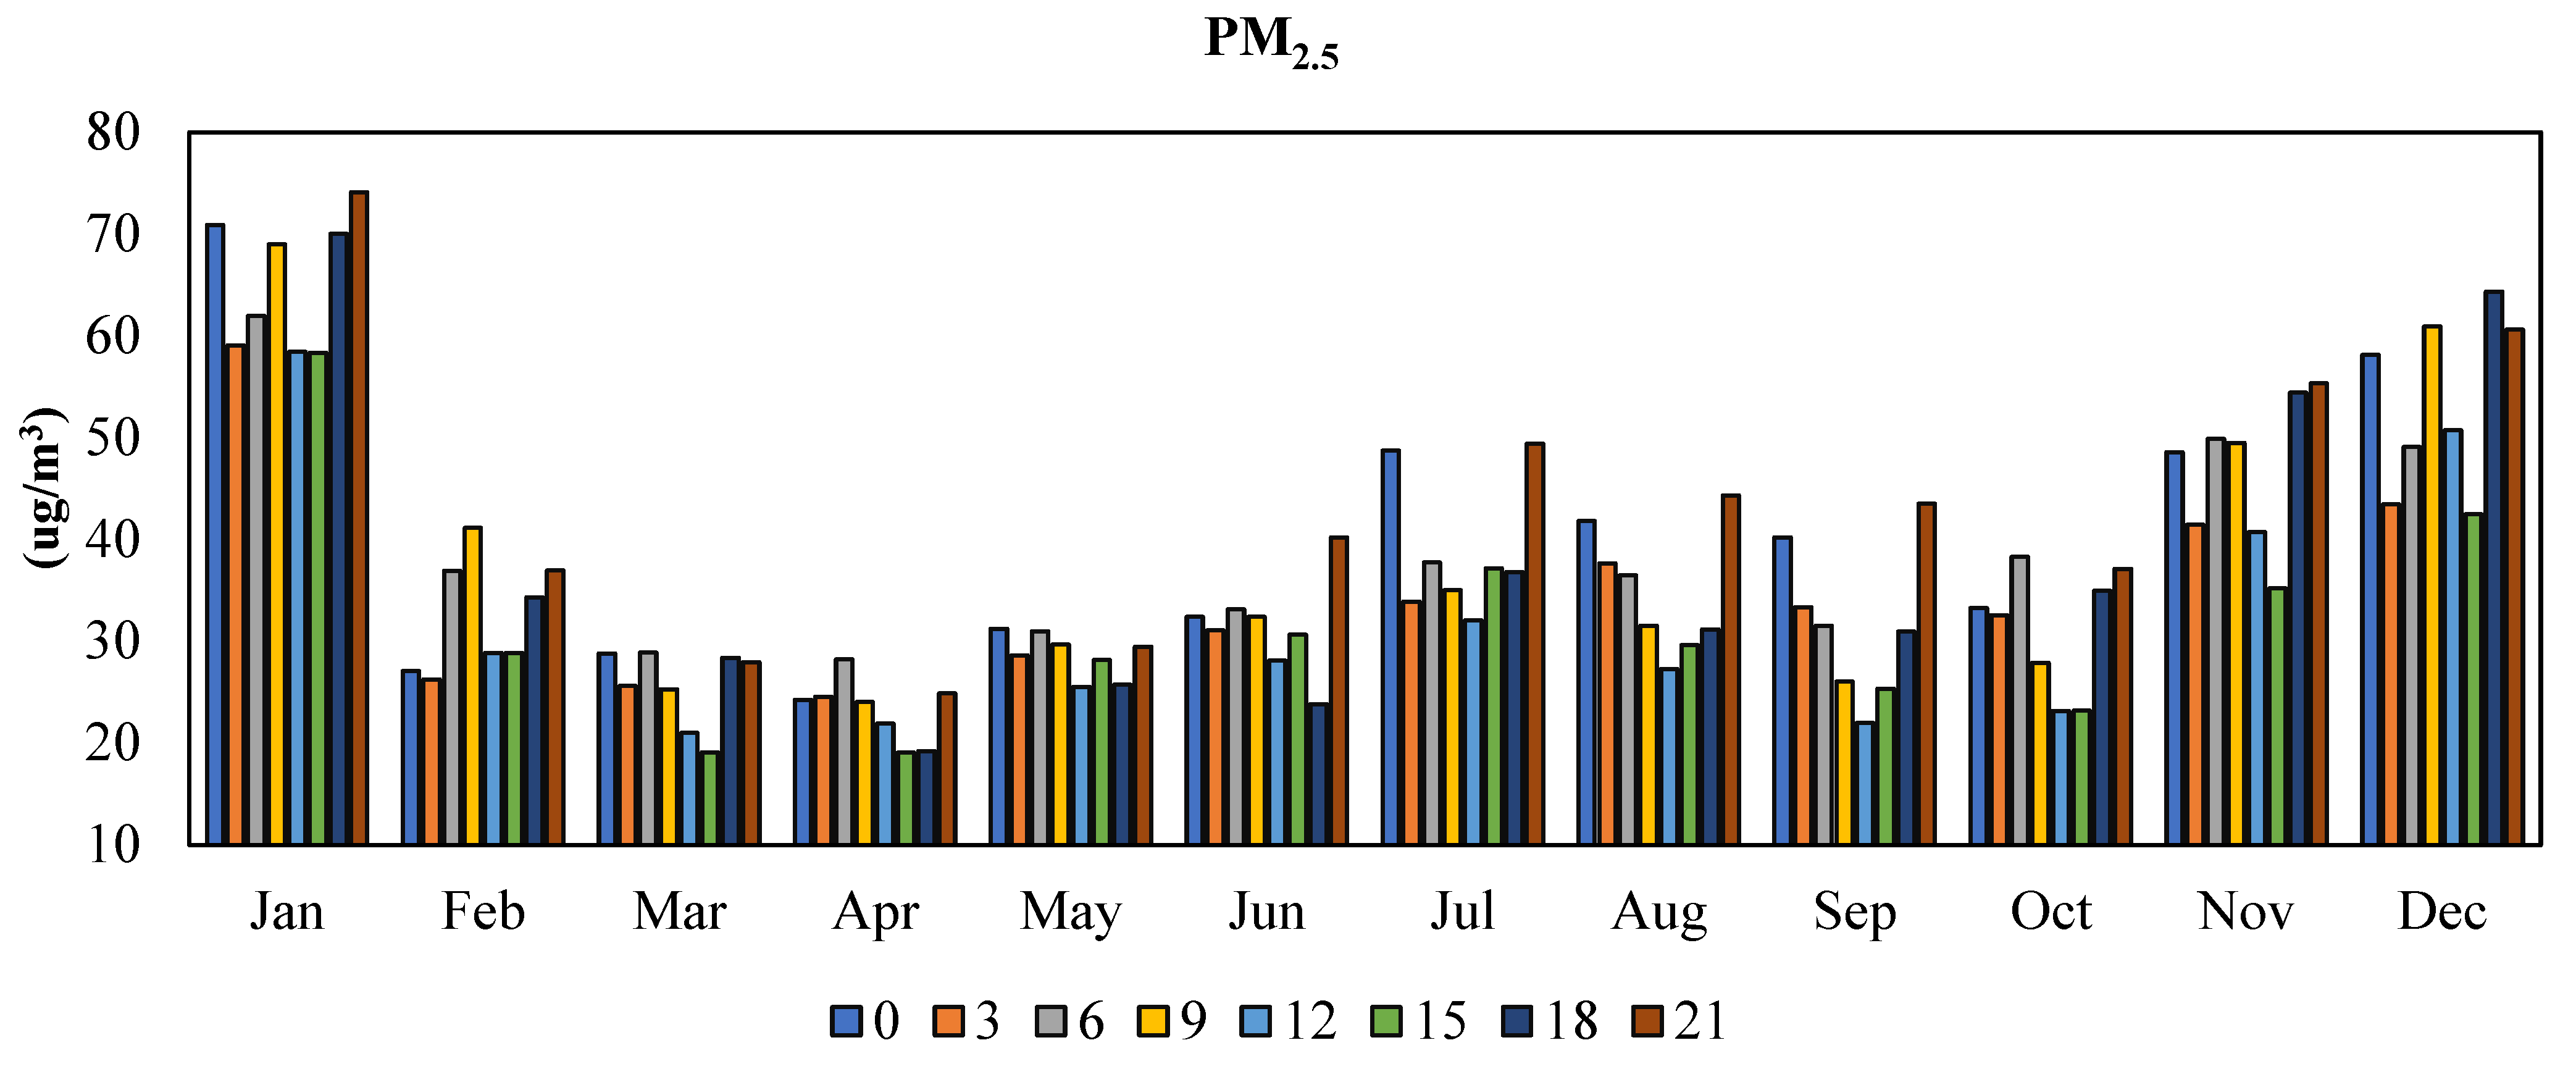
3.3.2. PM2.5 Pollutant
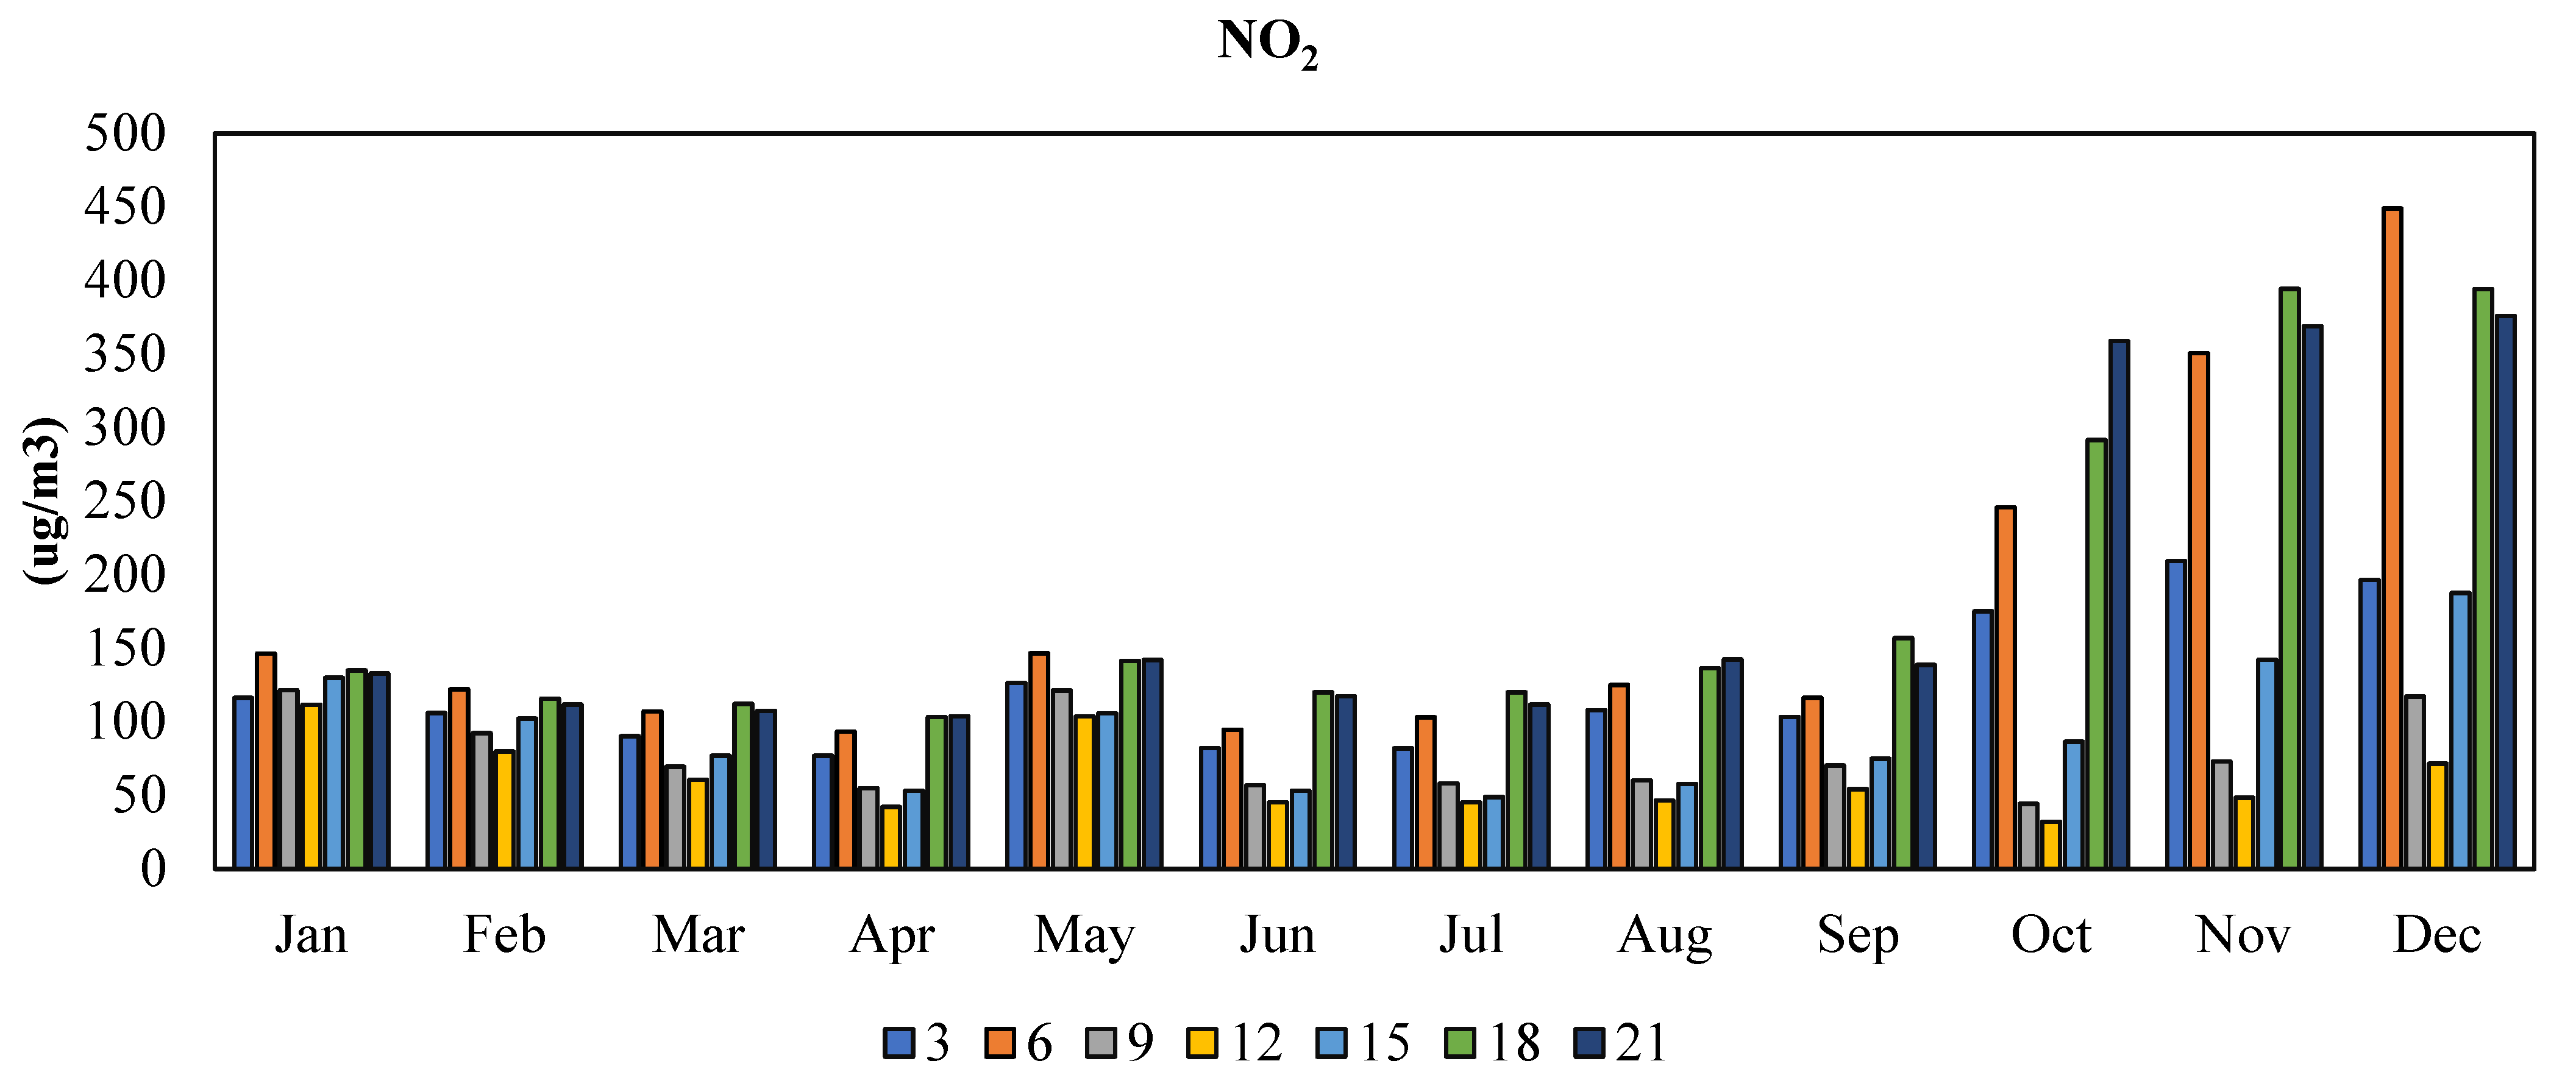
3.3.3. NO2 Pollutant
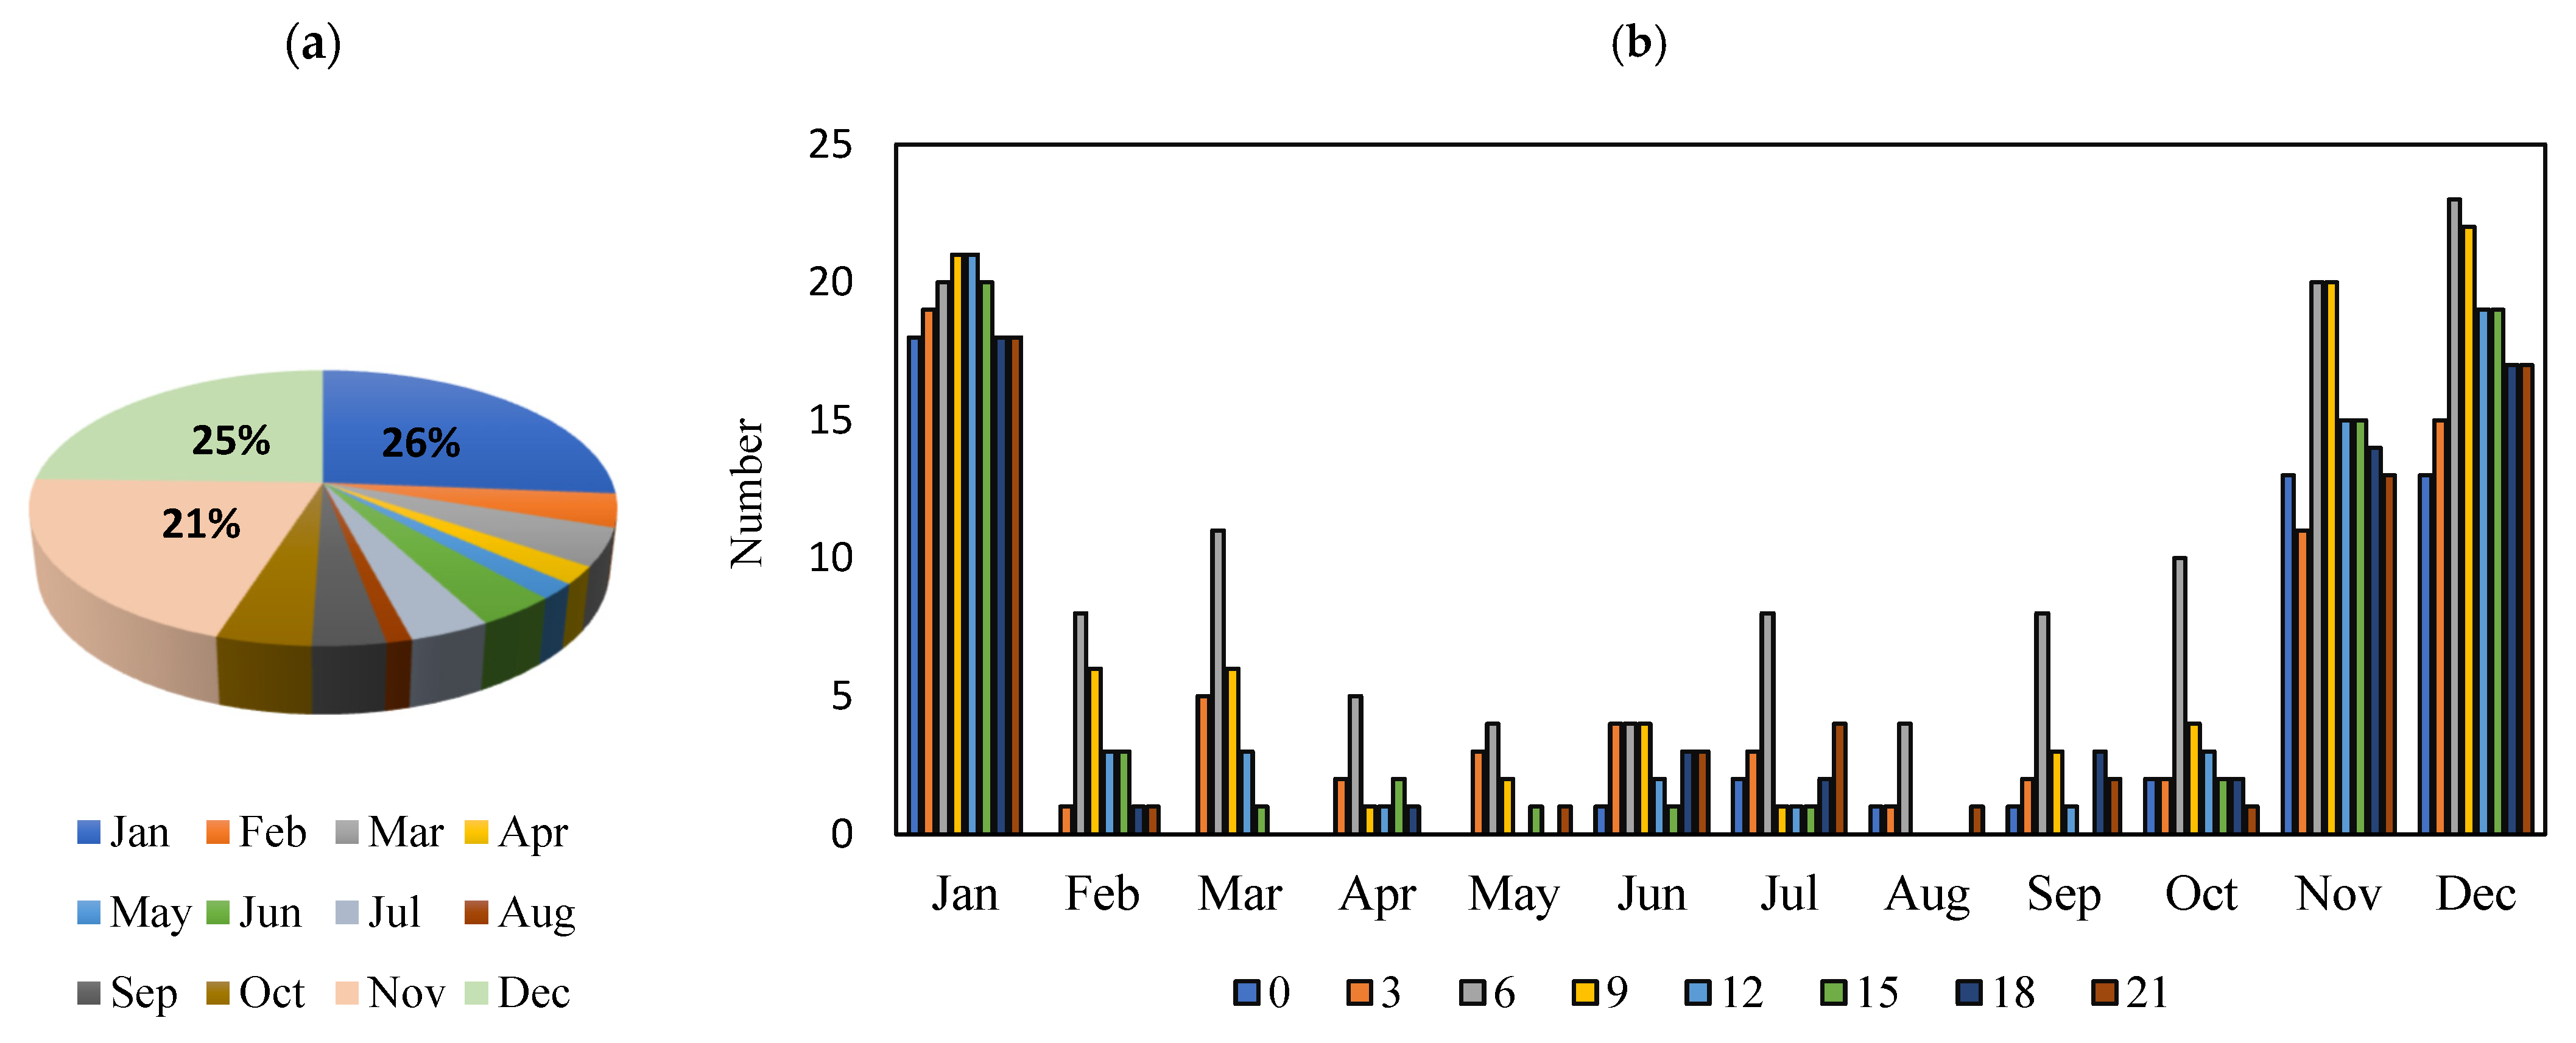
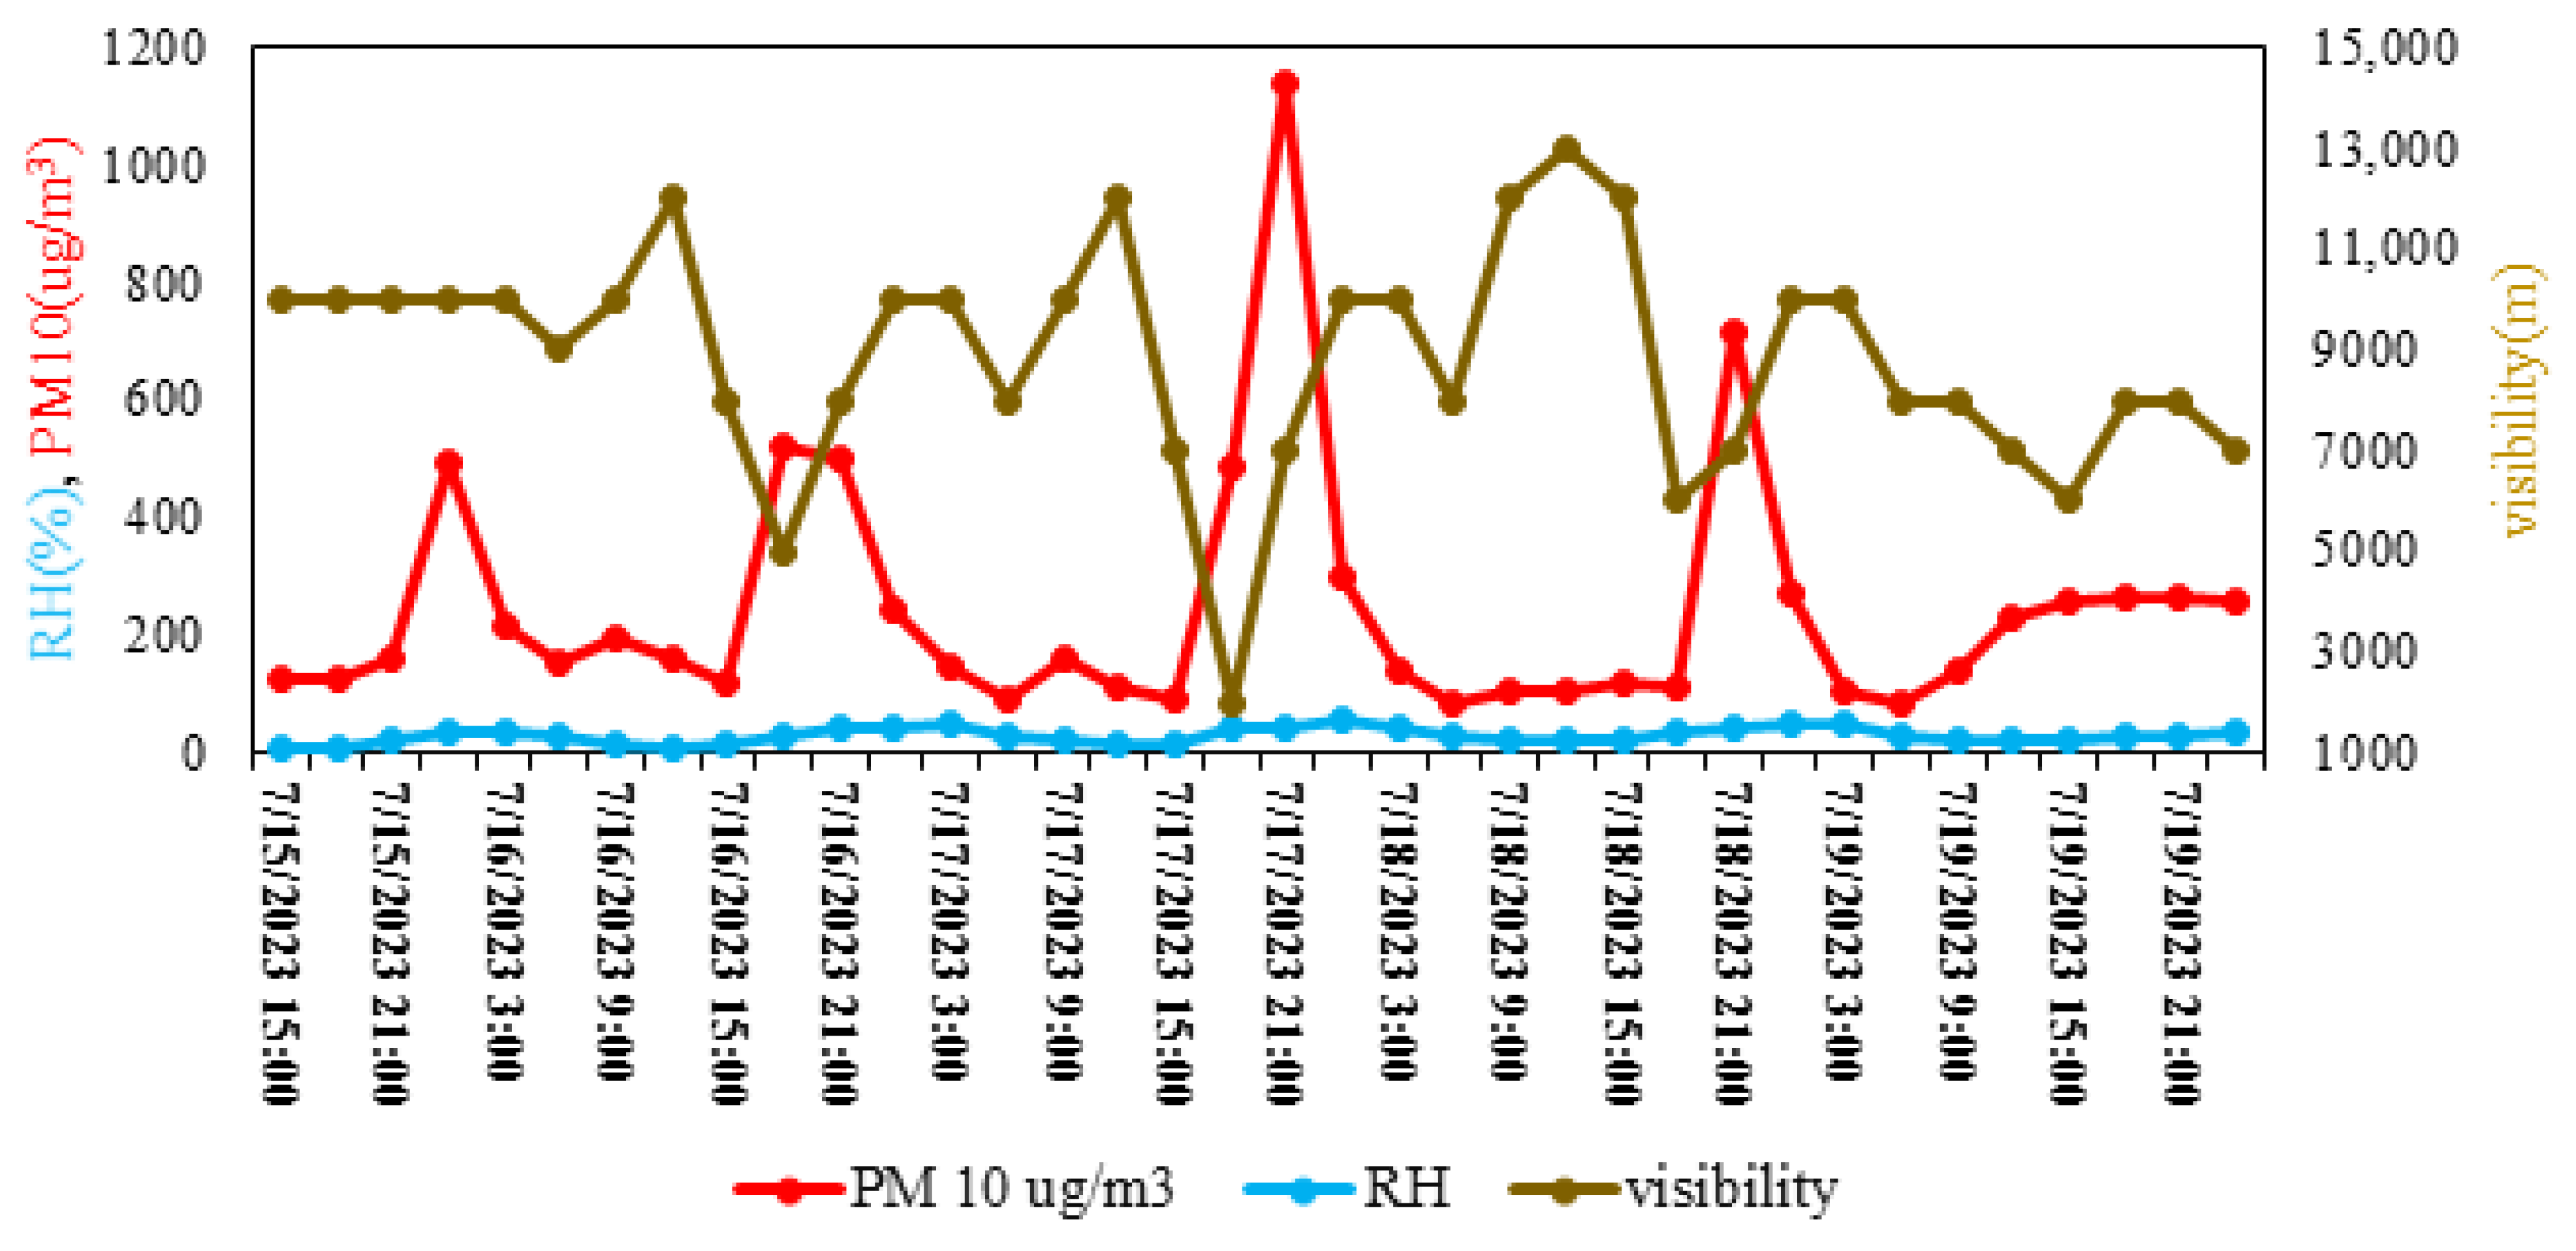
3.4. The Effect of Some Meteorological Quantities and Pollutant Concentrations on the Occurrence of Haze and Horizontal Visibility Reduction
3.5. Monthly Average Concentrations of Pollutants in the City of Tehran
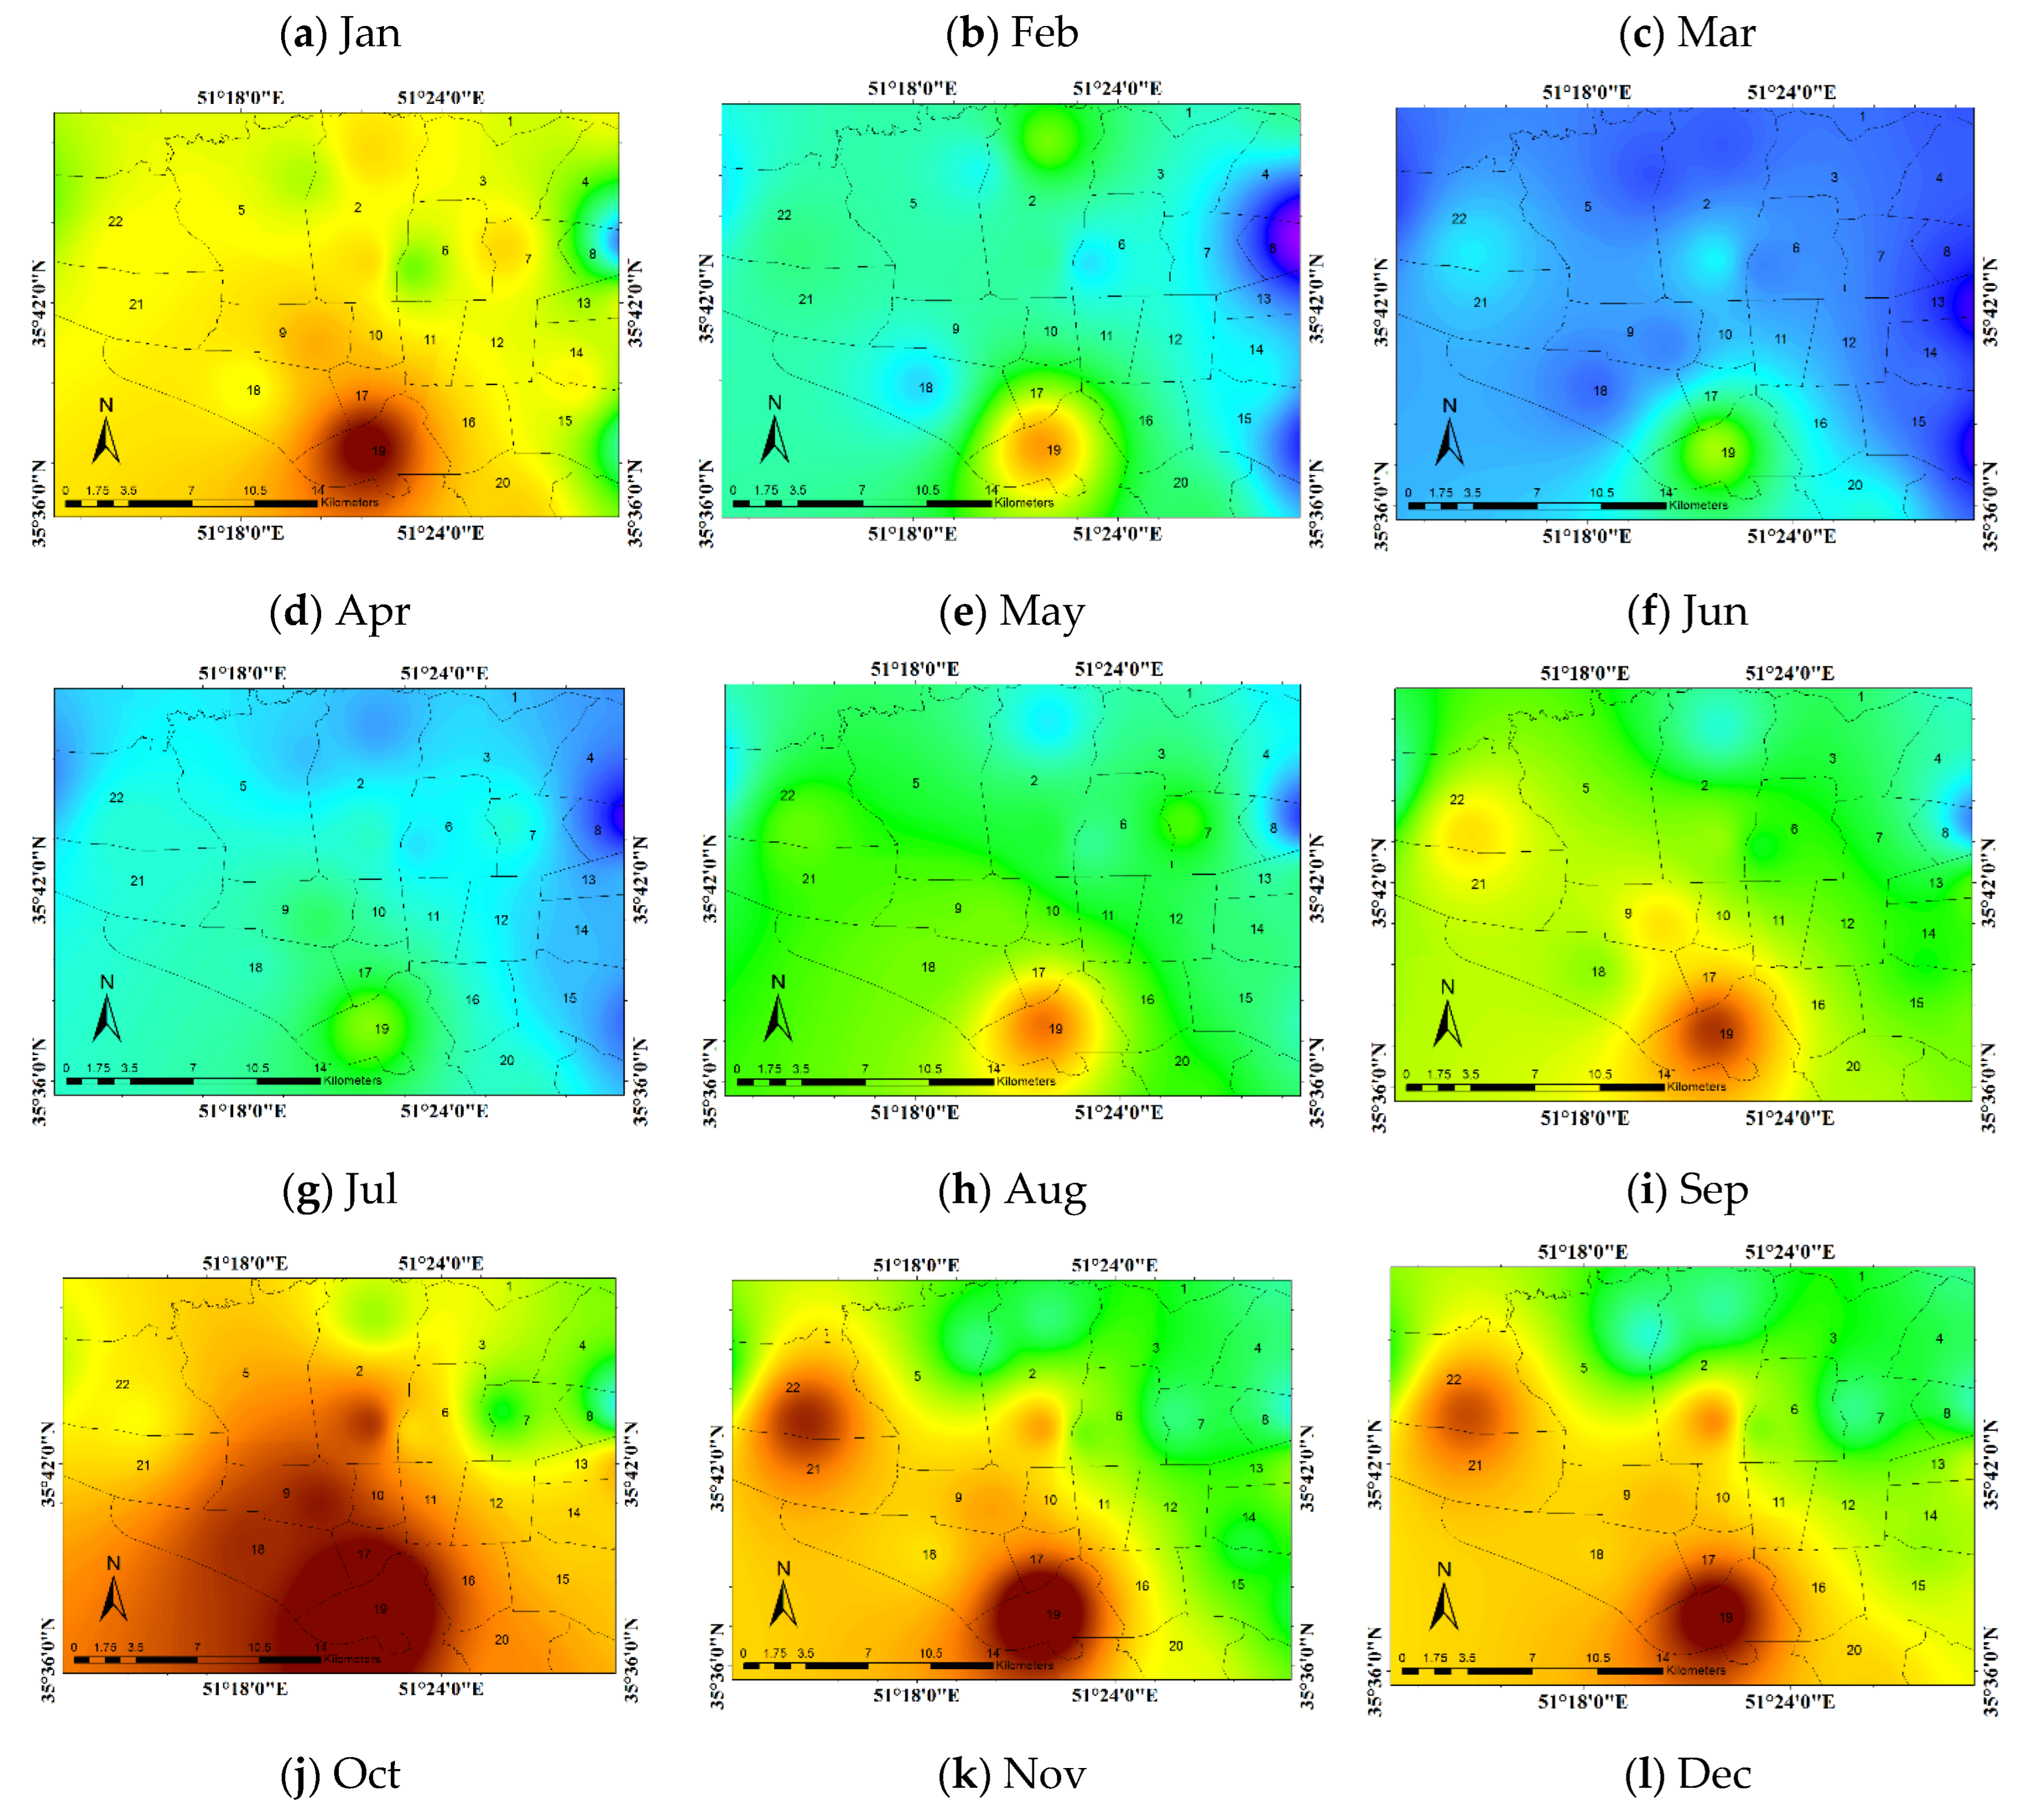
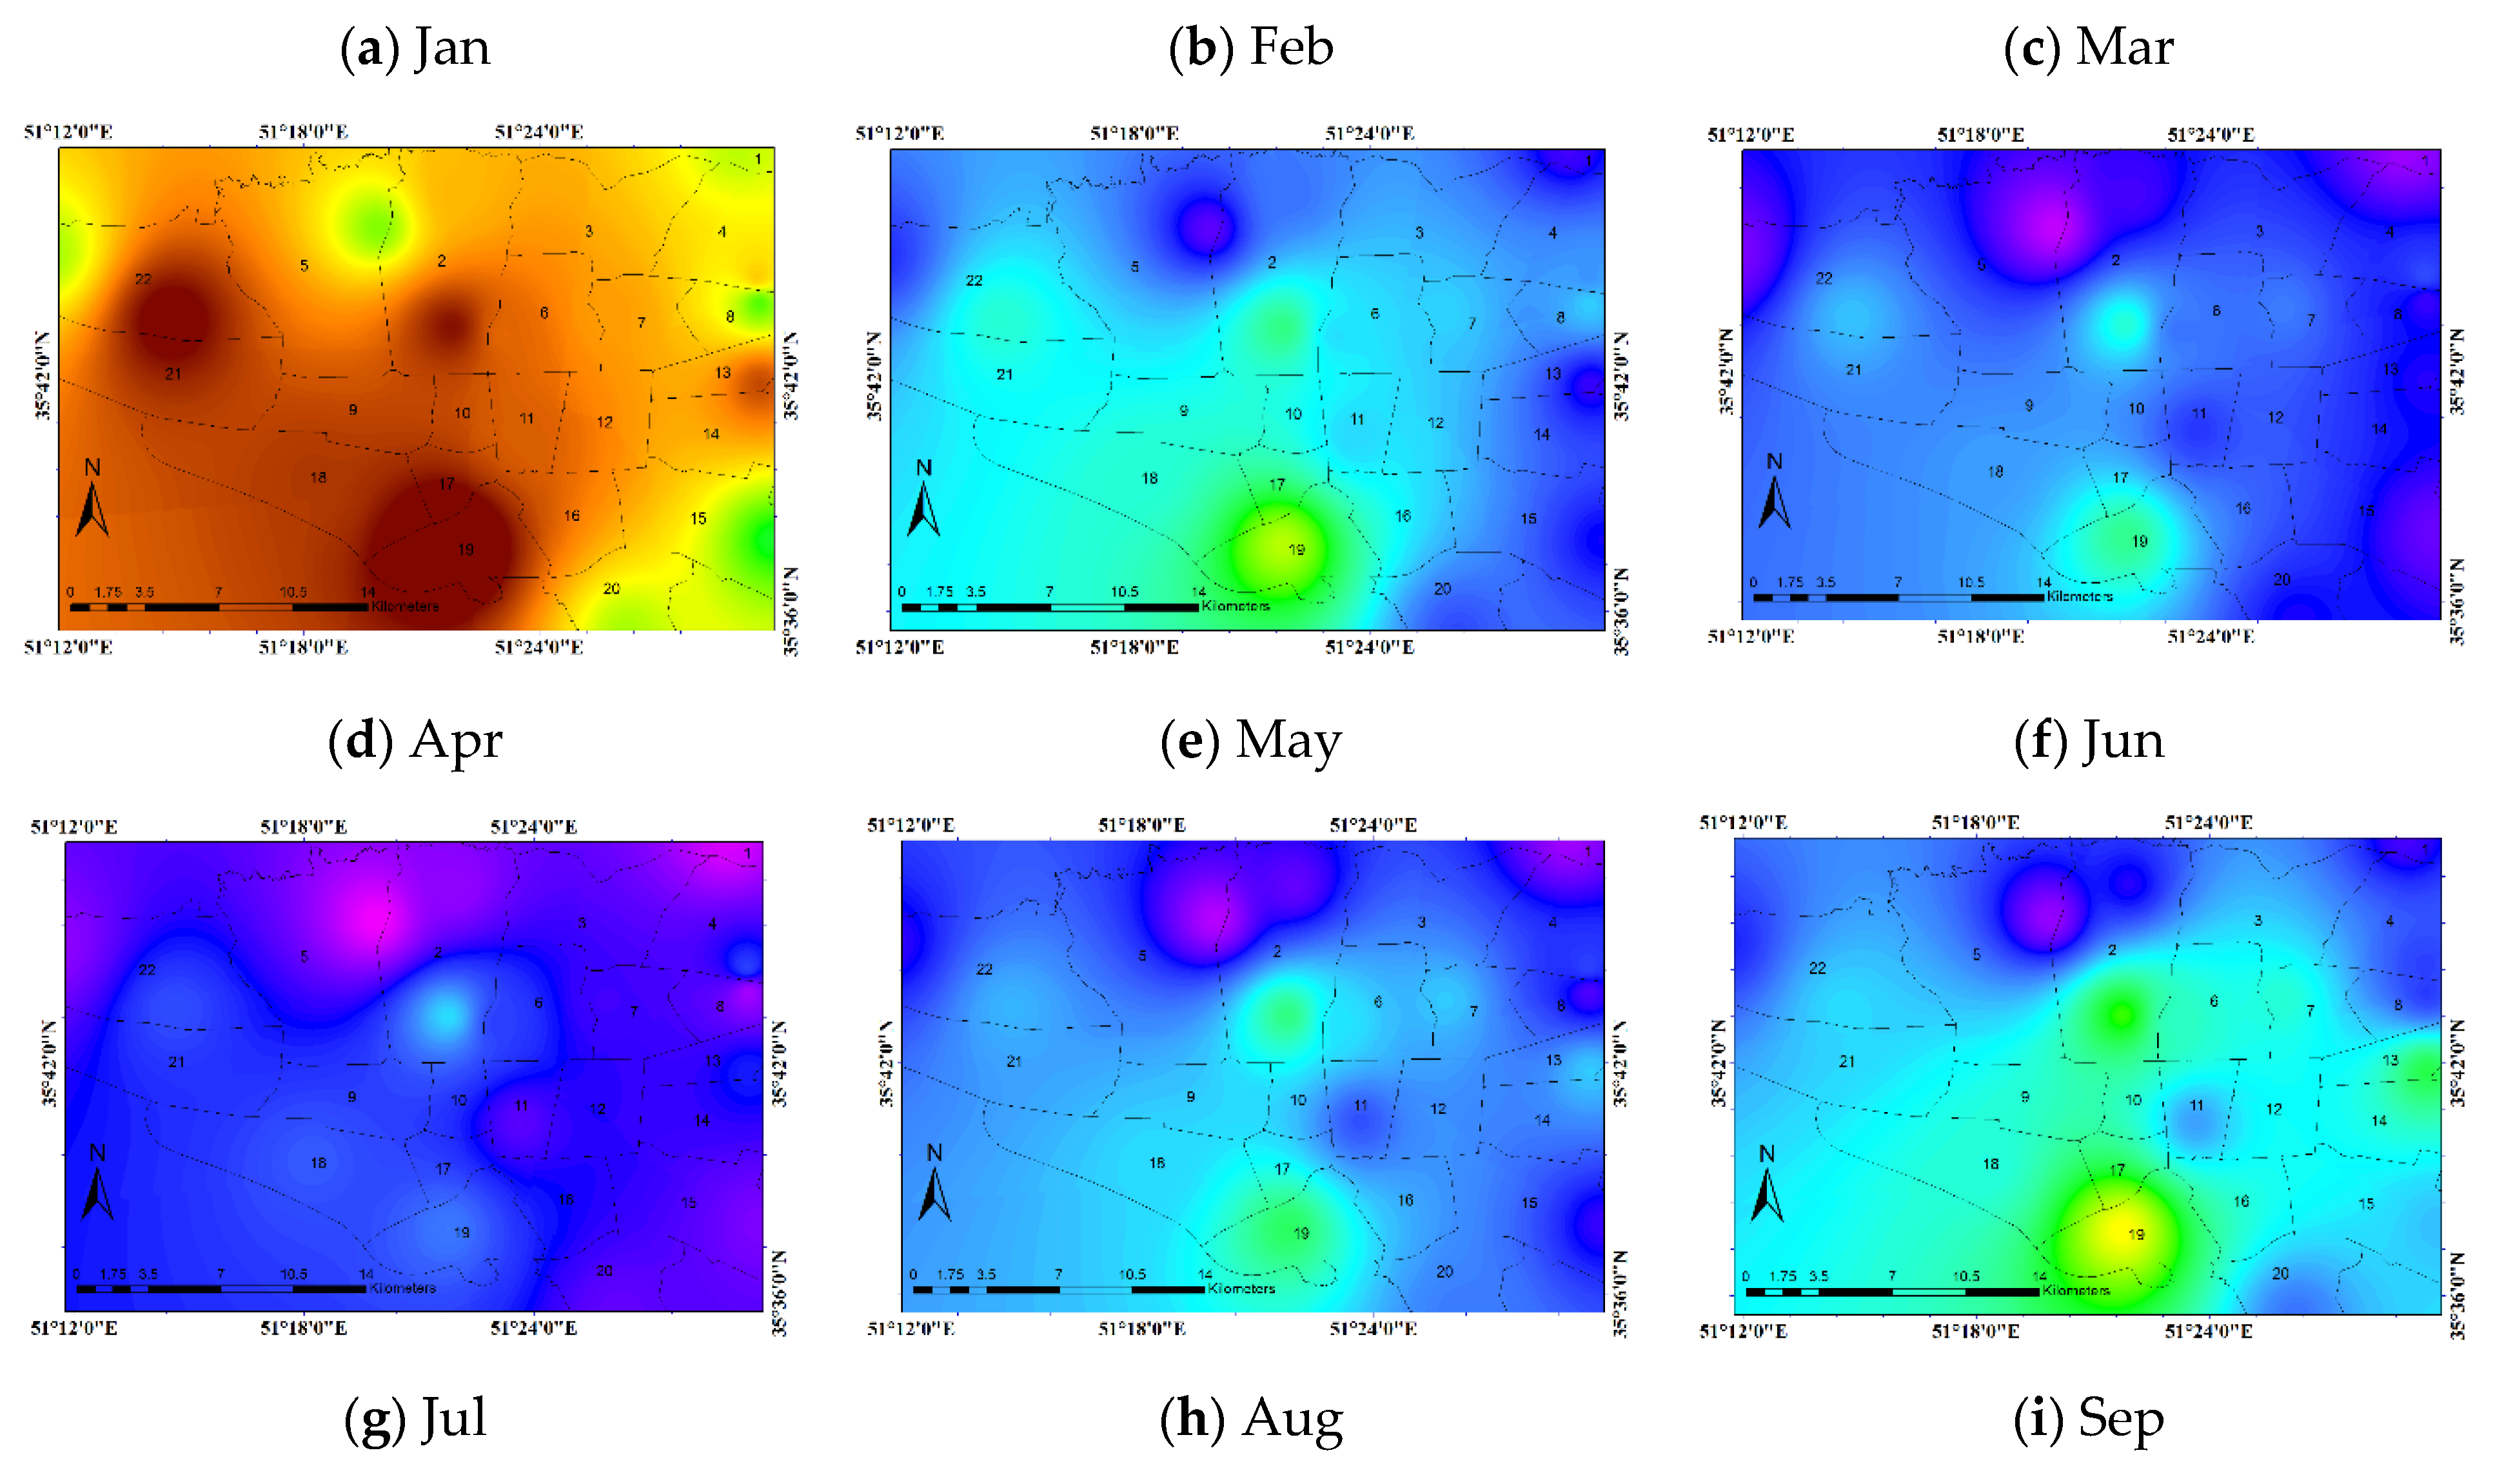
3.5.1. PM10 Pollutant
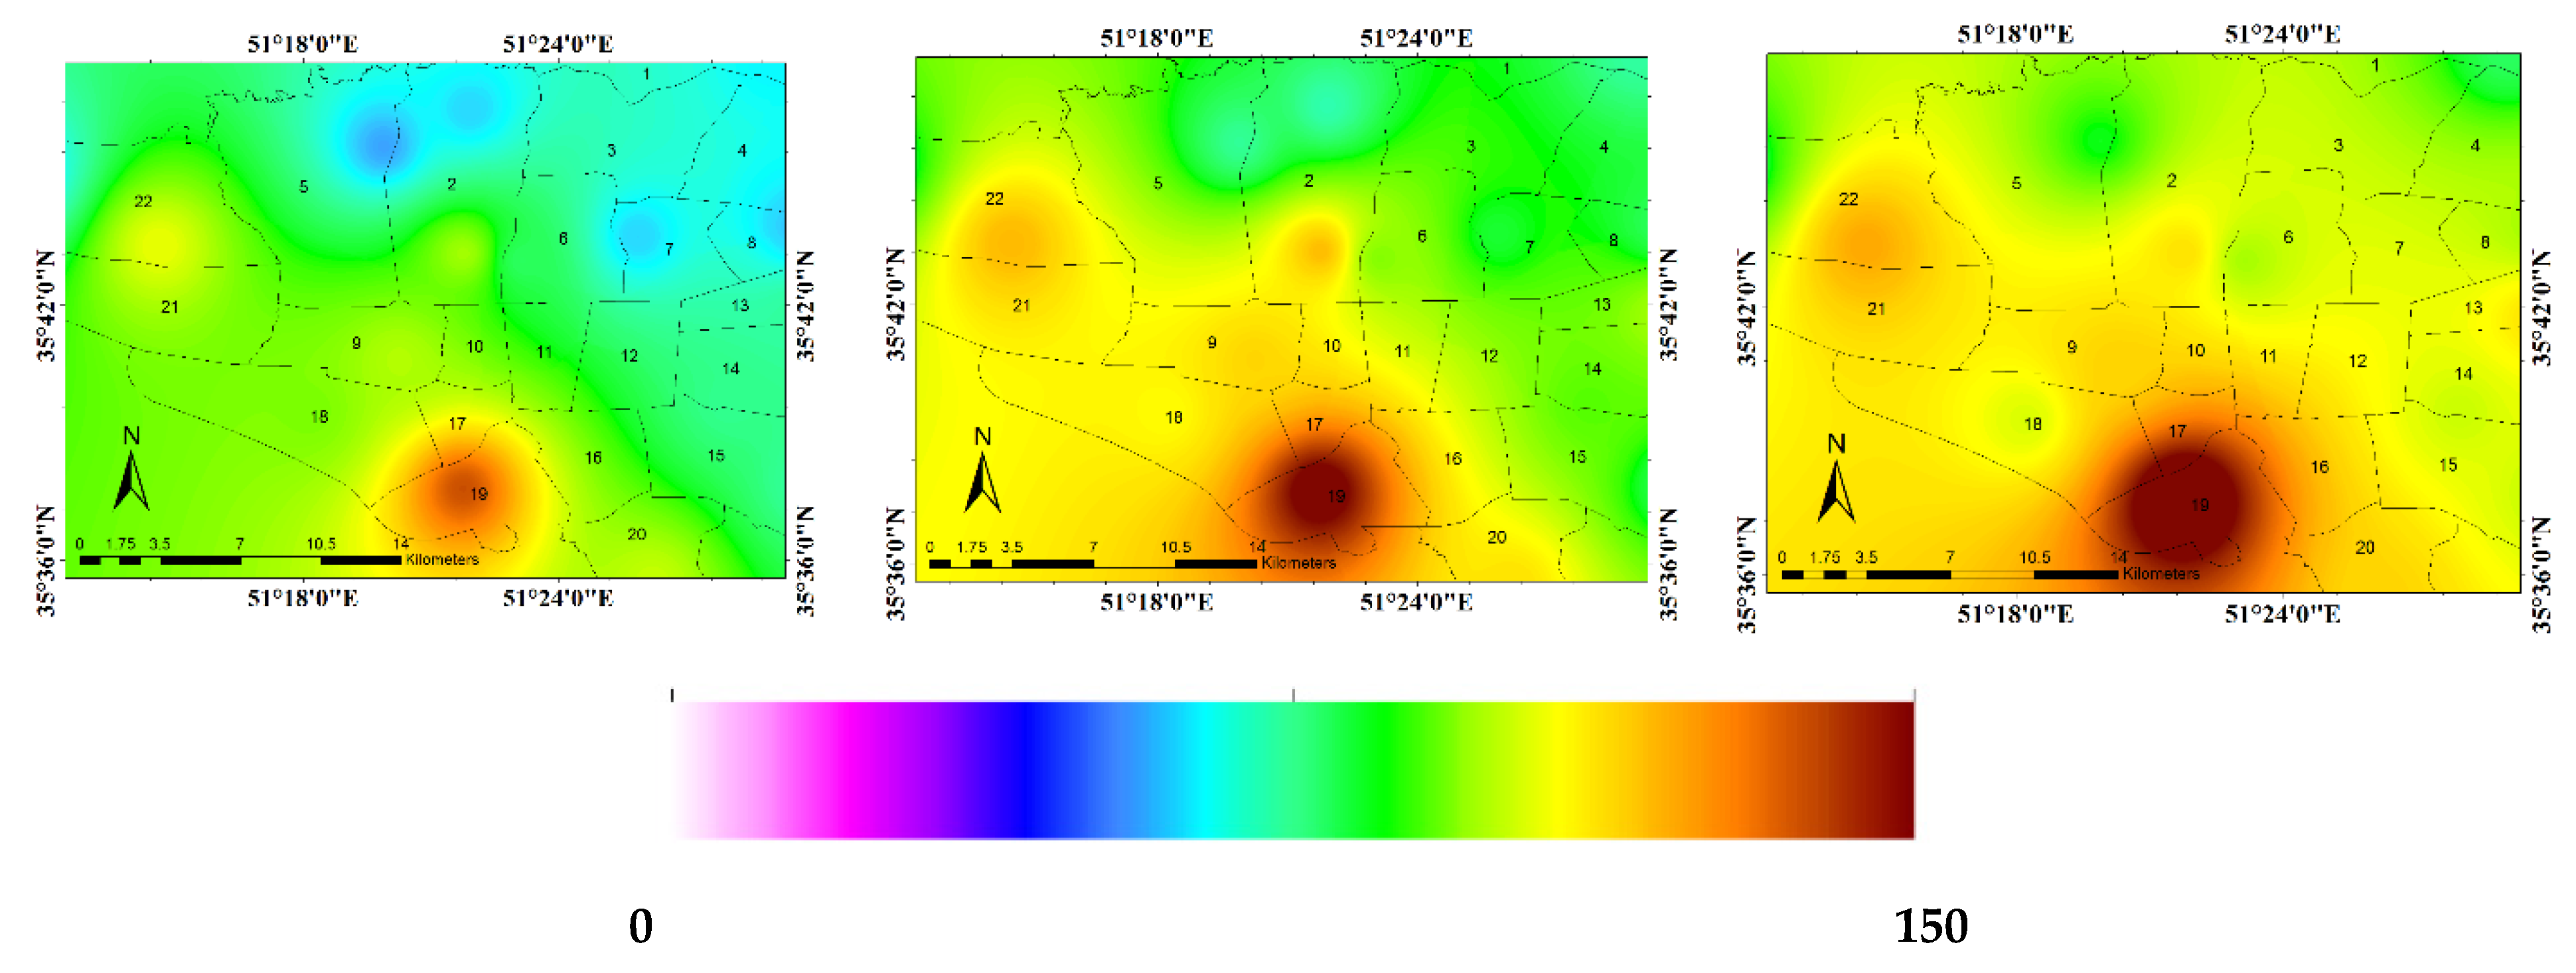
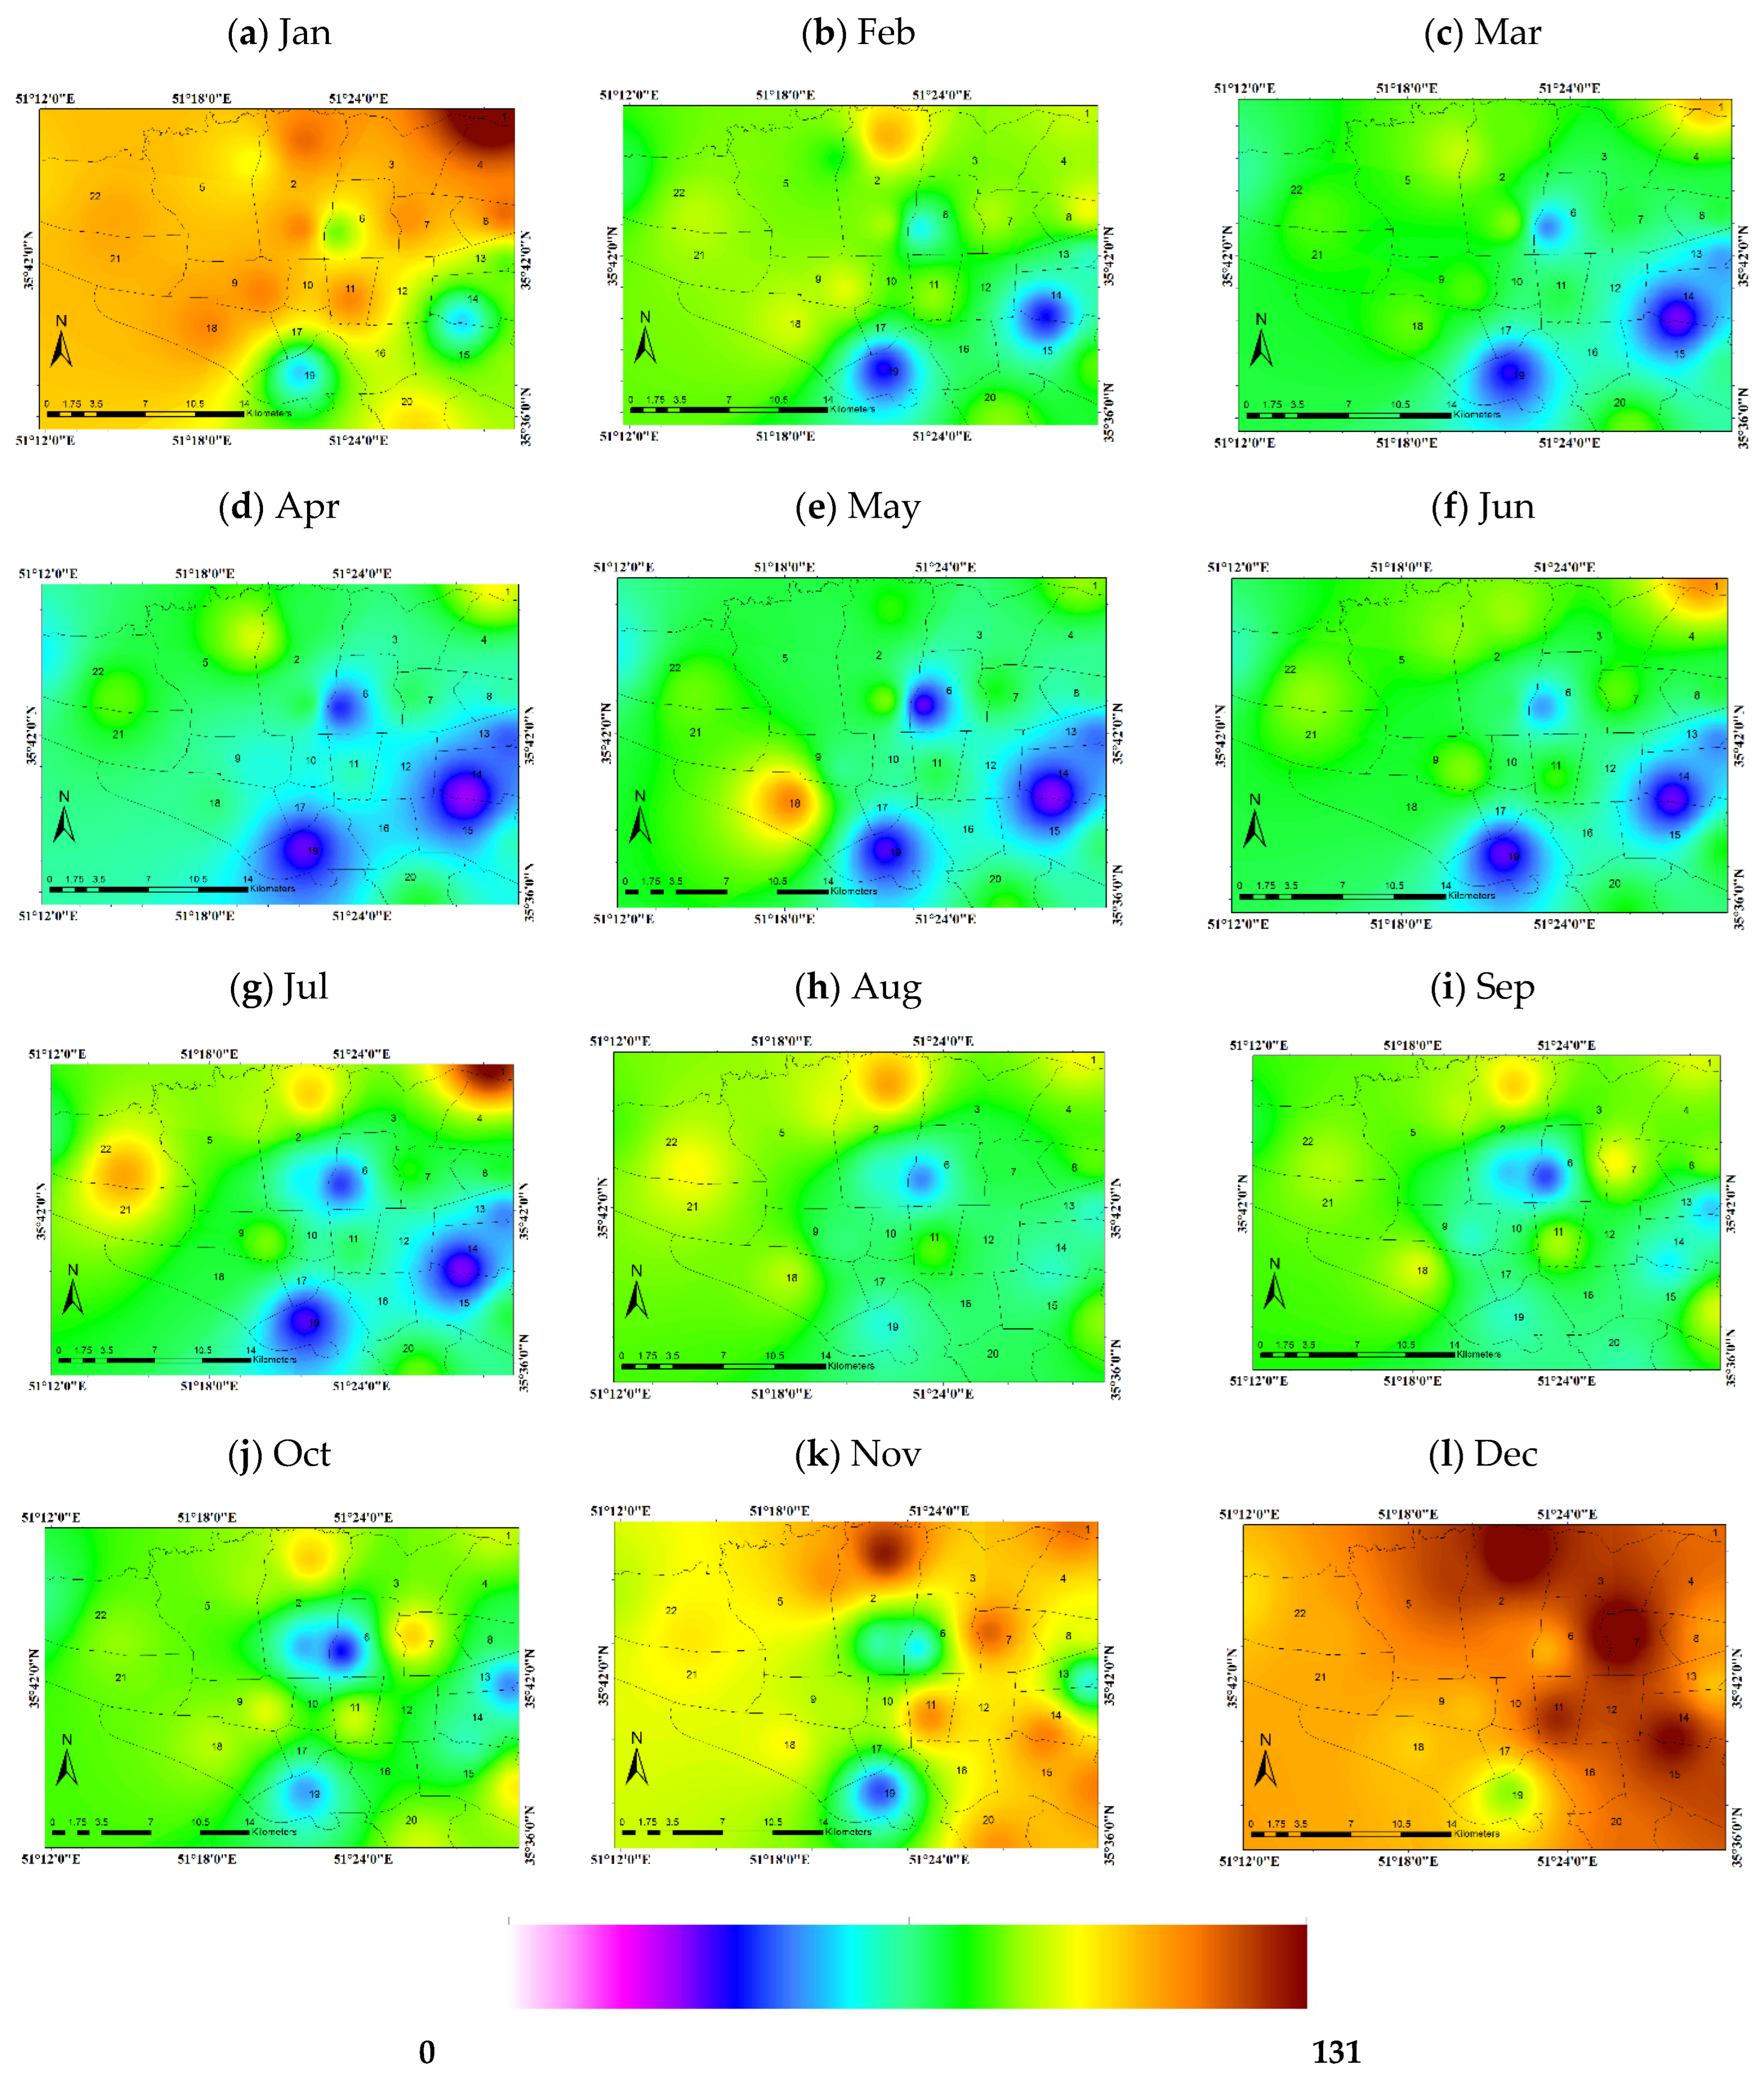
3.5.2. PM2.5 Pollutant
3.5.3. NO2 Pollutant
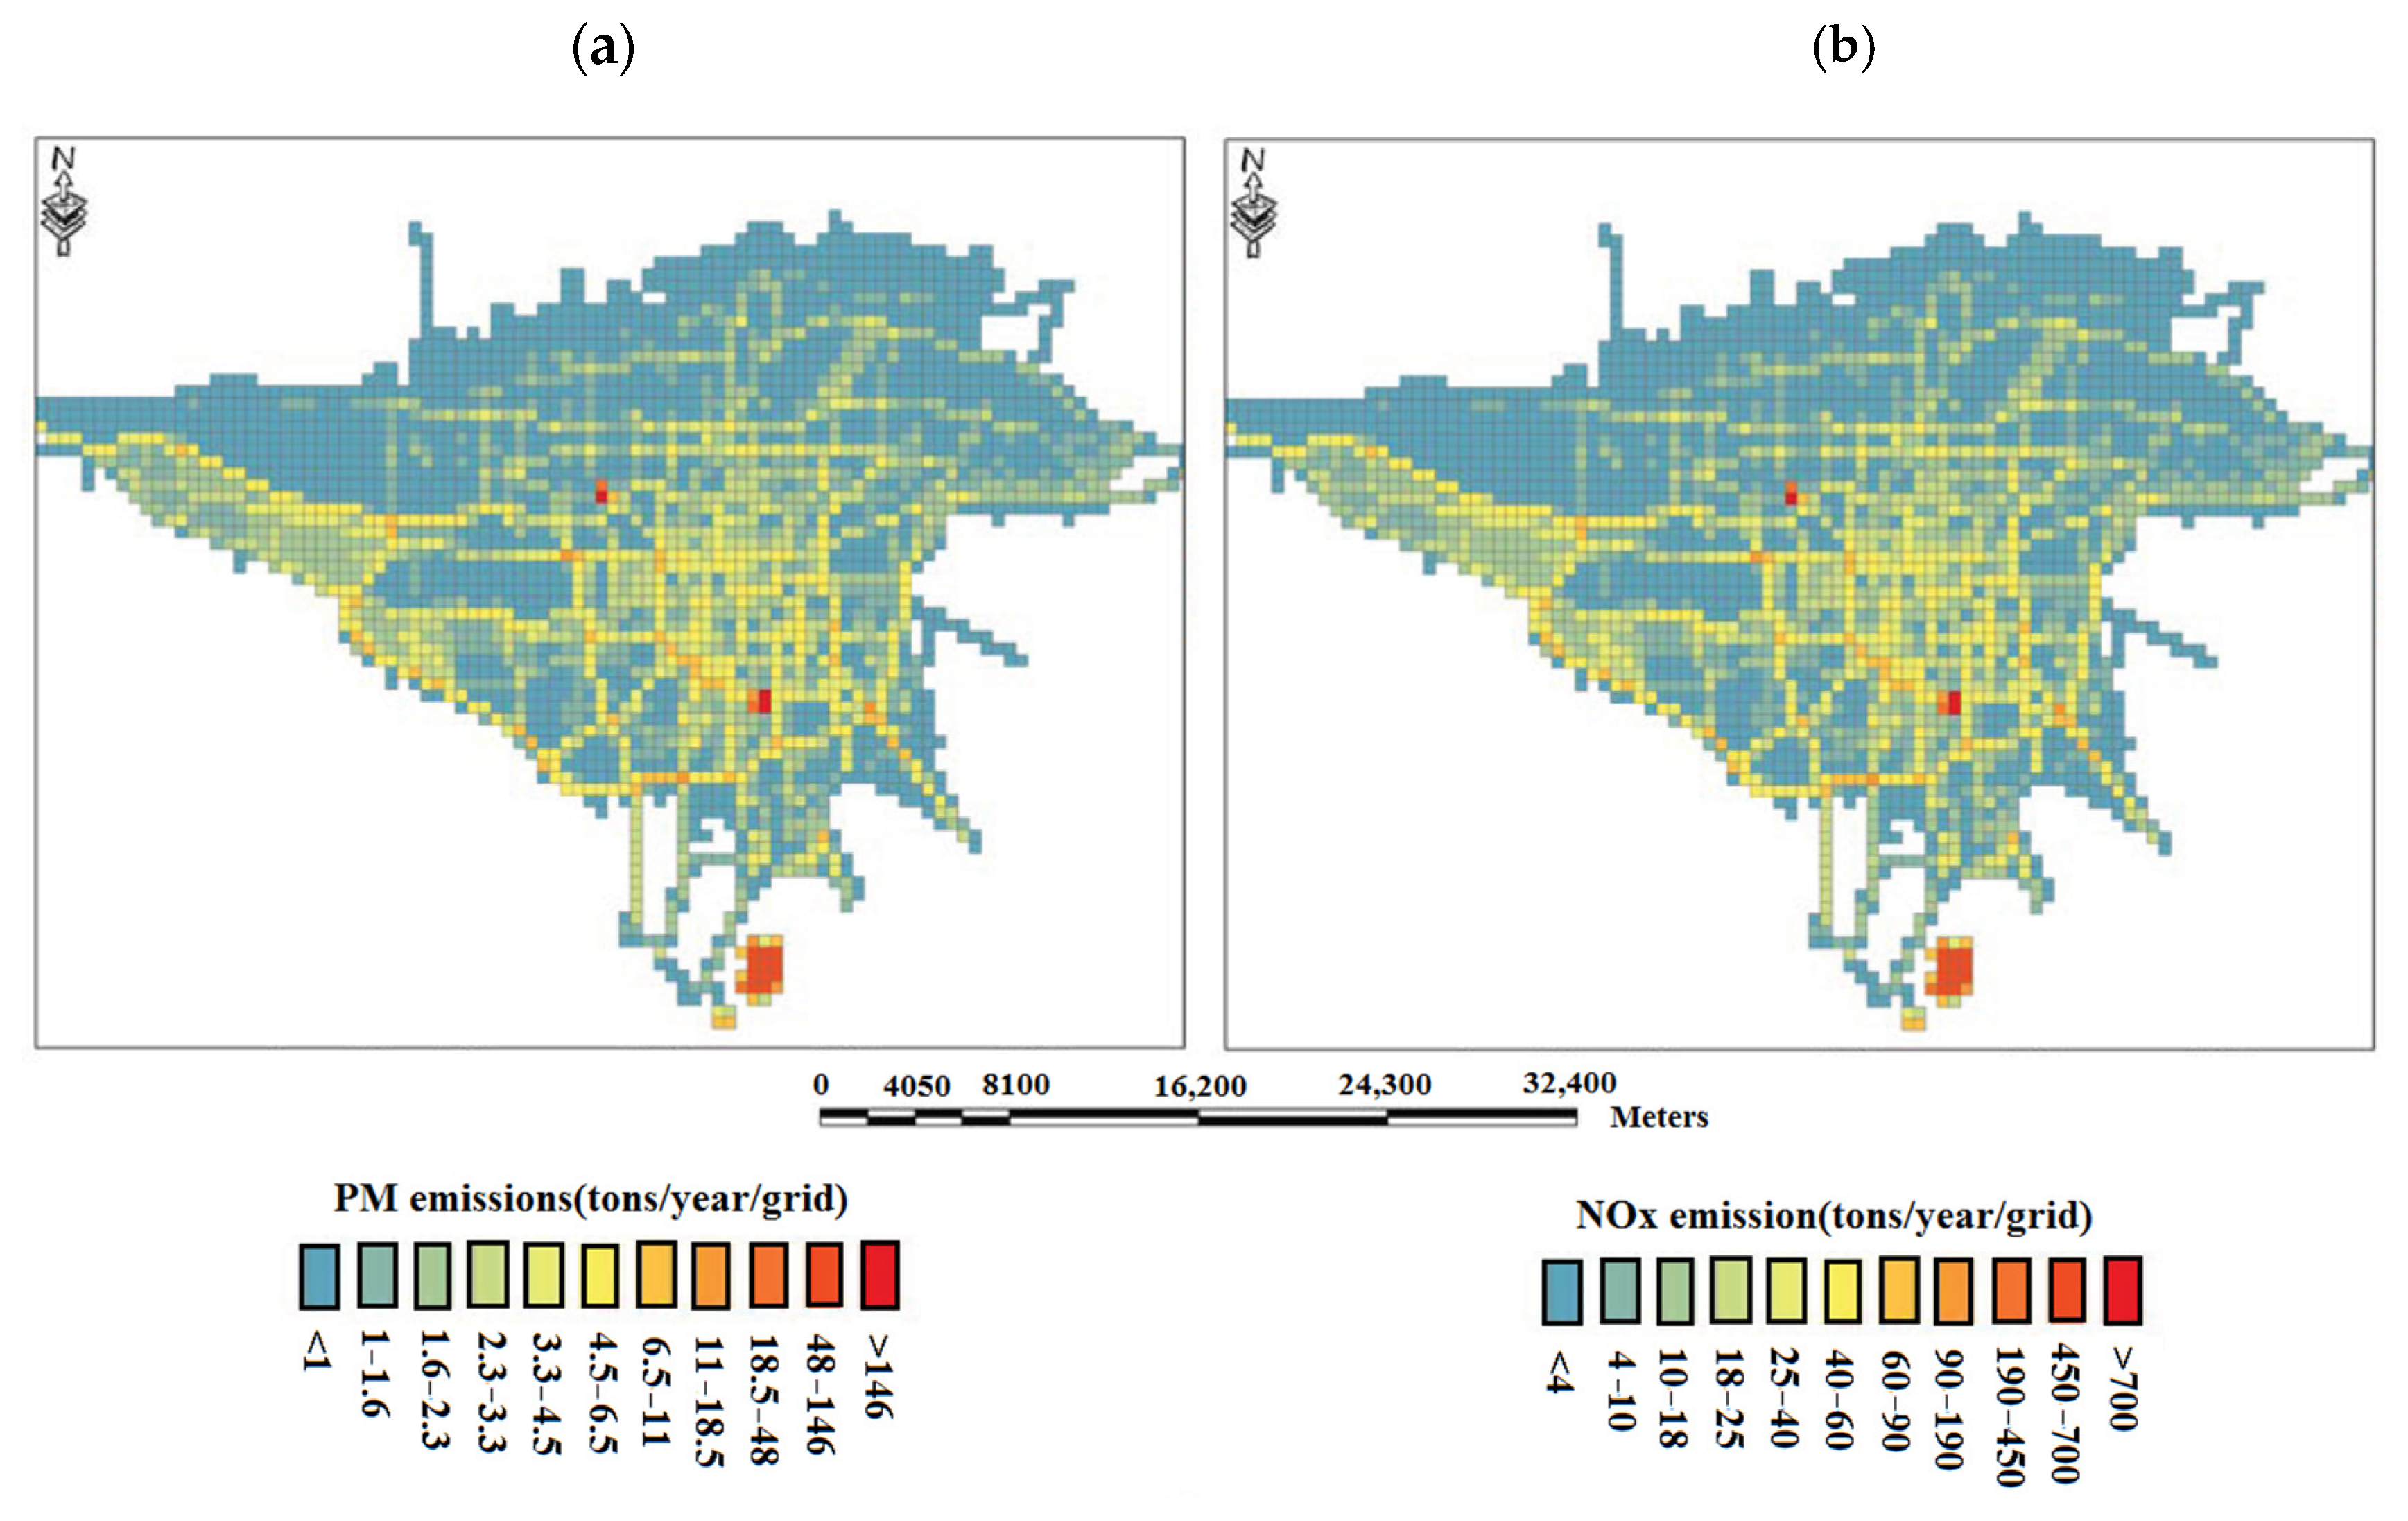
3.6. Investigating the Factors Affecting the Distribution of Pollutants in the TEHRAN Metropolis
3.7. PM10 Case Study
3.7.1. July
PM10 Concentration
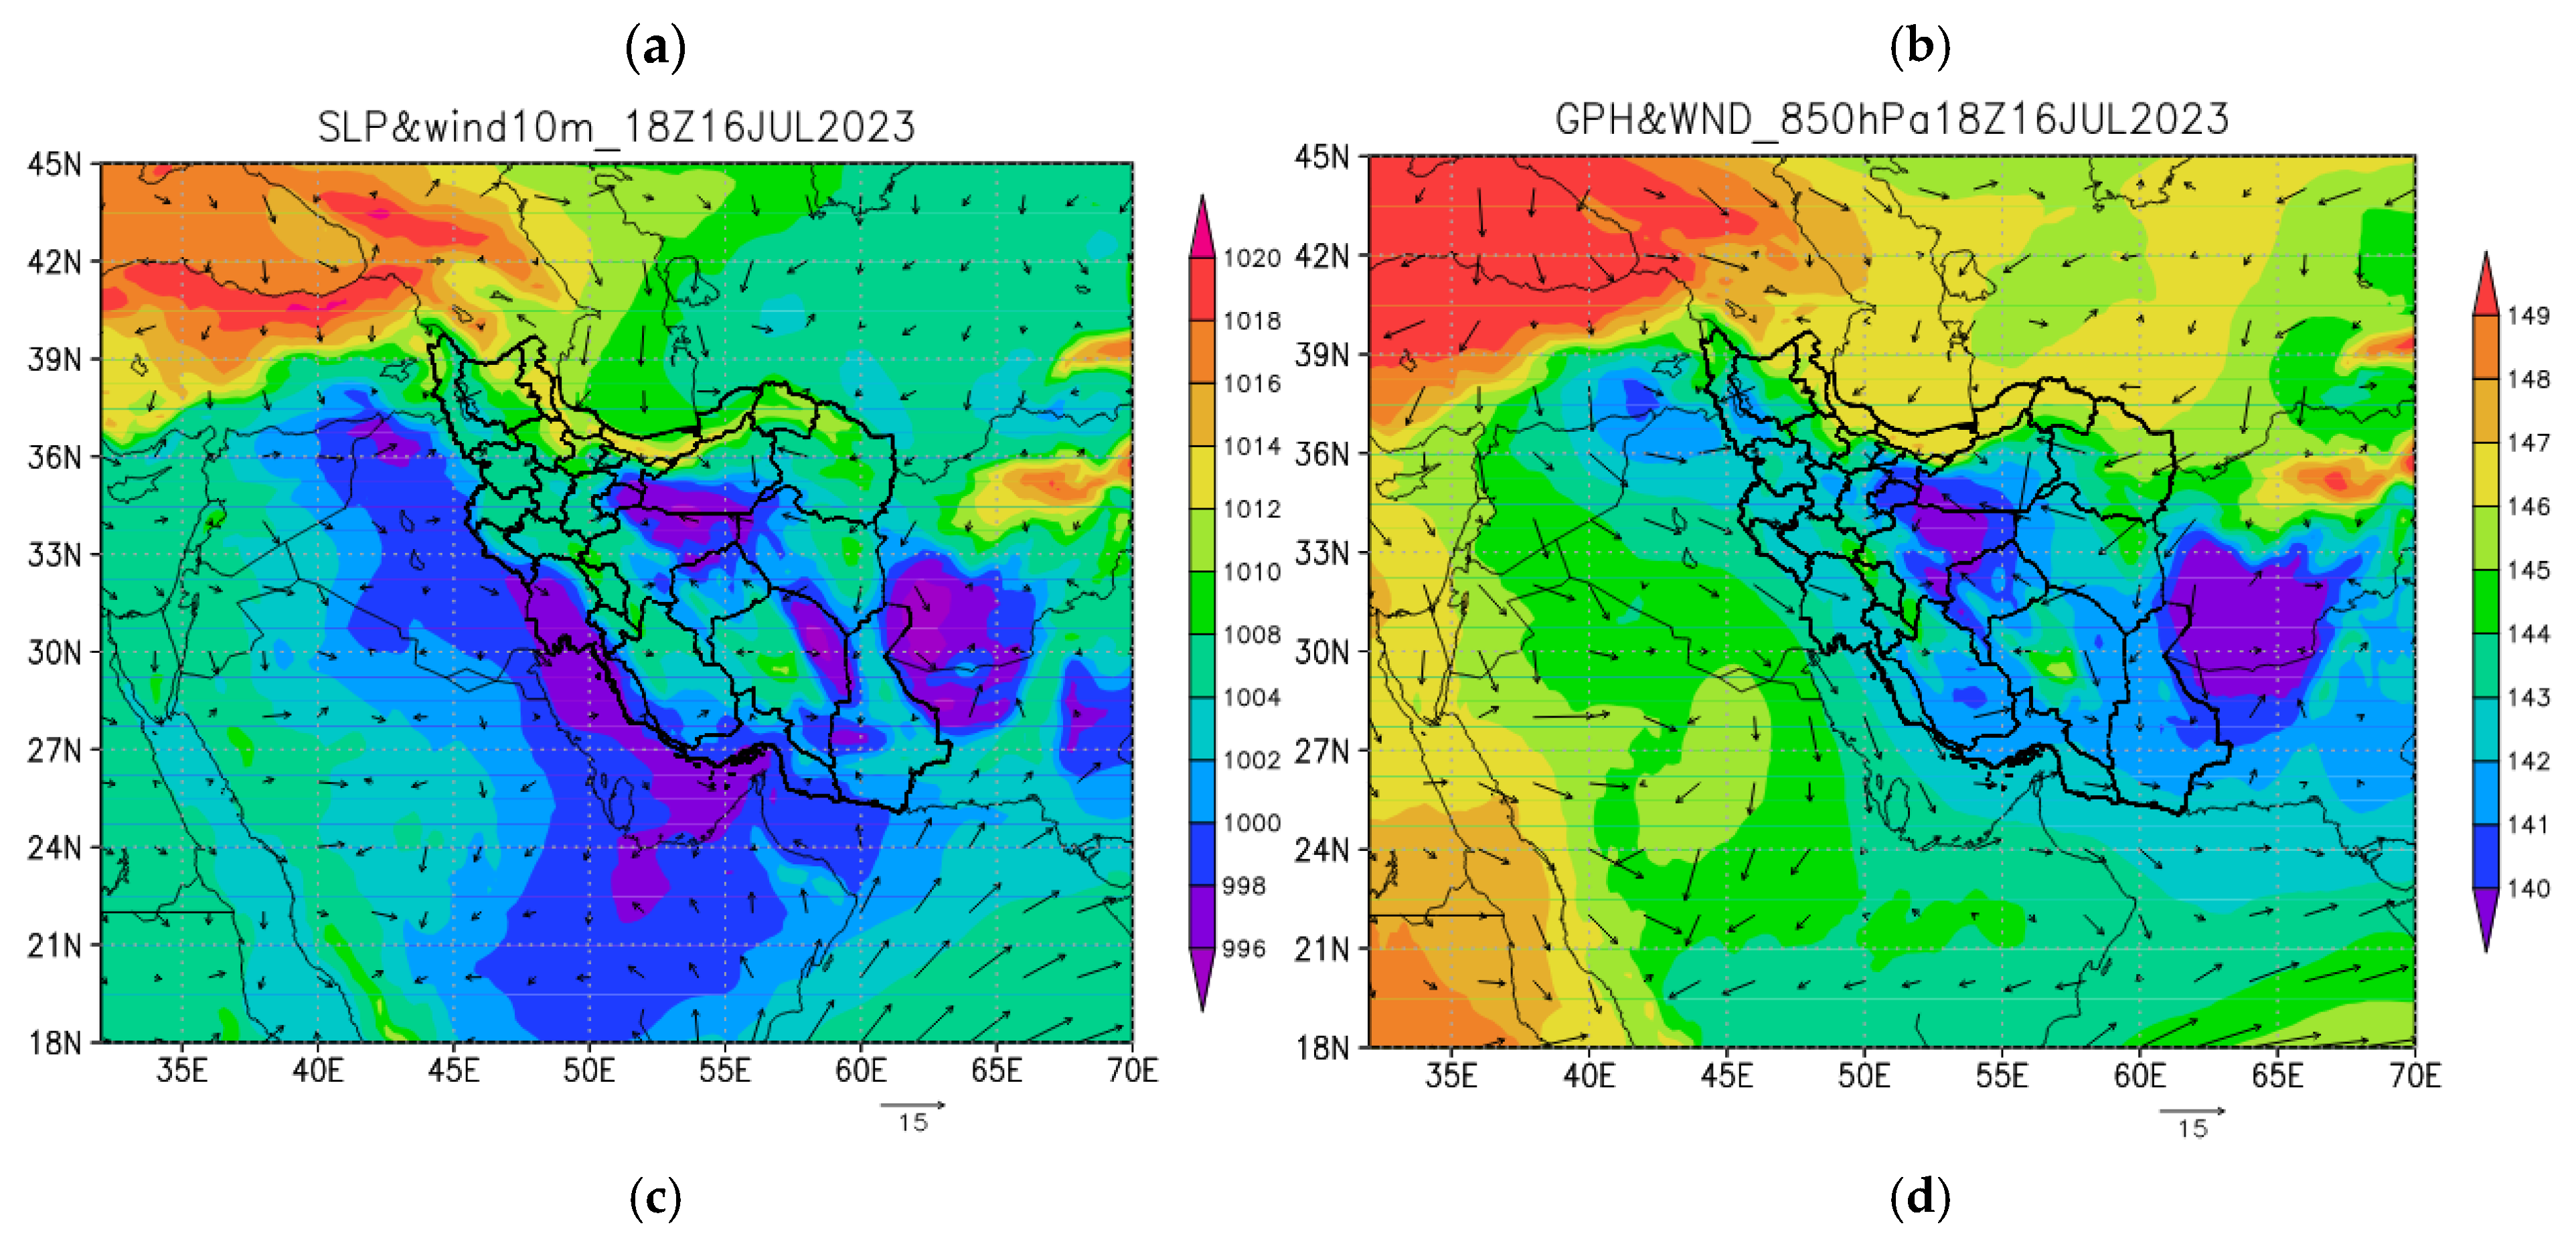
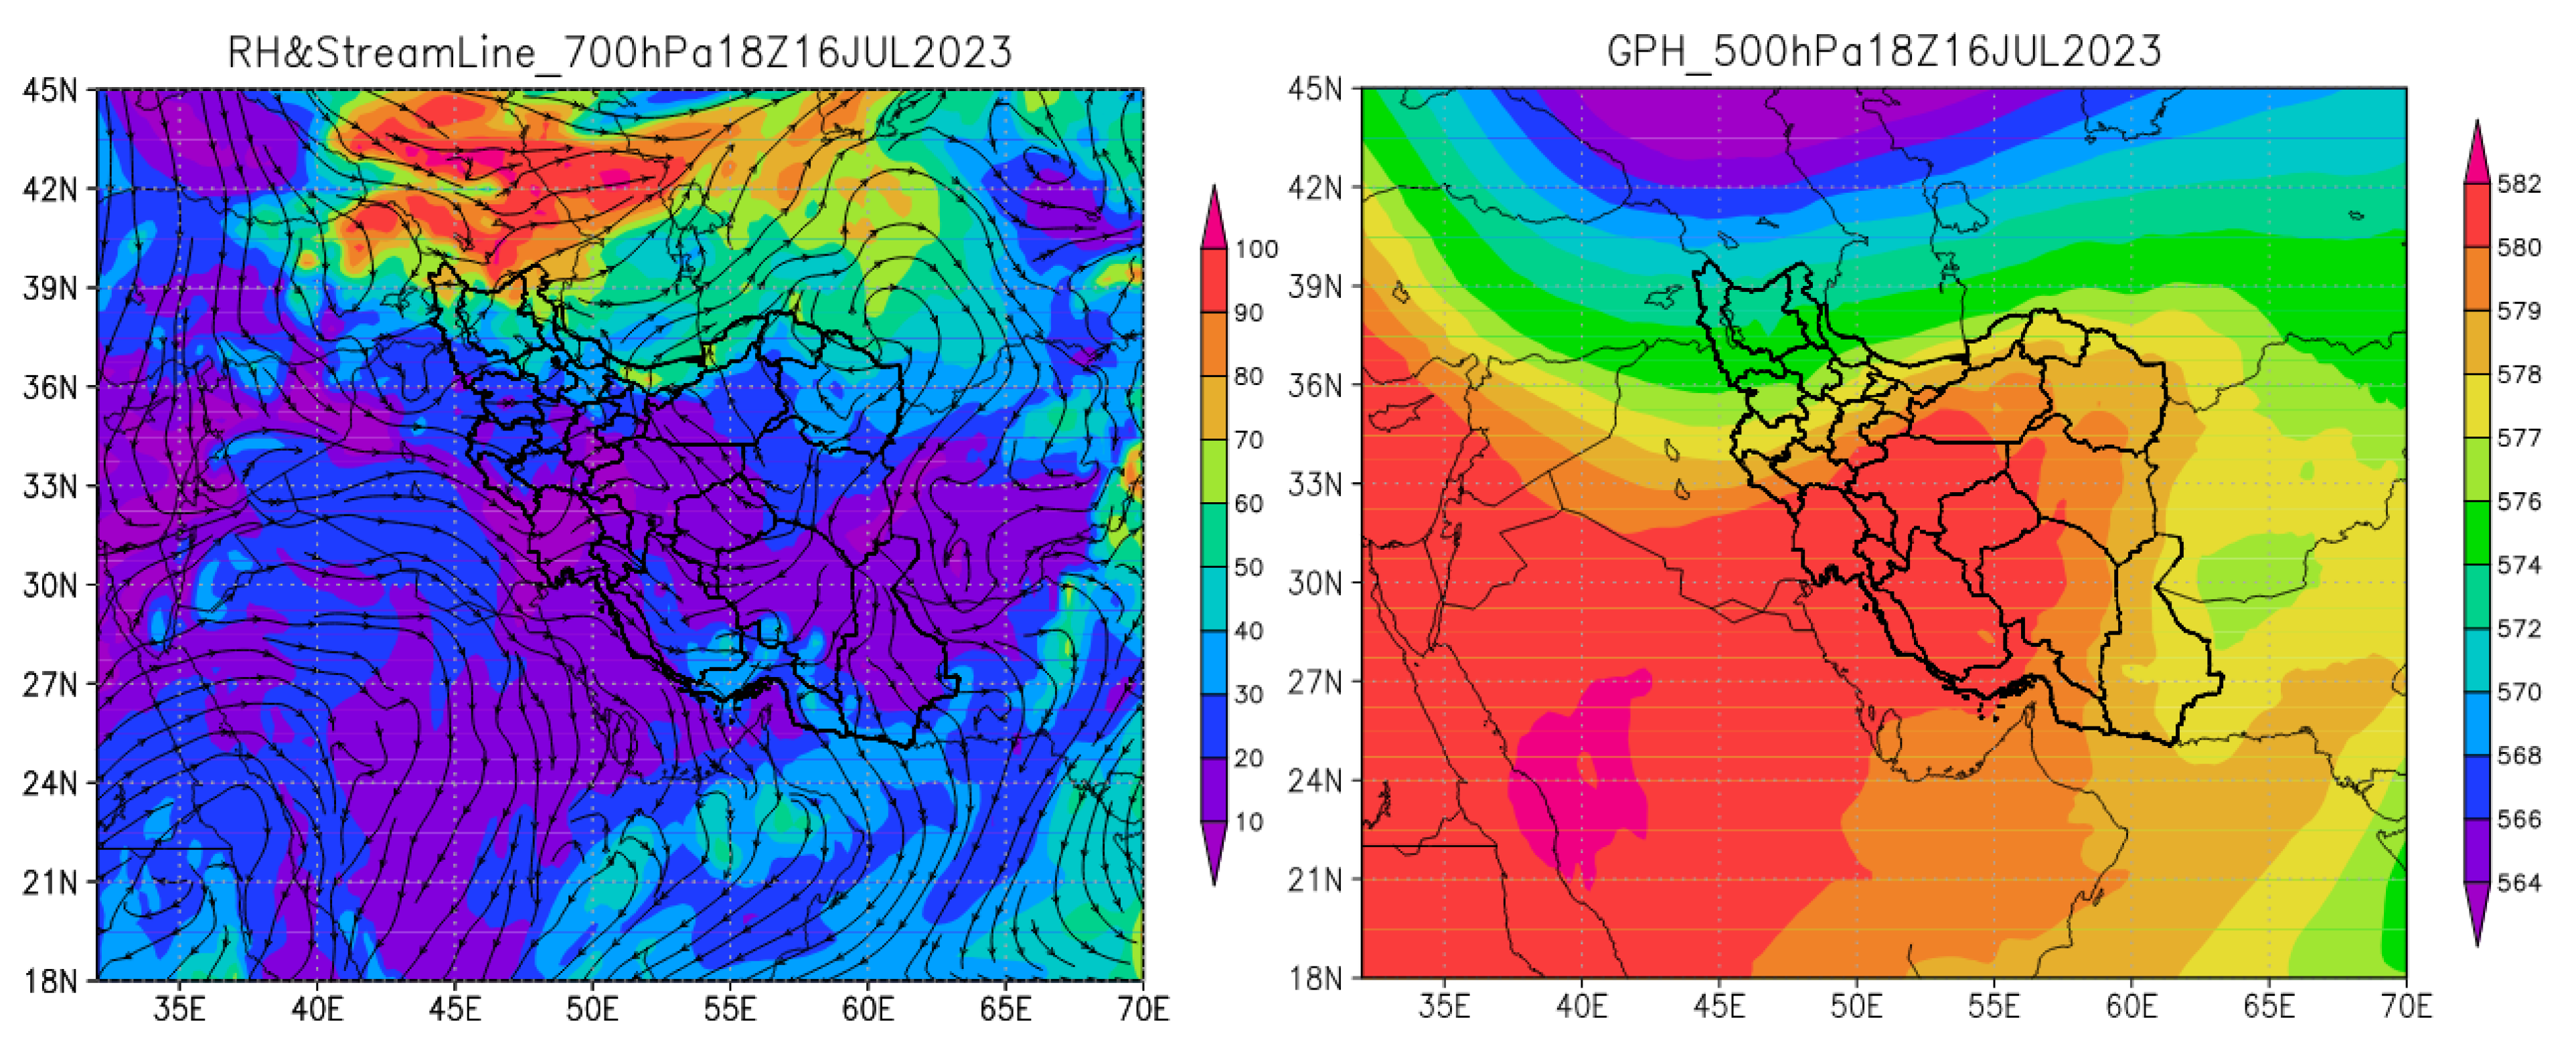
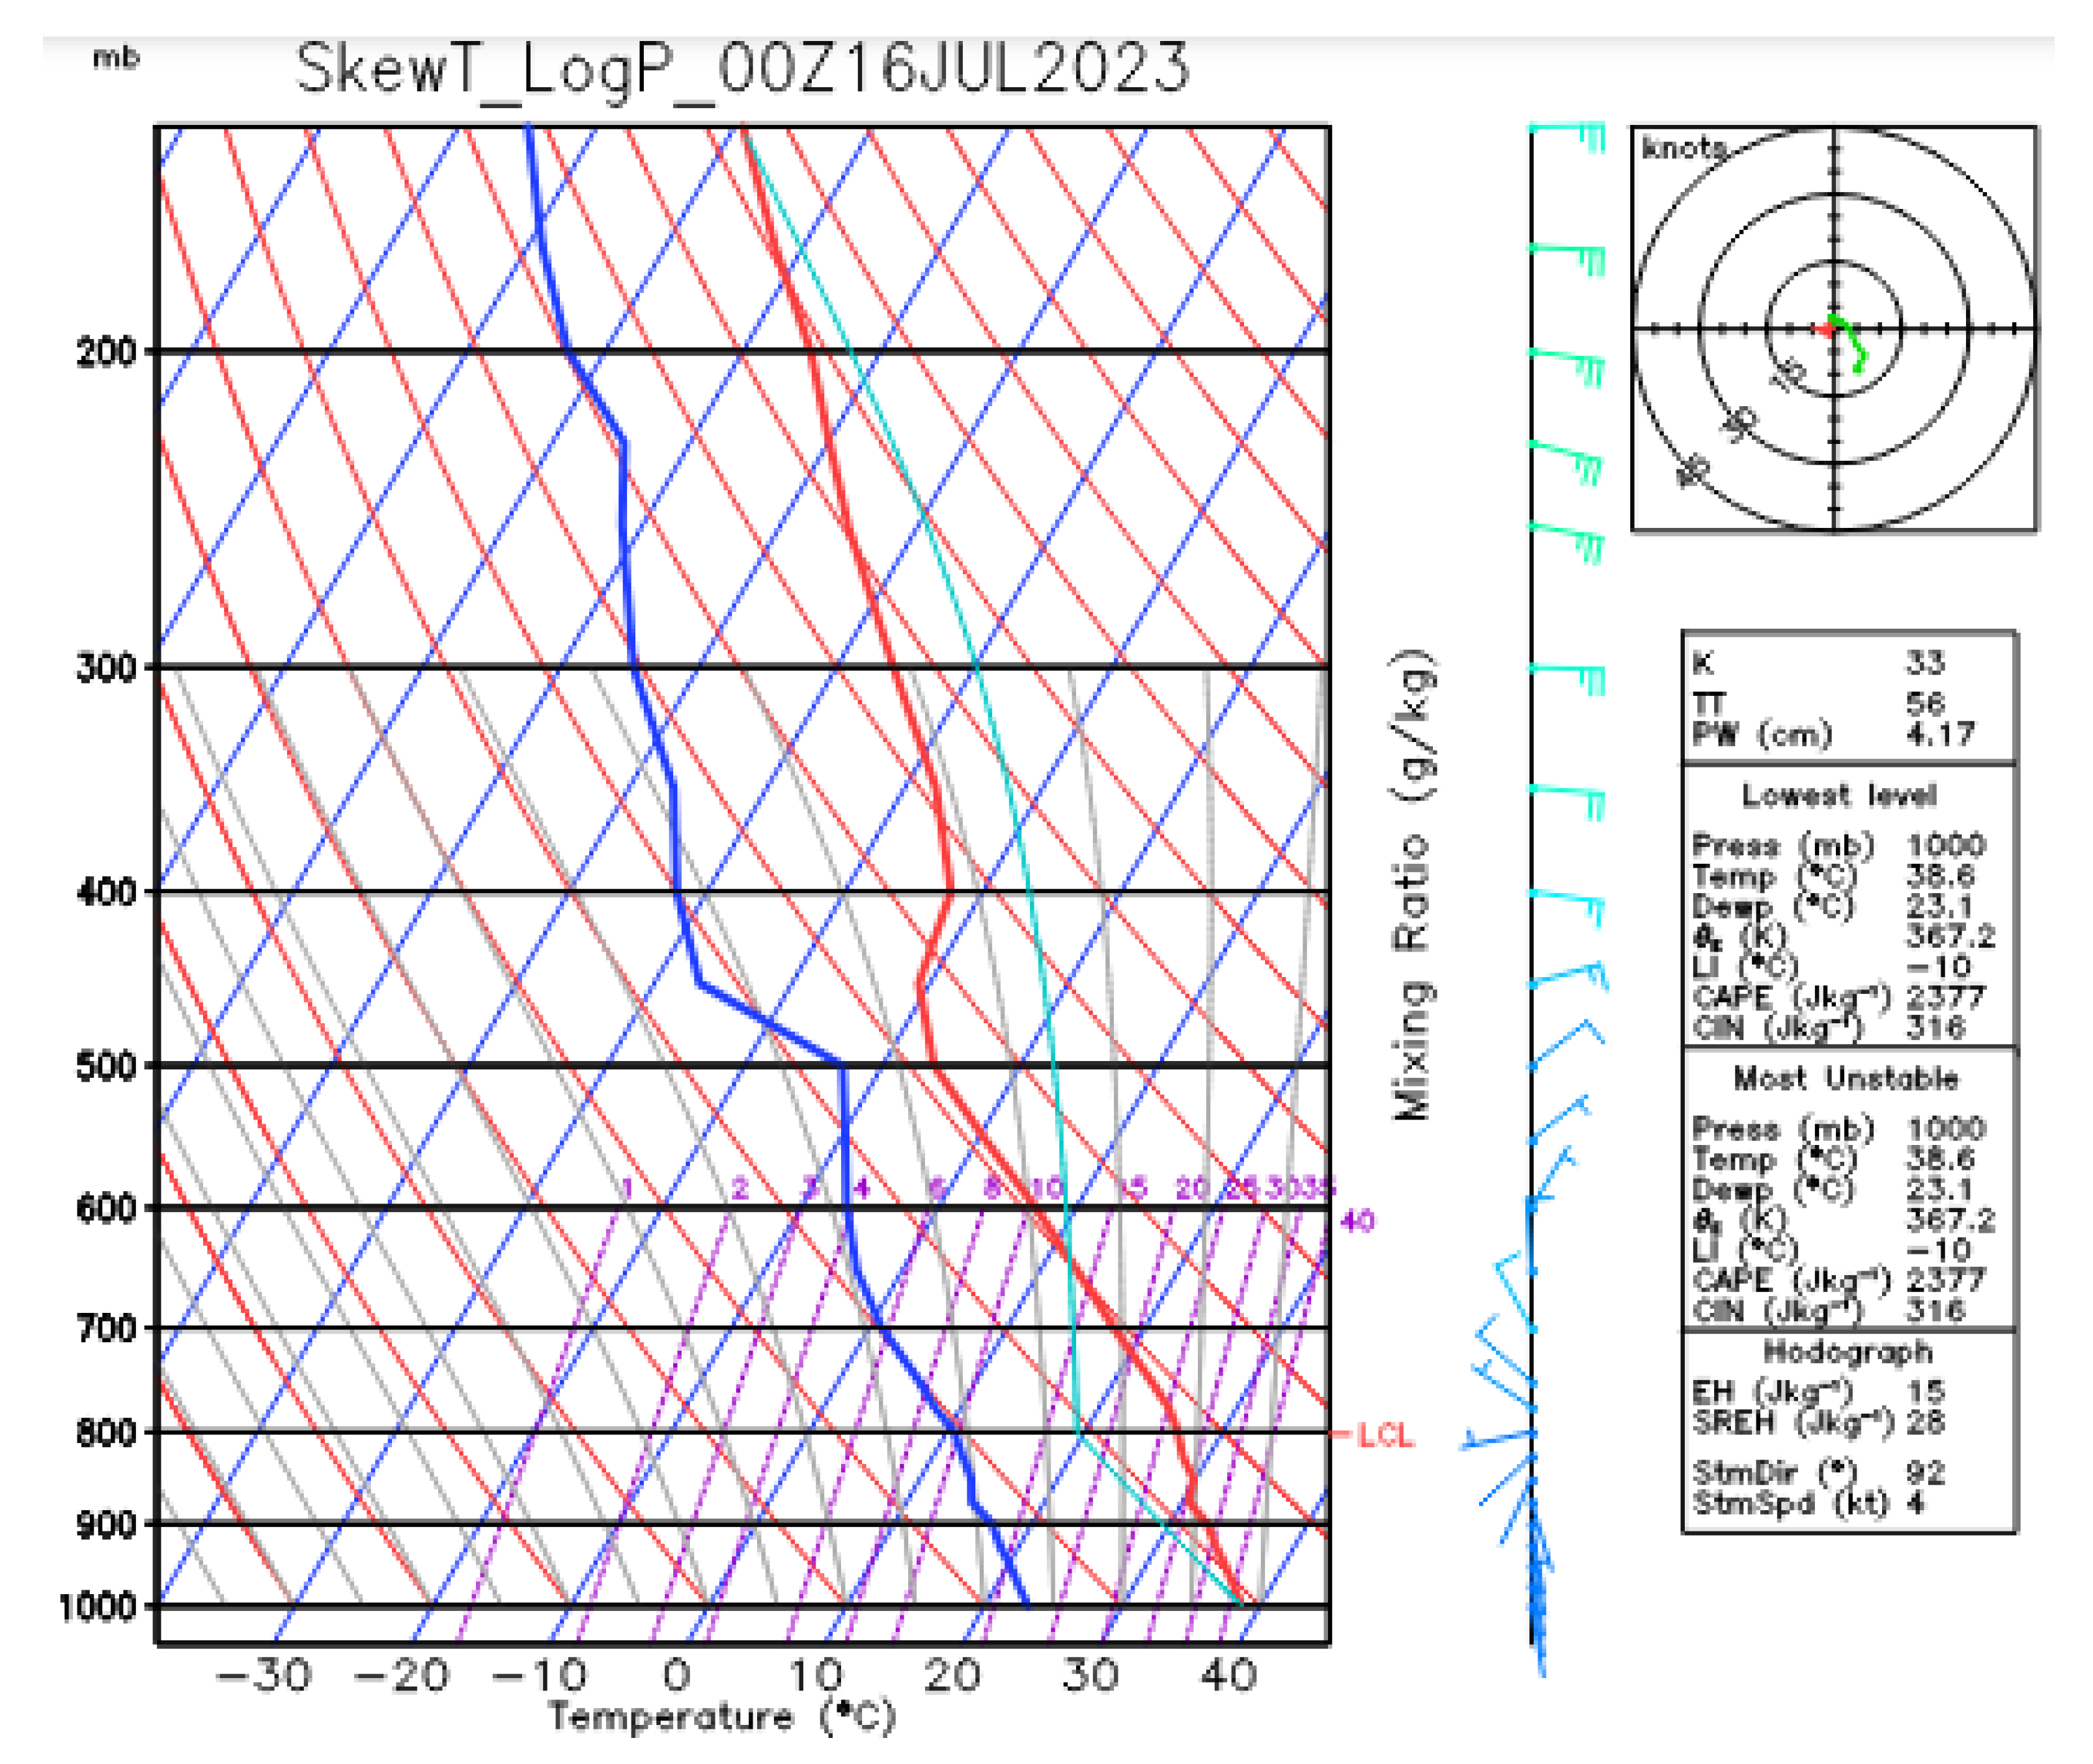
Synoptic Analysis
Prediction of PM10 Pollutant Concentration in Tehran City
3.8. PM2.5 Case Study
3.8.1. January
PM2.5 Concentration
Synoptic Analysis
Prediction of PM2.5 Pollutant Concentration in Tehran City
3.9. NO2 Case Study
3.9.1. December
NO2 Concentration
Synoptic Analysis
Prediction of NO2 Pollutant Concentration in Tehran City
4. Conclusions
Supplementary Materials
Author Contributions
Funding
Institutional Review Board Statement
Informed Consent Statement
Data Availability Statement
Acknowledgments
Conflicts of Interest
References
- Anwar, M.N.; Shabbir, M.; Tahir, E.; Iftikhar, M.; Saif, H.; Tahir, A.; Murtaza, M.A.; Khokhar, M.F.; Rehan, M.; Aghbashlo, M.; et al. Emerging challenges of air pollution and particulate matter in China, India, and Pakistan and mitigating solutions. J. Hazard. Mater. 2021, 416, 125851. [Google Scholar] [CrossRef] [PubMed]
- Zhang, X.; Han, L.; Wei, H.; Tan, X.; Zhou, W.; Li, W.; Qian, Y. Linking urbanization and air quality together: A review and a perspective on the future sustainable urban development. J. Clean. Prod. 2022, 346, 130988. [Google Scholar] [CrossRef]
- Guo, Q.; He, Z.; Wang, Z. Change in air quality during 2014–2021 in Jinan city in China and its influencing factors. Toxics 2023, 11, 210. [Google Scholar] [CrossRef] [PubMed]
- Shahriyari, H.A.; Nikmanesh, Y.; Jalali, S.; Tahery, N.; Zhiani Fard, A.; Hatamzadeh, N.; Zarea, K.; Cheraghi, M.; Mohammadi, M.J. Air pollution and human health risks: Mechanisms and clinical manifestations of cardiovascular and respiratory diseases. Toxin Rev. 2022, 41, 606–617. [Google Scholar] [CrossRef]
- Sierra-Vargas, M.P.; Montero-Vargas, J.M.; Debray-García, Y.; Vizuet-de-Rueda, J.C.; Loaeza-Román, A.; Terán, L.M. Oxidative stress and air pollution: Its impact on chronic respiratory diseases. Int. J. Mol. Sci. 2023, 24, 853. [Google Scholar] [CrossRef] [PubMed]
- Maio, S.; Sarno, G.; Tagliaferro, S.; Pirona, F.; Stanisci, I.; Baldacci, S.; Viegi, G. Outdoor air pollution and respiratory health. Int. J. Tuberc. Lung Dis. 2023, 27, 7–12. [Google Scholar] [CrossRef] [PubMed]
- Gholami, S.; Behnami, A.; Benis, K.Z. Air Pollution and Cancer. In Diseases and Health Consequences of Air Pollution; Academic Press: Cambridge, MA, USA, 2024; pp. 85–108. [Google Scholar]
- Alahmad, B.; Khraishah, H.; Althalji, K.; Borchert, W.; Al-Mulla, F.; Koutrakis, P. Connections between air pollution, climate change, and cardiovascular health. Can. J. Cardiol. 2023, 39, 1182–1190. [Google Scholar] [CrossRef]
- Fowler, D.; Brimblecombe, P.; Burrows, J.; Heal, M.R.; Grennfelt, P.; Stevenson, D.S.; Jowett, A.; Nemitz, E.; Coyle, M.; Liu, X.; et al. A chronology of global air quality. Philos. Trans. R. Soc. A 2020, 378, 20190314. [Google Scholar] [CrossRef]
- Haywood, J. Atmospheric Aerosols and Their Role in Climate Change. In Climate Change; Elsevier: Amsterdam, The Netherlands, 2021; pp. 645–659. [Google Scholar]
- Chen, Y.; Haywood, J.; Wang, Y.; Malavelle, F.; Jordan, G.; Peace, A.; Partridge, D.G.; Cho, N.; Oreopoulos, L.; Grosvenor, D.; et al. Substantial cooling effect from aerosol-induced increase in tropical marine cloud cover. Nat. Geosci. 2024, 17, 404–410. [Google Scholar] [CrossRef]
- Mahowald, N.M.; Li, L.; Albani, S.; Hamilton, D.S.; Kok, J.F. Opinion: The importance of historical and paleoclimate aerosol radiative effects. Atmos. Chem. Phys. 2024, 24, 533–551. [Google Scholar] [CrossRef]
- Esteban-Cantillo, O.J.; Menendez, B.; Quesada, B. Climate change and air pollution impacts on cultural heritage building materials in Europe and Mexico. Sci. Total Environ. 2024, 921, 170945. [Google Scholar] [CrossRef] [PubMed]
- Guo, Q.; He, Z.; Wang, Z. The Characteristics of Air Quality Changes in Hohhot City in China and their Relationship with Meteorological and Socio-economic Factors. Aerosol Air Qual. Res. 2024, 24, 230274. [Google Scholar] [CrossRef]
- Liu, Y.; Zhou, Y.; Lu, J. Exploring the relationship between air pollution and meteorological conditions in China under environmental governance. Sci. Rep. 2020, 10, 14518. [Google Scholar] [CrossRef] [PubMed]
- Chen, J.; Liu, Z.; Yin, Z.; Liu, X.; Li, X.; Yin, L.; Zheng, W. Predict the effect of meteorological factors on haze using BP neural network. Urban Clim. 2023, 51, 101630. [Google Scholar] [CrossRef]
- Chen, Z.; Chen, D.; Zhao, C.; Kwan, M.P.; Cai, J.; Zhuang, Y.; Zhao, B.; Wang, X.; Chen, B.; Yang, J.; et al. Influence of meteorological conditions on PM2. 5 concentrations across China: A review of methodology and mechanism. Environ. Int. 2020, 139, 105558. [Google Scholar] [CrossRef] [PubMed]
- Guo, Q.; He, Z.; Li, S.; Li, X.; Meng, J.; Hou, Z.; Liu, J.; Chen, Y. Air pollution forecasting using artificial and wavelet neural networks with meteorological conditions. Aerosol Air Qual. Res. 2020, 20, 1429–1439. [Google Scholar] [CrossRef]
- Al-Hemoud, A.; Al-Sudairawi, M.; Al-Rashidi, M.; Behbehani, W.; Al-Khayat, A. Temperature inversion and mixing height: Critical indicators for air pollution in hot arid climate. Nat. Hazards 2019, 97, 139–155. [Google Scholar] [CrossRef]
- Yavuz, V. An analysis of atmospheric stability indices and parameters under air pollution conditions. Environ. Monit. Assess. 2023, 195, 934. [Google Scholar] [CrossRef] [PubMed]
- Ngangmo, Y.C.; Adiang, C.M.; Choudhary, A.; Monkam, D. Road traffic-induced particle matter dispersion in a calm wind environment at the main roundabout in Douala, central Africa. J. Air Pollut. Health 2023, 8, 59–76. [Google Scholar] [CrossRef]
- Zhu, T.; Tang, M.; Gao, M.; Bi, X.; Cao, J.; Che, H.; Chen, J.; Ding, A.; Fu, P.; Gao, J.; et al. Recent progress in atmospheric chemistry research in China: Establishing a theoretical framework for the “Air Pollution Complex”. Adv. Atmos. Sci. 2023, 40, 1339–1361. [Google Scholar] [CrossRef] [PubMed]
- Shi, Z.; Vu, T.; Kotthaus, S.; Harrison, R.M.; Grimmond, S.; Yue, S.; Zhu, T.; Lee, J.; Han, Y.; Demuzere, M.; et al. Introduction to the special issue “In-depth study of air pollution sources and processes within Beijing and its surrounding region (APHH-Beijing)”. Atmos. Chem. Phys. 2019, 19, 7519–7546. [Google Scholar] [CrossRef]
- Guo, Q.; He, Z.; Wang, Z. Prediction of hourly PM2. 5 and PM10 concentrations in Chongqing City in China based on artificial neural network. Aerosol Air Qual. Res. 2023, 23, 220448. [Google Scholar] [CrossRef]
- Shu, L.; Xie, M.; Gao, D.; Wang, T.; Fang, D.; Liu, Q.; Huang, A.; Peng, L. Regional severe particle pollution and its association with synoptic weather patterns in the Yangtze River Delta region, China. Atmos. Chem. Phys. 2017, 17, 12871–12891. [Google Scholar] [CrossRef]
- Qian, W.; Xu, M.; Ai, Y. Anomaly-based synoptic analysis to identify and predict meteorological conditions of strong ozone events in North China. Air Qual. Atmos. Health 2022, 15, 1699–1711. [Google Scholar] [CrossRef]
- He, Z.; Guo, Q. Comparative Analysis of Multiple Deep Learning Models for Forecasting Monthly Ambient PM2. 5 Concentrations: A Case Study in Dezhou City, China. Atmosphere 2024, 15, 1432. [Google Scholar] [CrossRef]
- Guo, Q.; He, Z.; Wang, Z. Predicting of daily PM2. 5 concentration employing wavelet artificial neural networks based on meteorological elements in Shanghai, China. Toxics 2023, 11, 51. [Google Scholar] [CrossRef]
- He, Z.; Guo, Q.; Wang, Z.; Li, X. Prediction of monthly PM2. 5 concentration in Liaocheng in China employing artificial neural network. Atmosphere 2022, 13, 1221. [Google Scholar] [CrossRef]
- Appel, K.W.; Bash, J.O.; Fahey, K.M.; Foley, K.M.; Gilliam, R.C.; Hogrefe, C.; Hutzell, W.T.; Kang, D.; Mathur, R.; Murphy, B.N.; et al. The Community Multiscale Air Quality (CMAQ) model versions 5.3 and 5.3. 1: System updates and evaluation. Geosci. Model Dev. Discuss. 2020, 2020, 1–41. [Google Scholar] [CrossRef]
- Tessum, C.W.; Hill, J.D.; Marshall, J.D. InMAP: A model for air pollution interventions. PLoS ONE 2017, 12, e0176131. [Google Scholar] [CrossRef]
- Dimov, I.; Georgiev, K.; Ostromsky, T.; Zlatev, Z. Computational challenges in the numerical treatment of large air pollution models. Ecol. Model. 2004, 179, 187–203. [Google Scholar] [CrossRef]
- Berrocal, V.J.; Gelfand, A.E.; Holland, D.M. Space-time data fusion under error in computer model output: An application to modeling air quality. Biometrics 2012, 68, 837–848. [Google Scholar] [CrossRef] [PubMed]
- Ghorani-Azam, A.; Riahi-Zanjani, B.; Balali-Mood, M. Effects of air pollution on human health and practical measures for prevention in Iran. J. Res. Med. Sci. 2016, 21, 65. [Google Scholar]
- Saniei, R.; Zangiabadi, A.; Sharifikia, M.; Ghavidel, Y. Air quality classification and its temporal trend in Tehran, Iran, 2002–2012. Geospat. Health 2016, 11, 2. [Google Scholar] [CrossRef] [PubMed]
- Faraji, A.; Mortazavi, M.; Hamidizadeh, A. Systematic analysis of primary and secondary mechanisms affecting air pollution in Tehran. J. Clim. Res. 2022, 1401, 183–200. [Google Scholar]
- Thanvisitthpon, N.; Kallawicha, K.; Chao, H.J. Effects of Urbanization and Industrialization on Air Quality. In Health and Environmental Effects of Ambient Air Pollution; Academic Press: Cambridge, MA, USA, 2024; pp. 231–255. [Google Scholar]
- Hadian, M.; Raeissi, P.; Harati Khalilabad, T. The economic burden of mortality and morbidity due to air pollution in Tehran, Iran: A systematic review. Air Qual. Atmos. Health 2020, 13, 1001–1011. [Google Scholar] [CrossRef]
- Torbatian, S.; Hoshyaripour, A.; Shahbazi, H.; Hosseini, V. Air pollution trends in Tehran and their anthropogenic drivers. Atmos. Pollut. Res. 2020, 11, 429–442. [Google Scholar] [CrossRef]
- Yousefian, F.; Faridi, S.; Azimi, F.; Aghaei, M.; Shamsipour, M.; Yaghmaeian, K.; Hassanvand, M.S. Temporal variations of ambient air pollutants and meteorological influences on their concentrations in Tehran during 2012–2017. Sci. Rep. 2020, 10, 292. [Google Scholar] [CrossRef] [PubMed]
- ShahMohammadi, M.; Bay, Y.; Kiani, P.A.R.V.A.N.E.H. Identifying and Prioritizing the Factors Affecting Air Pollution in Tehran with an Interpretive Structural Modeling Approach. Environ. Interdiscip. Dev. 2022, 7, 88–98. [Google Scholar]
- Talkhabi, H.; Jafarpour Ghalehteimouri, K.; Toulabi Nejad, M. Integrating Tehran metropolitan air pollution into the current transport system and sprawl growth: An emphasis on urban performance and accessibility. Discov. Cities 2024, 1, 1–13. [Google Scholar] [CrossRef]
- Inness, A.; Ades, M.; Agustí-Panareda, A.; Barré, J.; Benedictow, A.; Blechschmidt, A.M.; Dominguez, J.J.; Engelen, R.; Eskes, H.; Flemming, J.; et al. The CAMS reanalysis of atmospheric composition. Atmos. Chem. Phys. 2019, 19, 3515–3556. [Google Scholar] [CrossRef]
- Khansalari, S.; Fazel-Rastgar, F.; Mohammadi, L.M.; Gozalkhoo, M. Clustering of different atmospheric patterns leading to an increase in different types of atmospheric pollutants in the greater Tehran area during the last 17 years (2004–2020). J. Air Pollut. Health 2021, 6, 54–71. [Google Scholar] [CrossRef]
- Pegahfar, N.; Bidokhti, A.A.; Zawar-Reza, P.; Farahani, M.M. Study of vertical wind profiles in an urban area with complex terrain (Tehran). J. Earth Syst. Sci. 2011, 120, 825–841. [Google Scholar] [CrossRef]
- Xiang, Y.; Zhang, T.; Liu, J.; Lv, L.; Dong, Y.; Chen, Z. Atmosphere boundary layer height and its effect on air pollutants in Beijing during winter heavy pollution. Atmos. Res. 2019, 215, 305–316. [Google Scholar] [CrossRef]
- Wang, M.; Tang, G.; Liu, Y.; Ma, M.; Yu, M.; Hu, B.; Zhang, Y.; Wang, Y.; Wang, Y. The difference in the boundary layer height between urban and suburban areas in Beijing and its implications for air pollution. Atmos. Environ. 2021, 260, 118552. [Google Scholar] [CrossRef]
- Su, T.; Li, Z.; Kahn, R. Relationships between the planetary boundary layer height and surface pollutants derived from lidar observations over China: Regional pattern and influencing factors. Atmos. Chem. Phys. 2018, 18, 15921–15935. [Google Scholar] [CrossRef]
- Crosbie, E.; Sorooshian, A.; Monfared, N.A.; Shingler, T.; Esmaili, O. A multi-year aerosol characterization for the greater Tehran area using satellite, surface, and modeling data. Atmosphere 2014, 5, 178–197. [Google Scholar] [CrossRef] [PubMed]
- Shi, Y.; Liu, L.; Hu, F.; Fan, G.; Huo, J. Nocturnal Boundary Layer Evolution and Its Impacts on the Vertical Distributions of Pollutant Particulate Matter. Atmosphere 2021, 12, 610. [Google Scholar] [CrossRef]
- Majumder, A.K.; Rahman, M.; Patoary, M.N.A.; Kamruzzaman, A.M.; Majumder, R. Time Series Analysis PM2• 5 Concentration for Capital City Dhaka from 2016 to 2023. Science 2024, 5, 35–42. [Google Scholar]
- Sun, Y.; Song, T.; Tang, G.; Wang, Y. The vertical distribution of PM2. 5 and boundary-layer structure during summer haze in Beijing. Atmos. Environ. 2013, 74, 413–421. [Google Scholar] [CrossRef]
- Mao, J.; Bali, K.; Campbell, J.R.; Robinson, E.S.; DeCarlo, P.F.; Ijaz, A.; Temime-Roussel, B.; Ketcherside, D.; Yokelson, R.J.; Hu, L.; et al. Multiphase sulfur chemistry facilitates particle growth in a cold and dark urban environment. Faraday Discuss. 2024. [Google Scholar] [CrossRef]
- Kermani, M.; Jonidi Jafari, A.; Gholami, M.; Arfaeinia, H.; Shahsavani, A.; Fanaei, F. Characterization, possible sources and health risk assessment of PM2. 5-bound Heavy Metals in the most industrial city of Iran. J. Environ. Health Sci. Eng. 2021, 19, 151–163. [Google Scholar] [CrossRef]
- Nguyen, D.H.; Lin, C.; Vu, C.T.; Cheruiyot, N.K.; Nguyen, M.K.; Le, T.H.; Lukkhasorn, W.; Bui, X.T. Tropospheric ozone and NOx: A review of worldwide variation and meteorological influences. Environ. Technol. Innov. 2022, 28, 102809. [Google Scholar] [CrossRef]
- Farahani, V.J.; Arhami, M. Contribution of Iraqi and Syrian dust storms on particulate matter concentration during a dust storm episode in receptor cities: Case study of Tehran. Atmos. Environ. 2020, 222, 117163. [Google Scholar] [CrossRef]
- Namdari, S.; Karimi, N.; Sorooshian, A.; Mohammadi, G.; Sehatkashani, S. Impacts of climate and synoptic fluctuations on dust storm activity over the Middle East. Atmos. Environ. 2018, 173, 265–276. [Google Scholar] [CrossRef]
- Fuladlu, K.; Altan, H. Examining land surface temperature and relations with the major air pollutants: A remote sensing research in case of Tehran. Urban Clim. 2021, 39, 100958. [Google Scholar] [CrossRef]
- Khajehpour, H.; Taksibi, F.; Hassanvand, M.S. Comparative review of ambient air PM2. 5 source apportioning studies in Tehran. J. Environ. Health Sci. Eng. 2023, 21, 21–34. [Google Scholar] [CrossRef]
- Afarideh, F.; Ramasht, M.H.; Mortyn, G. Air pollution and topography in Tehran. AUC Geogr. 2023, 58, 157–171. [Google Scholar] [CrossRef]
- Bidokhti, A.A.; Shariepour, Z.; Sehatkashani, S. Some resilient aspects of urban areas to air pollution and climate change, case study: Tehran, Iran. Sci. Iranica. Trans. A Civ. Eng. 2016, 23, 1994. [Google Scholar]


| R | R2 | |
|---|---|---|
| NOx and PM2.5 | 0.4844 | 0.2347 |
| SO2 and PM2.5 | 0.4842 | 0.2345 |
| R | R2 | |
|---|---|---|
| NO2 and O3 | −0.493 | 0.243 |
| NOx and O3 | −0.486 | 0.236 |
| Month | Wind | Temp | MSLP | RH | O3 | NO | NO2 | NOx | SO2 | PM10 | PM2.5 |
|---|---|---|---|---|---|---|---|---|---|---|---|
| Jan | 0.08 | −0.18 | −0.30 * | 0.07 | −0.07 | −0.14 | −0.39 ** | −0.18 | −0.14 | −0.47 ** | −0.53 ** |
| Feb | −0.08 | 0.81 ** | 0.28 | −0.90 ** | 0.15 | −0.03 | −0.45 * | −0.10 | −0.63 ** | −0.26 | −0.77 ** |
| Mar | 0.31 | −0.06 | 0.39 * | −0.10 | 0.28 | 0.21 | 0.19 | 0.21 | 0.02 | 0.29 | 0.11 |
| Apr | −0.38 | 0.25 | −0.03 | −0.27 | 0.28 | −0.24 | −0.14 | −0.24 | −0.09 | 0.16 | −0.09 |
| May | 0.73 ** | 0.47 | −0.16 | −0.79 ** | 0.20 | −0.29 | 0.19 | −0.12 | 0.25 | −0.14 | −0.30 |
| Jun | 0.16 | 0.17 | 0.26 | −0.16 | 0.13 | −0.22 | −0.26 | −0.25 | −0.17 | −0.14 | −0.04 |
| Jul | 0.15 | 0.29 | 0.46 * | −0.23 | −0.08 | −0.18 | −0.09 | −0.18 | −0.01 | −0.25 | −0.31 |
| Aug | −0.32 | 0.32 | −0.30 | −0.41 | 0.96 ** | −0.37 | −0.27 | −0.35 | 0.52 | −0.21 | −0.06 |
| Sep | 0.05 | 0.05 | −0.15 | −0.17 | −0.03 | −0.21 | 0.09 | −0.16 | 0.00 | −0.17 | −0.11 |
| Oct | 0.02 | 0.10 | 0.14 | −0.27 | −0.07 | 0.18 | 0.03 | 0.16 | 0.25 | 0.18 | −0.13 |
| Nov | −0.07 | −0.05 | 0.32 ** | 0.21* | −0.09 | −0.05 | −0.39 ** | −0.10 | −0.38 ** | −0.24 ** | −0.51 ** |
| Dec | 0.13 | −0.33 ** | −0.02 | 0.28 ** | −0.11 | −0.11 | −0.40 ** | −0.17 * | −0.19 * | −0.41 ** | −0.49 ** |
| total | 0.15 ** | 0.51 ** | −0.38 ** | −0.30 ** | 0.12 ** | −0.20 ** | −0.44 ** | −0.25 ** | −0.41 ** | −0.15 ** | −0.63 ** |
| NO2 | NOx | PM10 | PM2.5 | |
|---|---|---|---|---|
| wind | −0.20 ** | −0.34 ** | −0.02 | −0.19 ** |
| temp | −0.26 ** | −0.29 ** | 0.08 | −0.45 ** |
| slp | 0.28 ** | 0.30 ** | −0.04 | 0.33 ** |
| RH | 0.03 | 0.18 * | −0.01 | 0.28 ** |
Disclaimer/Publisher’s Note: The statements, opinions and data contained in all publications are solely those of the individual author(s) and contributor(s) and not of MDPI and/or the editor(s). MDPI and/or the editor(s) disclaim responsibility for any injury to people or property resulting from any ideas, methods, instructions or products referred to in the content. |
© 2025 by the authors. Licensee MDPI, Basel, Switzerland. This article is an open access article distributed under the terms and conditions of the Creative Commons Attribution (CC BY) license (https://creativecommons.org/licenses/by/4.0/).
Share and Cite
Karami, S.; Ghassabi, Z.; Khoddam, N.; Habibi, M. Investigating Meteorological Factors Influencing Pollutant Concentrations and Copernicus Atmosphere Monitoring Service (CAMS) Model Forecasts in the Tehran Metropolis. Atmosphere 2025, 16, 264. https://doi.org/10.3390/atmos16030264
Karami S, Ghassabi Z, Khoddam N, Habibi M. Investigating Meteorological Factors Influencing Pollutant Concentrations and Copernicus Atmosphere Monitoring Service (CAMS) Model Forecasts in the Tehran Metropolis. Atmosphere. 2025; 16(3):264. https://doi.org/10.3390/atmos16030264
Chicago/Turabian StyleKarami, Sara, Zahra Ghassabi, Noushin Khoddam, and Maral Habibi. 2025. "Investigating Meteorological Factors Influencing Pollutant Concentrations and Copernicus Atmosphere Monitoring Service (CAMS) Model Forecasts in the Tehran Metropolis" Atmosphere 16, no. 3: 264. https://doi.org/10.3390/atmos16030264
APA StyleKarami, S., Ghassabi, Z., Khoddam, N., & Habibi, M. (2025). Investigating Meteorological Factors Influencing Pollutant Concentrations and Copernicus Atmosphere Monitoring Service (CAMS) Model Forecasts in the Tehran Metropolis. Atmosphere, 16(3), 264. https://doi.org/10.3390/atmos16030264