Article

New Insights into Earthquake Light: Rayleigh Scattering as the Source of Blue Hue and a Novel Co-Seismic Cloud Phenomenon

1
Whitehead Associates, 54 Redvers Drive, Lower Hutt 5010, New Zealand
2
Department of Physics Engineering, Faculty of Engineering, Hacettepe University, 06800 Çankaya, Ankara, Turkey
*
Author to whom correspondence should be addressed.
Atmosphere 2025, 16(3), 277; https://doi.org/10.3390/atmos16030277
Submission received: 20 January 2025 / Revised: 19 February 2025 / Accepted: 21 February 2025 / Published: 26 February 2025

Abstract

:
The New Zealand Kaikoura Earthquake (Mw 7.8, 14 November 2016) produced co-seismic flashes of earthquake light near the ground at midnight, 230 km north of the epicentre. Mostly, there was a white hemisphere in the atmosphere just above the ground, up to 250 m radius, the colour becoming radially increasingly dark blue. Fifteen videos were available for analysis which led to the following new or reaffirmed conclusions: (i) the blue colour is due to Rayleigh Scattering (new explanation); (ii) the light also sometimes occurs within low clouds but not as lightning—this is a new classification of earthquake light; (iii) the lithology may be greywacke, broadening previous literature emphasis on igneous sources; (iv) the light is most probably explained in our study area by seismically pressured microscopic quartz producing electric fields emerging into the atmosphere and reacting with it—mechanisms relying on particle-grinding or creation of cracks in rock are unlikely in the study area; (v) within the Wellington study area, the light is mostly independent of faults or their movement and is caused by seismic impulses which have travelled hundreds of kilometres from the epicentre—this possible independence from faults has not been clearly emphasised previously; and (vi) electrical grid problems are not the explanation.

1. Introduction

The aim of this paper was to collate and comment on ground observations of earthquake light either on ground, or in the air mostly from video observations at Wellington, New Zealand, during a 2016 Mw 7.8 earthquake with the epicentre 230 km distant, and to see if the videos confirm or contradict assertions in older papers. It will be shown they also recorded some co-seismic flashes in clouds which were not lightning. This observational method was necessary because earthquake light is not experimentally created and one must wait for accidental video recordings. However, observation leads slowly to better understanding, and this paper presents at least six small advances. Some improvement may also come from interviews with eyewitnesses, though this is best treated as confirmatory evidence.

1.1. Previous Earthquake Light Study
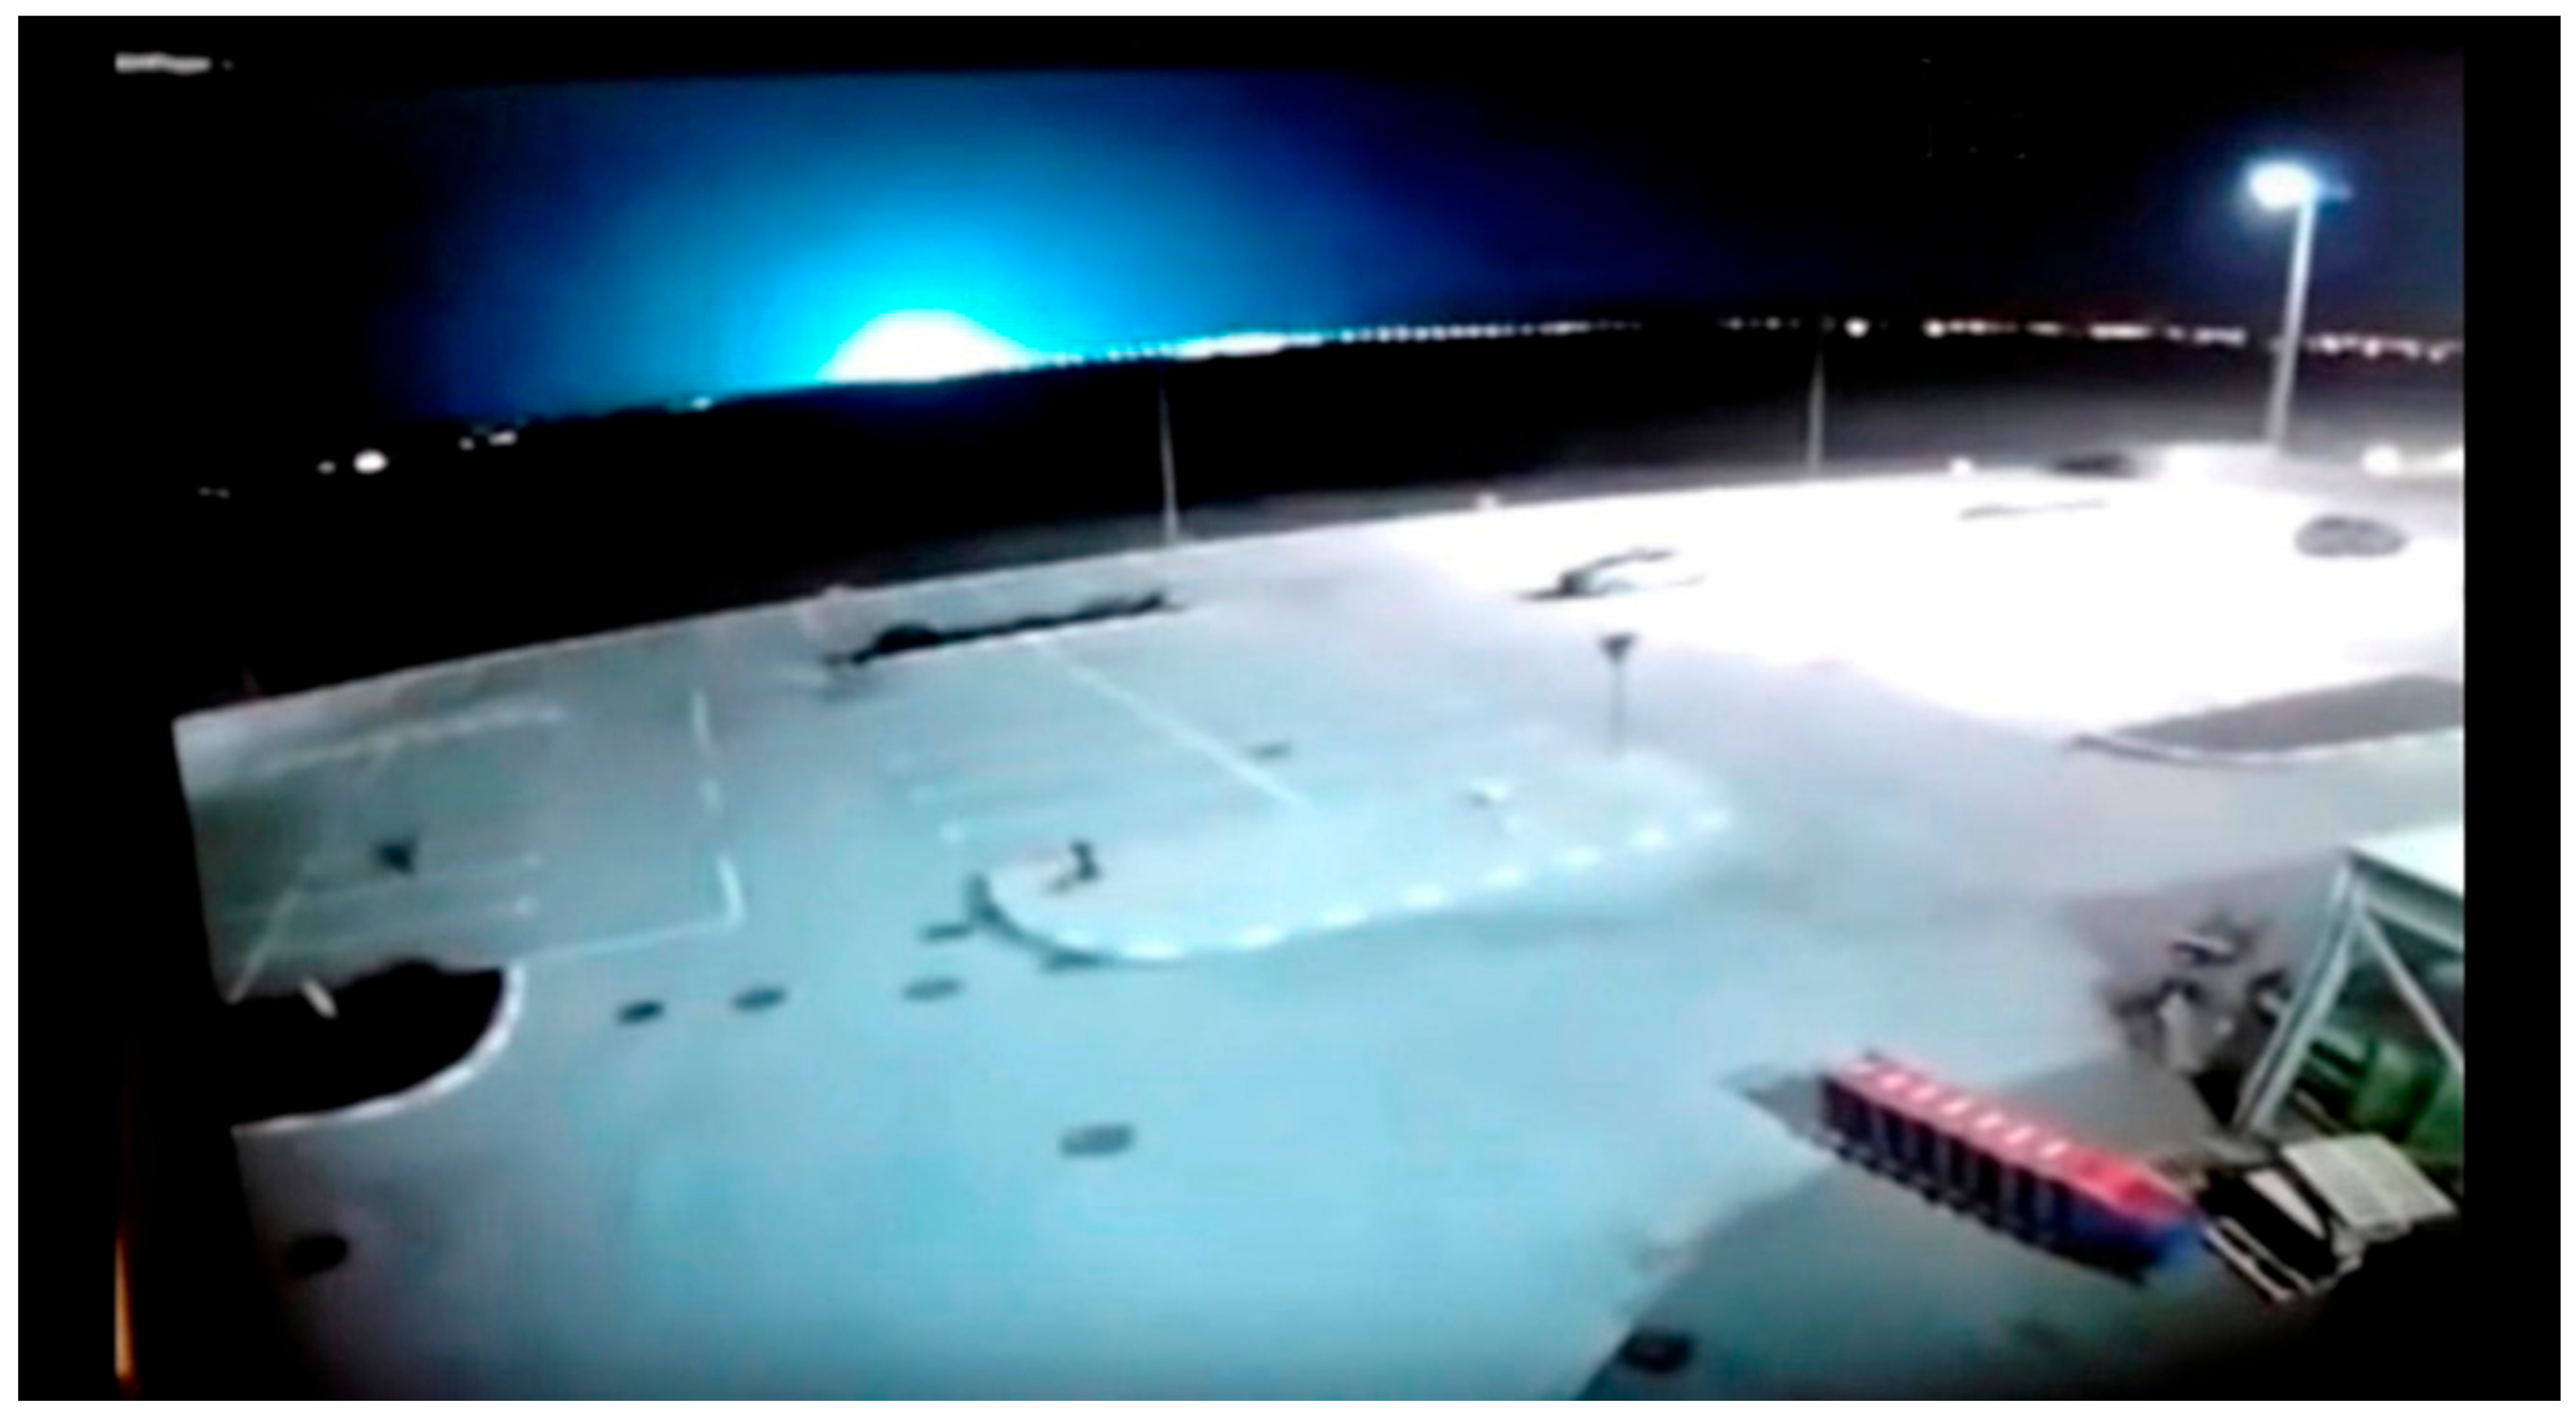
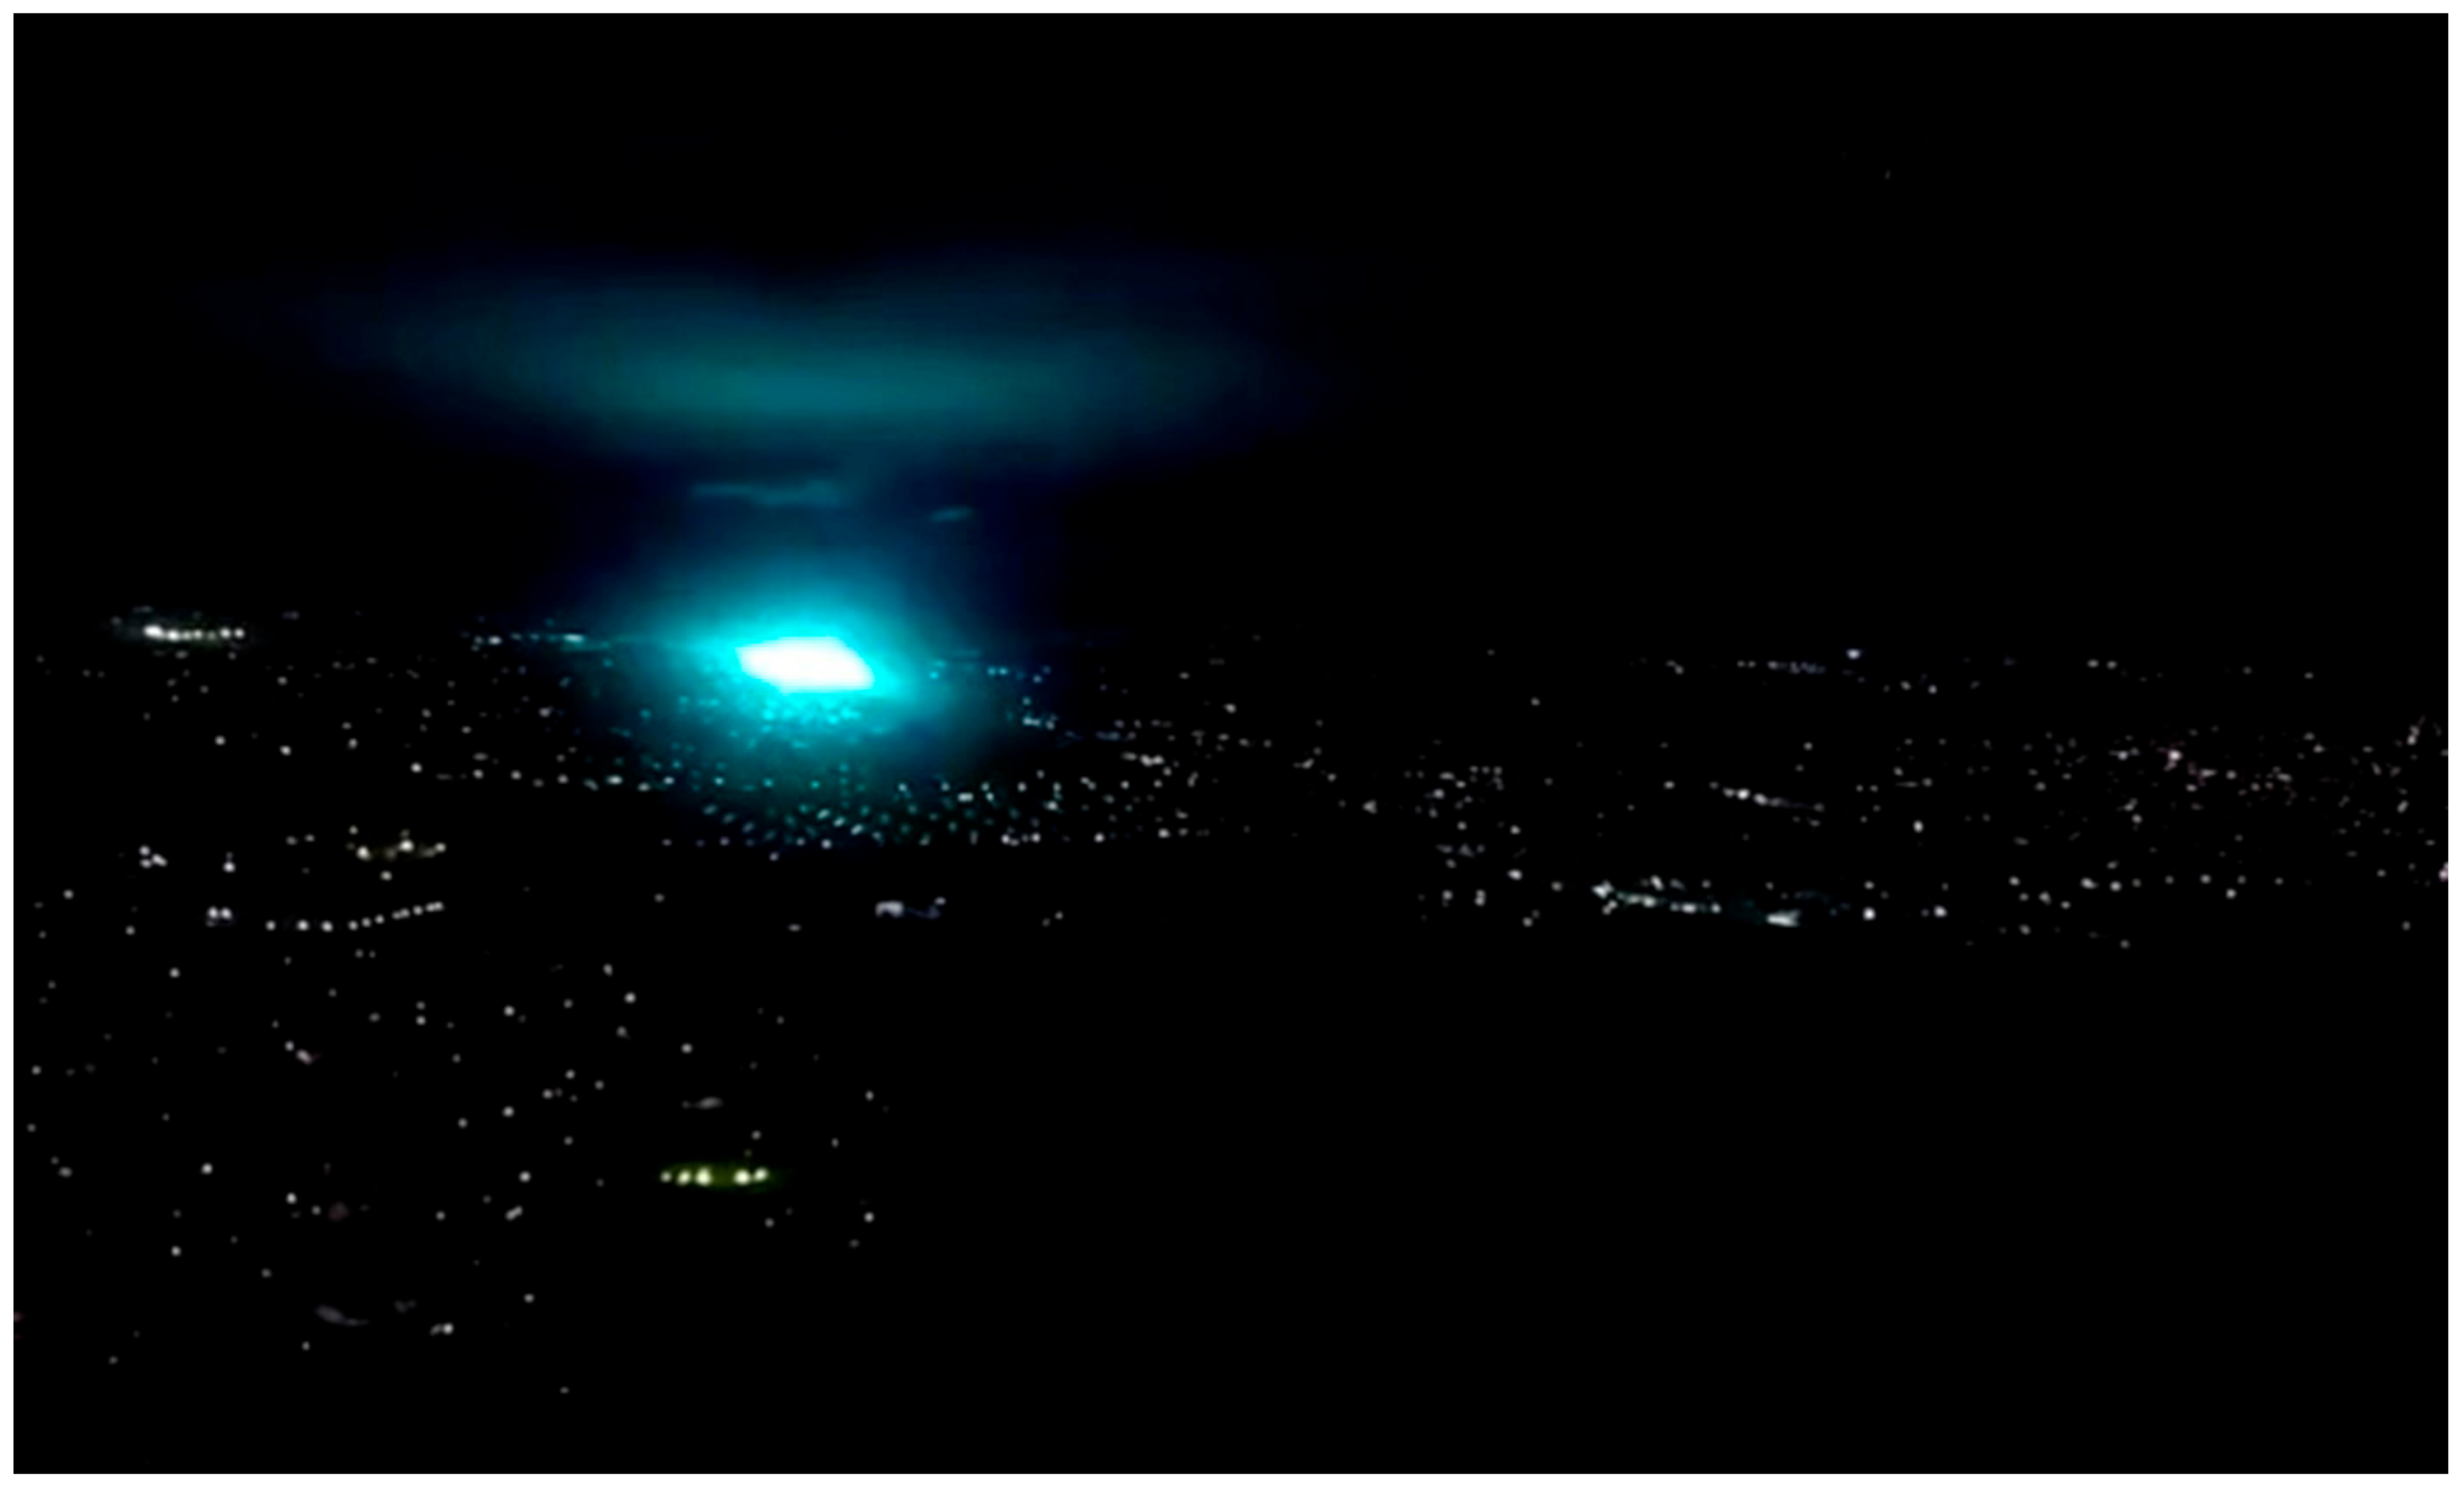
During earthquakes at night, there are sometimes flashes of light from the ground, discussed in various reviews of eyewitness sightings [1]. According to summaries [2] citing [3,4], and the observations in [1,5], the centre of a flash is usually a white hemisphere on the ground, with a radius (20–200 m) as in Figure 1 and Figure 2, and grading to darker blue for the outer layers. According to [1], flashes measured up to 2019 have a mean length of 0.59 s. Some papers describe long-lasting glows of various colours but these are much rarer than flashes and not found in the videos of this study.
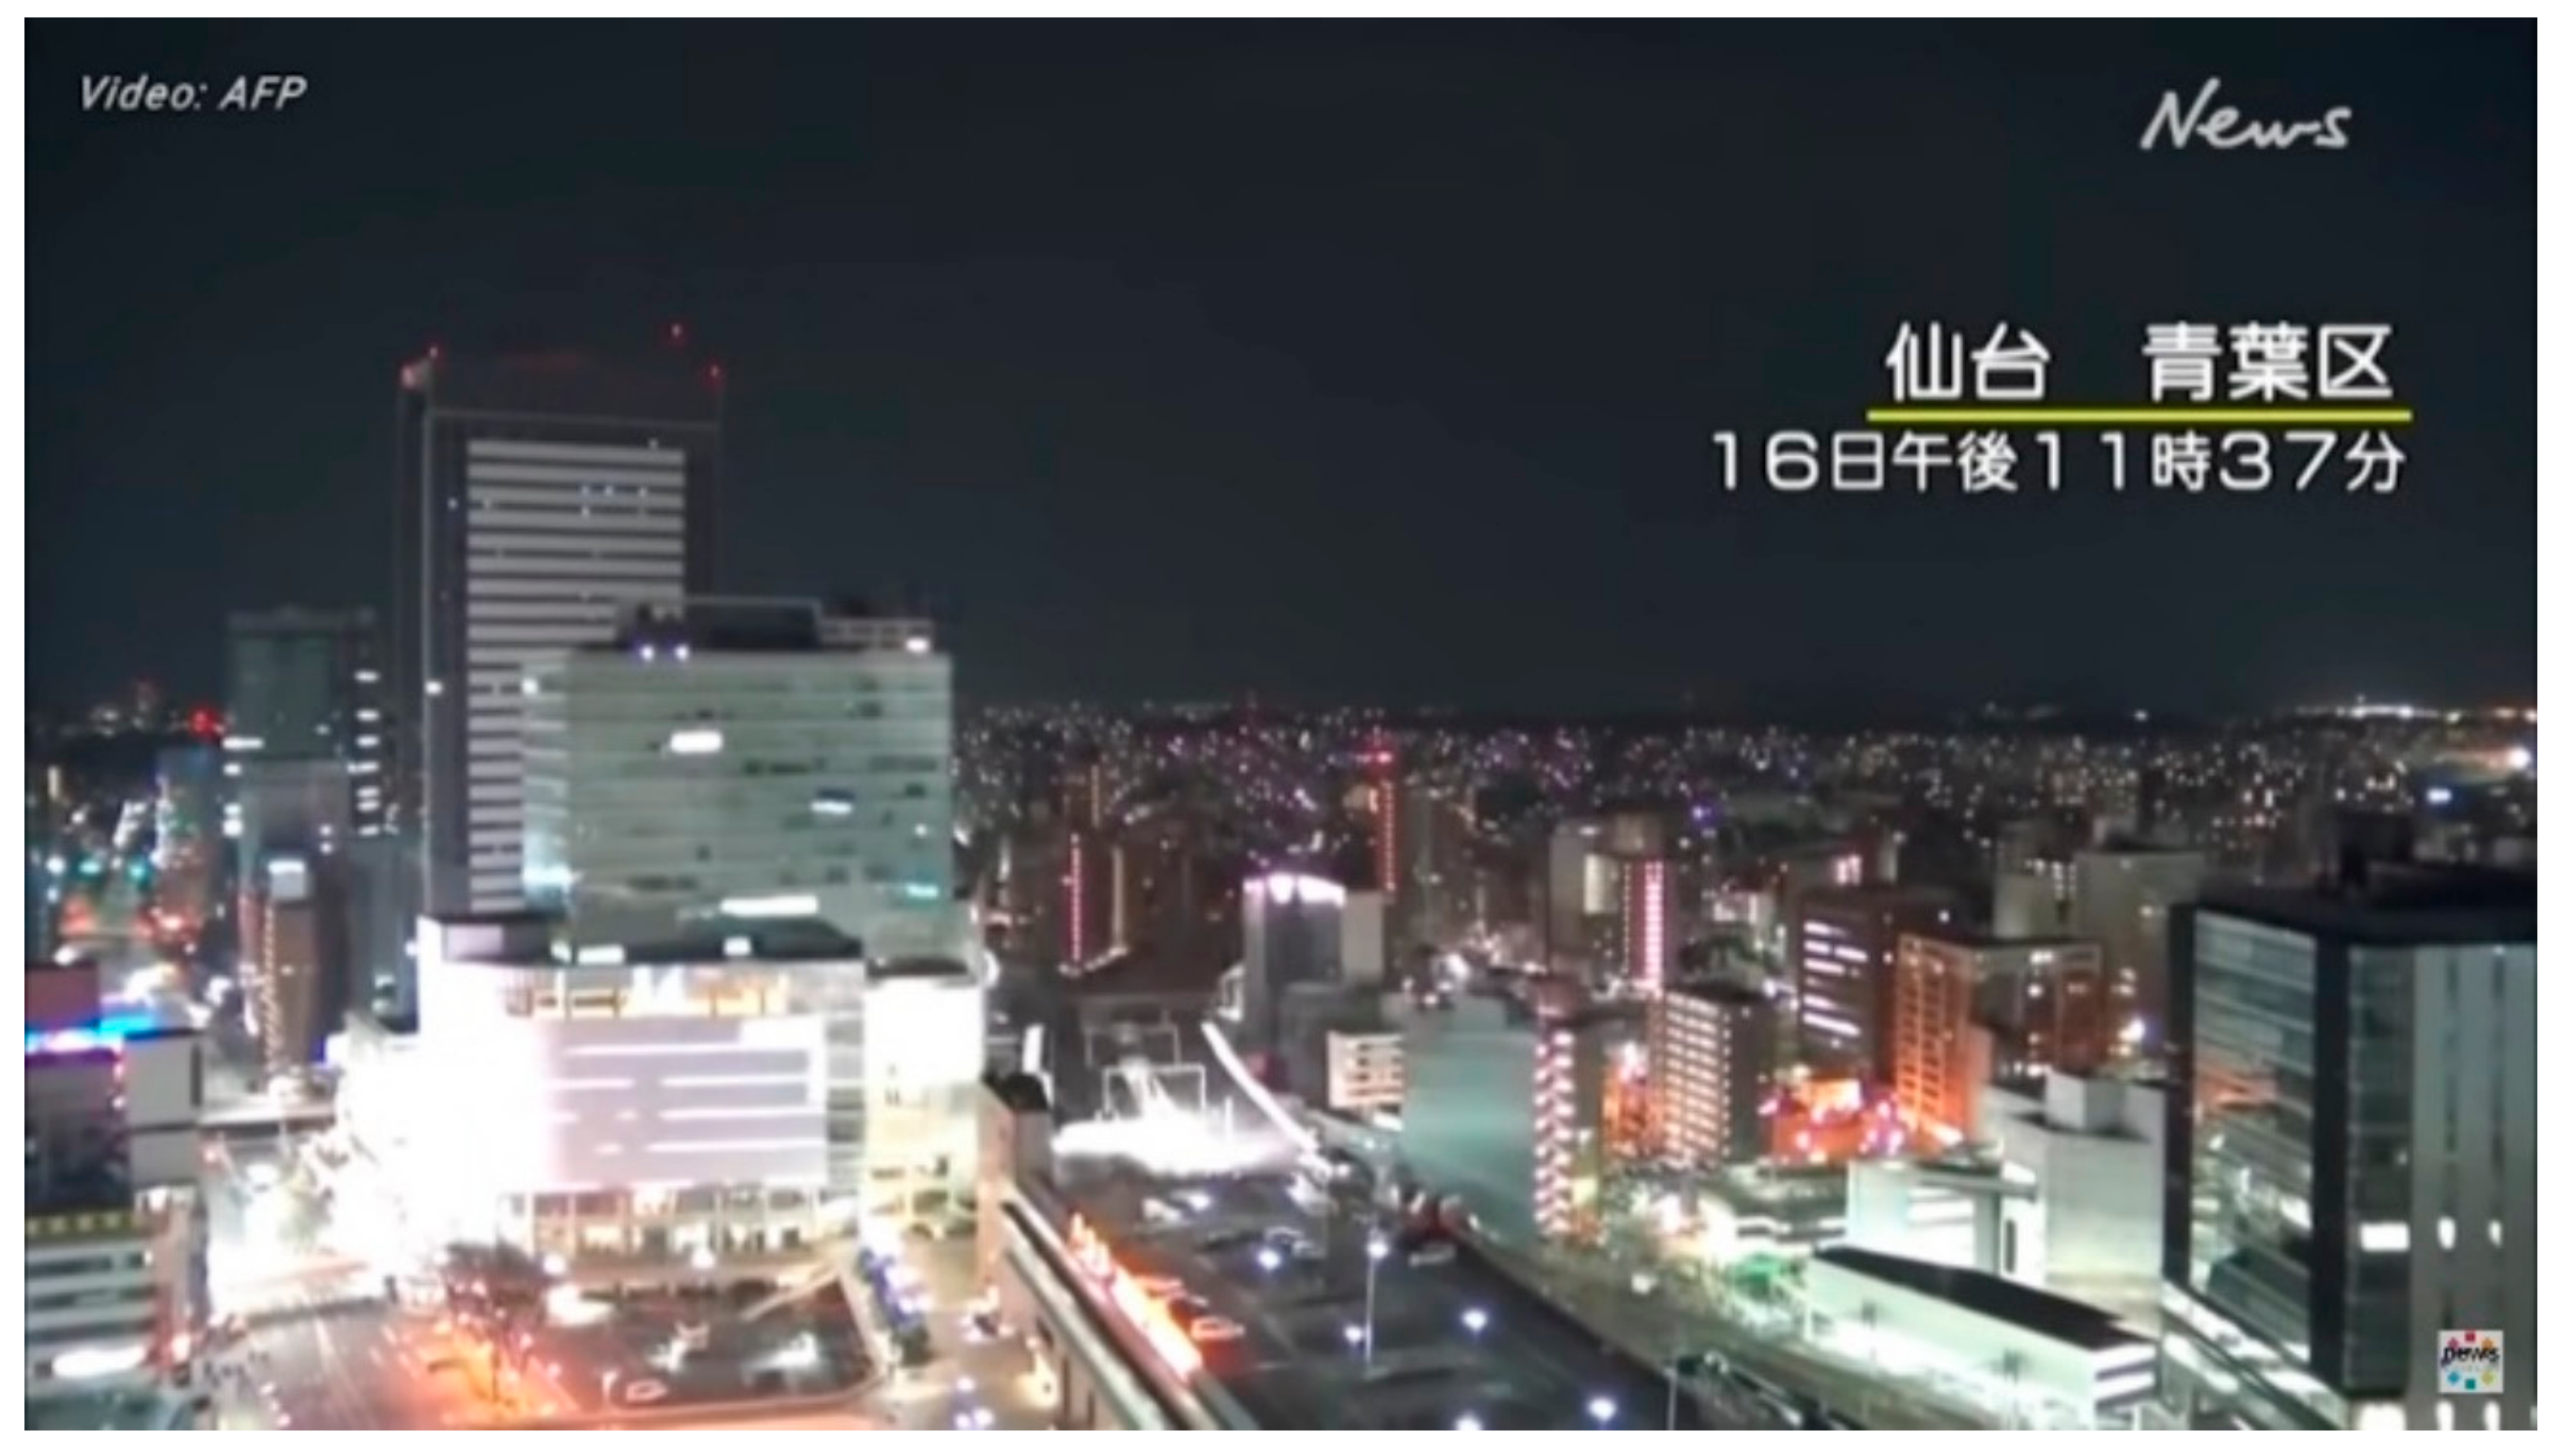
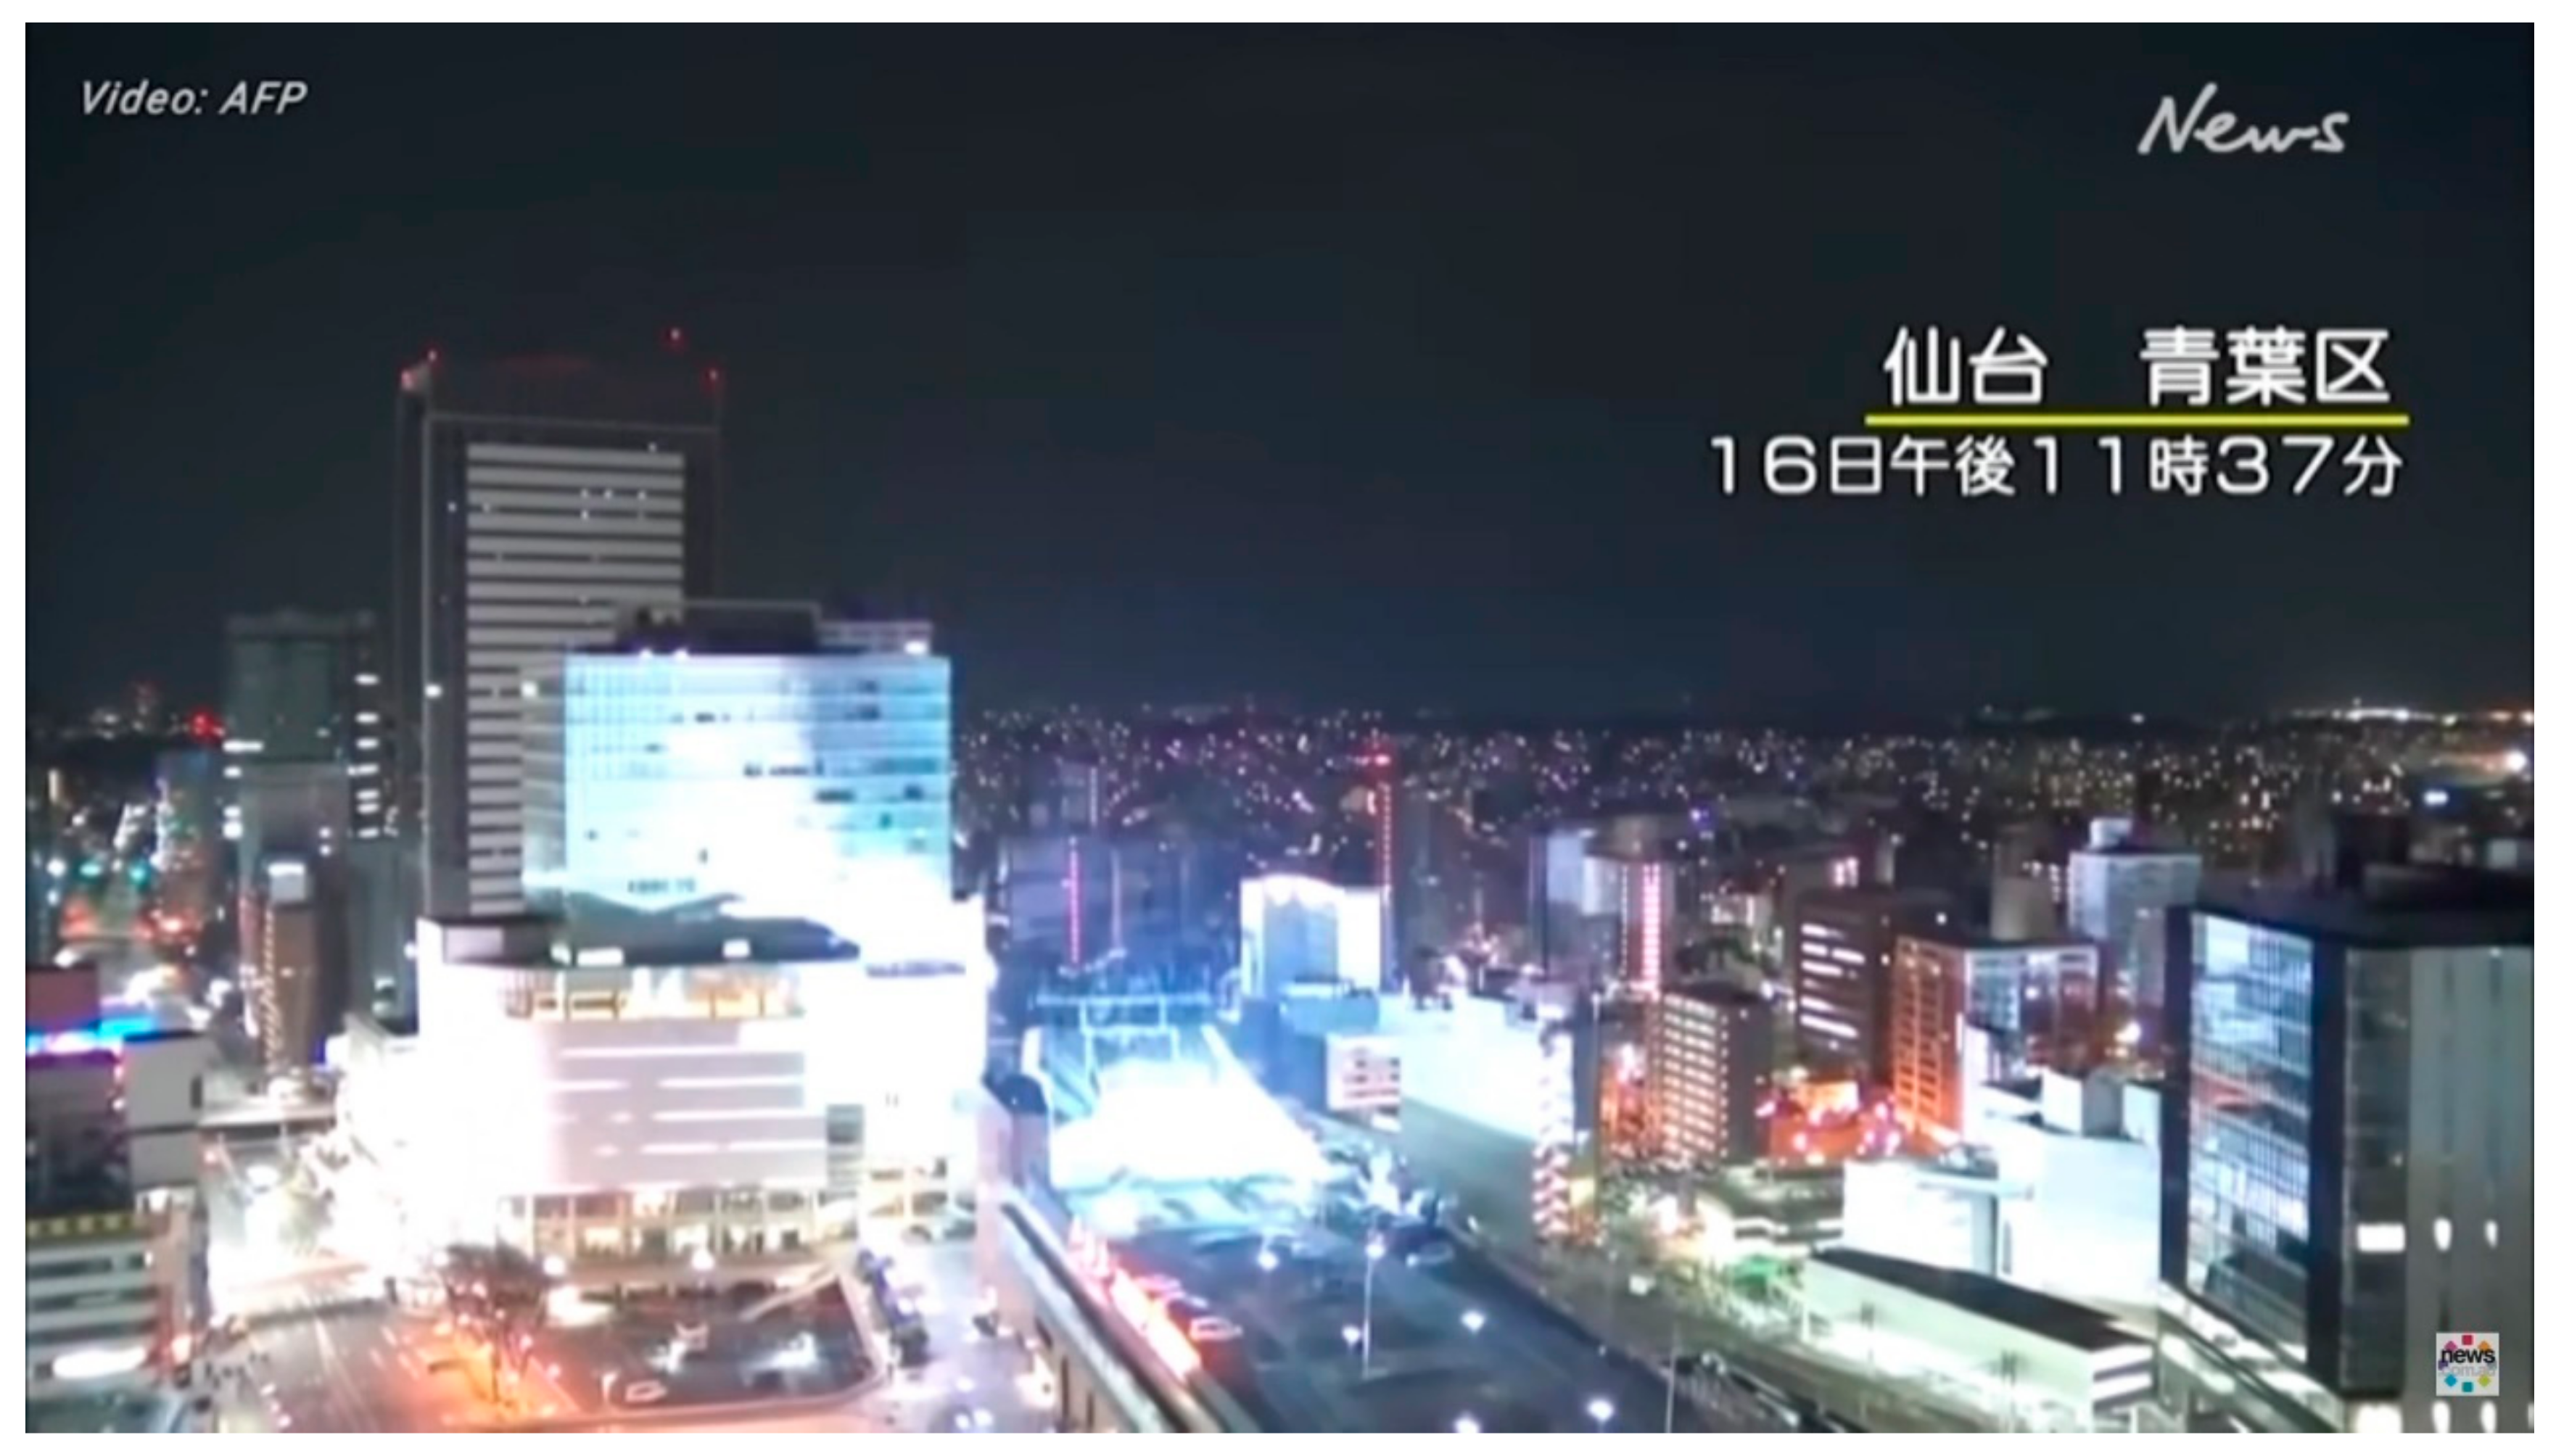
Examples of the most common and basic examples of this light are shown in Figure 1, Figure 2, Figure 3, Figure 4, Figure 5, Figure 6 and Figure 7, shown because readers may be less familiar with the phenomenon. The Figures are individual frames selected from older video examples following the criteria for authenticity in [1].
All the earthquake light colours described in this paper are varying combinations of Red/Green/Blue (RGB) on three scales of 0–255, derived using the “eyedropper” analysis tool in Photoshop™. These colour classifications based on RGB values, such as “sky-blue”, are from [6]. Asterisks alongside a reference indicate an available video source on the web (as of July 2023).
Figure 1. Romanian earthquake light (MW 5.8, 24 September 2016, 02:11 local time) [7].
Atmosphere 16 00277 g001
Figure 2. Mexico City earthquake light (MW 7.1, 7 September 2017, 23:49 local time), [8]*; earthquake light with some illumination of clouds. White centre. Outer layers RGB (red–green–blue) 146, 241, 255, sky-blue. This is an uncommon example of an elongated flash.
Atmosphere 16 00277 g002
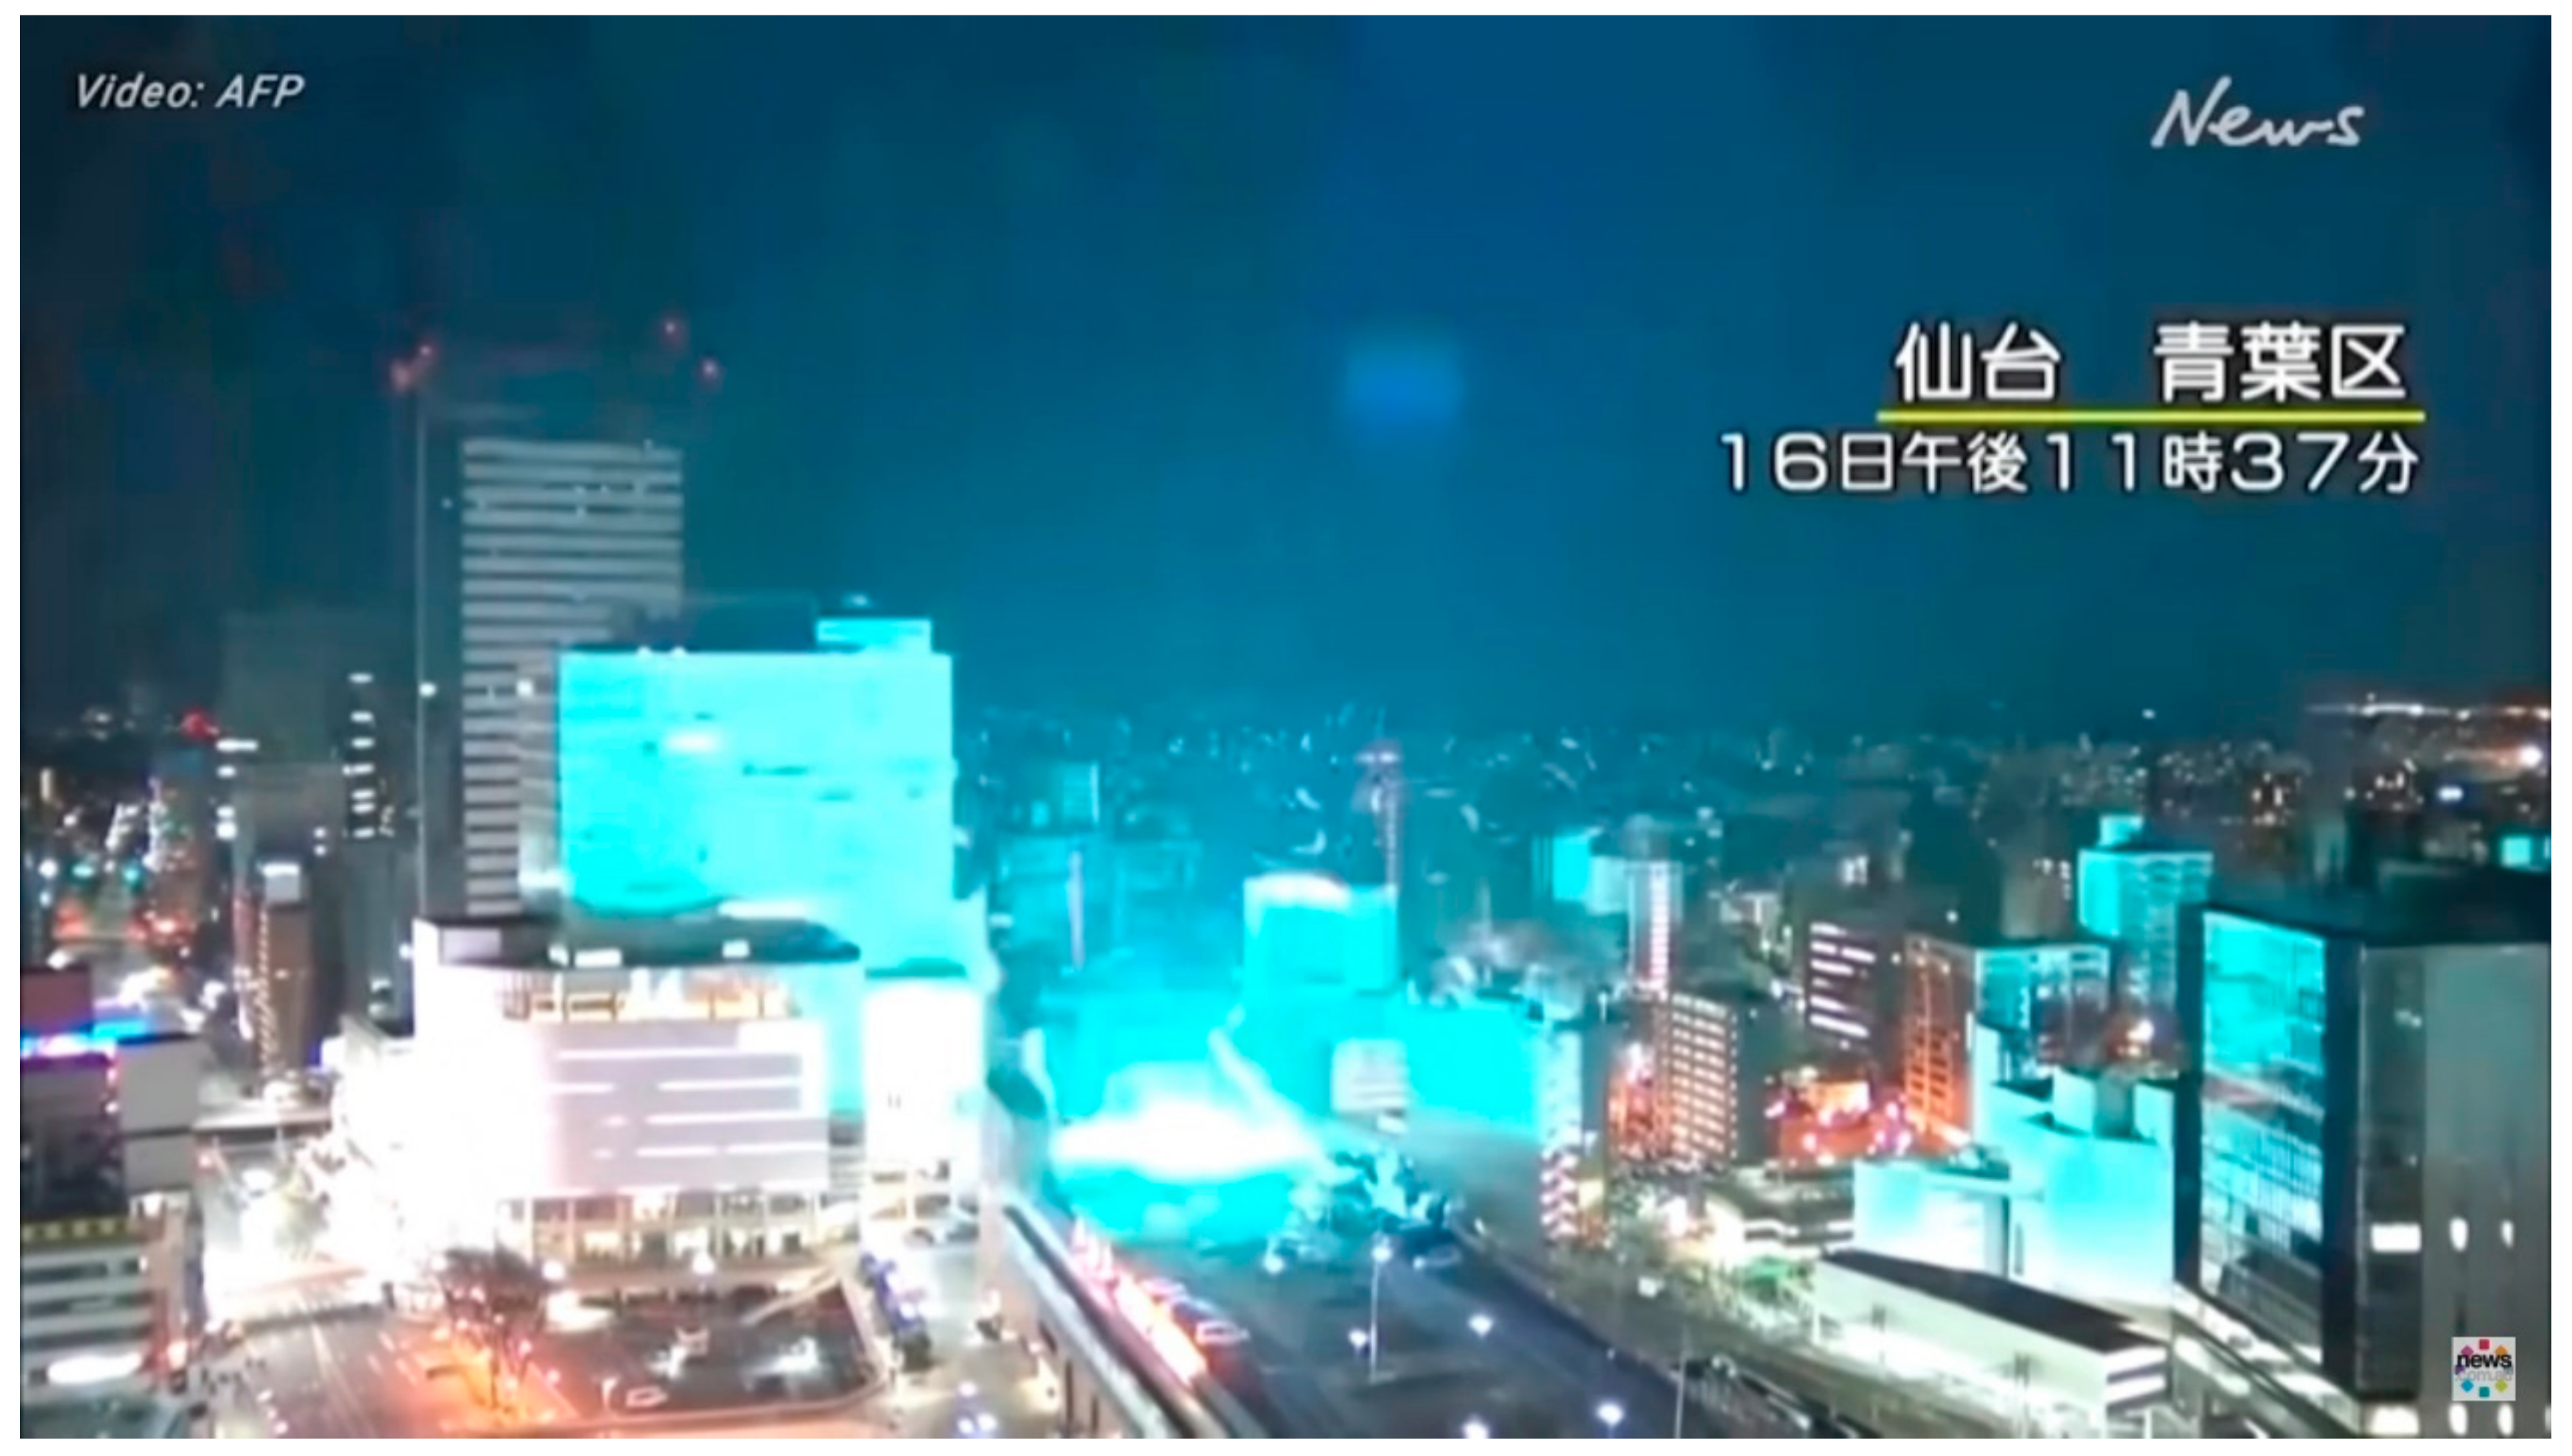
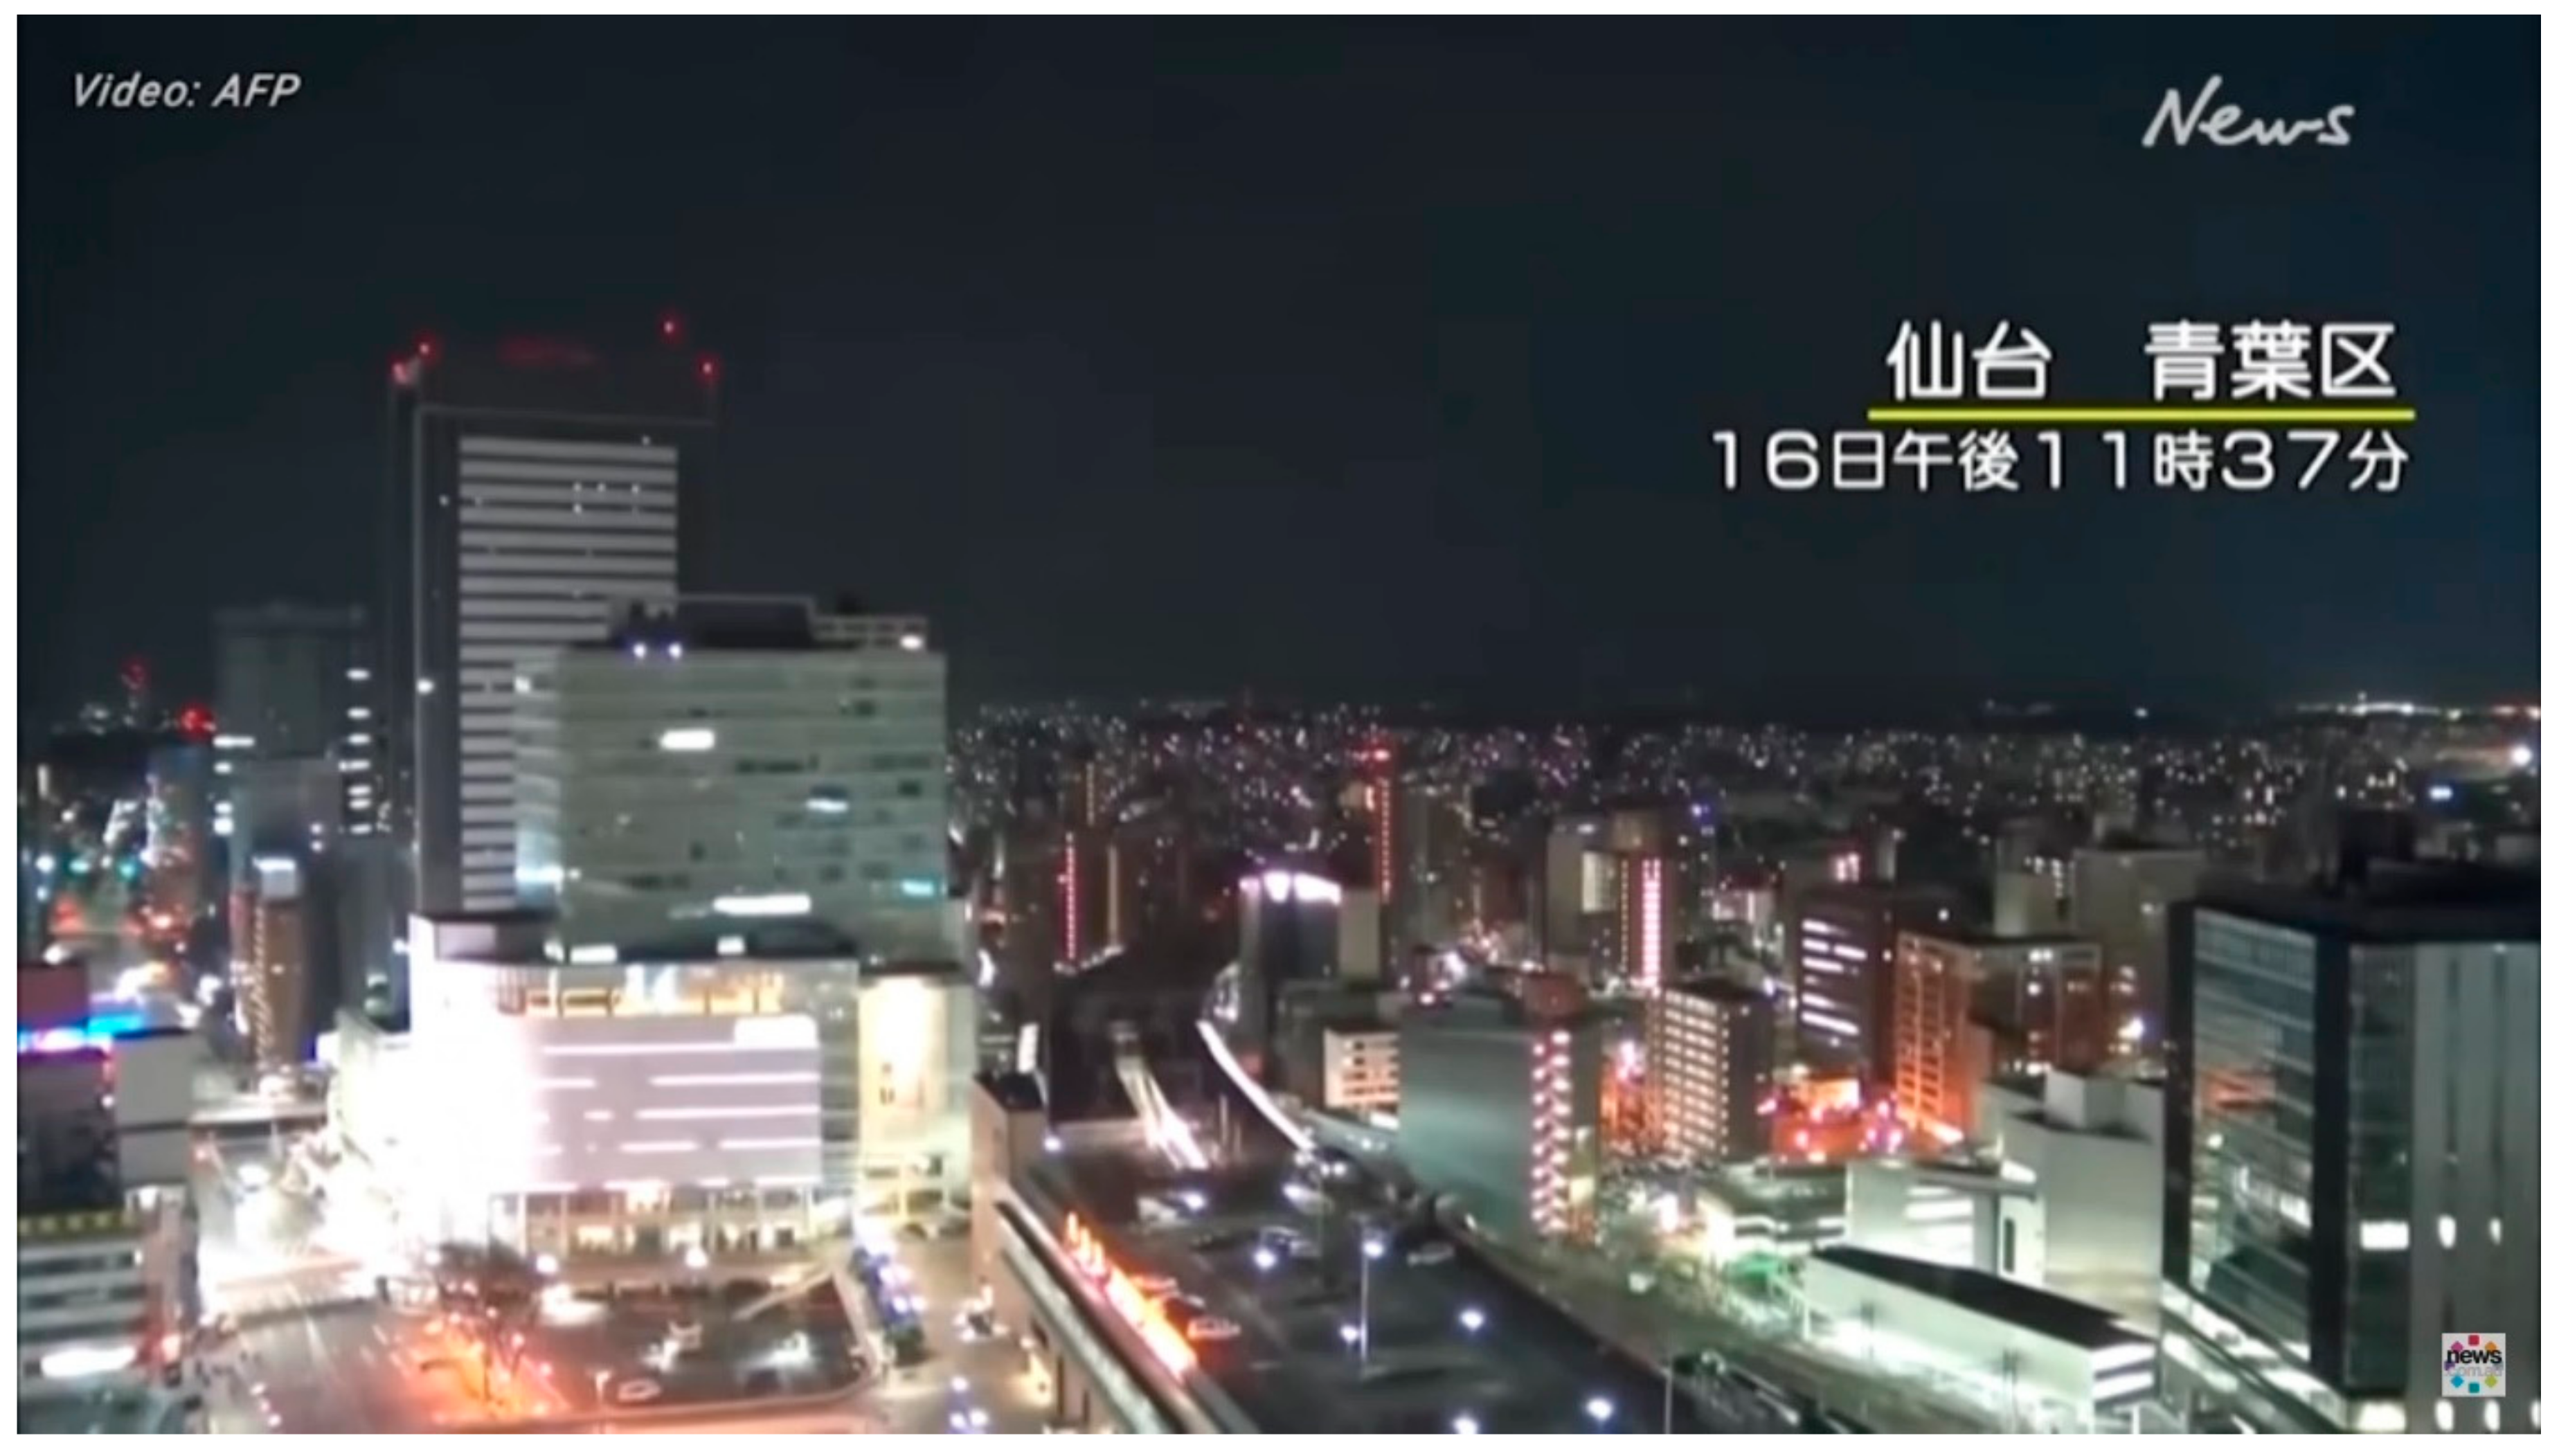
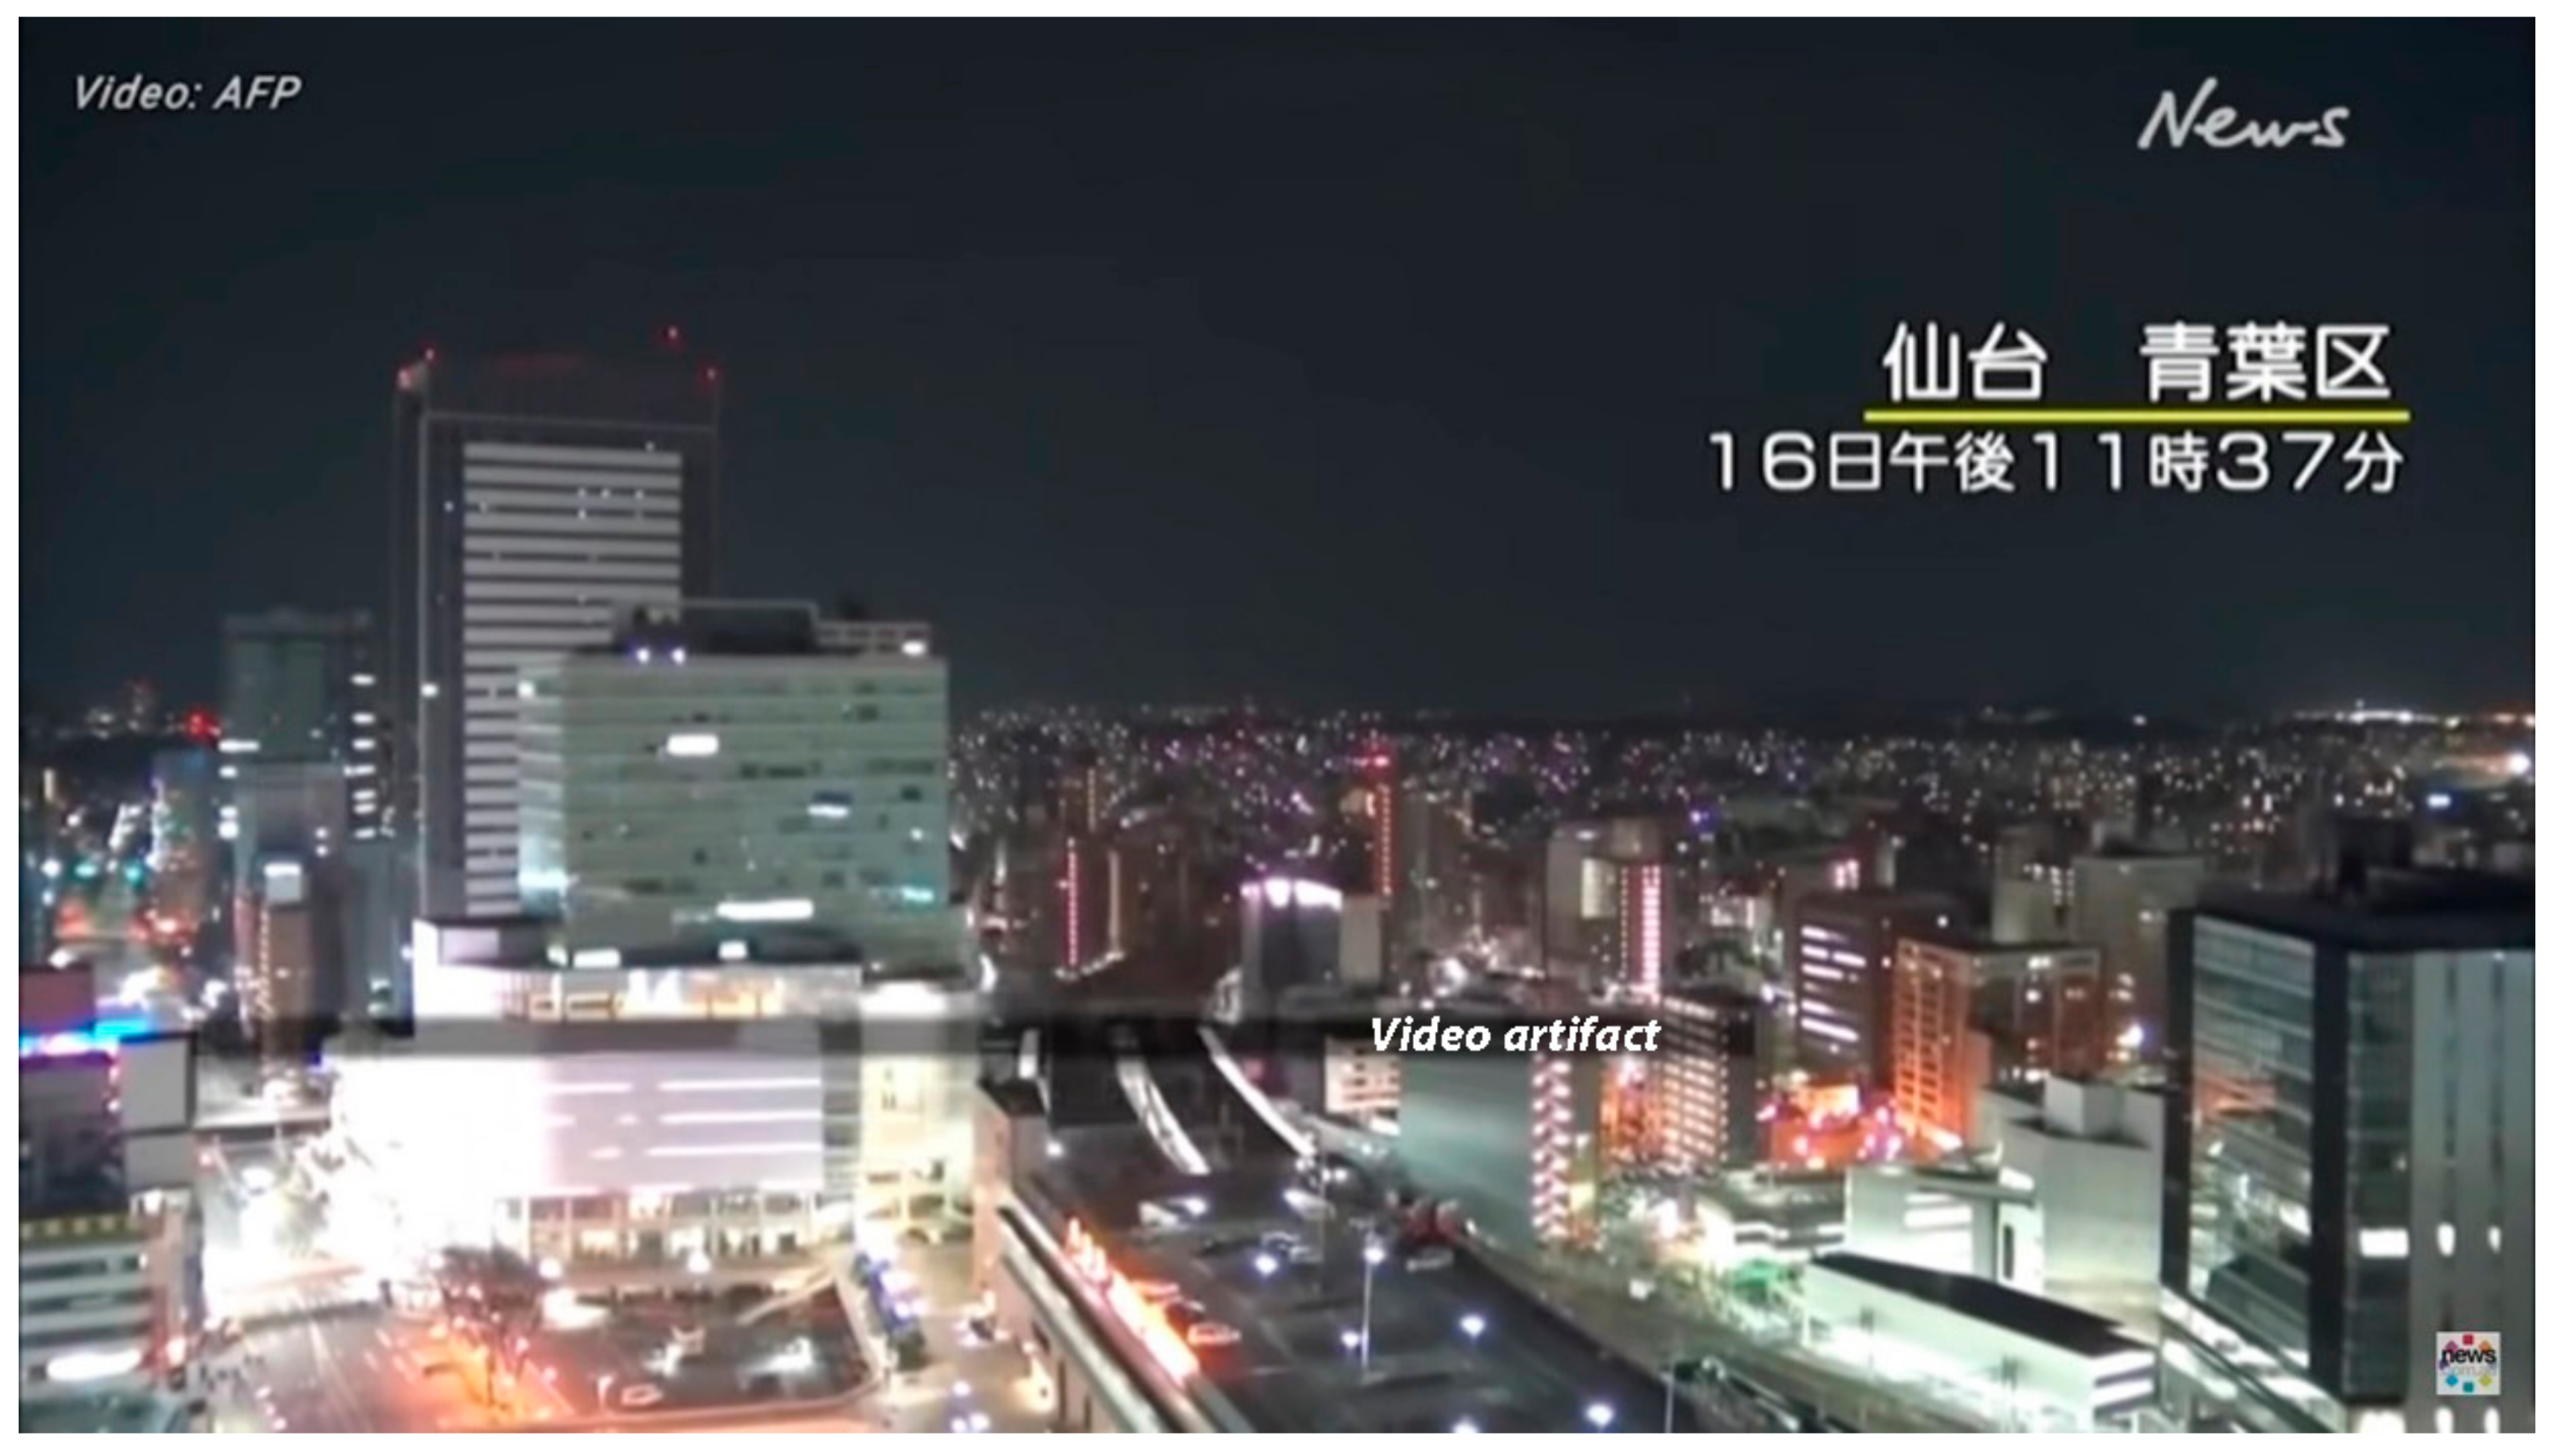
The following previously unpublished example from Sendai, Japan [9]*, shows sequential frames of a video (Figure 3, Figure 4, Figure 5, Figure 6 and Figure 7) in which earthquake light appears in the centre of a road, illuminates buildings and then rapidly disappears. Co-seismic magnetic data, and other useful data, are given in [10]. Japanese characters describe the city location and date.
Figure 3. Sendai City (Fukushima Prefecture) before earthquake light. (Mw 7.4, 16 March 2022, 23:37 local time) View to north-west. Black horizontal bar is a video artefact but it is not clear at what stage it was introduced.
Atmosphere 16 00277 g003
Figure 4. A patch of light on the road 0.03 s later.
Atmosphere 16 00277 g004
Figure 5. Patch enlarges 0.03 s later.
Atmosphere 16 00277 g005
Figure 6. Patch intensifies, RGB 103, 245, 248, pale turquoise. A blue video artefact is in the sky 0.03 s later.
Atmosphere 16 00277 g006
Figure 7. Light disappears 0.03 s later.
Atmosphere 16 00277 g007
The overall impression is of a pale blue flash.
Papers from before the year 2000 create the impression that the light occurs by movement on geological faults, as in, e.g., [3], and is mostly near faults or on them. They imply that the light will be most intense near the epicentre, though some of the above papers in the reviews describe observations from several tens of kilometres distant [4]. The papers similarly give the impression that igneous rock is important [11], because many historical observations were on igneous rock, and many laboratory studies used igneous rocks, though they did not exclude the possibility of earthquake light on other types of rock. More recent papers have expanded the range of suitable rock to greywacke [1,12] and marble [5].
Historical interpretation apart from eyewitness testimony has mostly relied on a few still photos and sketches [3,13]. During the last two decades, security videos have allowed for much better analysis. A review [1] of the 80 international videos available established criteria to distinguish earthquake light from light created by other sources, including flashovers or explosions in the electrical grid. The criteria for probable earthquake light were that light should be co-seismic, pale bluish in colour, roughly hemispherical in shape if on the ground, last less than a few seconds, and have no accompanying fire, storm, thunder, or obvious electrical grid origin, and no continuing fire after the earthquake [1].
Many more earthquake light videos are available from earthquakes at Mexico City (Mw7.1, 7 September 2021) [14]*, Japan (Mw6.6, 22 January 2022) [15])*, and from about 100 recent video records (M7.8 and smaller) from the 2023 Turkish earthquakes [5].
Flashes are much more common than static glows, and the present paper concentrates on recent occurrences in New Zealand of flashes during the 2016 Kaikoura Mw 7.8 earthquake and what those flashes imply. The current paper mostly discusses co-seismic light because the literature database for alleged pre- or post-seismic light needs much more detailed discussion, but appears less common.
There are also rather uncommon but known occurrences of earthquake light above shallow ocean water and within it [2,12,16]. Detailed discussion is deferred until many more oceanic examples are available in the literature, though this paper will document a few more examples.

1.2. Theories on the Origin of Earthquake Light

There are several mechanisms in the literature to explain the origin, and the present paper particularly considers three which have received much recent consideration.
Mechanism 1. Charge separation. This is stated to occur in quartz at the molecular scale during seismic stresses. Normally the quartz structure is -Si-O-Si- in three dimensions, but in minor amounts, there exists a peroxy bond: -Si-O-O-Si-. If this is ruptured under extreme seismic stress, negative charge is trapped at the ruptured peroxy bonds and a wave of positive charge is generated. These are actually electronic “holes”. Laboratory studies show the wave reaches the ground surface at high speeds of ≤200 m/s, but in the atmospheric environment this may be ten times higher. Electrons alone would not have the penetrative power to reach the surface. Positive charge will interact with air to strip electrons. The air molecules regain electrons from surrounding air, and the many complex reactions produce a wide range of wavelengths of light, hence the white colour. This process results in temporary charge separation between the quartz and the ground surface; the charge distribution is unstable and results in rapid recombination and neutralisation within a few seconds. The theory is based on many laboratory studies and interpretations, and also considers pre-earthquake processes, not relevant here [17,18,19,20,21,22,23].
The rock material could potentially be any silicate, not just quartz. The wave of charge from the quartz would most likely be spherical towards the surface, creating a dome of light on the surface and the deeper the initiation, the larger the surface area impacted. It is estimated that the depth is unlikely to be greater than 5 km [10].
Mechanism 2. Triboluminescence. Generation of voltages and light occurs by mineral particles grinding together [24,25,26,27,28,29,30]. The authors reported the light occurred during laboratory studies, and it is well known from many environmental settings including volcanic eruption [31] and landslides [2]. In a seismic setting, grinding during earth fissures might create light and light is indeed sometimes observed from fissures during earthquakes [12]. The light would be primarily produced from the mineral particles rather than the air. As a secondary effect, electronic holes, as in the Freund mechanism, might be produced through friction, but this seems likely to be a lesser effect.
Mechanism 3. Charge induction [32]. This recently suggested mechanism starts with charge separation created by horizontal cracks in deep rock originating through seismic forces. It is theorised that negative and positive charges might be created either side of such a crack, above and below. Next, the separated charges are mirrored by very rapid induction steps through which electric charge reaches the surface of the earth and creates the light by interaction with air, as described above under mechanism 1. The theory is also consistent with laboratory studies. Whether positive or negative charge reaches the surface would seem to be random.
This field which studies mechanisms is actively being researched and other mechanisms for earthquake light may be proposed in future.

2. Methods

2.1. The Kaikoura Earthquake

This earthquake was the origin of the earthquake light described in this paper. It was MW 7.8, 14 November 2016, 00:02 local time. The epicentre was in the South Island of New Zealand [33], 60 km south-west of Kaikoura (Figure 8) at Culverden (42.77° S, 172.84° E), approximately 15 km deep, and no flashes of earthquake light were observed there (Pers. Comm. from local residents). The nearest earthquake light was a video of a flash of indirect pale blue light 20 km north [34]*.
Ruptures occurred on a number of fault lines over a distance of about 200 km, in a complex northwards sequence that lasted for about two minutes. More than 20 faults sequentially ruptured and this is the highest number ever recorded world-wide for a single extended seismic event. Its size, Mw 7.8, was the second-largest earthquake in New Zealand in history, the first being a North Island MW > 8.2 earthquake in 1855. The largest amount of the energy of the Kaikoura Earthquake was released well to the north of the epicentre and the sequential fault rupture produced seismic force directed even further north [36]. Fault rupture stopped about 50 km south of Wellington, i.e., at Blenheim (Figure 8); it did not occur in the North Island [37], specifically not in the study area. In spite of the differences in surface ruptures, earthquake light was reported not only between the epicentre and Blenheim in the South Island but also in the Wellington region in the North Island. Shaking in Wellington lasted about 2 min. A network of 600 New Zealand seismographs detected the quake [38], and 93 New Zealand stations, in collaboration with records from international seismologists, were used for accurate determination of the magnitude.
The public contributed 15,000 reports of the earthquake strength via the well-established voluntary reporting system maintained by the local Geological and Nuclear Sciences Crown Research Institute, and rated the strength at least moderate-to-strong in almost the whole country [39]. In Wellington, several multi-storey buildings were later demolished because they had become dangerous, and insurance claims totalled nearly NZD 2 billion (USD 1.3 billion). There were two deaths and many examples of earthquake light throughout the country, but light was predominantly recorded and reported near Wellington.
The Wellington area is 230 km north of the epicentre and has a population of 500,000. Many geological faults traverse the area because it is near the junction of the Pacific and Australian tectonic plates. No faults in the Wellington area moved [33]. The area hence at least allows tests from video records, of whether earthquake light can be generated distant from the epicentre, or near local faults. The area is underlain by Torlesse greywacke [40]. The topography is hilly, with parallel valleys, and small quartz veins sometimes occur.

2.2. Archival Data

Digitised past New Zealand newspapers from the National Library were searched for possible mentions of earthquake light to gauge an approximate historical frequency. Approximate time coverage was the last 150 years, but the early sparse population may have led to unreported instances.

2.3. Videos

In the current paper, references to videos, indicated by “*”, are often to a YouTube video, sometimes edited by the present authors to contain a 5× slower segment, making details of the flashes clearer. Many of the original videos become unavailable for various reasons, even in the course of a year, so we urge researchers to archive discovered internet videos immediately. Most of the videos discussed in this paper are from Wellington, New Zealand, and should be viewed via the internet references and associated URLs. The actual colours of earthquake light in single extracted frames in the Figures are described in their captions. Many recent international videos may be found online among the YouTube files, using as keywords Japan, Mexico, Turkey, Chile, Peru, early warning, earthquake, and earthquake light, or local language equivalents. Any original alteration to videos by their authors is not known but was not mentioned in any descriptions.
Security webcams produced most videos, which were retrieved from the internet using a Firefox browser then stored as mp4 files using the WindowsTM 10 feature more usually used for gameplay screen capture. The absence of storm lightning in the New Zealand videos was confirmed by checking public meteorological records [41]. Comments associated with the YouTube videos were searched to find the geographical occurrence of the light.
The radii of the white part of the earthquake lights were found by standard trigonometric methods using information from the videos and the known distances to the flashes.
Detailed colour examination would ideally use real-time spectrophotometry, and avoid video analysis, but the latter is the only data source available at present. Some objective analysis is available via graphics software, but even this has frequency limitations, technically speaking, standard “colour spaces” which may be chosen differently by different software, though most differences are minor. The description of colours in this paper should therefore only be taken as preliminary and software-dependent.
Almost all the videos studied had a frame rate of close to 30 frames a second. This limits the precision when measuring flash lengths to no better than about 16 ms.
Extraction of individual frames in videos was by Adobe Premiere™ 10 Elements, and the determination of RGB values by Adobe Photoshop™ 10. For a selected pixel or area, Photoshop shows the red, green, blue values on a scale of 0–255. The length of flashes was also derived by examination of individual frames using Adobe Premiere™ 10 Elements.
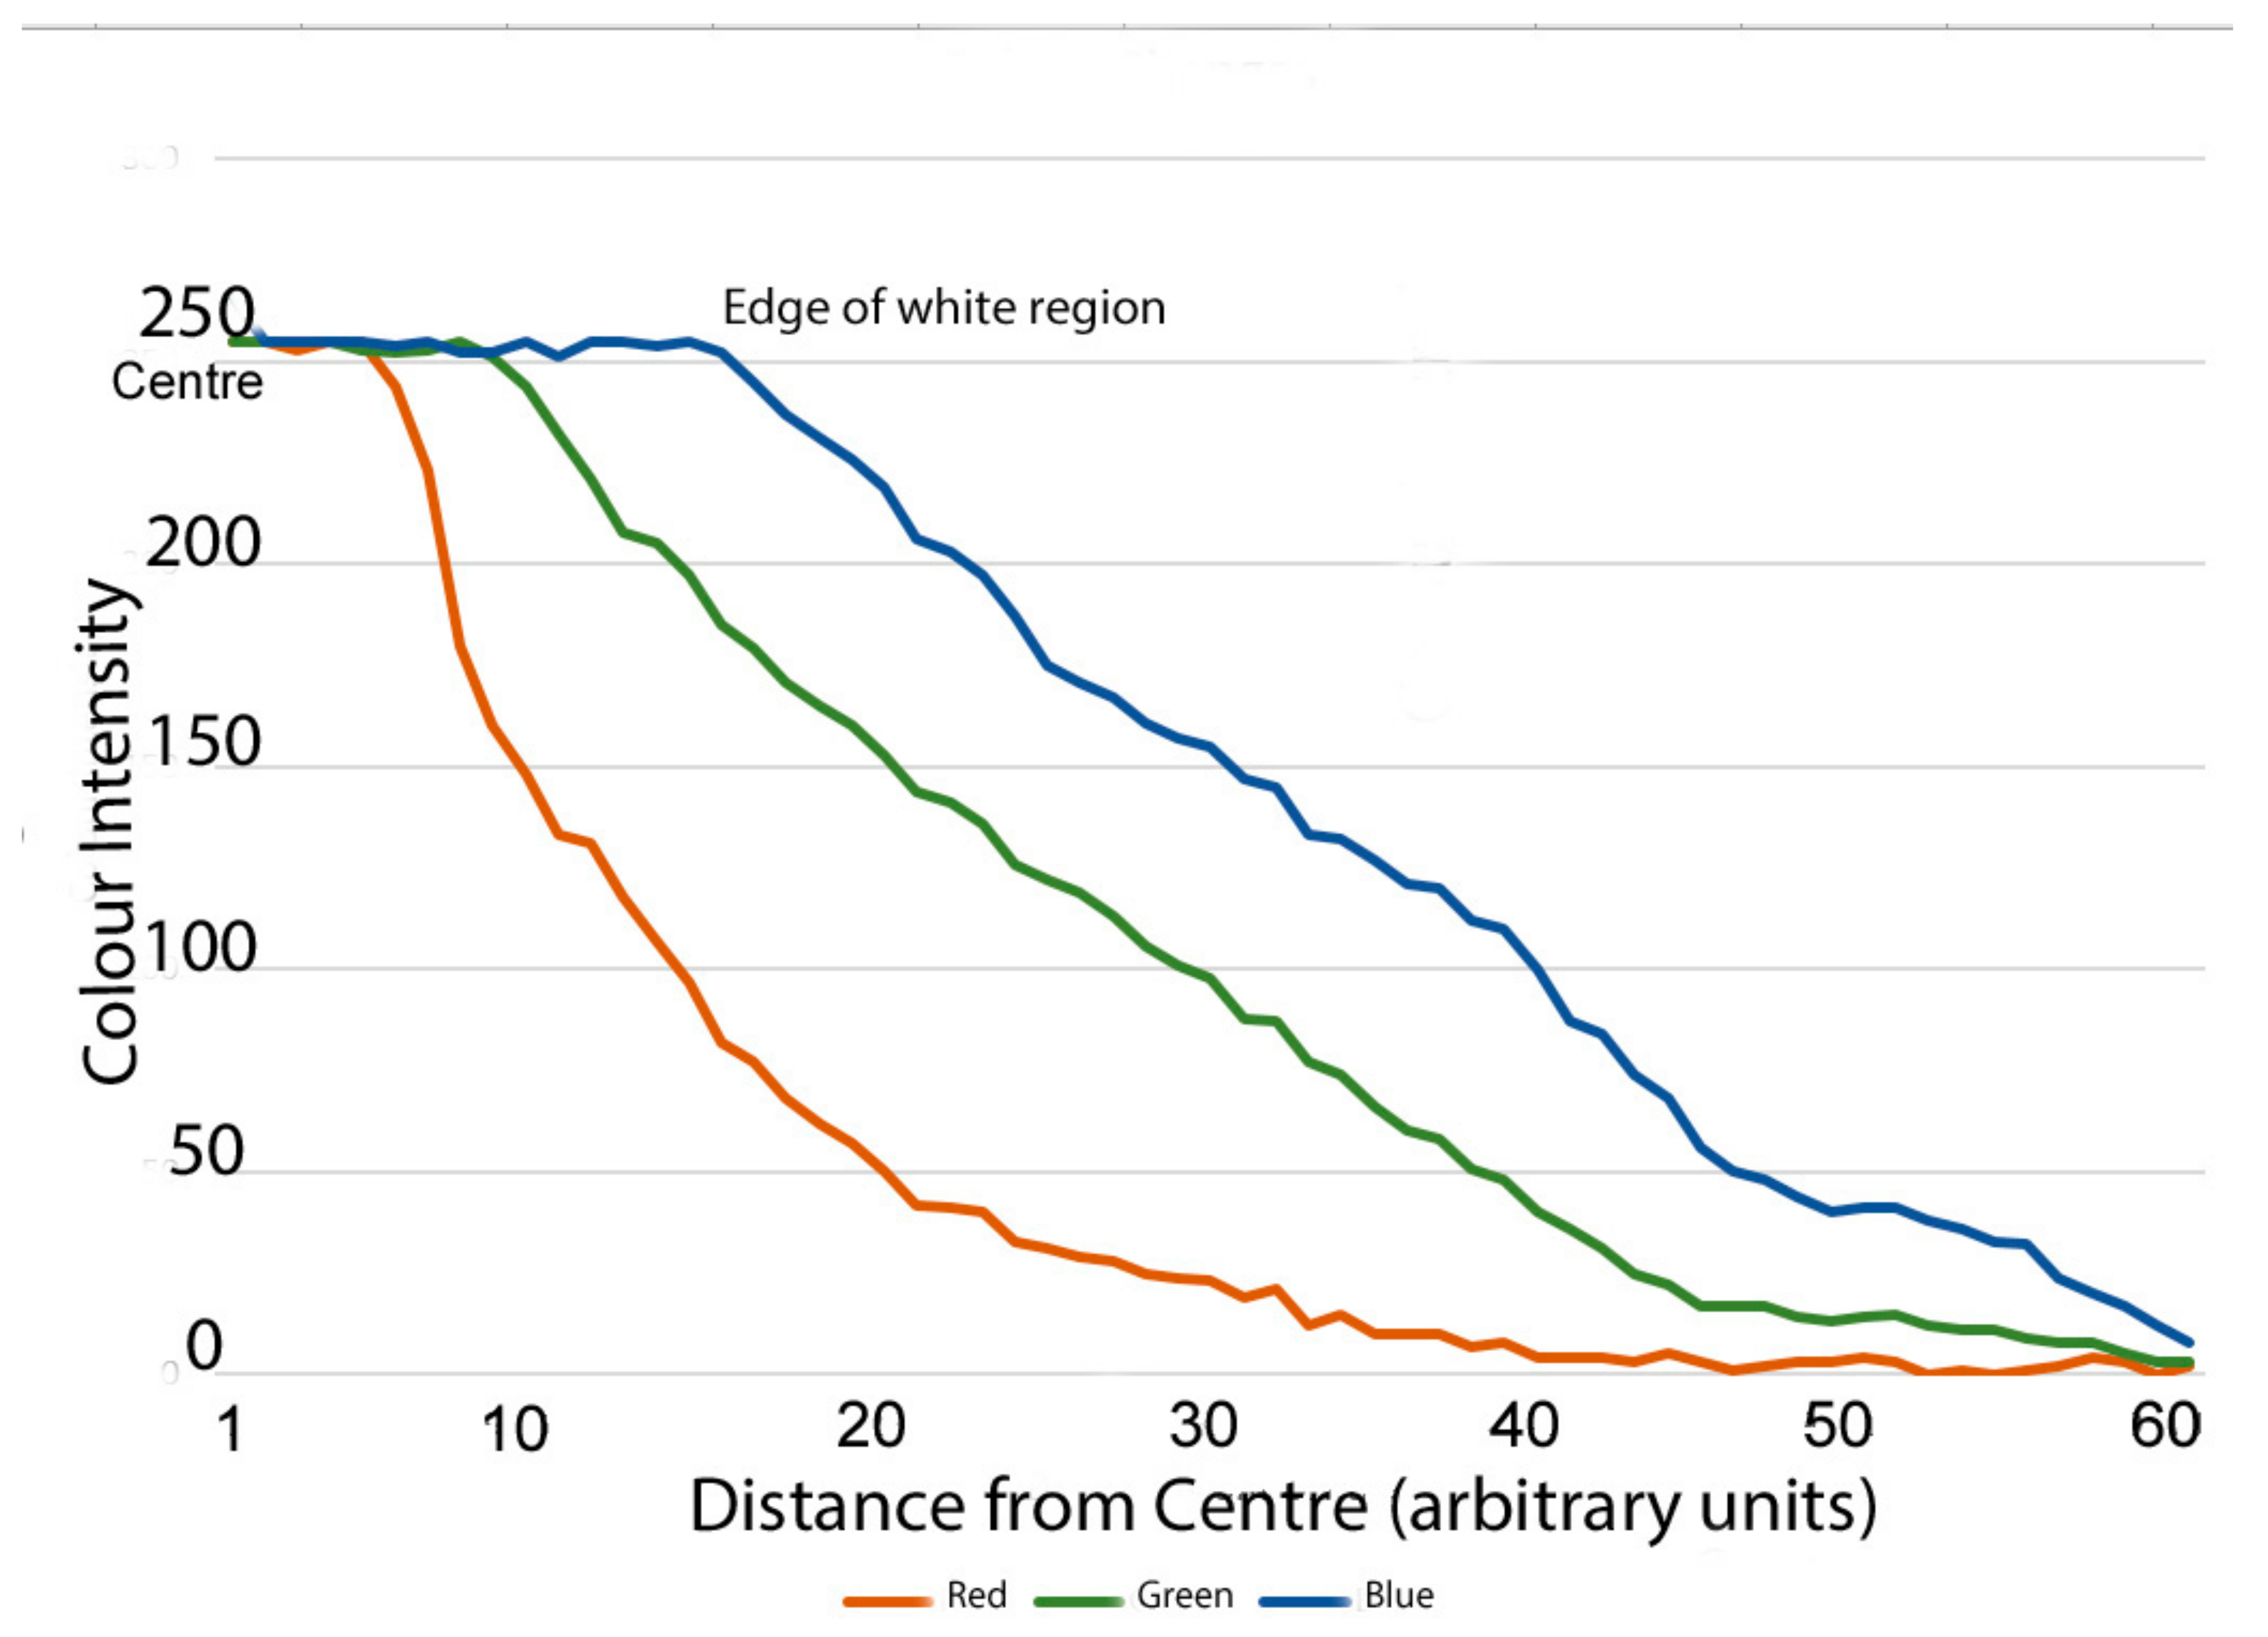
Many videos of bright atmospheric sources, such as the sun, meteors, or very strong ground-based artificial light, show blue colours in the air at night, progressively darkening with distance from the centre. This is known as Rayleigh Scattering [42], caused by molecules of nitrogen which are very small compared with the wavelengths of light. Blue is strongly scattered, but red is scattered little. This results in a blue sky, and at night a kind of halo of blue light around a strong white source of light. If atmospheric tiny particles are about the same wavelength as the light (for example, fog particles), there is little difference in the degree of scattering and there is diffuse white light; this is known as Mie Scattering. In case readers have not encountered these forms of scattering, elementary accounts may be found elsewhere [43,44]. It seems clear that Rayleigh Scattering accounts for most colours in videos of earthquake light, but this has not been spelled out before. To further establish this, a numerical test was attempted.
As one moves radially away from the central white light, blue light is increasingly scattered towards the observer, and red least, if the mechanism is Rayleigh Scattering. The result is darker and darker blue. In contrast, if colours are caused by dust in the atmosphere (Mie Scattering), there will be similar proportions of light to the original source. A detailed distribution of colours outward from the centre was derived for Figure 1 using Photoshop™ to show whether the blue light was Rayleigh Scattering or Mie Scattering. RGB values were derived for 61 points.

2.4. Interviews

For a few weeks after the Kaikoura Earthquake, people in the Wellington region exiting supermarkets were interviewed. They were asked for descriptions of any earthquake light they had seen. This had the function of confirming video records and in a few cases supplying other useful information, such as that earthquake light could be seen on the ground, or in clouds.

3. Results

3.1. Historic Frequency

Archival newspaper reports from the last 150 years suggest an approximate median of 11 years between earthquake light occurrences in New Zealand. This value can only be an order-of-magnitude approximation and show there is a frequency of occurrence sufficient for research by scientific means. Closer statistical work is not necessary.

3.2. Contemporary Spatial Occurence

Earthquake light from the Kaikoura Earthquake was widely seen throughout New Zealand (Figure 8). Many sites distant from the epicentre provided eyewitness reports from only one person, with only indirect observation of a pale blue flash, which mainly goes to show that observations were very widespread. There were about 300 observations from many sources, and 23 videos from all sources, including 7 well-located direct observations of light on the ground. About 60 of 600 interviewees exiting supermarkets had seen flashes, due to being woken by the two-minute-long earthquake. There were a few unequivocal reports of light from the sea. Some detailed anecdotal reports are reported elsewhere [45].

3.3. Wellington Area Observations

Table 1 summarises those Wellington area observations from 600 people, which will now be described in more detail. See Figure 3 for locations. These are by far the most common earthquake light varieties in videos.
The two cloud observations are distinct.
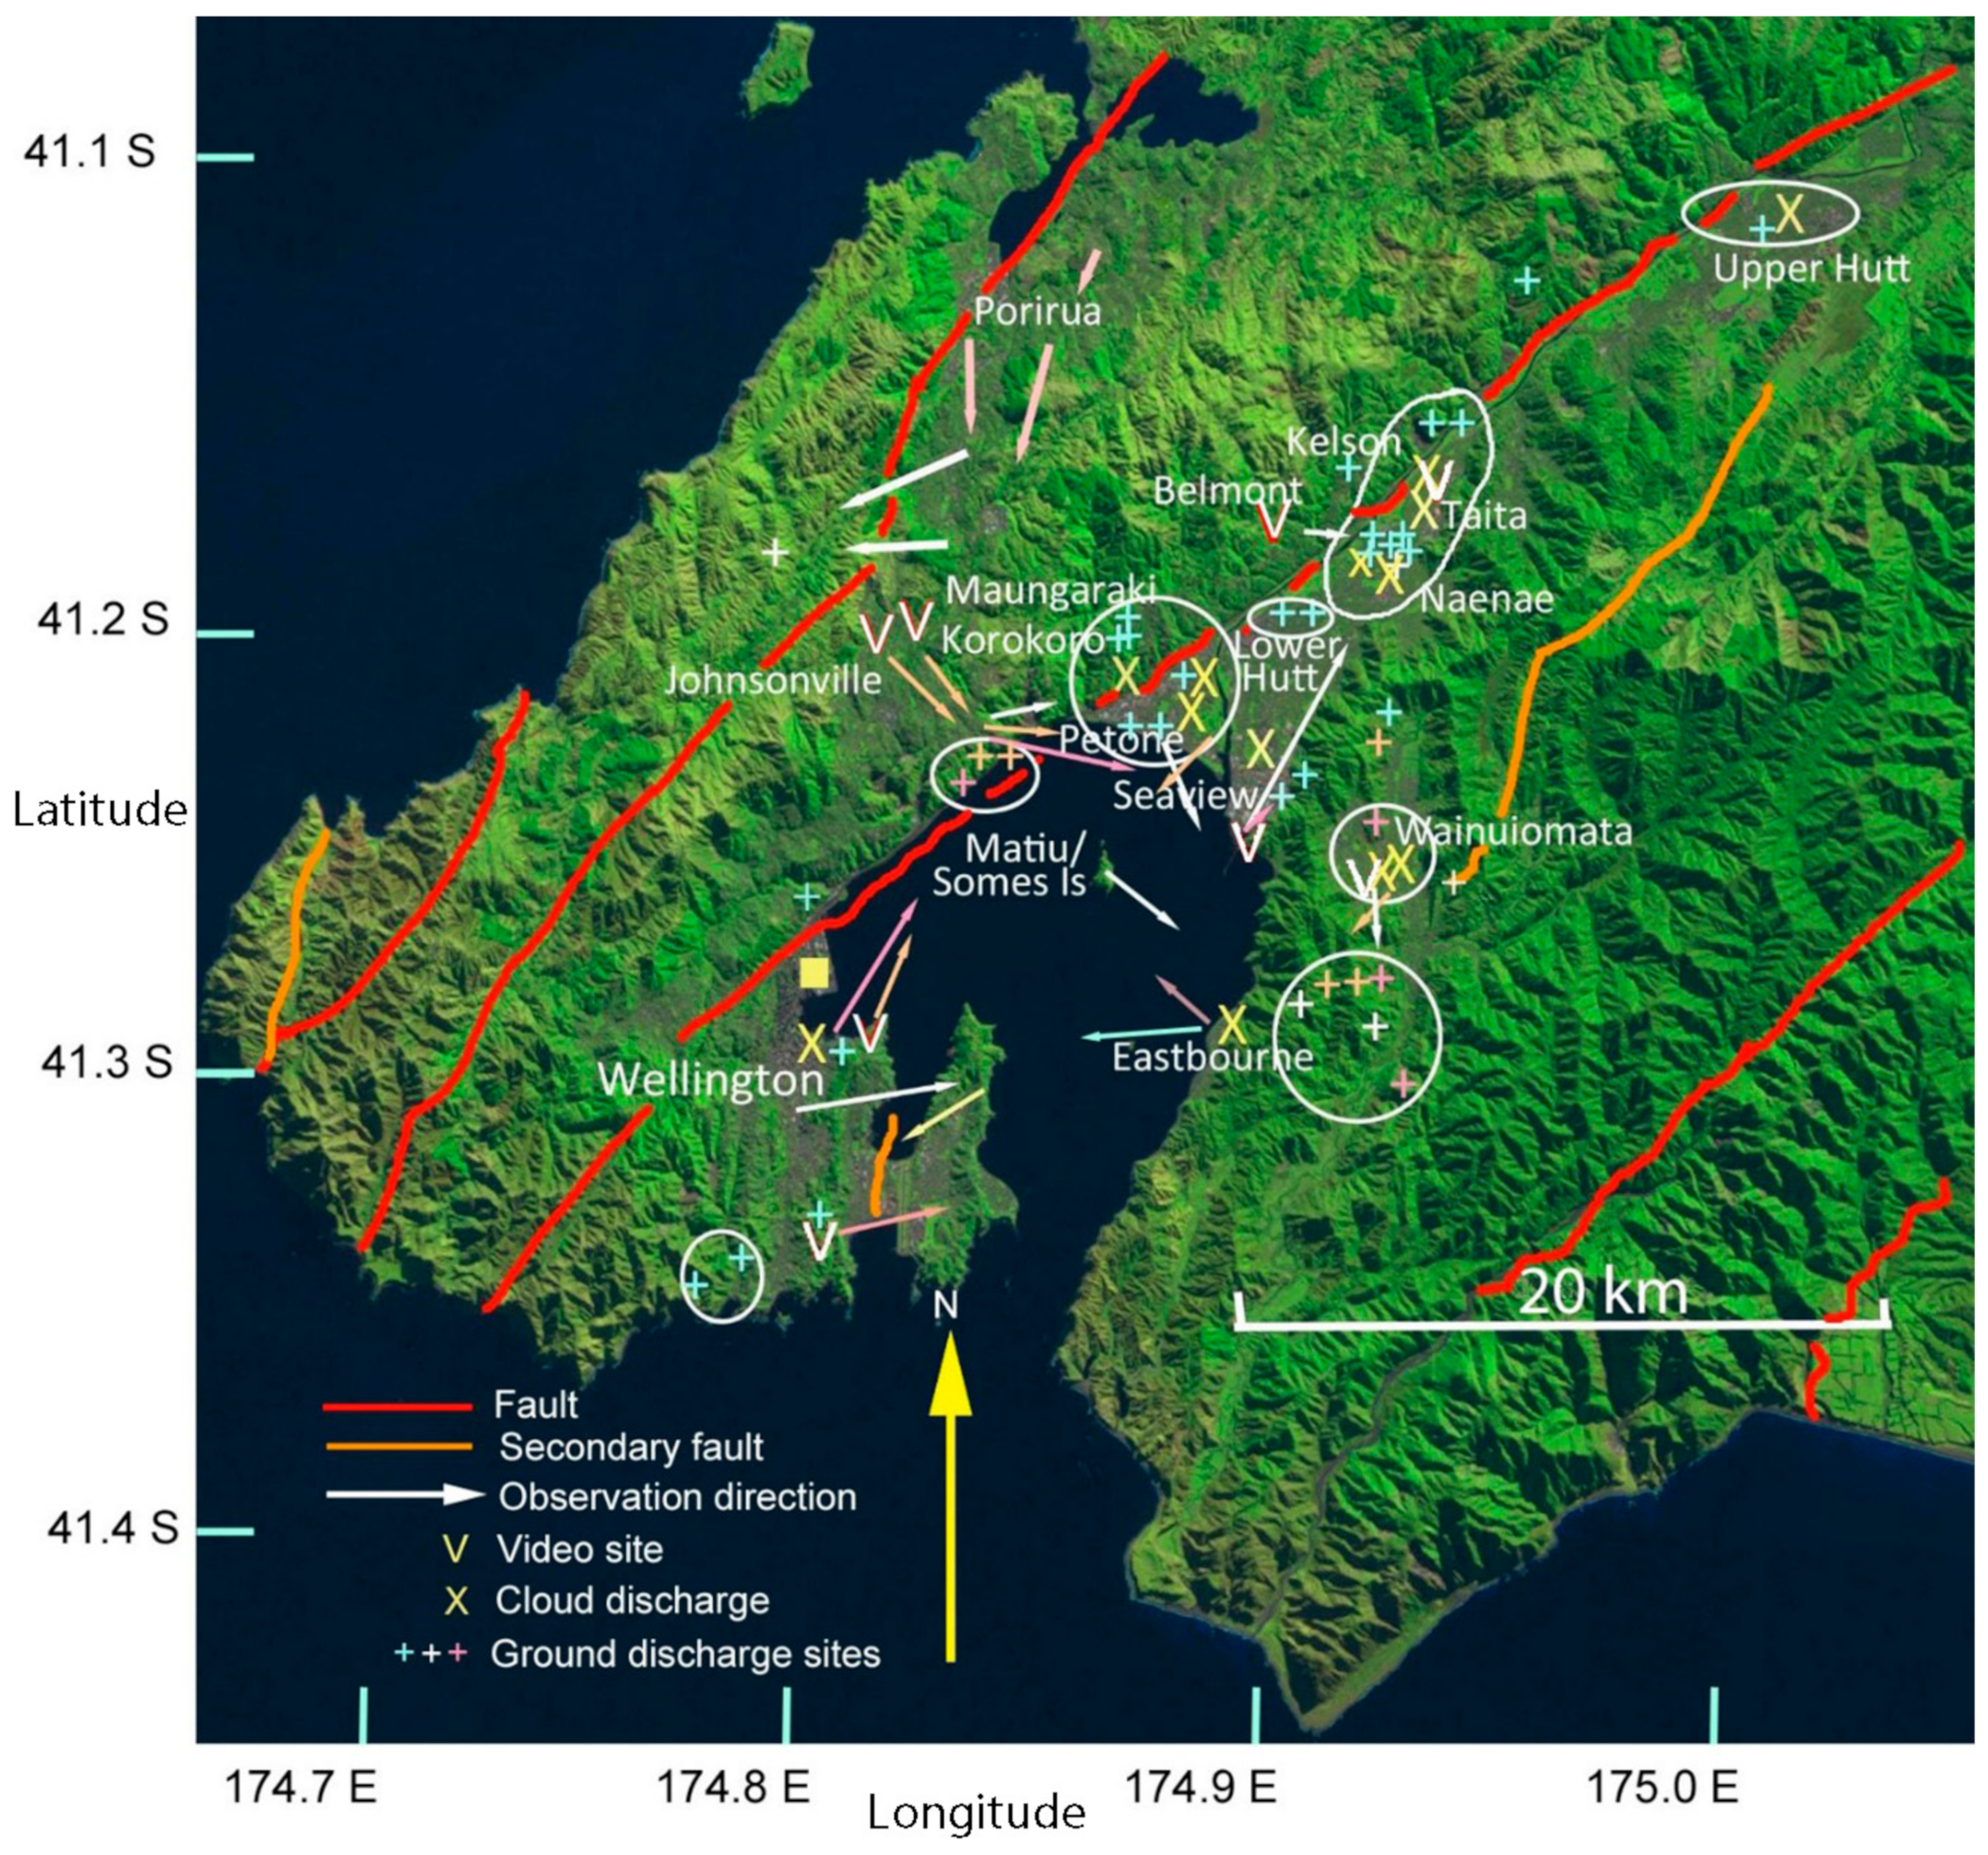
Flashes were most frequently seen near Wellington in its suburbs—Petone, Lower Hutt, and Wainuiomata (Figure 9)—rather than in the central city, but the reports over-emphasise the more densely inhabited areas, and there may have been earthquake light in some areas not shown in Figure 9. Earthquake light reports in the Wellington area were almost all from origins on quite shallow soils above greywacke, and 165 positive sightings throughout New Zealand came from the few thousand comments associated with one individual YouTube video [35]. Generally, individual ground flashes occurred sequentially from south to northeast in the Hutt Valley, which mirrors the direction of the seismic fault failures in the South Island. Time information from the 15 Wellington videos showed there were about 20 flashes in 20 s.
Figure 9 shows numerous earthquake light sites, and about a quarter are sites where there was earthquake light in clouds but no ground level equivalents, so the cloud appearance was not reflections of the ground flashes. The surface sites were mostly in valleys. No marine sites were reported within the Figure 9 area, but there were eyewitness marine reports from Runanga and Westport in the South Island and Kapiti in the North (locations, Figure 8).
In the urban Porirua basin there were no reported ground locations of flashes, only distant flashes mostly from reflections in clouds. For Figure 9, earthquake light locations were recorded on about 5% of the inhabited area.
Videos of Wainuiomata earthquake light mostly show reflections on clouds, and any central core is not directly visible on the ground. In Figure 10, taken from a hand-held video at Johnsonville, [35,51]* the central blue image is 10 km distant, in the clouds and elliptical in form, beyond a 300 m high ridge at Eastbourne towards Wainuiomata. The flashes could have been either in the hills or in the south section of the Wainuiomata Valley. The flashes are also seen indirectly in [52]*.
Two eyewitness accounts in Wainuiomata placed some flashes within Wainuiomata Valley itself. One reported a bright white elliptical appearance in the clouds and the second reported a flash on the ground at the foot of hills.
A video from Seaview (Figure 11 and Figure 12) is featured, [47] looking north up the Hutt Valley and showing two dome examples of the earthquake light. Figure 11 shows the large “Gracey” dome in Taita (250 m radius) and Figure 12, slightly later, is on thin soil at the foot of a much closer hill in Seaview, and therefore much nearer the viewpoint.
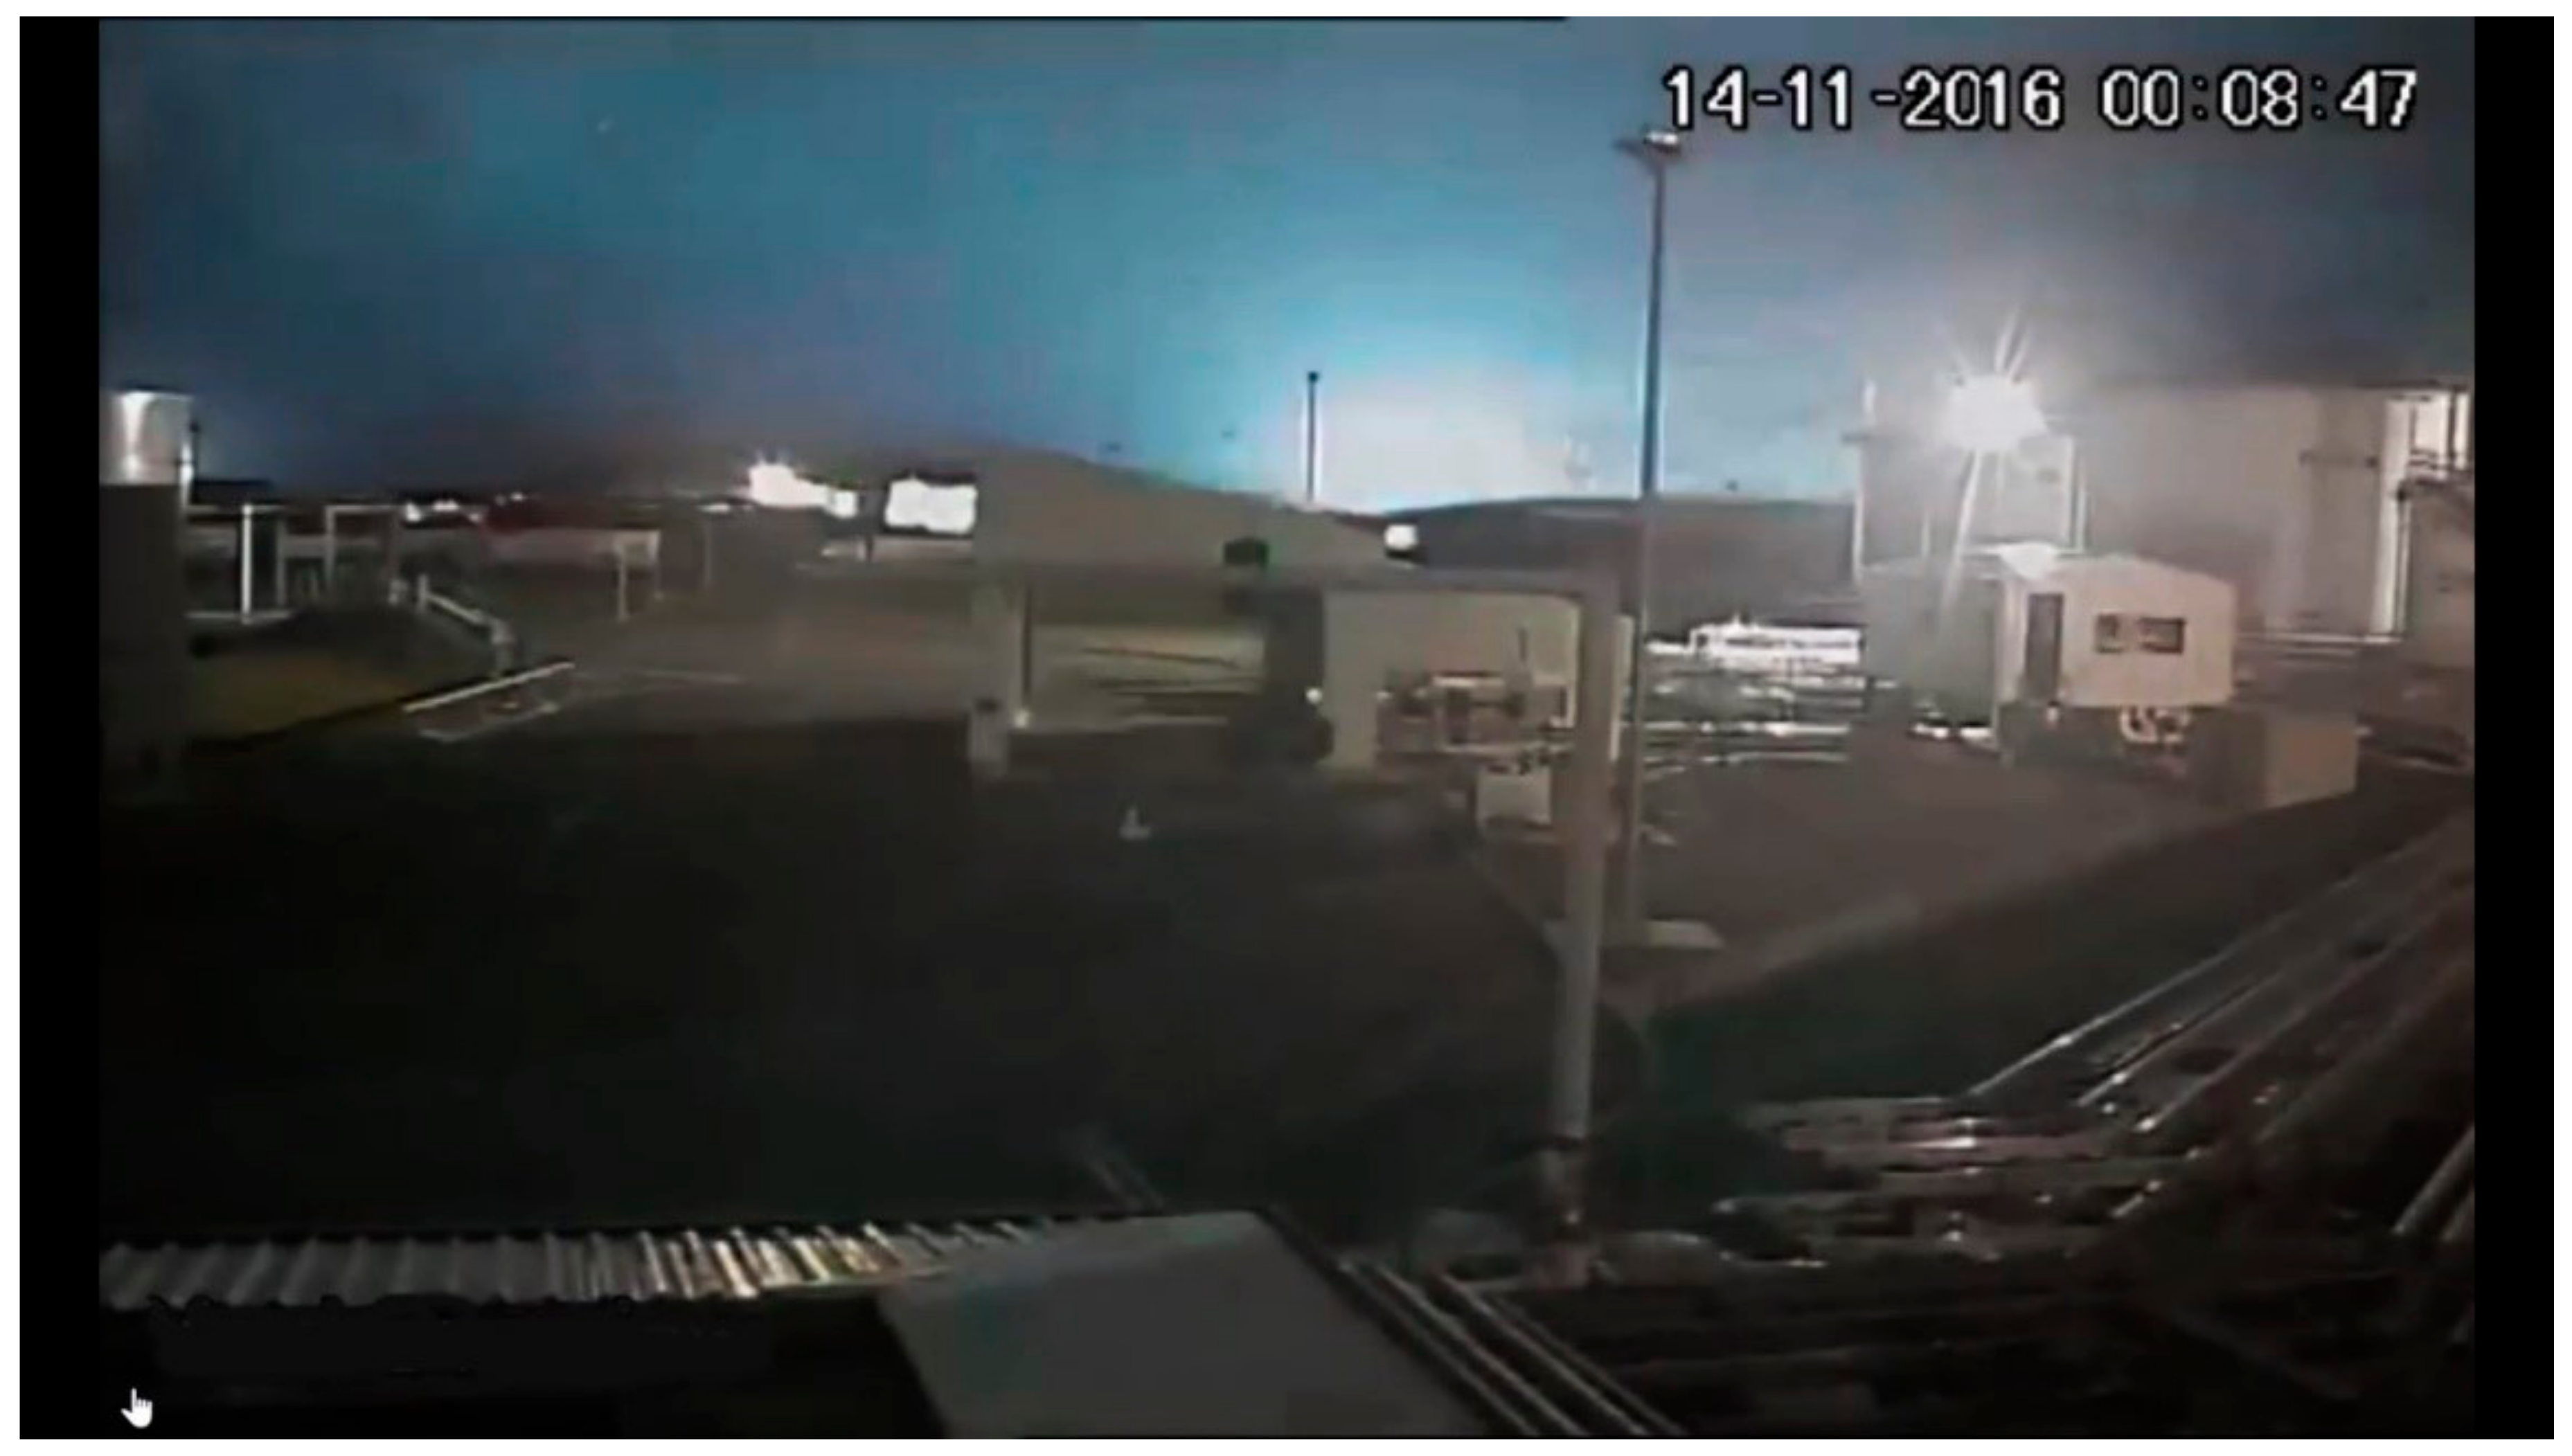
The Figure 11 flash, the large “Gracey” flash, was recorded on a video actually within the earthquake light (Figure 13 and Figure 14); [46]), it comes from Taita, Lower Hutt (location in Figure 9), and seems to have had no close parallels on the internet to 2017. The video recorder faced westward to the Hutt River (600 m distant). It could prove relevant that this is the main recharge region from the Hutt River to local aquifers [53]. The western hills 700 m distant are 190 m high. The clouds were also approximately 190 m high. Rain was absent in spite of the light clouds.
There was complete electric power loss just before the earthquake light (Figure 13). This Figure is included to contrast with the peak earthquake light flash one second later (Figure 14), during the power loss.
There are two very bright white areas in the clouds, and lower areas appeared blue through Rayleigh Scattering. Two observers also reported white light, so the white colour in the video is correct, and not due to video sensor over-saturation. The distant hills are lit almost to daylight intensity, demonstrating that there was considerable transient energy in the flash. Between some clouds at the top left is an area of blue sky with an intensity as if during daylight, but caused by the thickness of the blue-tinged air between the video recorder and the dark midnight sky.
The peak vertical and horizontal accelerations were 0.04 and 0.09 G, respectively, for this site [54]. This should be compared with similar data when earthquake light occurs in future earthquakes.

3.4. Durations of Flashes

From [1], the median and standard deviation of the mean for New Zealand earthquake light in ground examples, including those in this paper, were 0.59 ± 0.27 s, rather similar to international examples (0.4 s). The Gracey video cloud flashes were 1.5 s, and simultaneous to within 0.03 s, but the length was longer than the ground discharges observed in this paper.

3.5. Colour Analysis

All video records showed blue colours, and a minority of eyewitness reports were turquoise or green.
The colour distribution in Figure 1 used to test for Rayleigh Scattering is shown in Figure 15.

4. Discussion

4.1. Colours

For a Mie Distribution, the colours in Figure 15 would not decrease with distance from the white centre, nor would the relative colour ratios change, but both the decrease and the relative colour changes are obvious. This confirms Rayleigh Scattering is responsible. This is a new interpretation in the literature of earthquake light colour and is a simpler explanation of blue colours than the explanation in Whitehead and Ulusoy (2019) [1], which involved nitrogen energy levels. The latter may still contribute if the core colour is not white but only blue, which exists in a few international-origin videos. Green or red colours in videos could arise through very slightly greater amounts of dust, common during earthquakes [13], and even more common as the earthquake progresses. The dust would scatter the green to red wavelengths much more than usual. The colour blue seen in earthquake light rules out explanations due to sprites which would be red.

4.2. Lithology

Almost all observed ground flashes with video-defined ground locations (six out of seven) were on sites with very shallow soil, so almost on the basement greywacke bedrock of the study area, not on the thick riverine sediment or even thicker Wellington City sediments. A description from the literature is as follows:
“The bedrock is composed of 200 to 280 Ma (million years) greywacke comprising indurated (hard) sandstone, siltstone and mudstone beds. The greywacke is tightly folded, faulted and locally crushed, creating an angular blocky discontinuous rock mass near the surface” [55].
This type of lithology (greywacke) therefore supports the production of earthquake light, as also noted in [1] for the similar lithology at Christchurch in the South Island (location, Figure 8).
Igneous rock is a known environment for earthquake light [56,57], but the only surface igneous rock in the study region is a small patch of basaltic pillow lava, to the extreme south-west of Wellington City by the sea, where no earthquake light was reported; hence, igneous rock is not essential for light production. However, the Freund mechanism would still apply to microscopic quartz crystals in sedimentary rock, such as greywacke, or to quartz veins, and probably even silicates.

4.3. Epicentre Distance

Older studies suggested earthquake light occurred mostly at the epicentre, as in [58]; Table 2 shows this is often not the case.
This shows that being near the epicentre is not essential to the production of light. In these examples, “co-seismic” means when the seismic impulses reach the observation point, and this time may be a few minutes after the first epicentre shock. In all cases, the seismic forces at the earthquake-light point were experienced as strong.
Figure 8 shows the very widespread New Zealand eyewitness observations of earthquake light often hundreds of km away from the epicentre. This is also confirmed by video recordings. In Mexico, for the Chiapas (MW 8.1) earthquake in September 2017, the pale blue earthquake light was seen in a dozen videos from many places hundreds of km apart, and is often similarly distant from the epicentre. The videos come from the following locations, which, if referenced, are still accessible on the web, or, if unreferenced, are available from the present authors (Acapulco; Cancun; Chiapas [61]*; Mexico City [14]*; Oaxaca [62]*; Puebla [63]*; Salina Cruz [64]*; San Marco [65]*; Tabasco, Tijuana). Similarly, the 2021 Acapulco Mw 7.1 earthquake produced spectacular co-seismic light in Mexico City 380 km distant [14]*.

4.4. Faults

The association with extensional rifts noted in [56] has been seen in New Zealand possibly only for one Taupo eyewitness report; common New Zealand geological features are formed from compressive collisions of the Pacific and Australian tectonic plates. This means earthquake light may be observed near both extensional and compressively formed geological sites.
In past work, it was assumed that earthquake light would be mostly near faults. The present work records earthquake light with no detected movement of the Wellington faults [37], even though the study area is strongly faulted (Figure 9). Thus, even movement in non-epicentre faults is not essential. Only one observation was clearly on a (non-moving) fault, a secondary one in Wainuiomata (Figure 9); therefore, neither fault movement, being very close to a fault, or being at the epicentre is essential for the production of earthquake light.

4.5. Possible Electricity Supply Contribution

Consultation with Wellington Electricity (the local suppliers in the Wellington region), showed that at least the brightest flashes could not be explained by grid features (Pers. Comm. B. Singh, B. McEarlan): flashovers could not occur during the electricity blackout, but the most intense earthquake light was mid-blackout. There were only two significant co-seismic electrical problems in the Wellington region and very numerous co-seismic flashes in many places which were not near major electrical structures such as electrical substations. Transformer explosions and short-circuit problems may cause some reported earthquake lights; however, they seem to be a small minority. The flashes described in archived newspapers were mostly before major electrical infrastructure was built in New Zealand, and must also have other causes.

4.6. Earthquake Light Mechanisms

The evidence which follows applies to the study area but does not offer strong and universal evidence generally for earthquake light mechanisms.
The triboluminescence grinding mechanism [26] requires grinding between soil particles to produce light. This means any light would only be visible in the top few centimetres of soil. Grinding certainly occurred in reclaimed land in the harbour near Wellington Centreport (location Figure 3), creating surface cracks [66], but surface light was not observed there (Pers. Comm. Centreport staff). In contrast, earthquake light was observed in the Hutt and Wainuiomata Valleys where there were no surface cracks, nor was our largest observed earthquake light occurrence, the “Gracey” dome, on a known fault line. The triboluminescence mechanism is unlikely to be seen in our study area but perhaps occurs in others.
The recently proposed mechanism by Lira and Mulas [32] relies on subsurface cracking of rock in which charge reaches the surface by a rapid series of electrical charge induction steps. However, there was no fault movement or detected subsurface cracking in the Wellington area [37] and this mechanism is not likely for our study area, but similarly cannot be excluded as an explanation in other areas.
In the Freund mechanism [19], buried silicates stressed at the molecular level produce a wave of positive charge which reaches air and creates white light. This remains the best explanation of earthquake light [22] for our study area. Cracking or fault rupture is not essential.

4.7. Flashes in Clouds

This paper gives evidence for a class of earthquake light in clouds. Observers may wrongly describe earthquake light occurring in clouds when it is only a reflection of earthquake light on the ground. However, the Kaikoura Earthquake dataset for this paper contains at least five direct video examples of white flashes within clouds, different in length and appearance from lightning. One Wainuiomata resident reported a bright white elongated appearance above them, in the clouds, but was not able to record a video.
The “Gracey” video (Figure 14) shows simultaneous flashes in separated clouds, which shows how seismicity is somehow responsible, but the unusually long 1.5 s length suggests a mechanism which is presently unclear, and different from ground earthquake light which lasts about half a second. As mentioned, normal lightning did not occur during this earthquake. It is possible that a wave of positive charge from the ground might reach low cloud and trigger an electrical discharge, producing light. The limited five clear cloud examples in this study do not allow easy prediction of occurrence of this phenomenon under other conditions. Including indirect observation, it is recorded in Figure 9 that there were 11 examples of earthquake lightning in clouds and 37 on the ground. The former class needs more investigation and may be less important. Another cloud flash appears in a Mexican video (Figure 16).
The coloured clouds described by Fidani [67] seem to be a different class of phenomena, being colours not flashes.

4.8. Project Limitations

There are limitations to the project, but not sufficient to destroy the conclusions of this paper. Colour descriptions from New Zealand interviews may have been inaccurate because the flashes were short, and the total time for flashes was only about 20 s. However, the interviewees gave descriptions which generally coincided, which is particularly important because nearly all of them did not know what this light might be. Their descriptions generally agreed with the objective colour analysis of the video records using Photoshop™. It remains possible that some of the internet commentators wrongly thought their observations were exactly the same as previous comments, because the previous comments were very brief. Interesting differences may have been obscured.
A limitation is that some useful internet comments may have been missed because their volume was very high (thousands). Another limitation is that the video authors rarely responded to requests for details; however, these limitations are minor.
More videos would have been welcome, but those downloaded were mostly security videos which security personnel thought were novel and safe to put on the internet. At least two were unavailable on the internet because they were erased by their owners before possible release. Collaboration with railway surveillance systems and police and civic CCTV networks could be very useful to retrieve videos and has started in New Zealand. Early warning systems on TV in various countries also show co-seismic videos of earthquake light often.

5. Conclusions

Earthquake light is a confirmed and researchable subject. The current work generally supports literature accounts but shows nearby fault movement or igneous rock is not essential.
Most flashes were white, gradually transitioning to blue. The sky-blue and turquoise colours were confirmed on video and are due to Rayleigh Scattering. Definite green colours are less common and could be accounted for by small amounts of dust altering the Rayleigh-scattered light to longer wavelengths. Some rarer white flashes in low cloud were observed. Other, much rarer reports, e.g., longer-lived glows, deserve future analysis. The median flash length in New Zealand was 0.59 s.
The peak flashes in the Hutt Valley occurred during a power blackout and there were only two electrical faults on the grid, but about 20 earthquake light flashes, which means electrical grid involvement to produce flashes did not occur in the Hutt Valley.
The lights are produced very locally by the forces of the earthquake, though the epicentre may be hundreds of km distant. They are best explained by the Freund mechanism, but future work may produce other explanations.
Because there are good geophysical explanations for earthquake light, the general public should be reassured that this is not a threatening and unknowable occurrence, and, indeed, being in the centre of one of the flashes or very close has never been experienced as physically harmful.
There is a median gap of 11 y in New Zealand between examples, but earthquake light is now caught on video internationally most years. New Zealand is likely to be a continuing good area for earthquake light observation, but Chile, Japan, Mexico City, Peru, and Turkey will continue to be the origins of many video examples.

Author Contributions

N.E.W. writing the original draft, U.U. writing the original draft. All authors have read and agreed to the published version of the manuscript.

Funding

This research received no external funding.

Informed Consent Statement

Subjects for interviews were informed of the study purpose and agreed to be interviewed.

Data Availability Statement

Data are available from the authors.

Acknowledgments

We extend our personal thanks for the videos to the following parties: Zachary Bell, Dolores Gracey, Nguroa, Lance Farrell, Dani Hart, Briar Whitehead, and a further acknowledgment to the other referenced authors who made their videos freely available on the internet. Eyewitness accounts: we thank in particular Adrienne Brock-Smith, Hamish Campbell, A. Coates, a Department of Conservation ranger on Matiu/Somes Island in Wellington Harbour, Lorraine Eliora, Valda McCann, Simon McKenzie, Ripora Morete, Tash Olliver, Christine Prior, Wendy Willett, and Cynthia Hudson. Historical material: we thank the National Library on-line historic newspapers (“Papers Past”), Rosemary McLennan. Public requests for reports: we thank Laura Mills, Abby Brown, Louise Goble, Manager, and Sleepers Vineyard (NE Coast, South Island). Video technology: thanks to Ashok Kumar. Electricity supply information: we would like to thank Bradley Singh and Brendan McEarlan.

Conflicts of Interest

Neil Evan Whitehead was employed by the company Whitehead Associates, The remaining authors declare that the research was conducted in the absence of any commercial or financial relationships that could be construed as a potential conflict of interest. The Whitehead Associates had no role in the design of the study; in the collection, analyses, or interpretation of data; in the writing of the manuscript, or in the decision to publish the results.

References

  1. Whitehead, N.; Ulusoy, Ű. Blue Sky at Midnight; Earthquake Light. Turk. J. Earth Sci. 2019, 28, 171–186. [Google Scholar] [CrossRef]
  2. Derr, J.S. Earthquake Lights: A Review of Observations and Present Theories. Bull. Seismol. Soc. Am. 1973, 63, 2177–2187. [Google Scholar]
  3. Yasui, Y. A Study on the Luminous Phenomena Accompanied with Earthquake (Part I). Mem. Kakioka Magn. Obs. 1968, 13, 25–61. [Google Scholar]
  4. Tsukuda, T. Sizes and Some Features of Luminous Sources Associated with the 1995 Hyogo-Ken Nambu Earthquake. J. Phys. Earth 1997, 45, 73–82. [Google Scholar] [CrossRef]
  5. Whitehead, N.; Ulusoy, U. New Contributions to Understanding Earthquake Light, from the 2023 Turkish Earthquakes. In Proceedings of the 7th International Conference on Earthquake Engineering and Seismology, Antalya, Türkiye, 6–10 November 2023; Eberik, M., Ed.; Springer: Berlin/Heidelberg, Germany, 2024. [Google Scholar]
  6. Walsh, K.J. RGB to Color Name Mapping (Triplet and Hex). Available online: https://web.njit.edu/~walsh/rgb.html (accessed on 8 September 2017).
  7. Petre Gameplays. Strange Blue Light in Romania During Earth Quake on 24/09/2016. Available online: https://www.youtube.com/watch?v=tctJUaC_EPg (accessed on 31 December 2021).
  8. Rodríguez, J. Extrañas Luces Durante El Sismo 07 de Septiembre 2017. Available online: https://www.youtube.com/watch?v=rSb9BtlqJeYunavailable2018-11-15 (accessed on 1 November 2017).
  9. Guardian News. “Earthquake Light” Appears in Sky Above Japanese City. Available online: https://www.youtube.com/watch?v=G8Ma0nkCqis (accessed on 17 March 2022).
  10. Xie, B.; Wu, L.; Mao, W.; Wang, Z.; Sun, L.; Xu, Y. Horizontal Magnetic Anomaly Accompanying the Co-Seismic Earthquake Light of the M7.3 Fukushima Earthquake of 16 March 2022: Phenomenon and Mechanism. Remote Sens. 2023, 15, 5052. [Google Scholar] [CrossRef]
  11. Freund, F. Charge Generation and Propagation in Igneous Rocks. J. Geodyn. 2002, 33, 543–570. [Google Scholar] [CrossRef]
  12. Whitehead, N.; Ulusoy, Ű. Origin of Earthquake Light Associated with Earthquakes in Christchurch, New Zealand, 2010–2011. Earth Sci. Res. J. 2015, 19, 113–119. [Google Scholar] [CrossRef]
  13. Ikeya, M. Earthquakes and Animals; World Scientific: Singapore, 2004; ISBN 978-981-238-591-8. [Google Scholar]
  14. UFO Institute. Strange Blue Lights Over Mexico City After 7.1 Earthquake (September 7, 2021). Available online: https://www.youtube.com/watch?v=zQ2xk4qB1Z4 (accessed on 20 December 2021).
  15. NHK. Miyagi/Sendai Earthquake Light. Available online: https://www.youtube.com/watch?v=qWzeeshG7FI (accessed on 25 September 2024).
  16. Whitehead, N. Flashy Geology? Geosci. Soc. N. Z. Newsl. 2018, 26, 10–12. [Google Scholar]
  17. Freund, F.T.; Takeuchi, A.; Lau, B.W.S. Electric Currents Streaming out of Stressed Igneous Rocks—A Step towards Understanding Pre-Earthquake Low Frequency EM Emissions. Phys. Chem. Earth Parts A/B/C 2006, 31, 389–396. [Google Scholar] [CrossRef]
  18. St-Laurent, F.; Derr, J.S.; Freund, F.T. Earthquake Lights and the Stress-Activation of Positive Hole Charge Carriers in Rocks. Phys. Chem. Earth Parts A/B/C 2006, 31, 305–312. [Google Scholar] [CrossRef]
  19. Freund, F. Pre-Earthquake Signals? Part I: Deviatoric Stresses Turn Rocks into a Source of Electric Currents. Nat. Hazards Earth Syst. Sci. 2007, 7, 535–541. [Google Scholar] [CrossRef]
  20. Freund, F.; Sornette, D. Electro-Magnetic Earthquake Bursts and Critical Rupture of Peroxy Bond Networks in Rocks. Tectonophysics 2007, 431, 33–47. [Google Scholar] [CrossRef]
  21. Freund, F.T.; Kulahci, I.G.; Cyr, G.; Ling, J.; Winnick, M.; Tregloan-Reed, J.; Freund, M.M. Air Ionization at Rock Surfaces and Pre-Earthquake Signals. J. Atmos. Sol. Terr. Phys. 2009, 71, 1824–1834. [Google Scholar] [CrossRef]
  22. Freund, F. Pre-Earthquake Signals: Underlying Physical Processes. J. Asian Earth Sci. 2011, 41, 383–400. [Google Scholar] [CrossRef]
  23. Scoville, J.; Sornette, J.; Freund, F. Paradox of Peroxy Defects and Positive Holes in Rocks. Part II: Outflow of Electric Currents from Stressed Rocks. J. Asian Earth Sci. 2015, 114, 338–351. [Google Scholar] [CrossRef]
  24. Takeuchi, A.; Nagahama, H. Voltage Changes Induced by Stick-Slip of Granites. Geophys. Res. Lett. 2001, 28, 3365–3368. [Google Scholar] [CrossRef]
  25. Takeuchi, A.; Hiroyuki, N. Interpretation of Charging on Fracture or Frictional Slip Surface of Rocks. Phys. Earth Planet. Inter. 2002, 130, 285–291. [Google Scholar] [CrossRef]
  26. Shinbrot, T.; Kim, N.H.; Thyagu, N.N. Electrostatic Precursors to Granular Slip Events. Proc. Natl. Acad. Sci. USA 2012, 109, 10806–10810. [Google Scholar] [CrossRef]
  27. Daniels, K.E.; Bauer, C.; Shinbrot, T. Correlations between Electrical and Mechanical Signals during Granular Stick-Slip Events. Granul. Matter 2014, 16, 217–222. [Google Scholar] [CrossRef]
  28. Mizzi, C.A.; Lin, A.Y.W.; Marks, L.D. Does Flexoelectricity Drive Triboelectricity? Phys. Rev. Lett. 2019, 123, 116103. [Google Scholar] [CrossRef]
  29. Li, N.; Ma, L.; Xu, X.; Luo, J. Influence of “Seebeck Effect” on Charge Transfer between Two Friction Surfaces. Tribol. Int. 2021, 161, 107060. [Google Scholar] [CrossRef]
  30. Mizzi, C.A.; Marks, L.D. When Flexoelectricity Drives Triboelectricity. Nano Lett. 2022, 22, 3939–3945. [Google Scholar] [CrossRef] [PubMed]
  31. Thomas, R.; Krehbiel, P.; Rison, W.; Edens, H.; Aulich, G.; Winn, W.; McNutt, S.; Tytgat, G.; Clark, E. Electrical Activity During the 2006 Mount St. Augustine Volcanic Eruptions. Science 2007, 315, 1097. [Google Scholar] [CrossRef] [PubMed]
  32. Lira, J.; Mulas, M. Time Difference Correlation between Earthquake Lights and Seismic Ground Accelerations. Appl. Geophys. 2021, 18, 9–16. [Google Scholar] [CrossRef]
  33. Hamling, I.; Hreinsdóttir, S.; Clark, K.; Elliott, J.; Liang, C.; Fielding, E.; Litchfield, N.; Villamor, P.; Wallace, L.; Wright, T.; et al. The Fault Rupture during 2016 Mw 7.8 Kaikōura Earthquake, New Zealand. Science 2017, 356, eaam7194. [Google Scholar] [CrossRef]
  34. Spewpree. 14.11.16 NZ Hanmer Springs Earthquake. Hostel CCTV. Available online: https://www.youtube.com/watch?v=YFrAZl1I5Q0 (accessed on 30 January 2018).
  35. Bell, Z. Earthquake Lights. Available online: https://www.youtube.com/watch?v=2yJgTnA61m8 (accessed on 31 December 2021).
  36. Clark, K.; Nissen, E.; Howarth, J.; Hamling, I.; Mountjoy, J.; Ries, W.; Jones, K.; Goldstien, S.; Cochran, U.; Villamor, P.; et al. Highly Variable Coastal Deformation in the 2016 MW7.8 Kaikoura Earthquake Reflects Rupture Complexity along a Transpressional Plate Boundary. Earth Planet. Sci. Lett. 2017, 474, 334–344. [Google Scholar] [CrossRef]
  37. Wotherspoon, L.; Palermo, A.; Holden, C. The 2016 Mw7.8 Kaikoura Earthquake: An Introduction. Bull. N. Z. Soc. Earthq. Eng. 2017, 50, i–iv. [Google Scholar] [CrossRef]
  38. Ballance, A. The Science Of... Earthquakes. Available online: https://www.rnz.co.nz/programmes/featured-audio/story/201823812/the-science-of-earthquakes (accessed on 30 December 2021).
  39. GNS Science. Magnitude 7.8, Mon Nov 14 2016 12:02 AM. Available online: http://www.geonet.org.nz/earthquake/2016p858000 (accessed on 30 December 2021).
  40. Beggs, J.M. Sedimentology and Paleogeography of Some Kaihikuan Torlesse Rocks in Mid Canterbury. New Zealand J. Geol. Geophys. 1980, 23, 439–445. [Google Scholar] [CrossRef]
  41. Time and Date. Past Weather in Wellington—November 2016. Available online: https://www.timeanddate.com/weather/new-zealand/wellington/historic?month=11&year=2016 (accessed on 7 May 2022).
  42. Rayleigh, L. XXXIV. On the Transmission of Light through an Atmosphere Containing Small Particles in Suspension, and on the Origin of the Blue of the Sky. Lond. Edinb. Dublin Philos. Mag. J. Sci. 1899, 47, 375–384. [Google Scholar] [CrossRef]
  43. Anonymous. Rayleigh Scattering. Available online: https://en.wikipedia.org/wiki/Rayleigh_scattering (accessed on 11 February 2025).
  44. Anonymous. Mie Scattering. Available online: https://en.wikipedia.org/wiki/Mie_scattering (accessed on 11 February 2025).
  45. Whitehead, N. Details of Public Comments and Videos: Earthquake Light Accompanying the Kaikoura November 2016 Earthquake. Available online: www.chchquake.co.nz (accessed on 21 December 2021).
  46. Gracey, D. New Zealand Earthquake—November 14, 2016. Available online: https://www.youtube.com/watch?v=GZ4JJSrQXqI (accessed on 31 December 2021).
  47. Nguroa. Earthquake Lights 14Nov2016—Petone Wellington. Available online: https://www.youtube.com/watch?v=WJel7bW138k&t=42s (accessed on 20 May 2022).
  48. MacKenzie, S. 14 Nov 2016 NZ Earthquake—Way of Life Gym & WRKA Wainui Dojo. Available online: https://www.youtube.com/watch?v=_z69O7rhUrc&t=1s (accessed on 31 December 2021).
  49. GNS. New Research Shows Lower Threat from Wellington Fault—18/09/2009. Available online: https://www.gns.cri.nz/Home/News-and-Events/Media-Releases/Lower-threat-from-Wellington-fault (accessed on 30 December 2021).
  50. United States Geological Survey. Earth Explorer. Available online: https://earthexplorer.usgs.gov/ (accessed on 3 January 2022).
  51. Syrian Kiwi. Sky During Earthquake in Wellington. Available online: https://www.youtube.com/watch?v=BVVm7g3QgOA (accessed on 31 December 2021).
  52. Young, J. 2016-11-14. 7.5 Earthquake & Earthquake Light—Wellington, New Zealand. Available online: https://www.youtube.com/watch?v=6uRjvXkRshw (accessed on 31 December 2021).
  53. Gyopari, M. Lower Hutt Aquifer Model Revision (HAM3): Sustainable Management of the Waiwhetu Aquifer; Greater Wellington: Wellington, New Zealand, 2014. [Google Scholar]
  54. Bradley, B.; Wotherspoon, L.; Kaiser, A. Ground Motion and Site Effect Observations in the Wellington Region from the 2016 Mw 7.8 Kaikoura New Zealand Earthquake. Bull. N. Z. Soc. Earthq. Eng. 2017, 50, 94–105. [Google Scholar] [CrossRef]
  55. Boon, D.; Perrin, N.; Dellow, G.; Van Dissen, R.; Lukovic, B. NZS1170.5:2004 Site Subsoil Classification of Lower Hutt. In Proceedings of the Ninth Pacific Conference on Earthquake Engineering Building an Earthquake-Resilient Society, Auckland, New Zealand, 14–16 April 2011; New Zealand Society for Earthquake Engineering: Wellington, New Zealand, 2011; pp. 1–8. [Google Scholar]
  56. Thériault, R.; St-Laurent, F.; Freund, F.T.; Derr, J.S. Prevalence of Earthquake Lights Associated with Rift Environments. Seismol. Res. Lett. 2014, 85, 159–178. [Google Scholar] [CrossRef]
  57. Freund, F. Co-Seismic Earthquake Lights: The Underlying Mechanism. Pure Appl. Geophys. 2019, 176, 3439–3450. [Google Scholar] [CrossRef]
  58. Terada, T. On Luminous Phenomena Accompanying Earthquakes. Bull. Earthq. Res. Inst. Tokyo Univ. 1931, 9, 225–255. [Google Scholar] [CrossRef]
  59. Ulusoy, U.; Ikeya, M. Retrospective Statements on Unusual Phenomena before the Izmit-Turkey Earthquake (M7.4, August 17, 1999) and Their Relevance to Earthquake Forecast. In Future Systems for Earthquake Early Warning; Ulusoy, U., Kundu, H., Eds.; Nova: New York, NY, USA, 2008; pp. 3–53. ISBN 978-1-60456-795-3. [Google Scholar]
  60. Napier Port. Earthquake Lightning Captured at Napier Port. Available online: https://www.youtube.com/watch?v=Rd0oV7HBrZI (accessed on 31 December 2021).
  61. Zliper. MOMENTO EXACTO Tuxtla Gutierrez Chiapas México Terremoto 8.2 Grados 07/09/2017. Available online: https://www.youtube.com/watch?v=rLHt-0MveRs (accessed on 29 December 2021).
  62. Ojo Virtual. Temblor de 8.1 En Oaxaca (Vídeo Difundido). Available online: https://www.youtube.com/watch?v=fek-VxWA02U (accessed on 29 December 2021).
  63. Pueblaonlinevideos. Así Se Vivió El Sismo de 8.4 Grados Richter En Puebla. Available online: https://www.youtube.com/watch?v=i1zj47_pSS8 (accessed on 29 December 2021).
  64. Lopher, E. Momento Exacto 2 Del #TEMBLOR En Salina Cruz, Oaxaca. Available online: https://www.youtube.com/watch?v=esGYy43cB8Y (accessed on 15 November 2018).
  65. Soy502. Así Se Vivió El Temblor En San Marcos. Available online: https://www.youtube.com/watch?v=ULAQgdDjOzk (accessed on 29 December 2021).
  66. Cubrinovski, M.; Bray, J.; de la Torre, C.; Olsen, M.; Bradley, B.; Chiaro, G.; Stocks, E.; Wotherspoon, L. Liquefaction effects and associated damages observed at the Wellington Centreport from the 2016 Kaikoura earthquake. Bull. N. Z. Soc. Earthq. Eng. 2017, 50, 152–173. [Google Scholar] [CrossRef]
  67. Fidani, C. The Earthquake Lights (EQL) of the 6 April 2009 Aquila Earthquake, in Central Italy. Nat. Hazards Earth Syst. Sci. 2010, 10, 967–978. [Google Scholar] [CrossRef]
Figure 8. Kaikoura Earthquake epicentre location shown in white. The Hutt Valley/Wellington region at the foot of the North Island should be noted. Widespread observations of earthquake light for Kaikoura Earthquake are round black dots, mostly found in internet video comments [35].
Atmosphere 16 00277 g008
Figure 9. Geological faults, observations (130), and general locations (circled) of earthquake light in Wellington/Hutt/Wainuiomata. Primary and secondary geological faults are both active [49]. The map is Sentinel satellite data [50]. Yellow square located at Centreport, Wellington, is discussed later.
Atmosphere 16 00277 g009
Figure 10. Earthquake light above Wainuiomata, looking east from Johnsonville [35,51]*. No white centre visible. Light in sky is RGB 101, 171, 193, sky-blue.
Atmosphere 16 00277 g010
Figure 11. Earthquake light in Taita (Figure 4) seen at left, from Seaview viewpoint ([16,47])*. White centre. Outer layers are RGB 145, 197, 211, sky-blue. Distance about 8 km. Radius of white centre about 250 m. We label this flash “Gracey” flash.
Atmosphere 16 00277 g011
Figure 12. Earthquake light (right centre) locally in Seaview (location Figure 9) ([16,47])*. White centre. Pale blue outer layers are RGB 156, 193, 216 sky-blue. Distance about 1 km. Radius of white centre about 30 m.
Atmosphere 16 00277 g012
Figure 13. Taita power blackout one second before flashes [46]*. Moon is out-of-frame to right. Any airglow would appear at top left.
Atmosphere 16 00277 g013
Figure 14. Peak flash condition (inside dotted lines) at midnight one second later than blackout frame (Figure 13), [46]*. Note: lit hill and “daylight” sky. Sky: RGB 82, 83, 233, darker sky-blue. Foreground is also strongly blue-tinged.
Atmosphere 16 00277 g014
Figure 15. Colour changes for Figure 1 white region, moving out from centre of white region in 61 regular steps. Separated red, green, blue contributions derived using PhotoshopTM10 Elements.
Atmosphere 16 00277 g015
Figure 16. Cloud flash of co-seismic earthquake light at Mexico City. Length: 0.57 s [14].
Atmosphere 16 00277 g016
Table 1. Representative observations for predominant earthquake light varieties and sources. “Survey” indicates eyewitness material from supermarket interviews and some personal communications. Names are often pseudonyms from videos.
NameMediumDescriptionReference
BellHand-held VideoFlashes above Wainuiomata hills. Reflections from clouds. [35]
GraceySecurity Video 250 m radius dome on the ground; also flashes in clouds. [46]*
NguroaSecurity VideoGracey dome; second close dome, on ground. [47]*
Anonymous Observer 1EyewitnessFlashes on ground, PetoneSurvey
Anonymous Observer 2Eyewitness20 m radius flash on ground, PetoneSurvey
Anonymous Observer 3Eyewitness2 m radius flash on ground, TaitaSurvey
Anonymous Observer 4EyewitnessFlash on Wainuiomata fault traceSurvey
McKenzieSecurity VideoCloud flashes, Wainuiomata[48]
Anonymous Observer 5EyewitnessFlash in Wainuiomata cloudSurvey
Anonymous Observer 6EyewitnessFlashes from the sea, WestportSurvey
Table 2. Selected co-seismic earthquake light, and distances from epicentres.
EQ Light
Location
Earthquake Year MagnitudeEpicentre Distance (km)Reference
USA
New Madrid,
1811Mw7.5600 [56]
Turkey
Izmit,
1999Mw7.8260 [59]
New Zealand
Napier,
2016Mw7.8540[60]*
Whangarei,2016Mw7.8800Eyewitness [35]
Kerikeri,
Mexico
2016Mw7.8900Eyewitness
Mexico City2017Mw8.2650 [14]
Mexico City 2021Mw7.1380[14]*.
Disclaimer/Publisher’s Note: The statements, opinions and data contained in all publications are solely those of the individual author(s) and contributor(s) and not of MDPI and/or the editor(s). MDPI and/or the editor(s) disclaim responsibility for any injury to people or property resulting from any ideas, methods, instructions or products referred to in the content.