Abstract
The response of large temporary working platforms for cross-sea bridges under the action of strong wind and waves with large tidal ranges is one of the key issues in offshore engineering. Based on a grand offshore bridge project in Fujian Province of China, on-site monitoring tests were carried out on a temporary working platform. A high-precision and fully automatic monitoring system was adopted to conduct the all-weather and high-frequency monitoring on vibrations, responses, and sea conditions of the platform, enabling us to grasp its structural mechanical characteristic and ensuring the platform safety. The results show that, under the severe sea conditions of typhoons, the stress of the platform structure increases significantly with the increase in the tidal range and reaches its maximum value at the high tide level. The inclination angle changes violently at the high tide level, while the amplitude of inclination angle change is relatively small at the low tide level. The effective value of the platform displacement under the severe sea conditions of typhoon meteorology is much larger than that under normal sea conditions. Compared with the low tide level, the acceleration of the offshore temporary work platform changes more drastically at the high tide level under severe sea conditions. Under severe sea conditions, the tidal level has a significant impact on the frequency corresponding to the peak value of the acceleration power spectrum of the offshore temporary platform.
1. Introduction
With the vigorous development of offshore engineering, the construction of cross-sea bridges is occupying an increasingly important position in the construction of transportation infrastructure [1,2,3]. As an indispensable and important facility in the process of bridge construction, large temporary working platforms are facing severe challenges in terms of their safety and stability in complex marine environments.
Strong wind and waves as well as high tidal ranges caused by severe typhoons are very important factors that affect the construction and operation safety of cross-sea bridges [4,5,6]. In harsh marine environments, temporary working platforms are affected by multiple factors such as strong wind and waves and large tidal ranges, resulting in sharping changes in responses such as the displacement, deformation, and stress of the temporary platforms, which seriously threaten the safety and stability of platforms [7,8]. Therefore, it is of great significance to conduct corresponding dynamic response analyses on offshore temporary working platforms under the action of strong wind and waves and large tidal ranges.
In recent years, many scholars have conducted a series of in-depth studies on the dynamic responses of offshore platforms. At present, the research methods for the dynamic responses of offshore platforms mainly include the numerical analysis, the analytical theory method, and the model test [8,9,10,11]. Based on the numerical analysis, Liu et al. [12] carried out a series of numerical simulations based on OpenFOAM on the interaction of a triple-hulled offshore observation platform with different incident waves, and obtained duration curves of motion characteristics and loads. Zhang et al. [13] developed a three-dimensional integrated numerical model that includes wave and seabed sub-models to study the seabed response around pile foundation platforms induced by waves. Ti et al. [14] conducted a numerical study on the random responses of long-span cross-sea bridges under extreme nonlinear wave loads by utilizing the linear wave load theory. However, the modeling under the action of a large tidal range and strong wind and waves is complicated, and the calculation takes a long time. The values of some relevant parameters of the model are uncertain, making it difficult to accurately simulate the actual working conditions. Lan et al. [15] presented that the finite element models of offshore electrical platforms were first established considering the hydrodynamic effects and pile–soil–structure interaction, and the influencing factors associated with the generation of platform floor acceleration response spectra under the action of sea waves and an earthquake were discussed. Ghazi et al. [16] studied the performance responses of jack-up platforms under the influence of dynamic loads caused by waves, wind, earthquakes, and tsunami forces using finite element methods. Based on the analytical method, Park et al. [17] used a 3D load transfer scheme to accurately calculate the dynamic responses, including the interaction of the structure–foundation system, and analyzed the dynamic responses of offshore platforms caused by seismic motions. However, it is difficult for the analytical methods to accurately take nonlinear factors into account, resulting in relatively large deviations between the calculated results and the actual situations under extreme working conditions.
Liu et al. [18] present a comprehensive investigation on the seismic responses of jacket offshore platforms taking the soil–water–structure interaction into account, through both shaking table tests and numerical simulation. Huang et al. [19] used shaking table tests and finite element analysis (FEA) to study the seismic performance of offshore platforms under different earthquakes. It was found that the dynamic response of the platforms under offshore earthquakes was significantly greater than that under onshore earthquakes.
However, the cost of model tests is relatively high, and the dynamic similarity ratio of the model cannot reach 1:1. For the actual working conditions involving complex dynamic loads such as strong wind and waves and tidal ranges, it is difficult to meet the complex physical and mechanical similarity relationships between the test and prototype models, which may have a certain impact on the accuracy of test results. Due to the complexity and uncontrollability of actual marine environments, accurately obtaining the response data of offshore platform structures and conducting an effective analysis are the difficulties in the research on the dynamic responses of offshore platforms. Although numerous achievements have been made, to date, there are still deficiencies in the current research on the dynamic responses of offshore large temporary working platforms under the action of strong wind and waves with a large tidal range. In particular, research on the on-site monitoring tests of the responses of large temporary platforms for cross-sea bridges under the action of strong wind and waves with a large tidal range is very rarely carried out.
This paper combines the structural characteristics of the large temporary platform of a grand bridge to establish a high-precision and fully automatic monitoring system. It conducts all-weather and high-frequency on-site monitoring tests on the whole process of large temporary working platforms for cross-sea bridges under the action of high tidal ranges and strong wind and waves. It focuses on analyzing the development process and laws of the inclination angle of the large temporary platform, platform vibration and displacement, and stress of the components, as well as changes in the seawater level and flow velocity, and the response characteristic of the platform under the action of high tidal range and strong wind and waves is revealed. This has important theoretical and practical significance for improving the safety and stability of temporary working platforms, which provides a scientific basis for subsequent similar engineering designs and safety prevention and control.
2. Project Overview and On-Site Monitoring Layout
2.1. Project Overview
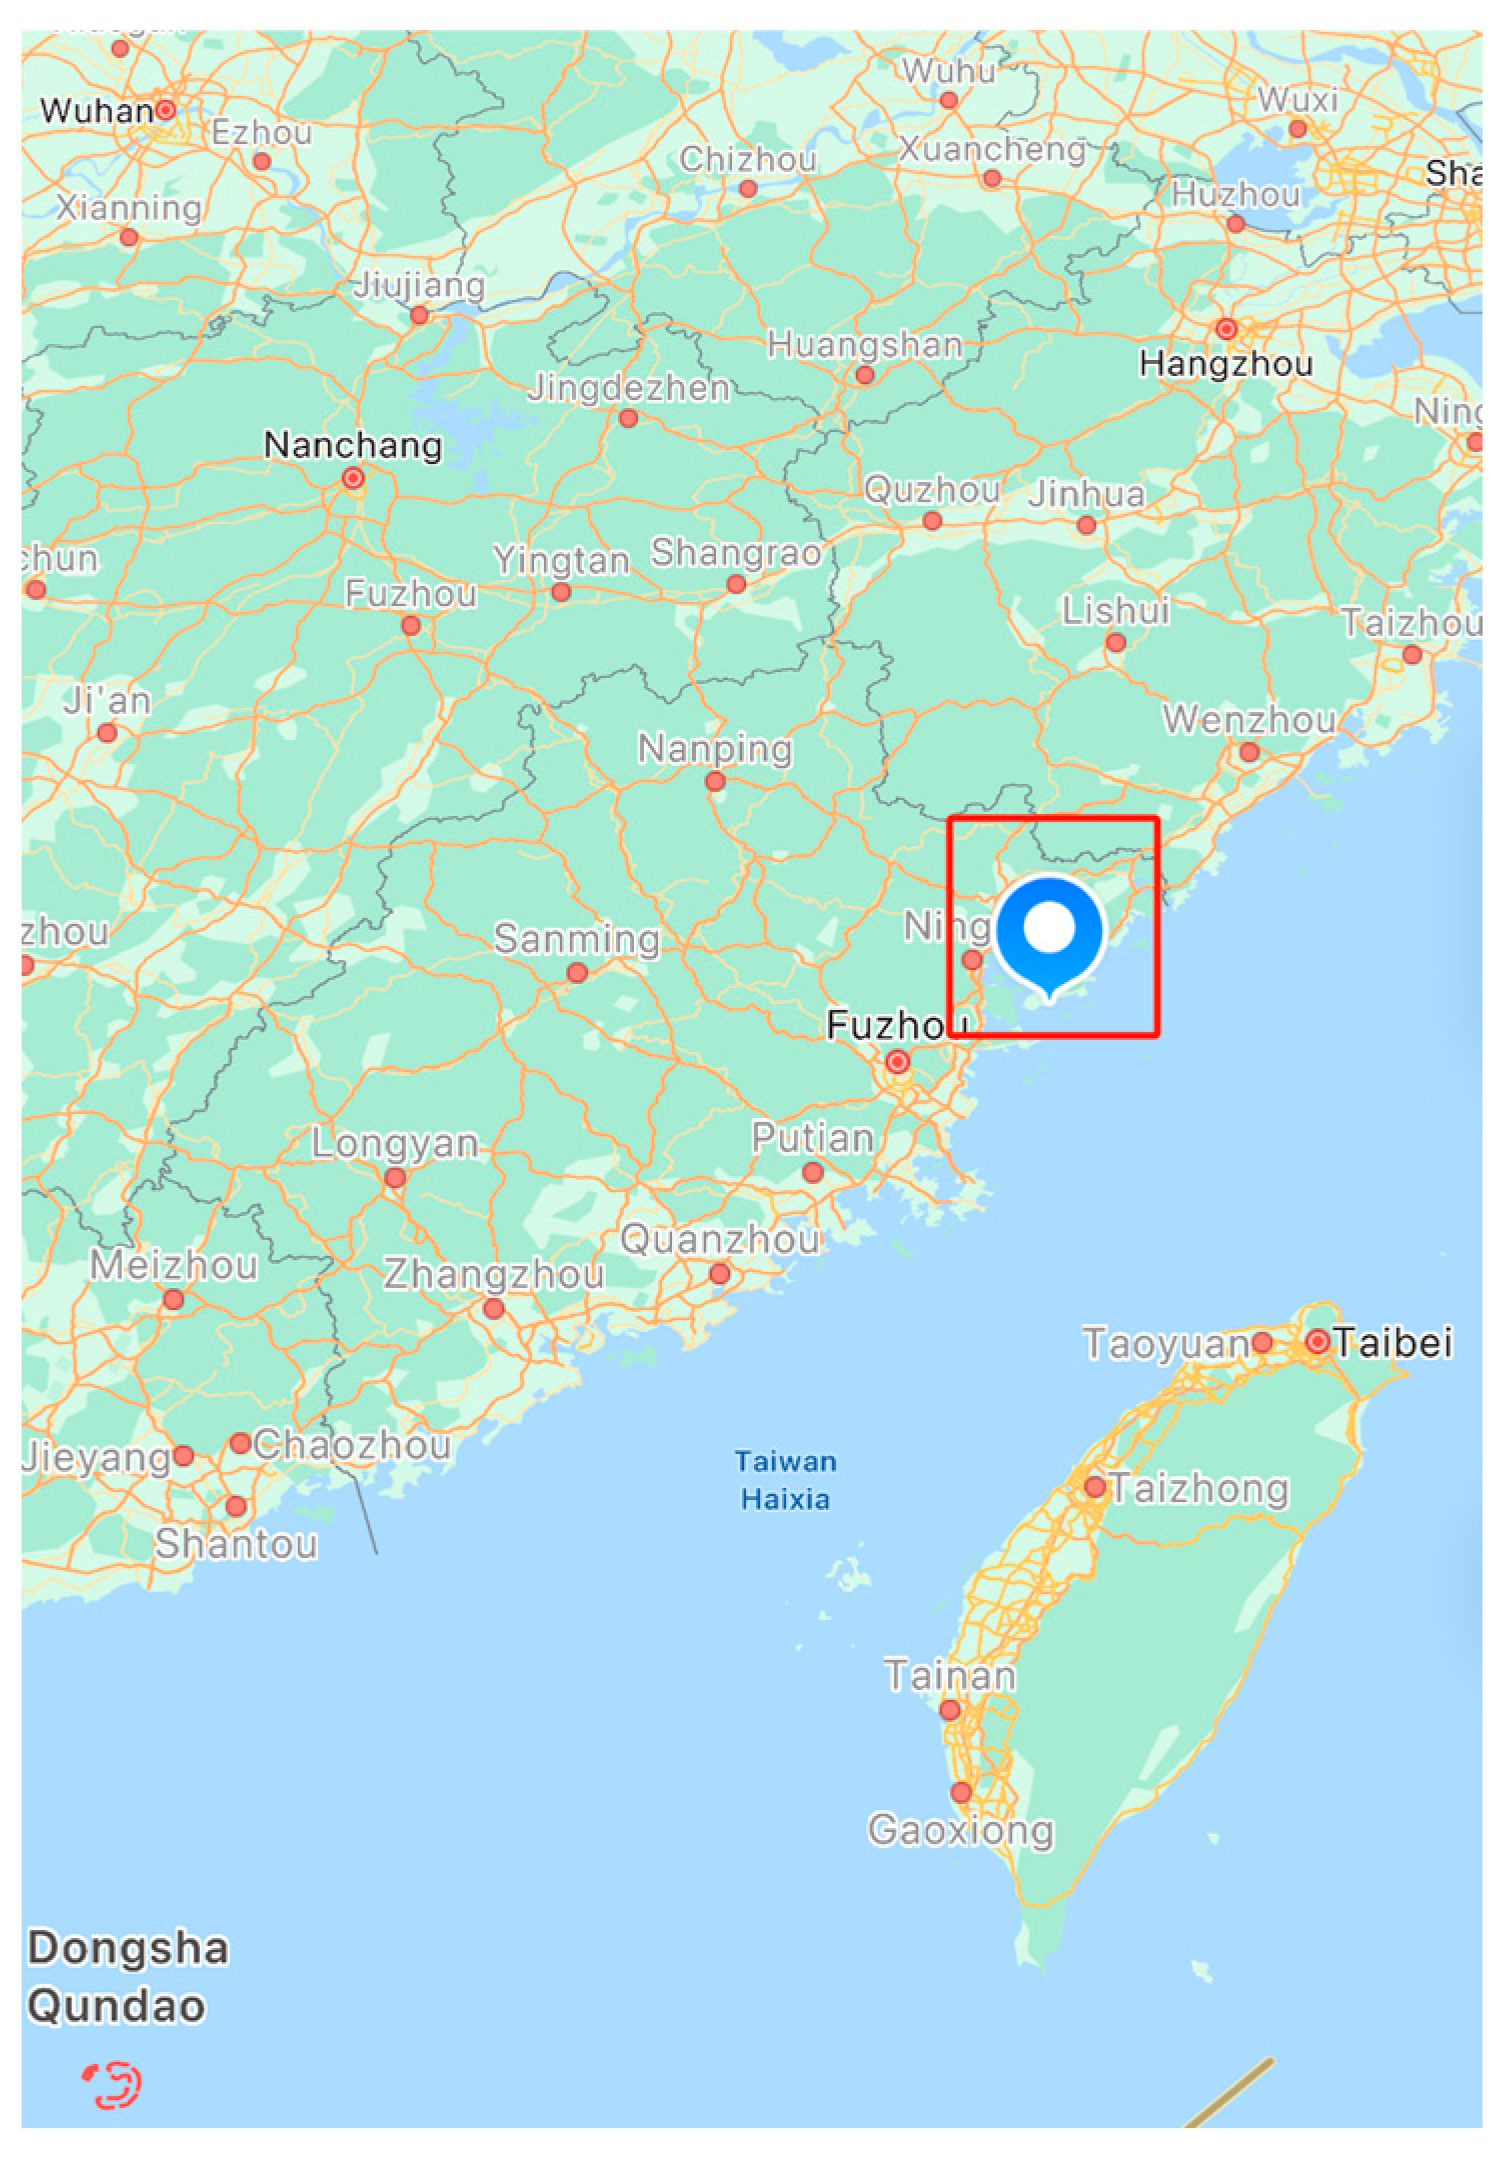
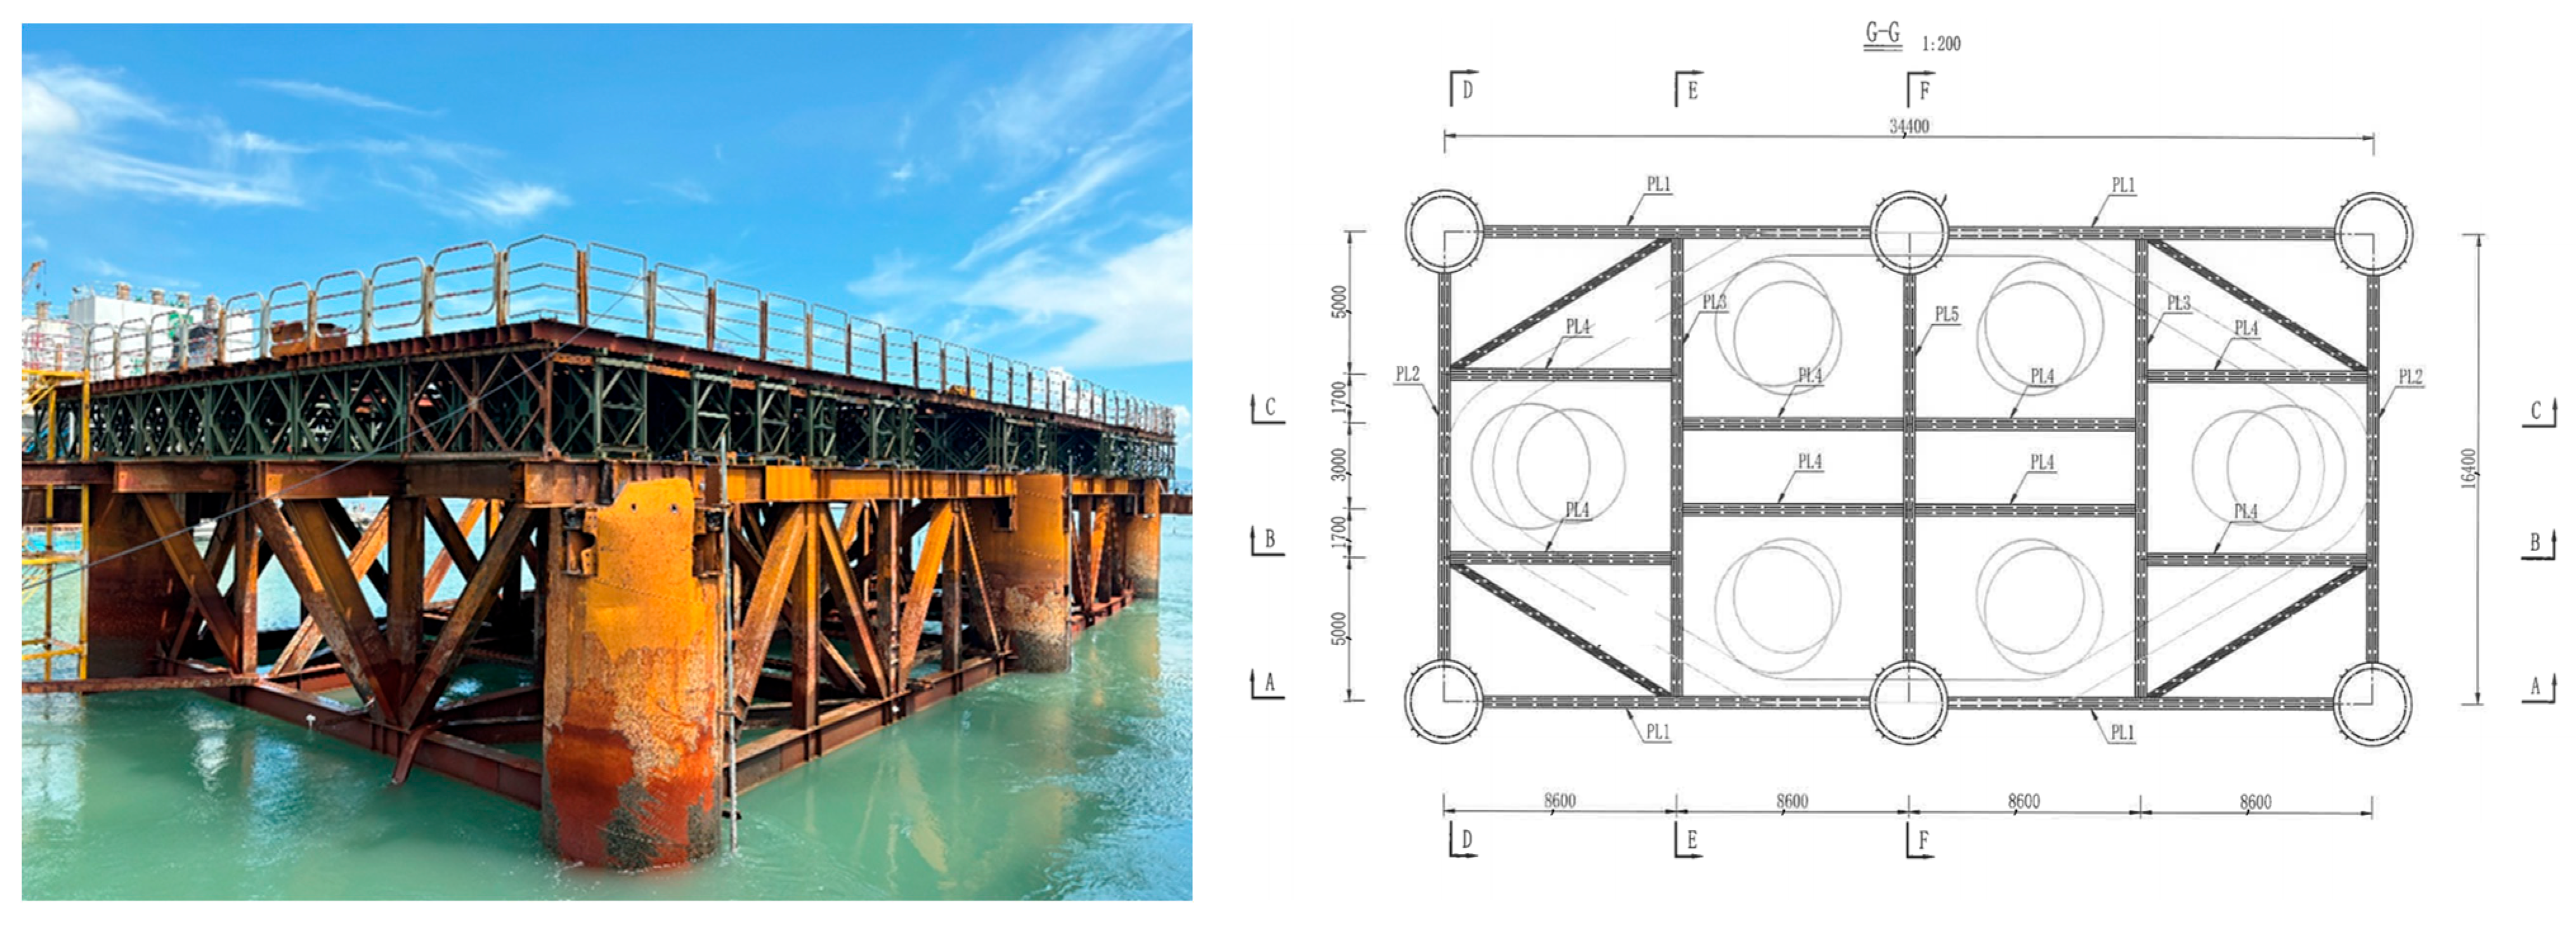
The large temporary platform is for the construction of a grand offshore bridge project, located in the coastal area of eastern Fujian Province in China. On-site monitoring tests were carried out on the temporary platform from 1 September to 31 December 2024. The location of the monitoring test for the large temporary platform of Pier 20 is shown in Figure 1. The elevation of the top surface of the platform is +8.0 m, the elevation of the horizontal bracing between columns is +6.27 m, the designed high tide level is +3.88 m, and the average tidal water level is +0.32 m. The platform has a plane size of 34.95 m × 16.4 m and is applicable to the approach bridge piers with a pile diameter of 4.0 m. The layout diagram of the temporary platform and steel casings for Pier 20 (from the bridge design unit) is shown in Figure 2.
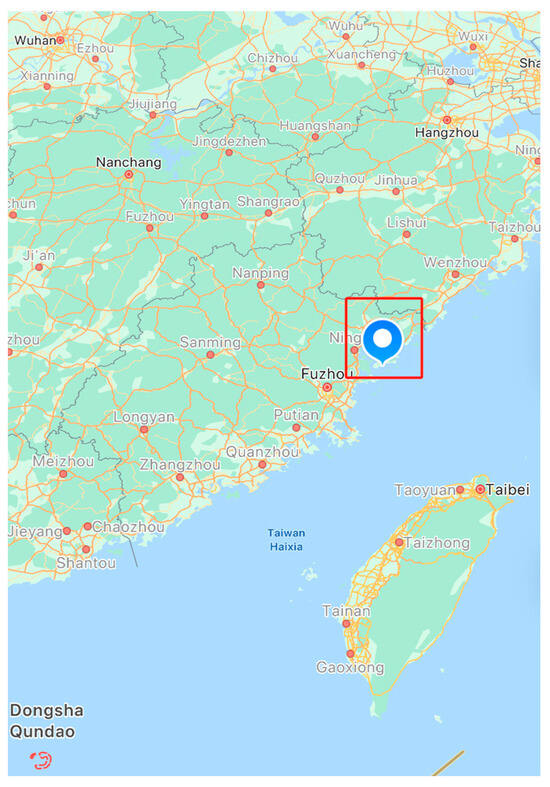
Figure 1.
Monitoring the test location of the large temporary platform at Pier 20 (marked by a red circle on the map).
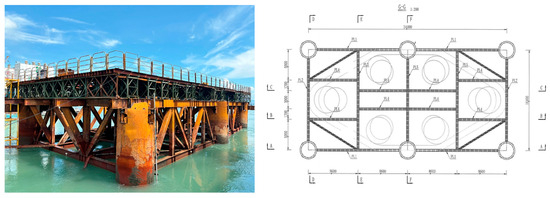
Figure 2.
Layout diagram of the temporary platform and steel casings for Pier 20 (from the bridge design unit).
2.2. Monitoring Contents and Equipment
The development of online health monitoring technology has effectively solved the deficiencies in traditional manual inspections. For this project, the monitoring contents and monitoring equipment of the high-precision fully automatic monitoring system are shown in the following table. The overview of monitoring contents is shown in Table 1.

Table 1.
Overview of monitoring contents.
2.3. Composition of the Monitoring System
The system is composed of the perception layer, transmission layer, and application layer, specifically including the sensor system, data acquisition subsystem, data transmission subsystem, database subsystem, data processing and control subsystem, and safety evaluation and early warning subsystem. Through the mutual coordination of each layer, various functions of the system are realized.
1. Sensor Subsystem: It is responsible for collecting various monitoring data, including inclination, strain, vibration, water pressure, and liquid level and flow velocity.
2. Data Acquisition Subsystem: It converts the analog signals collected by the sensors into digital signals and performs preliminary processing.
3. Data Transmission Subsystem: It adopts 4G/5G wireless transmission technology to transmit data to the data center in real time.
4. Database Subsystem: It stores and manages all monitoring data and provides data query and analysis functions.
5. Data Processing and Control Subsystem: It further processes and analyzes the collected data and generates reports and charts.
6. Safety Evaluation and Early Warning Subsystem: It conducts a statistical analysis on the monitoring data, judges the safety status of the structure, and issues early warning information in a timely manner.
2.4. Arrangement of Measuring Points
Monitor the inclination angle of the steel casings of the large temporary platform, platform vibration, strain of steel beams, and changes in seawater level. Install sensors on the outer surface of the steel casings and in the middle of the platform, and directly weld the equipment onto the pier column steel casings through brackets. The arrangement of measuring points for the monitoring test is as follows:
(1) Monitoring of the Inclination Angle of Steel Casings
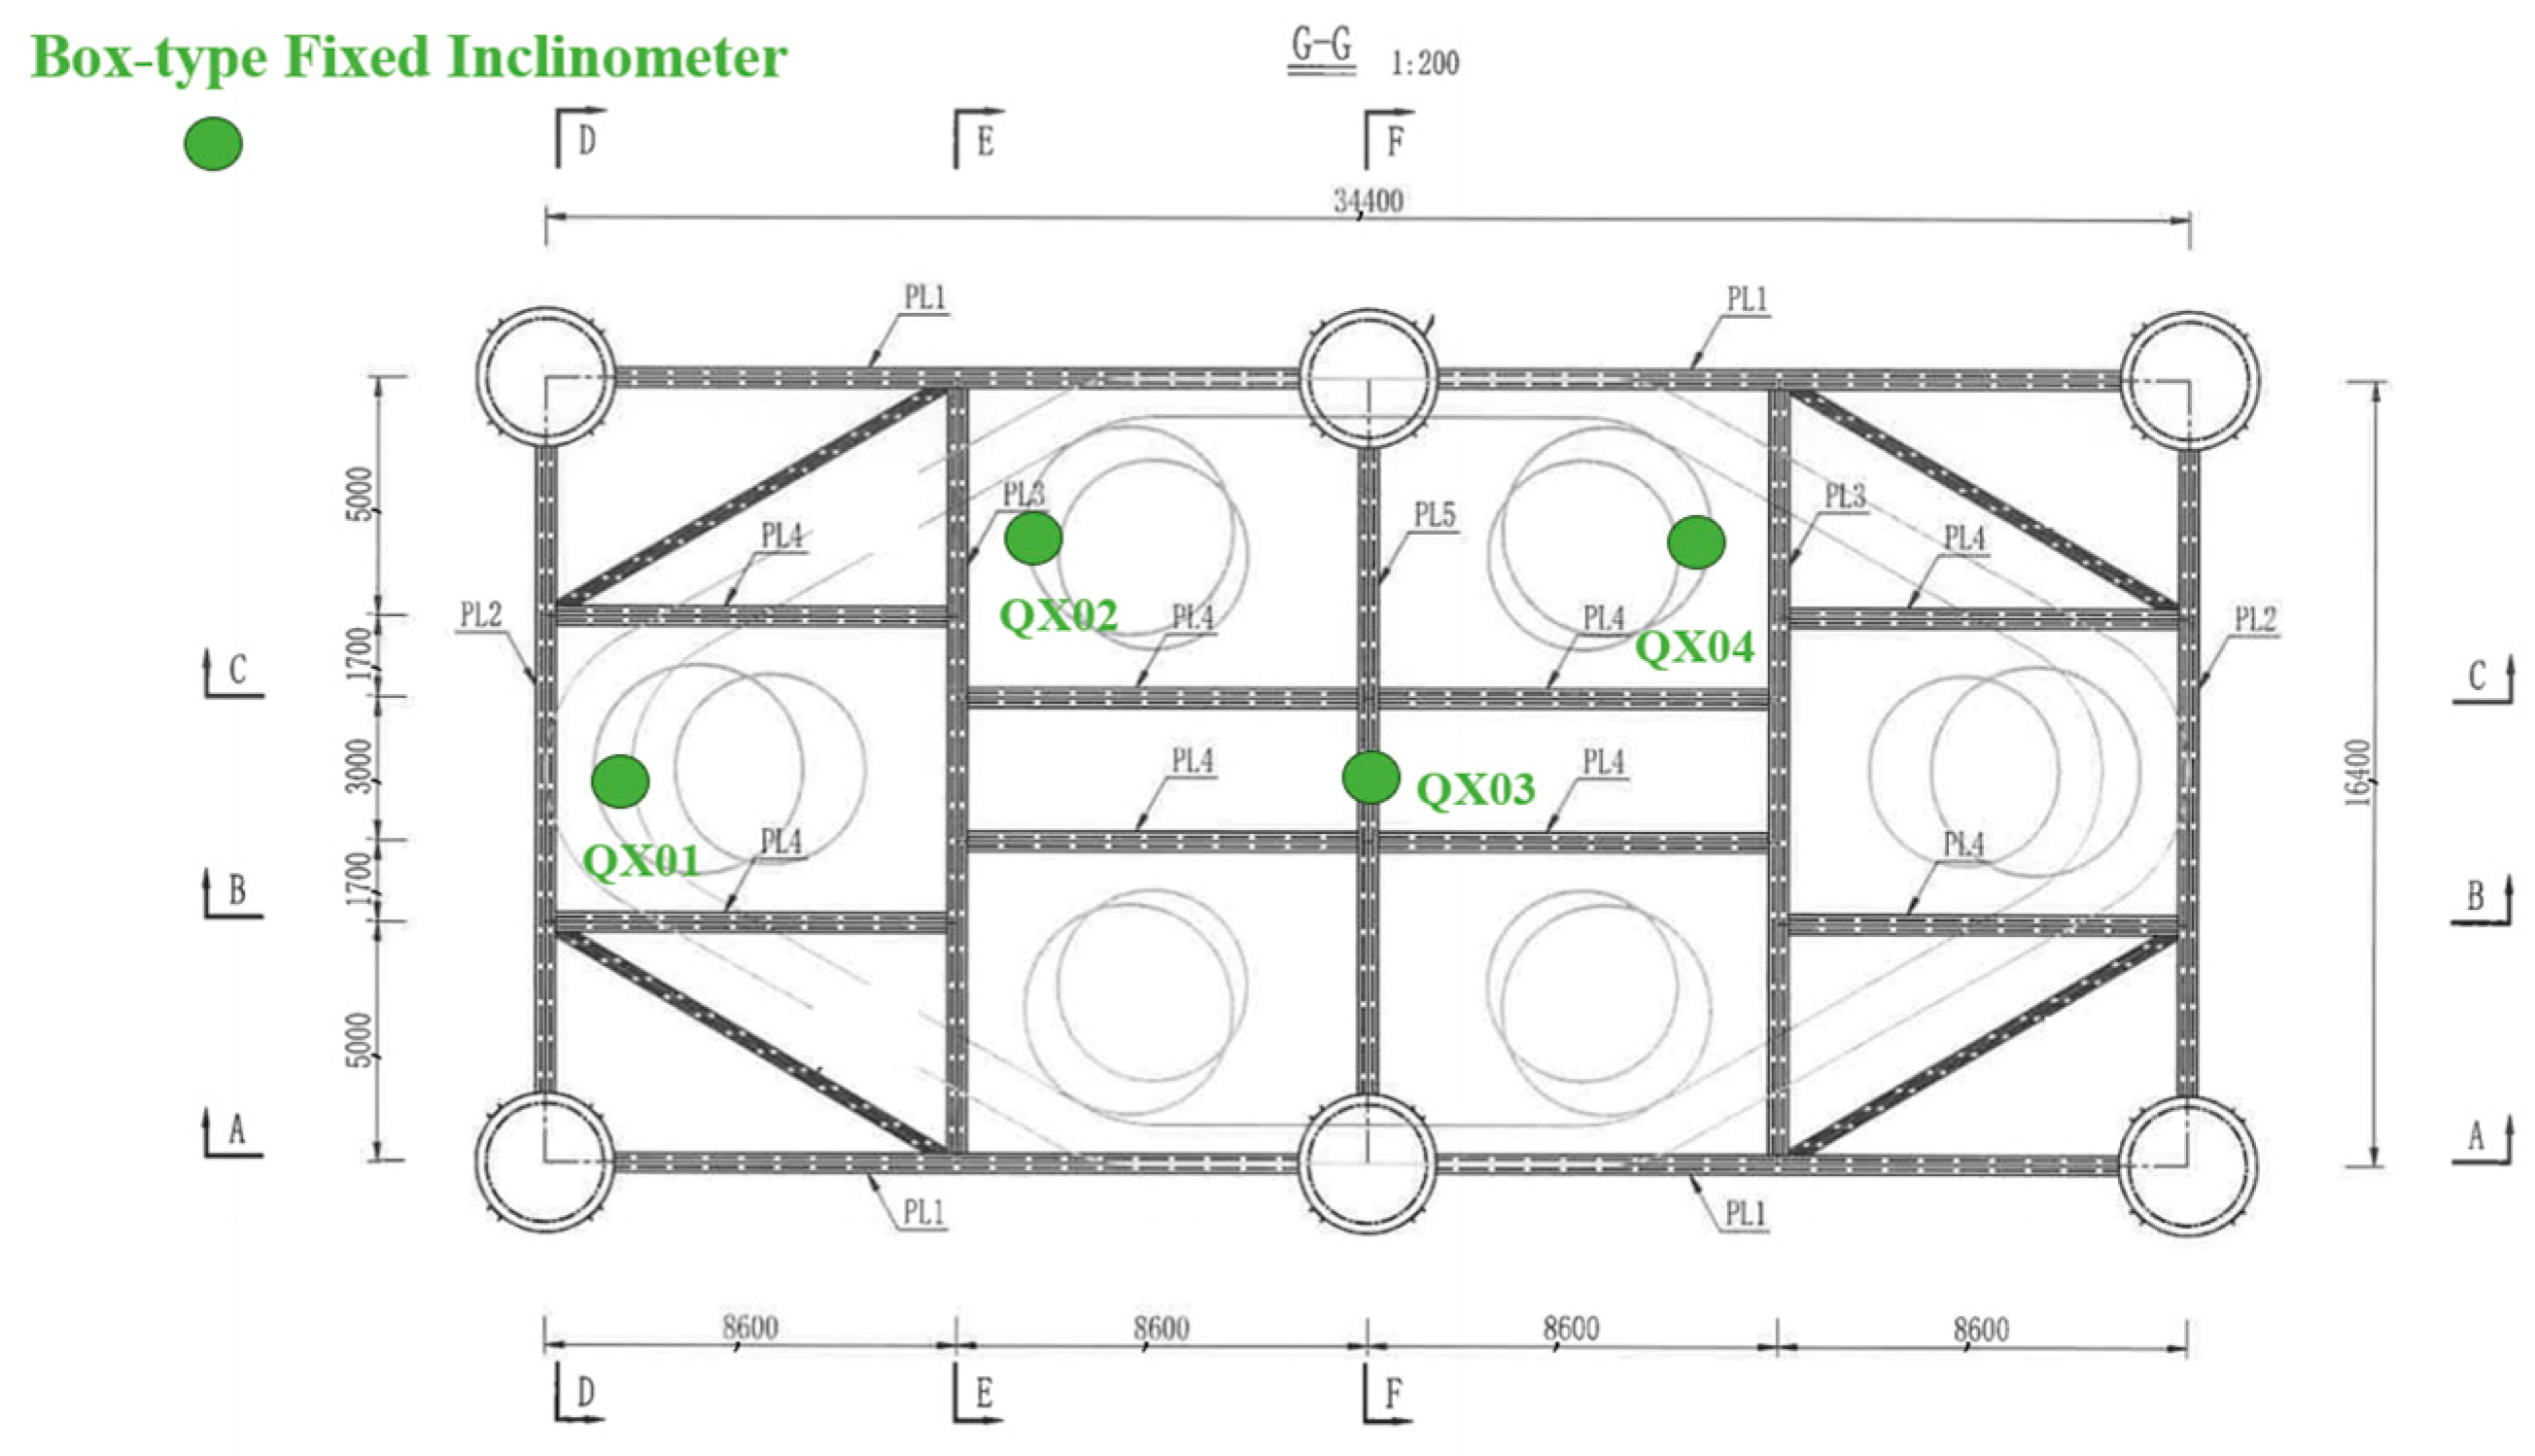
The FS-HGC1 box-type fixed inclinometer measures the inclination angle by measuring the components of the Earth’s gravitational acceleration on the X and Y axes through the internal inclination sensor. The technical parameters of the box-type fixed inclinometer are as follows: Measuring range: ±30°, Resolution: 10 arcseconds, System accuracy: ±0.01°, and Temperature range: −25 °C to +70 °C.
Conduct inclination monitoring on the steel casings of the foundations of four approach bridge piers. The measuring points are arranged on the outer surface of the steel casings and are fixed onto the steel casings by welding through brackets. The measuring points for the inclination monitoring of the pier foundation steel casings are, respectively, arranged on the outer surface of the steel casings and in the middle of the platform with an elevation of +6.270. They are fixed onto the steel casings and the platform by welding through brackets. The specific position is at an elevation of +6.270 m on the top surface of the platform. The schematic diagram of the arrangement of measuring points for box-type fixed inclinometers is shown in Figure 3.

Figure 3.
Schematic Diagram of the arrangement of measuring points for box-type fixed inclinometers.
(2) Monitoring of the stress of the platform
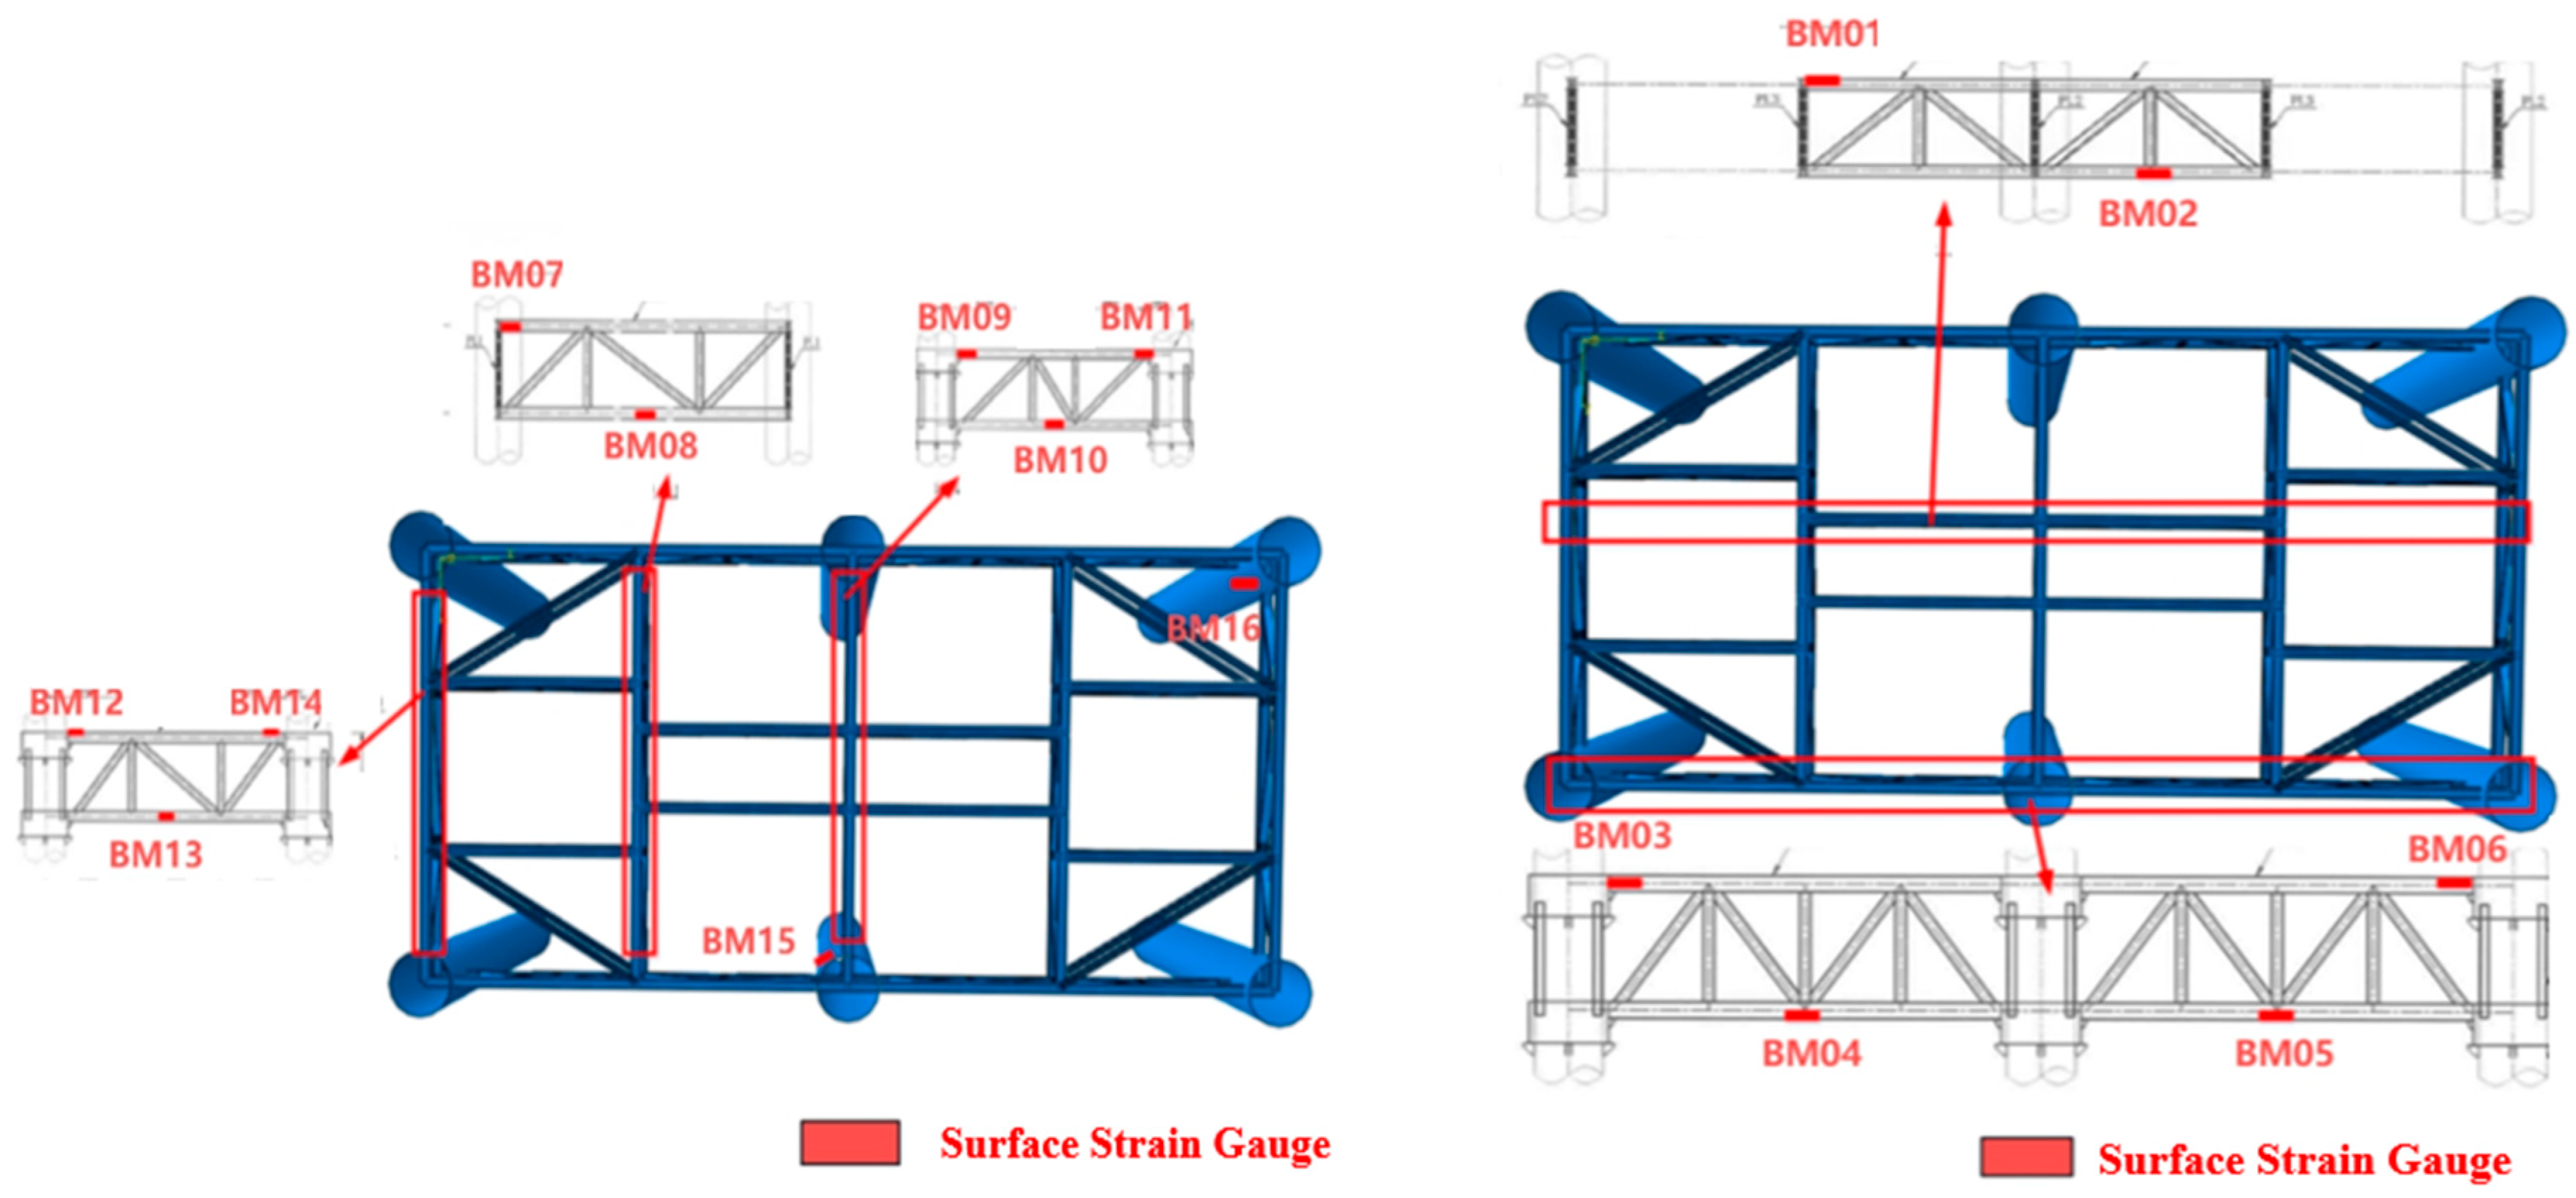
The surface strain gauge is mainly composed of the left and right end mounting supports, the vibrating wire, and the coil. The relevant parameters of the surface strain gauge are as follows: Measuring range: Tension (compression) 1500 με, Total system accuracy: ≤1% full scale, Temperature measurement accuracy: ±0.5 °C, and Operating temperature: −40 °C~80 °C.
Conduct deformation monitoring on the horizontal bracing steel beams and steel pipe piles of the platform. The measuring points for the horizontal bracing steel beams are arranged in the middle of the section steel, while the measuring points for the steel pipe piles are arranged on the outer surface of the steel casings and are installed horizontally. The schematic diagram of the arrangement of measuring points for surface strain gauges is shown in Figure 4.

Figure 4.
Schematic diagram of the arrangement of measuring points for surface strain gauges.
(3) Platform Vibration Monitoring
The accelerometer is a capacitive vibration sensor with a MEMS chip embedded inside. The accelerometer can use a vibration acquisition instrument to collect the output voltage signals, and then convert the voltage to obtain the corresponding acceleration values, thus realizing the measurement of vibration acceleration signals. The relevant parameters of the accelerometer are as follows: Measuring range: ±2 g, Sensitivity: 1.25 ± 5%V/g, Bandwidth: 0 to 50 Hz, and Operating temperature range: −40 °C to 85 °C.
Monitor the overall vibration situation (in the horizontal direction) of the platform. The vibration measuring points are arranged on the platform steel beams with an elevation of +6.270 m. The specific positions are, respectively, located in the middle of the long side of the platform and at the end of the long side of the platform. The schematic diagram of the arrangement of measuring points for accelerometers is shown in Figure 5.
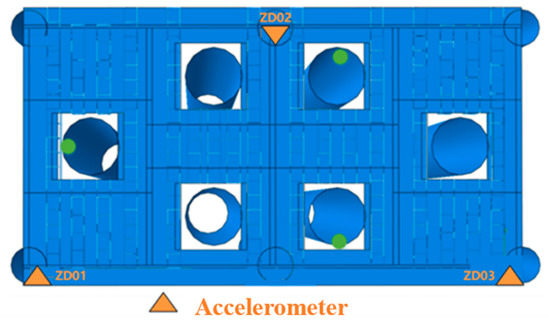
Figure 5.
Schematic diagram of the arrangement of measuring points for accelerometers.
(4) Displacement Monitoring of the Temporary Platform
The displacement meter is an inductive position sensor with a precision sensing element embedded inside. The displacement meter can use a data acquisition device to collect the output inductance signals, and then convert the inductance value to obtain the corresponding displacement value, thus realizing the measurement of the object’s displacement signal. The relevant parameters of the displacement meter are as follows: Measuring range: ±50 mm, Sensitivity: 0.1 ± 3%mV/mm, Bandwidth: 0 to 10 Hz, and Operating temperature range: −20 °C to 70 °C.
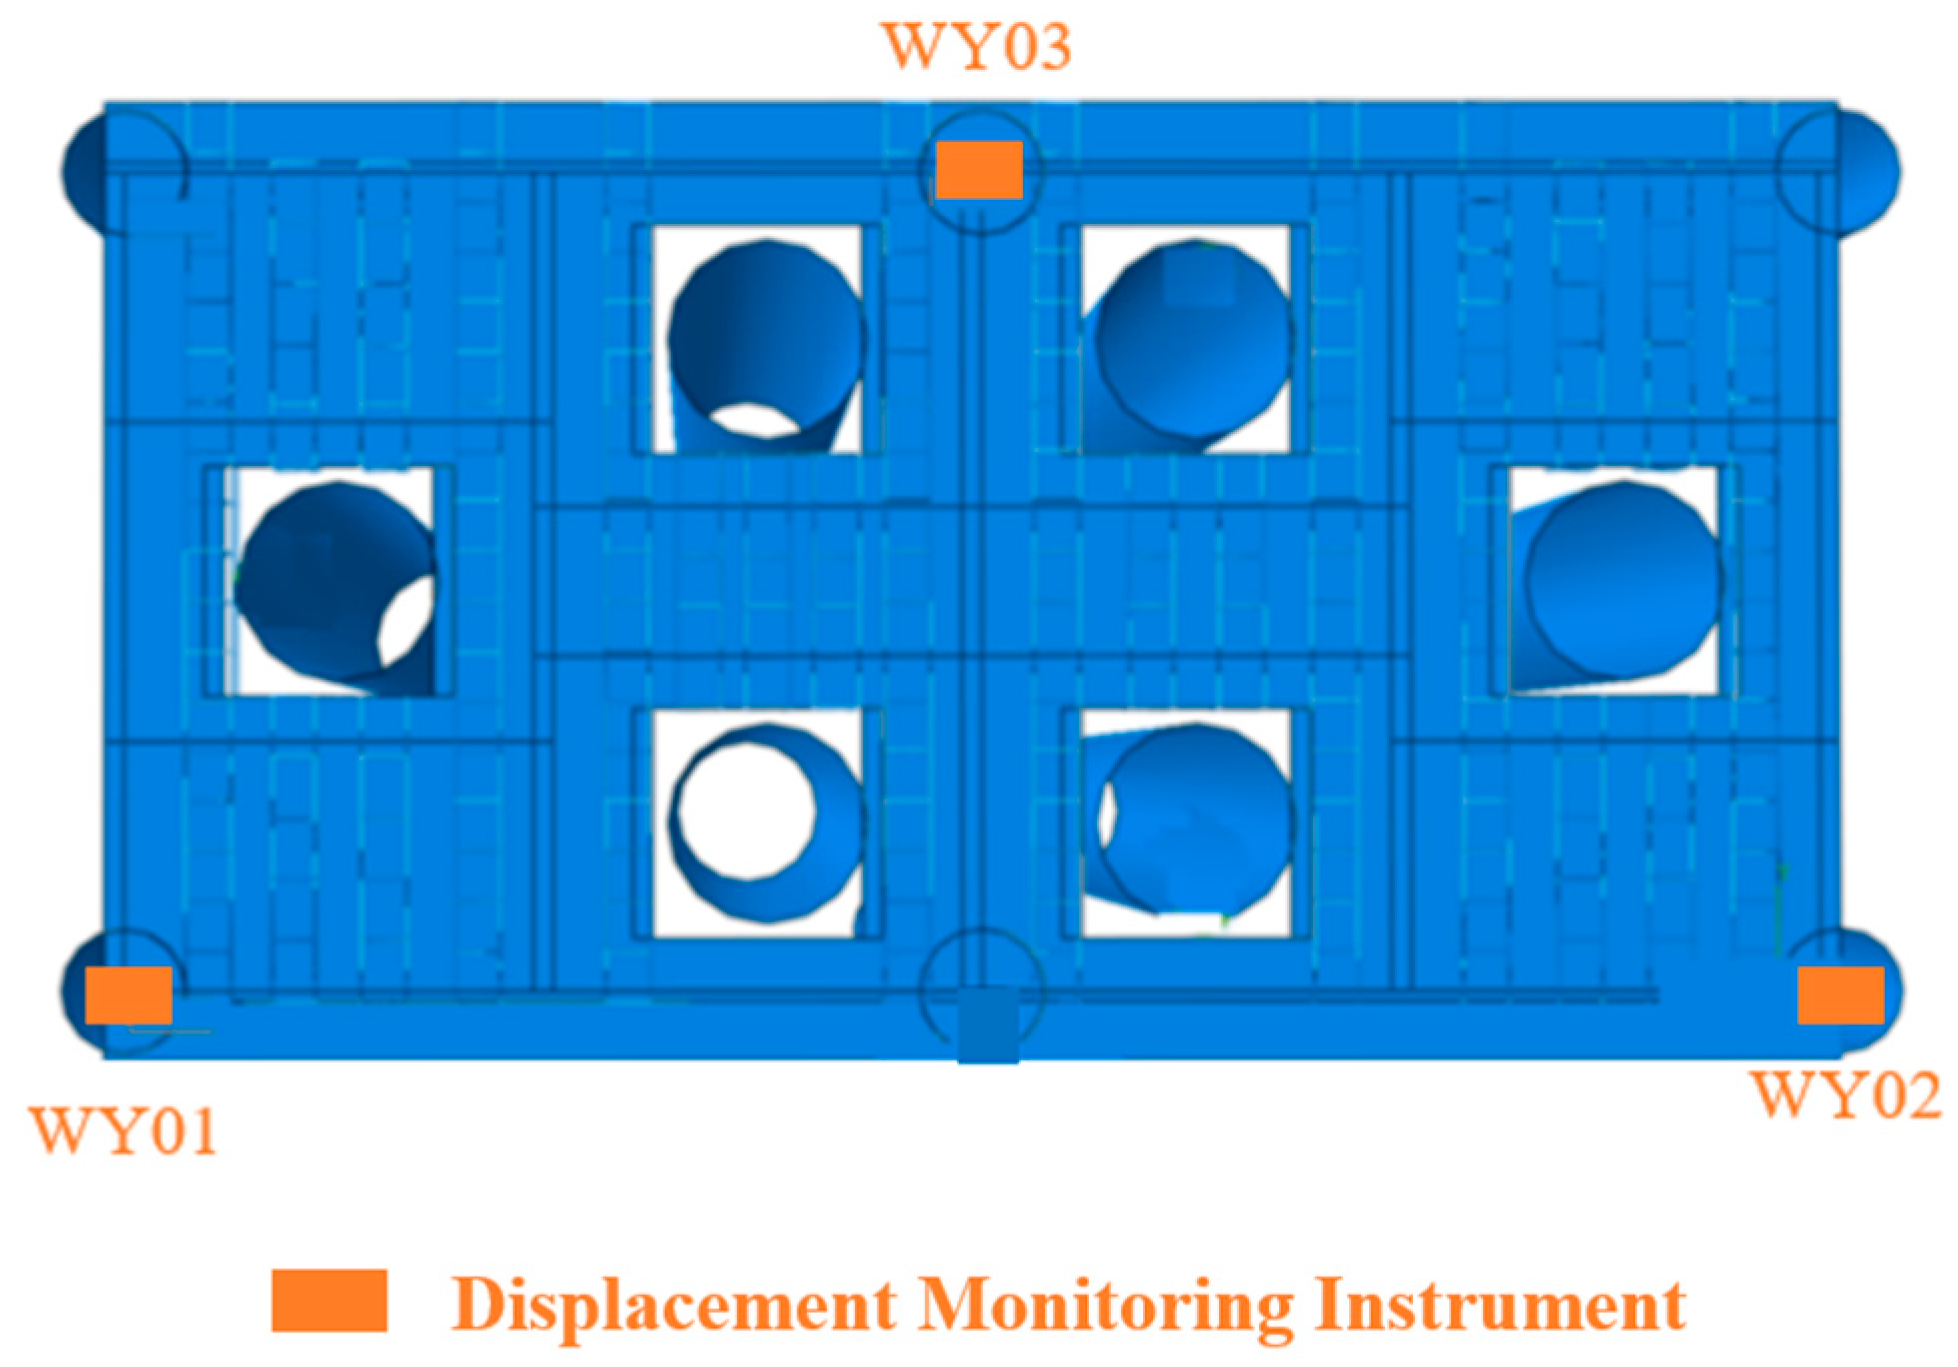
The schematic diagram of the arrangement of displacement measuring points is shown in Figure 6.
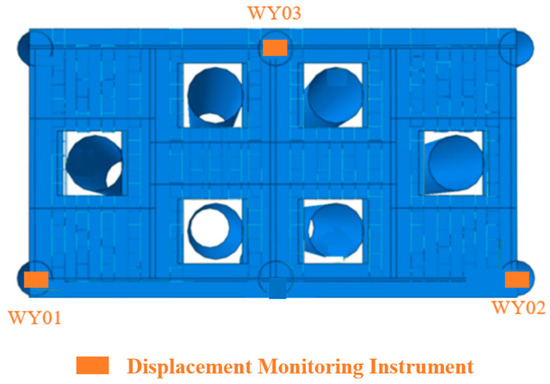
Figure 6.
Schematic diagram of the arrangement of displacement measuring points.
(5) Water Pressure Monitoring
The submersible water level gauge is a high-precision and highly stable intelligent pressure-measuring instrument based on the hydrostatic pressure measurement principle. The relevant parameters of the submersible water level gauge are as follows: Measuring range: 0.2 MPa, Comprehensive accuracy: 0.5% full scale, and Long-term stability: ±0.25% full scale per year.
The schematic diagram of the arrangement of measuring points for submersible water level gauges is shown in Figure 7.
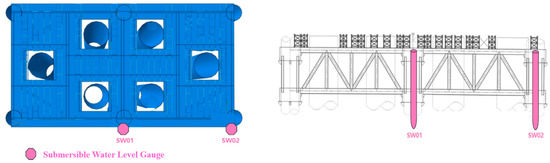
Figure 7.
Schematic diagram of the arrangement of measuring points for submersible water level gauges.
(6) Liquid Level and Flow Velocity Monitoring
The radar flowmeter emits a microwave signal into the fluid. When these signals encounter the fluid, scattering and reflection will occur, and these reflected signals will be received by the receiver. The radar flowmeter measures the time difference and frequency difference of the signals, and determines the flow velocity and liquid level of the fluid through calculation. The relevant parameters of the radar flowmeter are as follows: Water level measuring range: 0~15, Water level accuracy: ±3 mm, Velocity measuring range: 0.1~21 m/s, Water level radar frequency: 26 GHz, and Water level resolution: 1 mm.
The radar flowmeter emits a beam of microwave signals into the fluid. When these signals encounter the fluid, scattering and reflection will occur, and these reflected signals will be received by the receiver. The radar flowmeter will measure the time difference and frequency difference of the signals and determine the flow velocity and liquid level of the fluid through calculation. The schematic diagram of the arrangement of measuring points for radar flowmeters is shown in Figure 8.
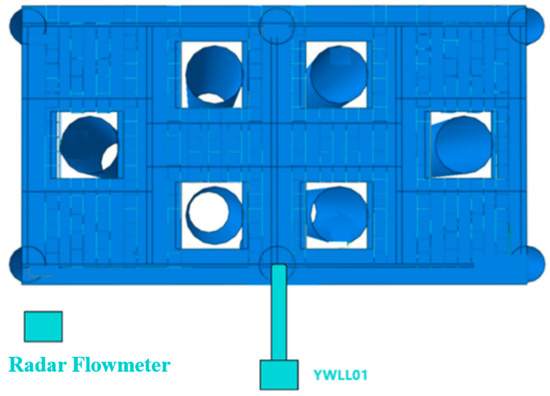
Figure 8.
Schematic diagram of the arrangement of measuring points for radar flowmeters.
3. Analysis of Test Results
This section will discuss the variation laws of the responses such as stress, inclination angle, displacement, and vibration of large temporary platforms for cross-sea bridges with the changes of factors under different sea conditions. Affected by the Severe Tropical Storm Pulasan, from September 18th to 19th, 2024, the wind force along the coast of Fujian Province was 6 to 7 on the Beaufort scale with gusts reaching 8 to 9 on the Beaufort scale. The maximum wind force in the offshore area of northern Fujian Province reached 8 to 10 on the Beaufort scale, with gusts reaching 11 on the Beaufort scale. Considering different sea conditions during normal and typhoon weathers, the differences in forces and deformations of the platform structure under high and low tide levels are analyzed, and the influence degree of parameters such as the tidal height on the platform’s responses is examined as well. Through the in-depth analysis of experimental data, we summarize the general response laws of large temporary work platforms for cross-sea bridges in the environment of high tidal range and strong wind and waves.
3.1. Stress Response
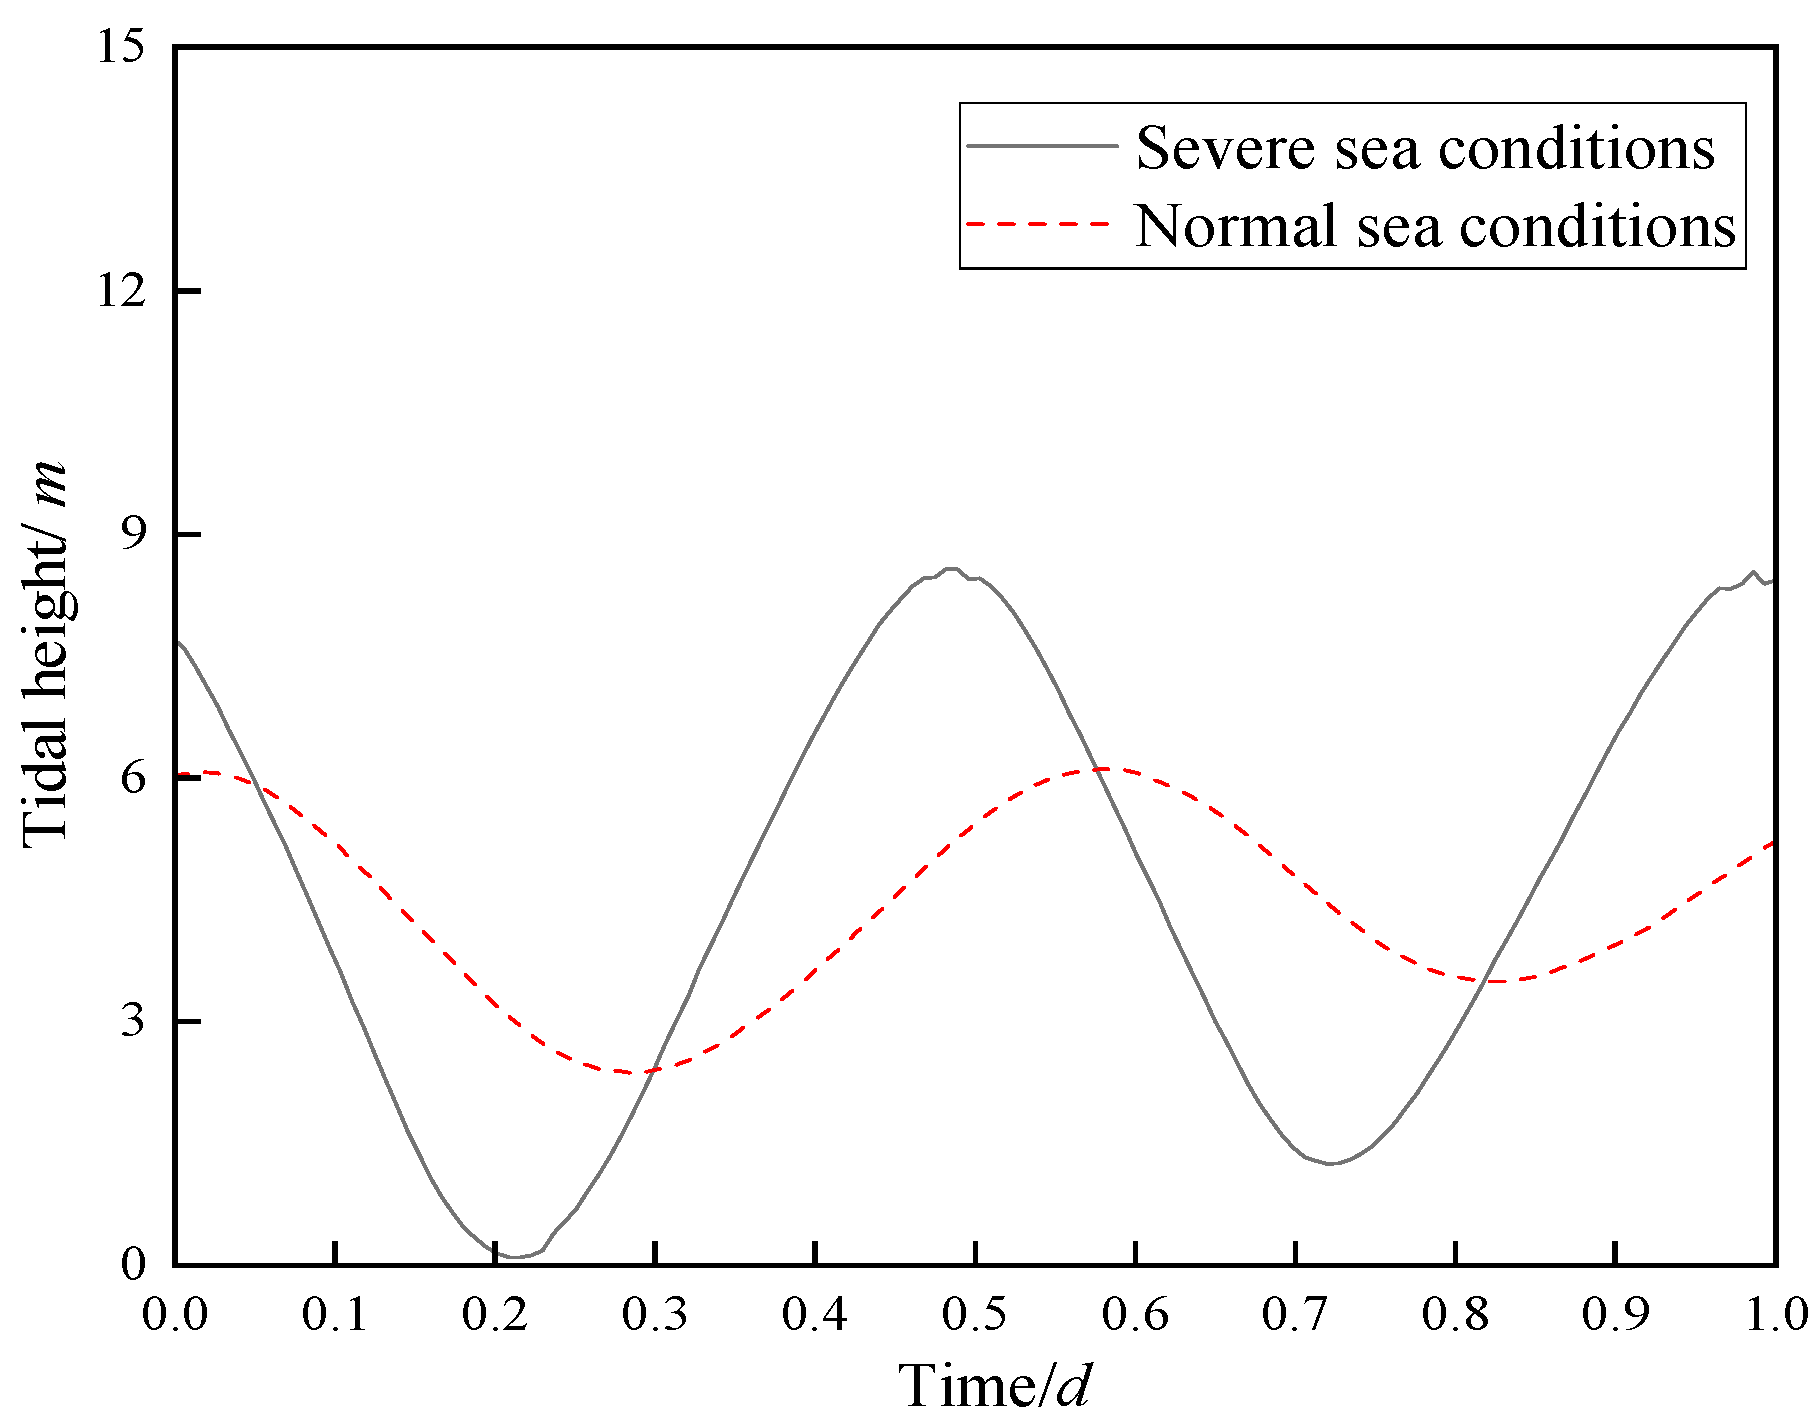
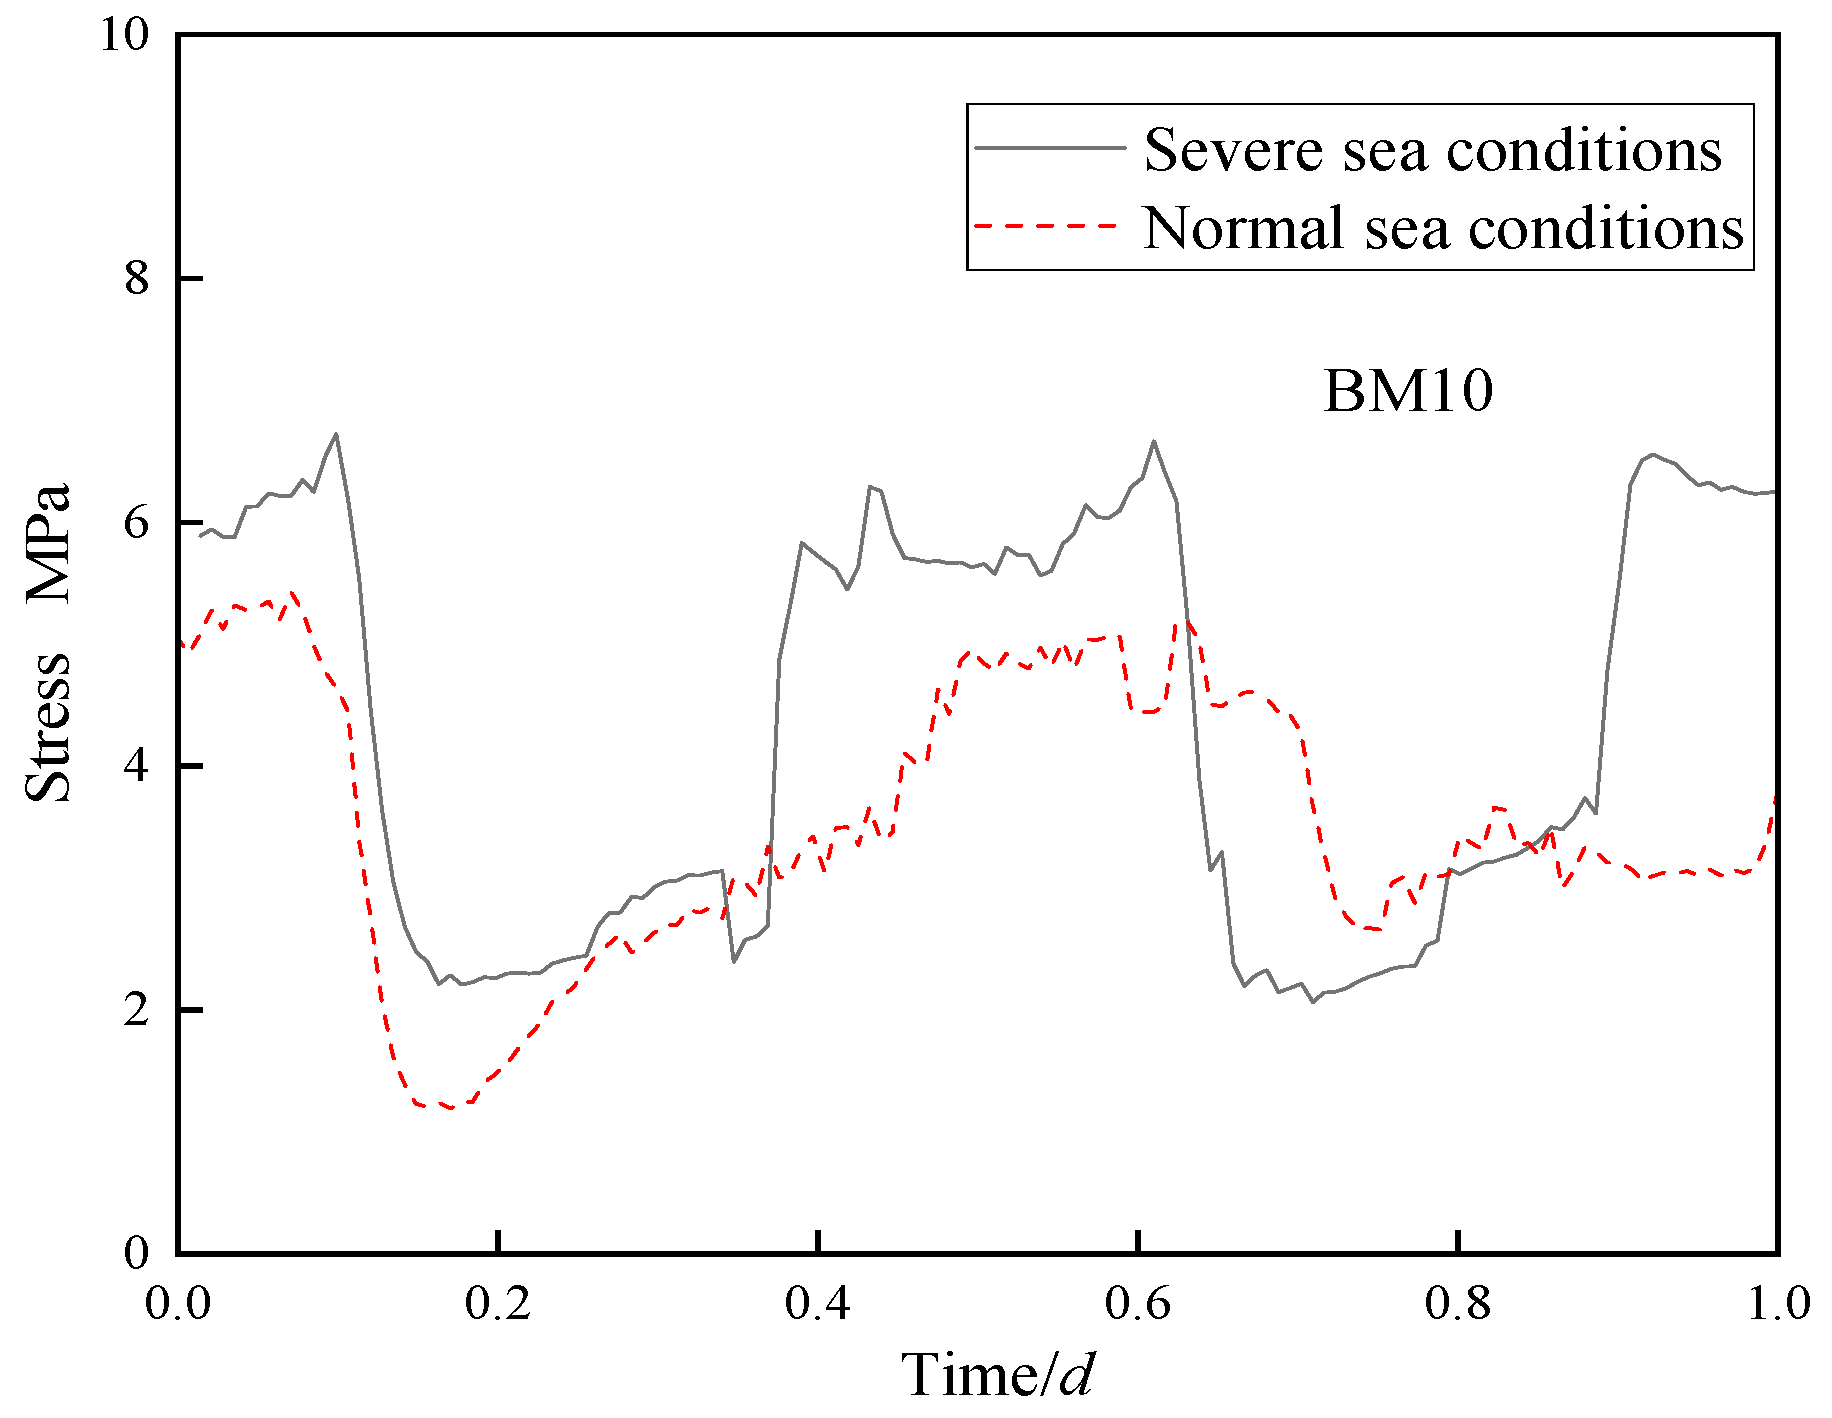
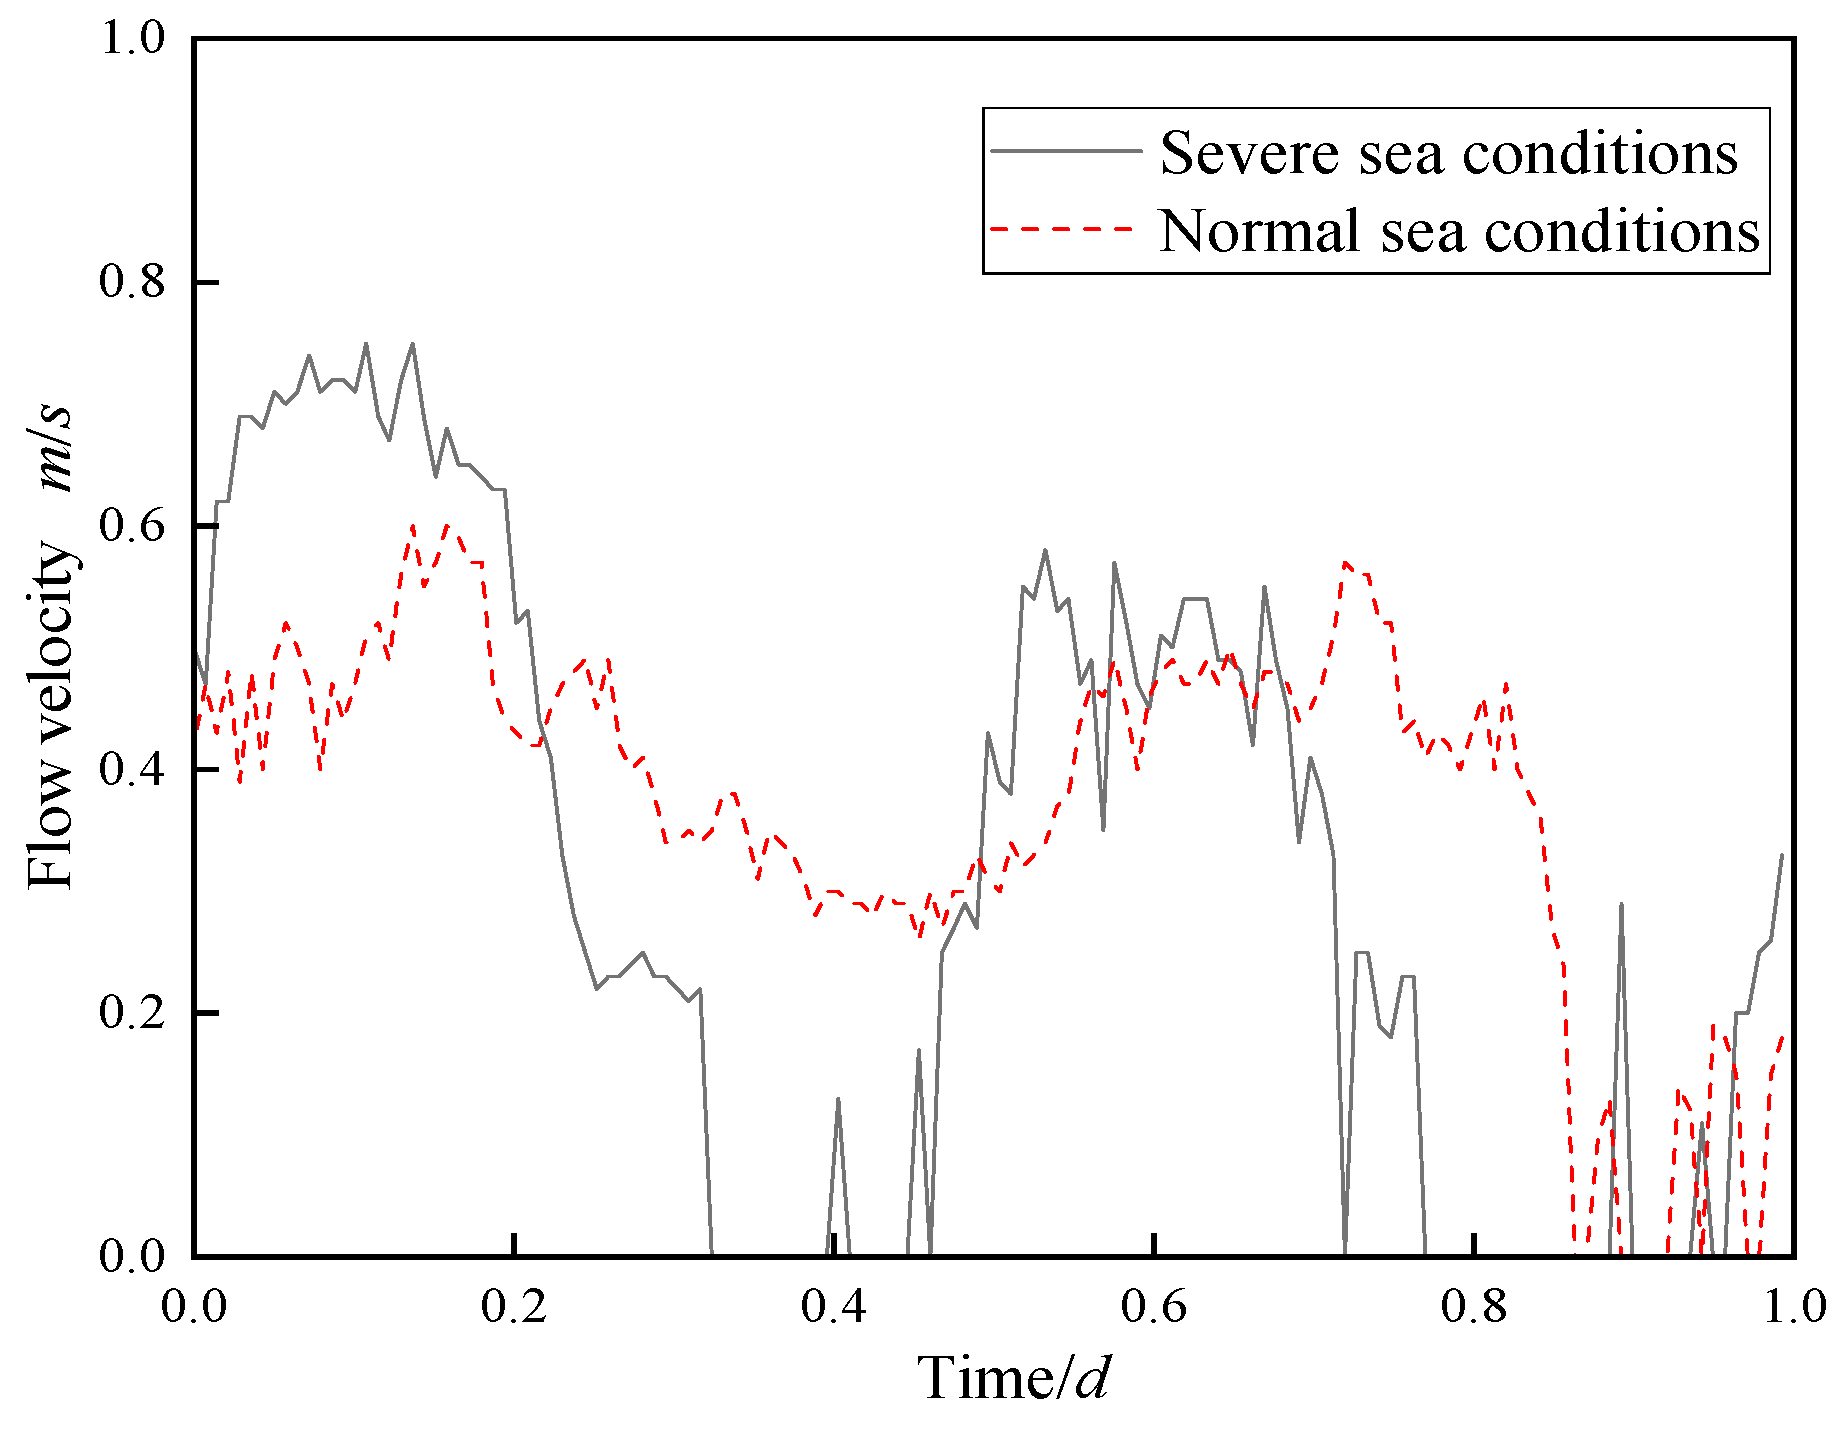
Figure 9, Figure 10 and Figure 11 show the variation of the seawater tidal level, flow velocity, and stress of the offshore temporary platform with the time under normal and severe typhoon sea conditions. It can be found that, under normal sea conditions, the maximum tidal range of seawater is approximately 3.8 m, while, under severe sea conditions, the maximum tidal range of seawater is as high as 8.5 m. Under the severe sea conditions during typhoons, the stress of the offshore temporary work platform structure increases significantly as the tidal range increases, and the stress reaches its maximum value at the high tide level. Under severe sea conditions, when the low tide level increases from 0.12 m to the high tide level of 8.57 m, due to the action of wave forces, the maximum stress of the offshore platform increases by 78%. While under normal sea conditions, at the high tide level of 6.11 m, the stress of the offshore platform is about 43% higher than that at the low tide level of 2.36 m. Meanwhile, compared with that under normal sea conditions, the stress of the offshore platform is higher under severe sea conditions. Under normal sea conditions, when the flow velocity increases from 0.12 m/s to 0.57 m/s, the amplitude of the platform structure stress increases by 44%. Under severe sea conditions, when the flow velocity increases from 0.23 m/s to 0.72 m/s, the amplitude of the platform structure stress increases by 38.4%. This indicates that the flow velocity is an important dynamic factor affecting the stress distribution of the platform. In the design and operation of the platform, the influence of flow velocity needs to be fully considered to ensure the safety and stability of the offshore temporary work platform.
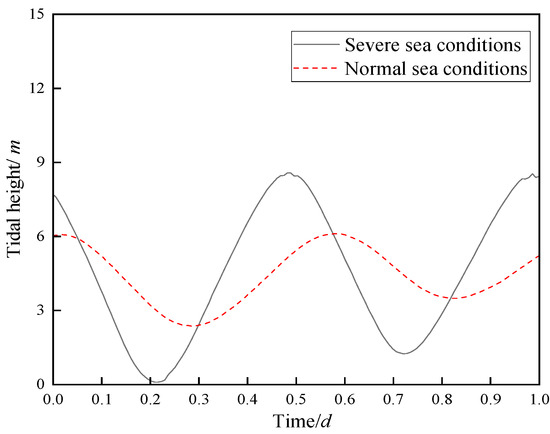
Figure 9.
Variations in the tidal height of the offshore temporary platform over the time under normal sea conditions and severe sea conditions caused by Typhoon “Pulasan”.
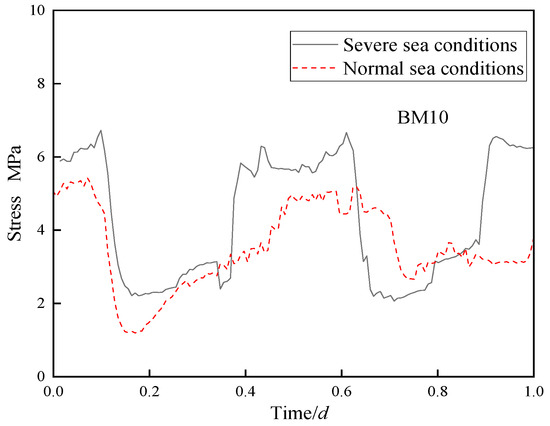
Figure 10.
Variations in the stress of the offshore platform at the BM10 position over the time under normal sea conditions and severe sea conditions caused by Typhoon “Pulasan”.
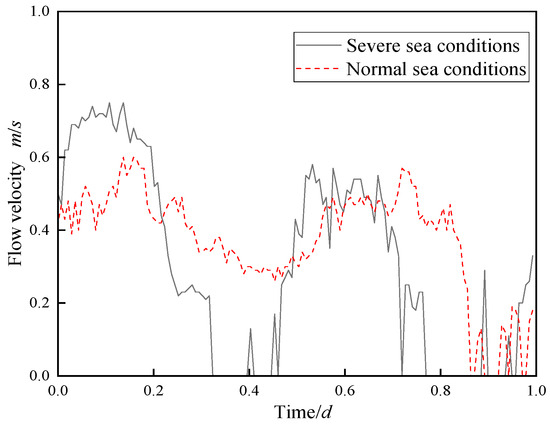
Figure 11.
Variation of the seawater flow velocity with the time under normal sea conditions and severe sea conditions caused by Typhoon “Pulasan”.
3.2. Platform Inclination Angle
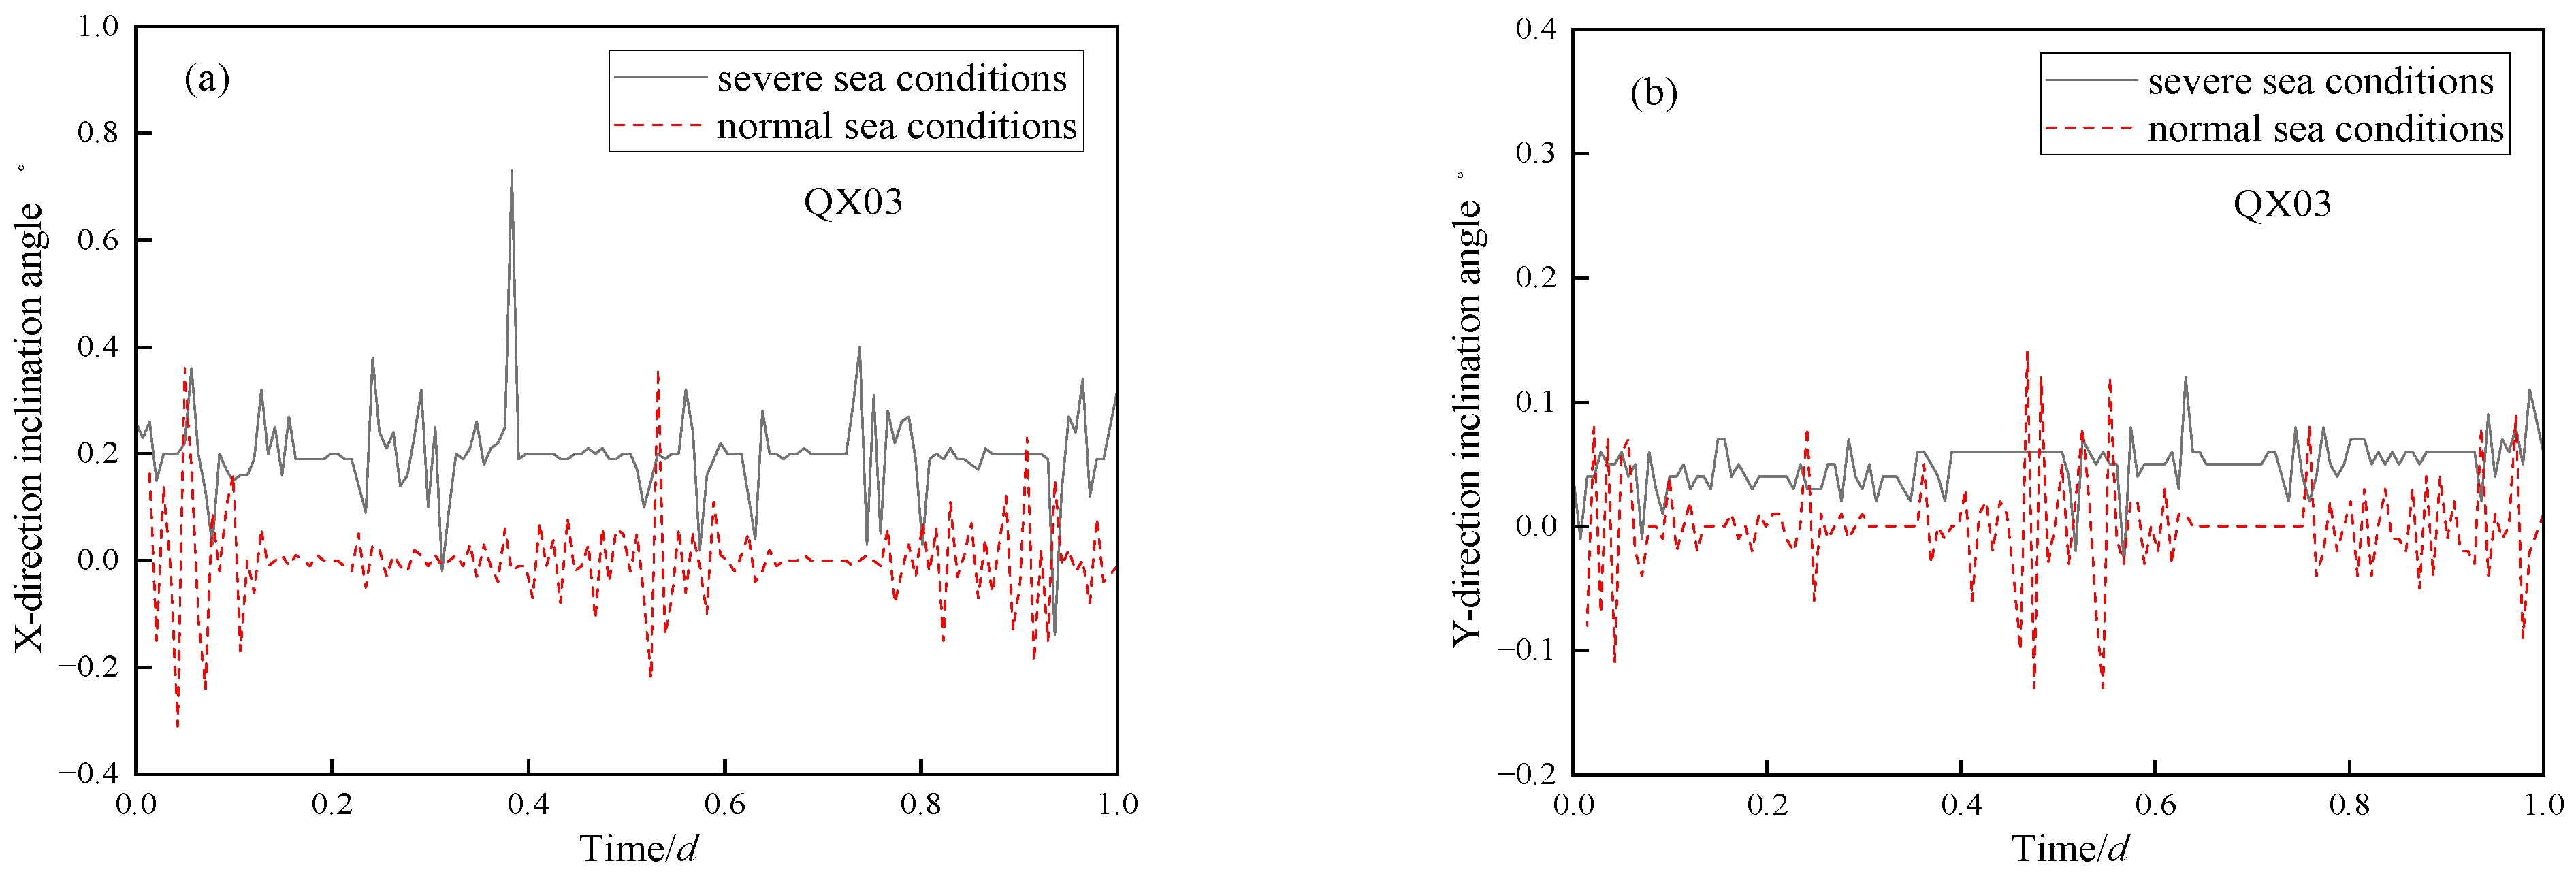
Figure 12 compares the variations in the inclination angle of the large temporary work platform over the time under normal and severe typhoon sea environments. Obviously, due to larger flow velocity, the inclination angle of the large temporary platform under severe sea conditions is much larger than that under normal sea conditions, while the amplitude of the inclination angle change is also relatively small. Moreover, the inclination angle of the platform at the high tide level is much larger than that at the low tide level, and the inclination angle changes drastically at the high tide level, while the amplitude of the inclination angle change is relatively small at the low tide level. Under severe sea conditions, the inclination angle in the X direction (the direction of tidal rise and fall) fluctuates greatly over time, with an obvious fluctuation amplitude and relatively large peak values, and the overall fluctuation is rather violent. The inclination angle in the Y direction (the direction perpendicular to the rise and fall of tides) also fluctuates violently. Although the overall fluctuation amplitude may be slightly smaller compared to that in the X direction, it is also significantly more violent than the fluctuations under normal sea conditions. This is because, under the severe sea conditions caused by typhoons, the X direction is the direction of tidal ebb and flow. Sea waves will generate impact and swaying forces on the platform. The irregular movements of sea waves and the effects of sea waves from different directions will cause the platform to sway in all directions, thus leading to violent fluctuations in the inclination angle in the X direction. Furthermore, the high and low tide levels of seawater also have a certain impact on the change in platform inclination angle. During high tide, the increase in buoyancy may lead to an increase in the inclination angle of the platform, resulting in violent changes in the inclination angle. During low tide, however, with the decrease in buoyancy, the changes in the inclination angle caused by the self-weight of the platform may become smaller.
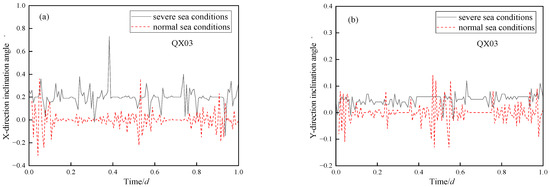
Figure 12.
Variations in the inclination angle over the time under normal sea conditions and severe sea conditions caused by Typhoon “Pulasan”: (a) in the X direction, and (b) in the Y direction.
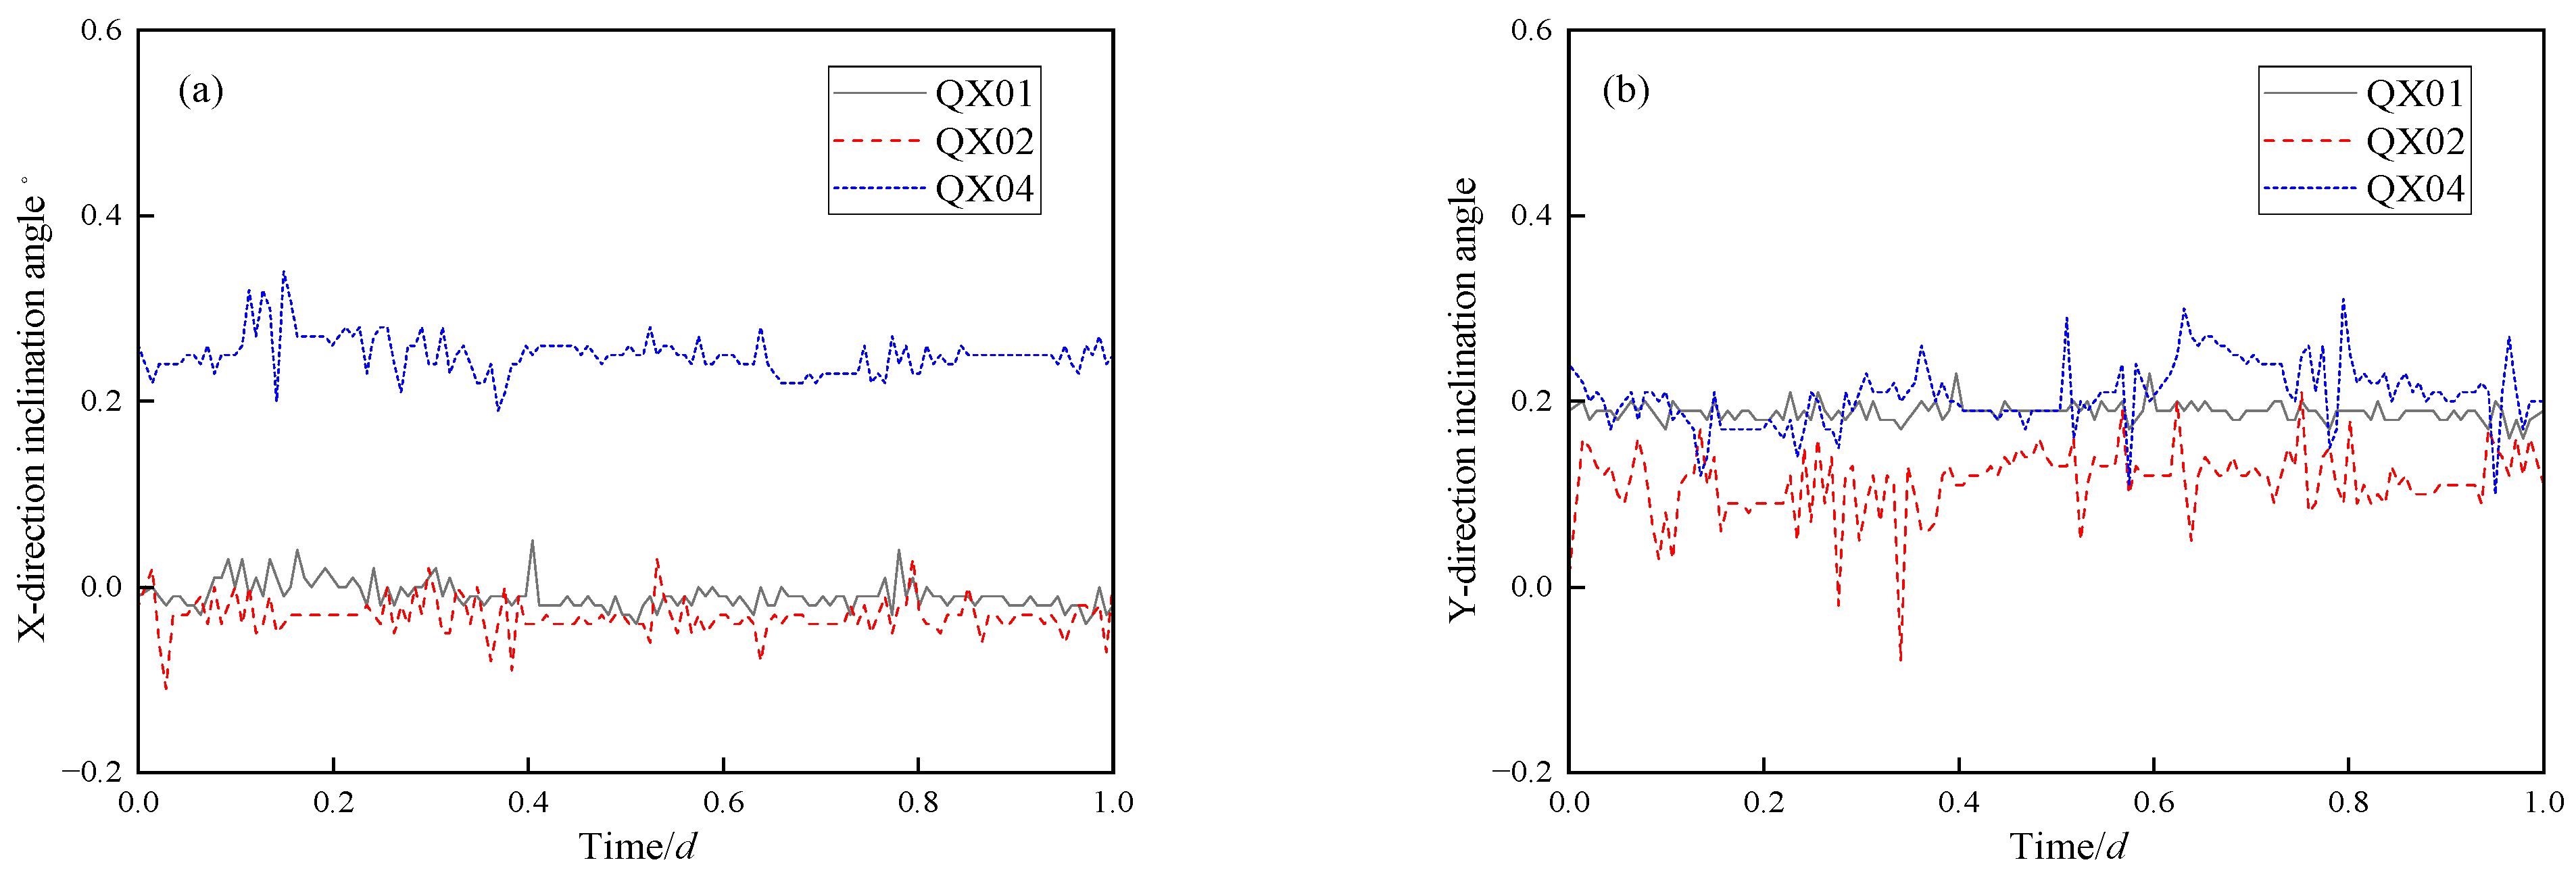
Figure 13 describes the variations in the inclination angle of the steel casings at different positions of the large temporary platform over time under severe typhoon sea state conditions. It can be found from the figure that the inclination angles of the steel casings at position QX01 in the X direction and Y direction are significantly larger than those at positions QX02 and QX04. This indicates that the position QX01 of the large temporary platform is more affected by the high tidal range, and strong wind and waves, and thus requires key attention and inspection so as to detect potential safety hazards in a timely manner.
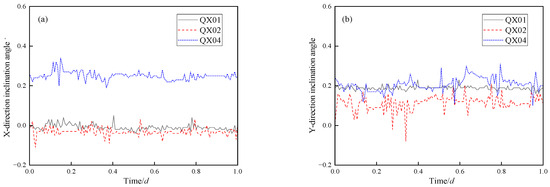
Figure 13.
Variations in the inclination angle of the steel casings at different positions of the large temporary platform over time under the severe sea conditions caused by Typhoon “Pulasan”: (a) X direction, and (b) Y direction.
3.3. Displacement Response
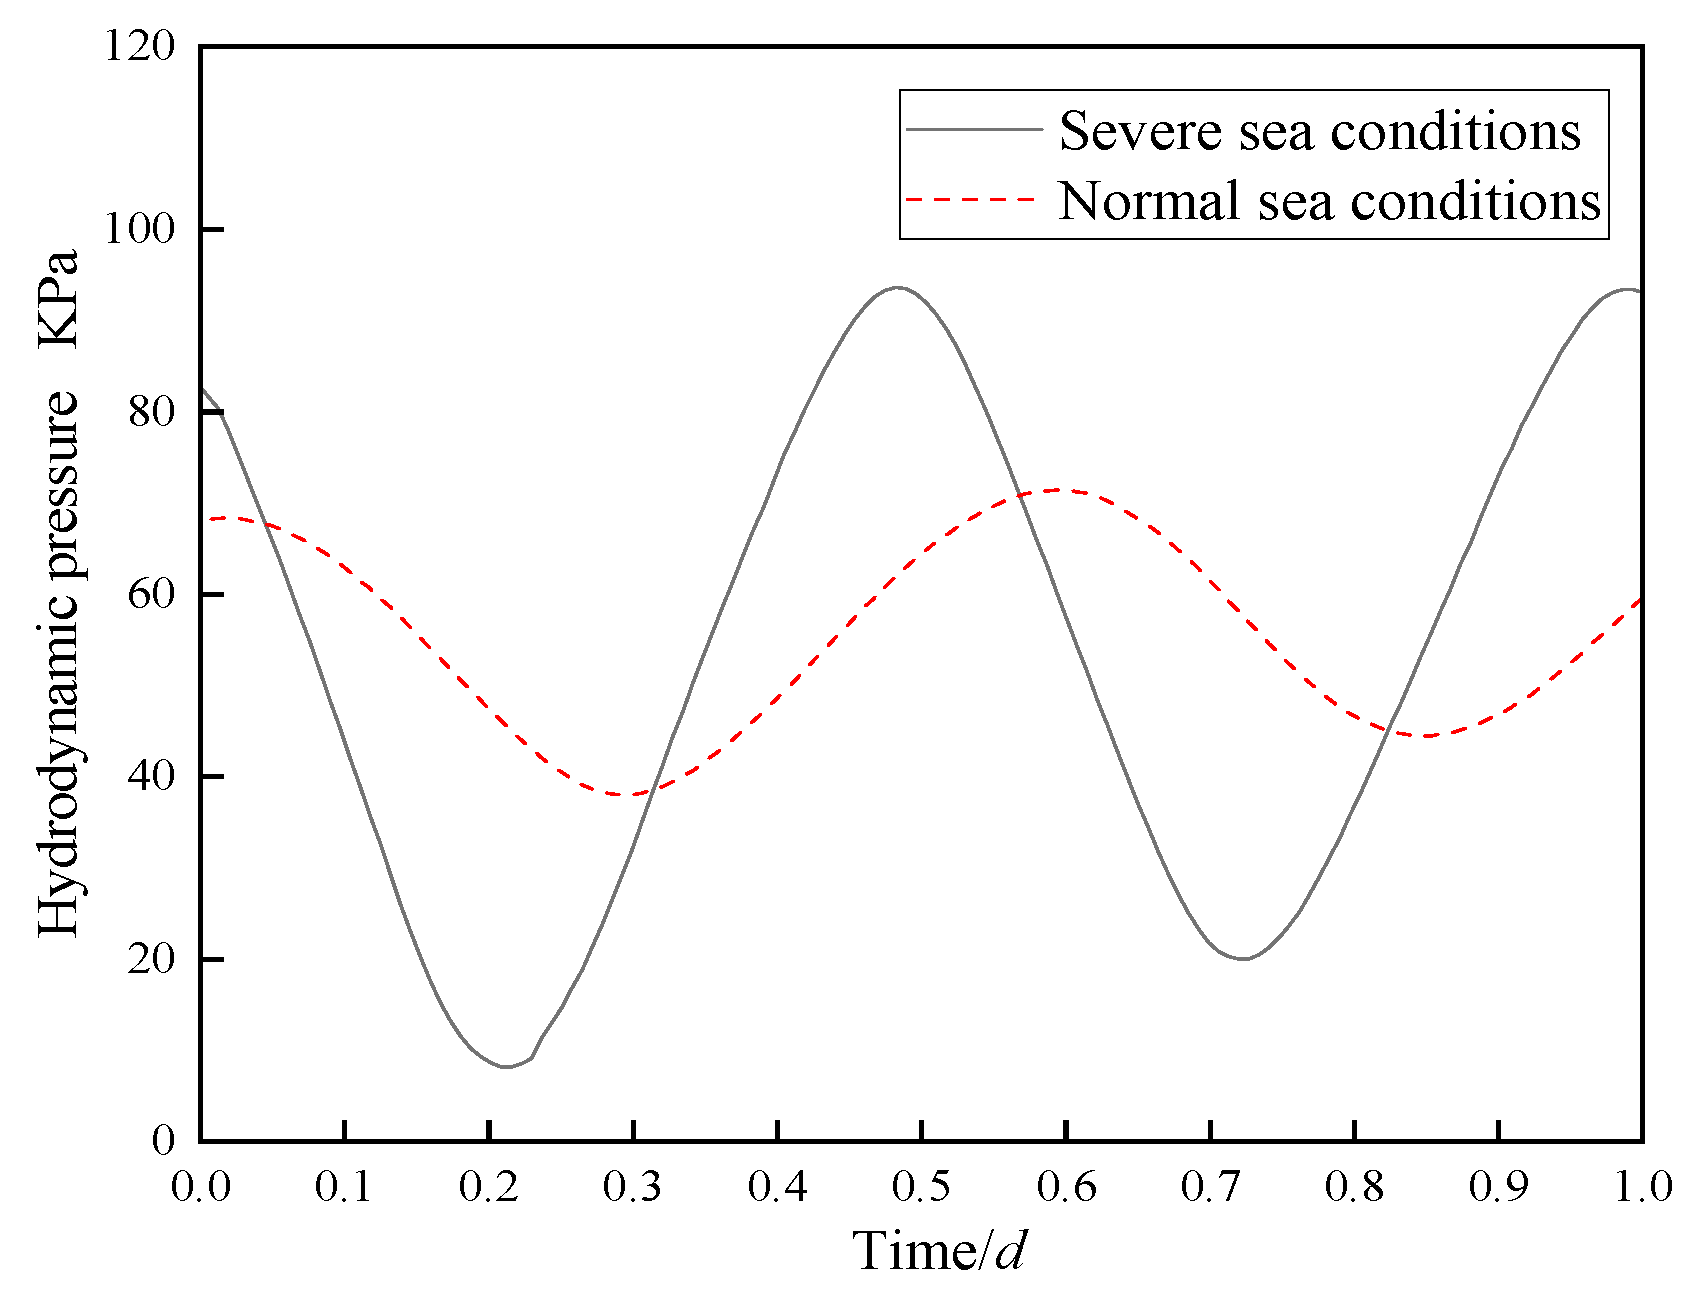
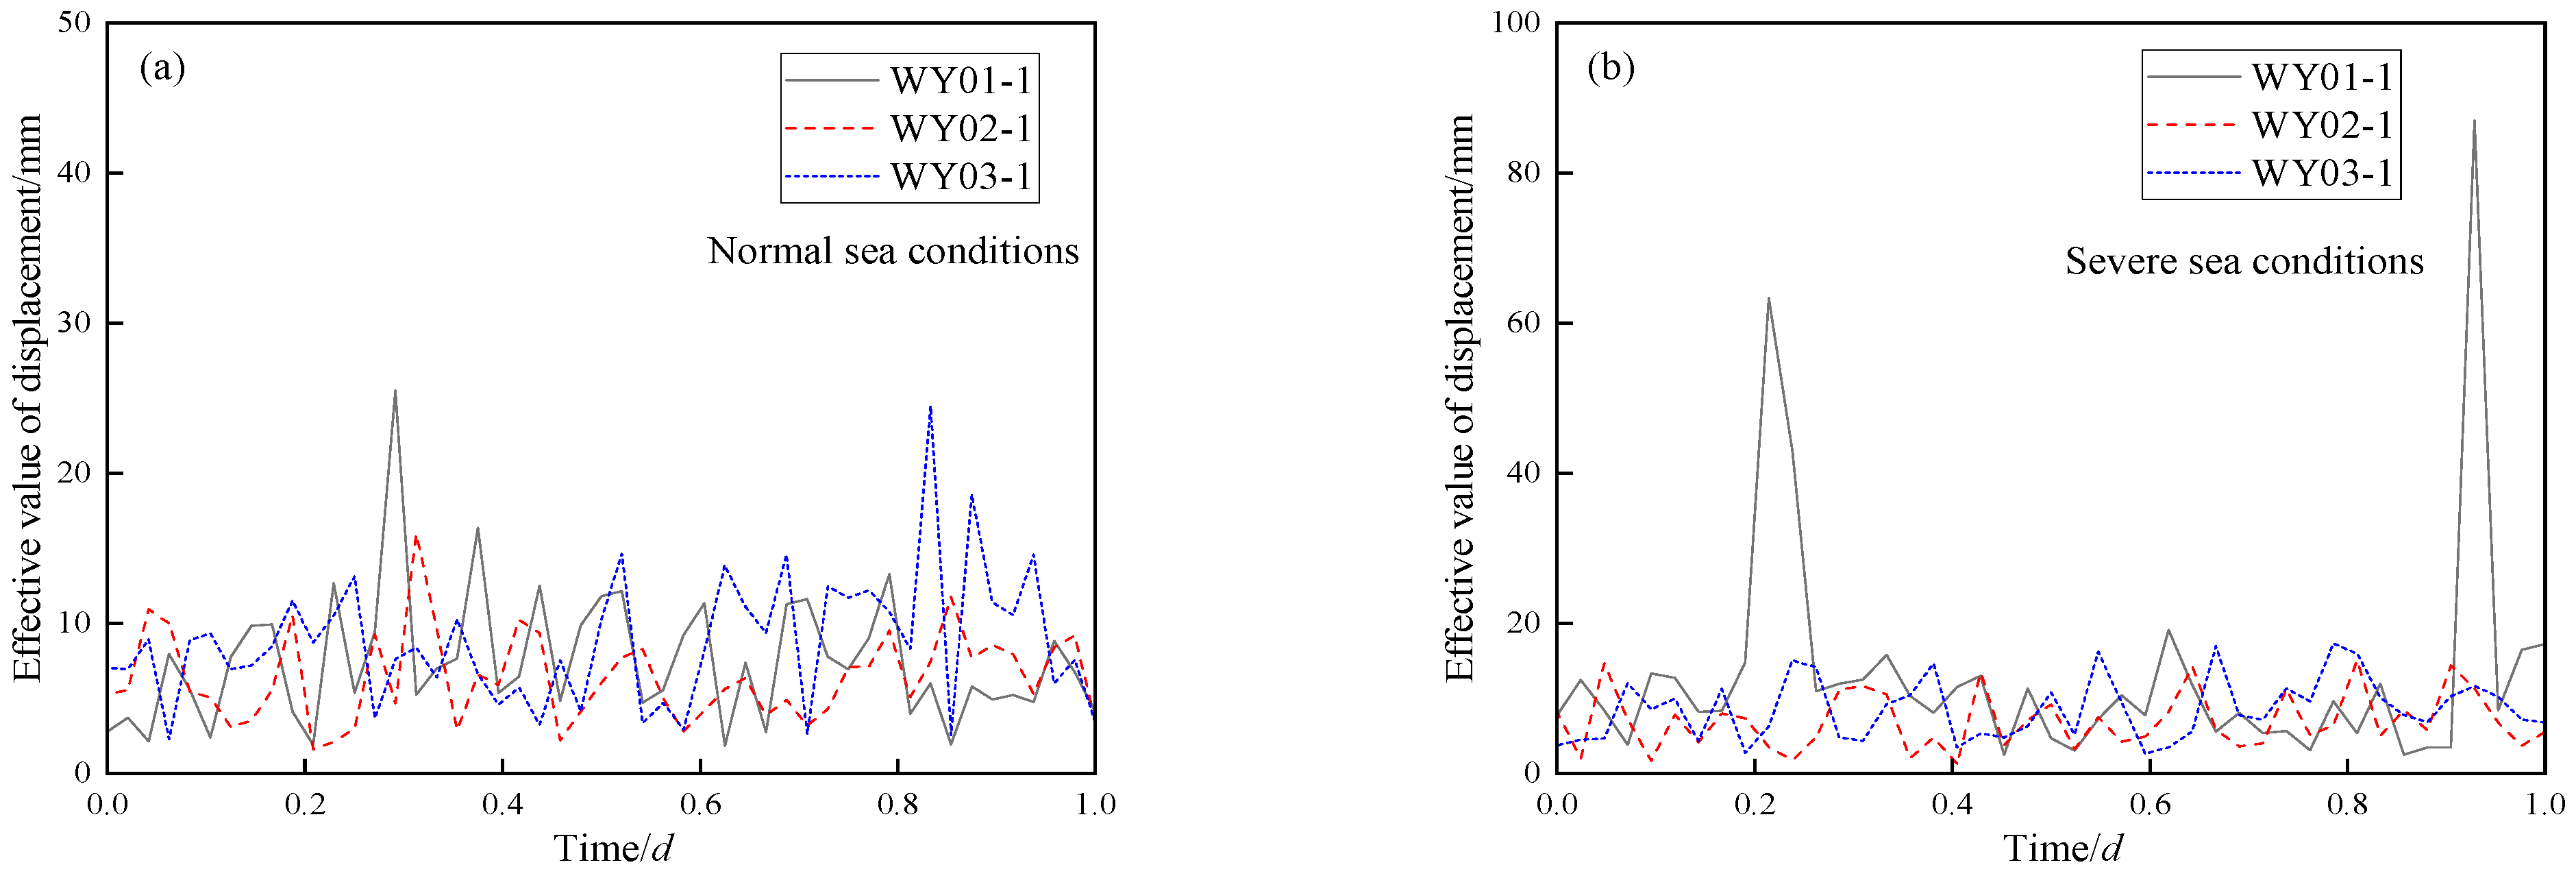
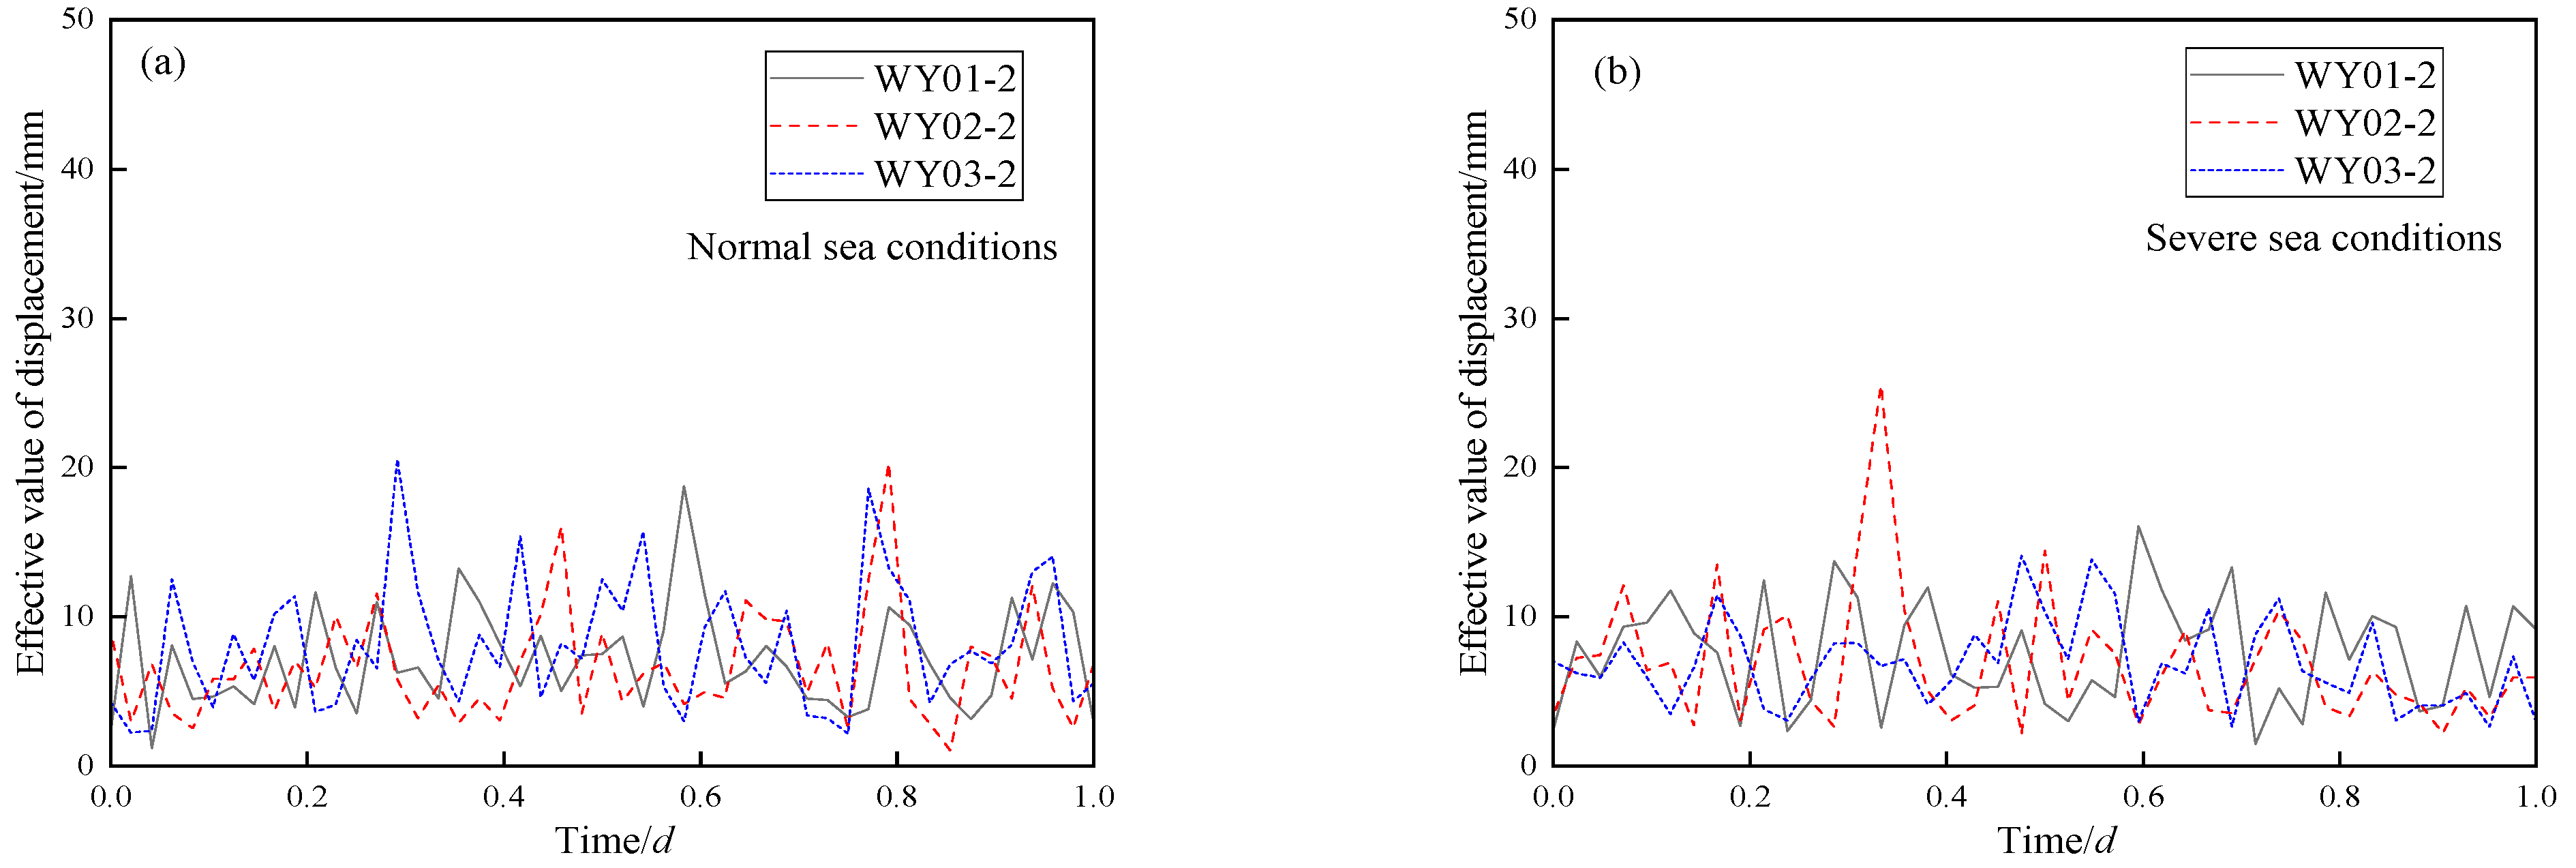
In order to further investigate the impact of hydrodynamic pressure on the displacement response of offshore temporary platforms, Figure 14, Figure 15 and Figure 16, respectively, depict the variation in the effective values of tangential and radial displacements at different positions of the temporary platform over time under the conditions of hydrodynamic pressure, normal sea conditions, and severe typhoon sea conditions. Under severe sea conditions, the hydrodynamic pressure fluctuates vigorously with large amplitudes, while, under normal sea conditions, it remains stable with small amplitudes. As can be seen from the figures, the fluctuation range of the effective value of tangential displacement under severe sea conditions is far greater than that under normal sea conditions, and relatively large peaks occur. The displacement changes at different positions (WY01, WY02, and WY03) are more drastic under severe sea conditions, while the fluctuations of the effective values of displacements at various positions are relatively small under normal sea conditions. This is because, under severe sea conditions, the larger hydrodynamic pressure and the stronger impact forces of wind and waves act directly on the temporary platform, causing the platform to be subjected to greater external forces. These external forces will lead to a greater deformation of the platform structure, thus resulting in an increase in the effective value of tangential displacement and violent fluctuations. However, under normal sea conditions, the external forces are smaller and the deformation of the platform structure is also smaller.
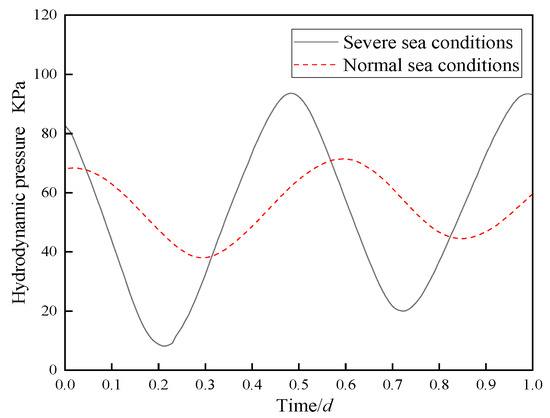
Figure 14.
This figure shows the variation in hydrodynamic pressure with time under normal sea conditions and severe sea conditions caused by Typhoon “Pulasan” on the large temporary platform.
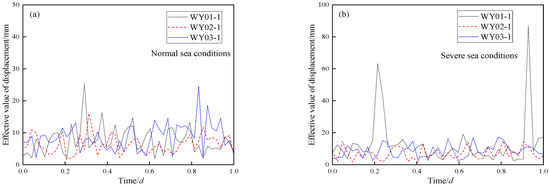
Figure 15.
Variation in the effective value of tangential (X direction) displacement at different positions of the temporary platform with time: (a) normal sea conditions; and (b) severe sea conditions.
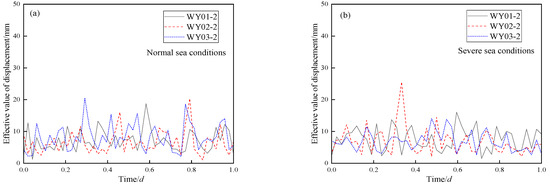
Figure 16.
Variation in the effective value of radial (Y direction) displacement at different positions of the temporary platform with time: (a) normal sea conditions; and (b) severe sea conditions.
3.4. Vibration Response
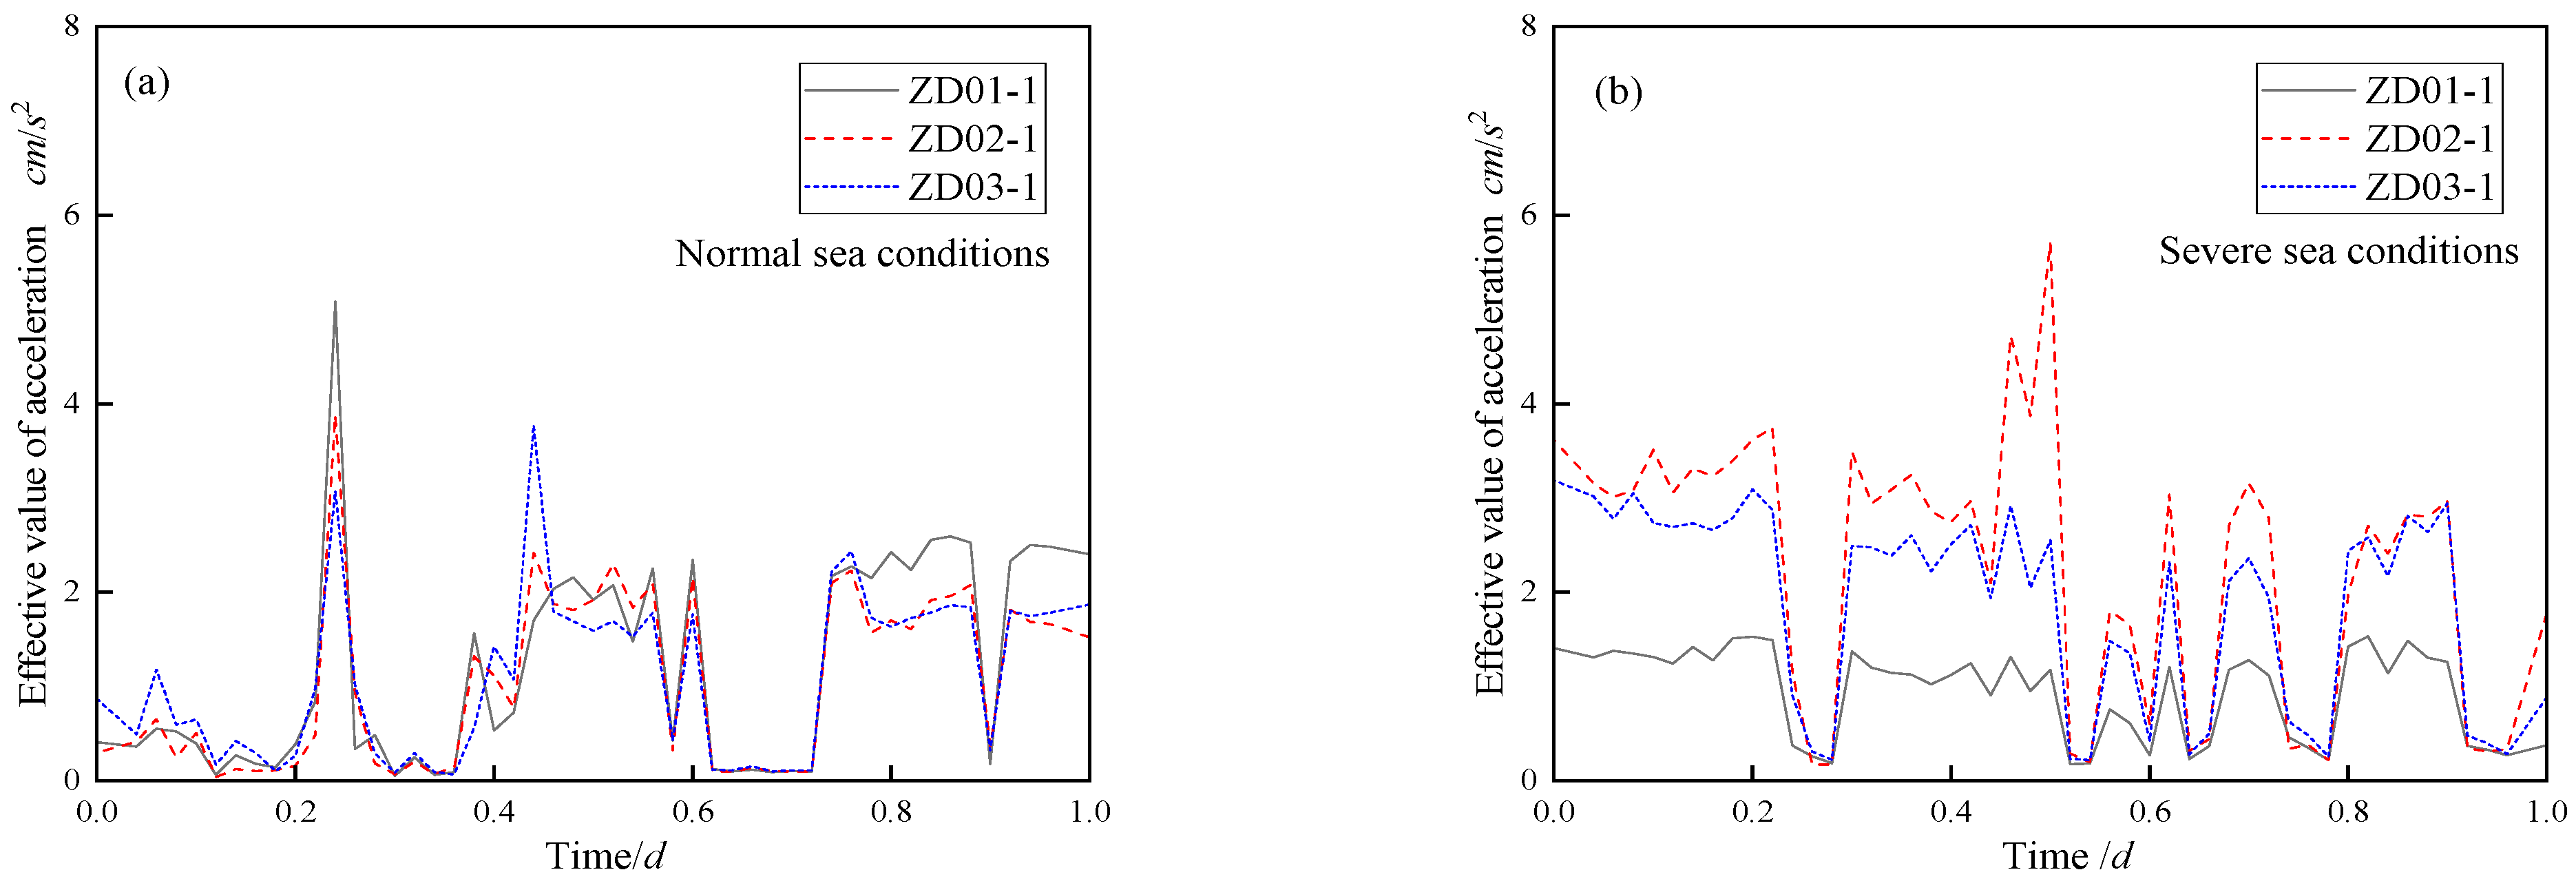
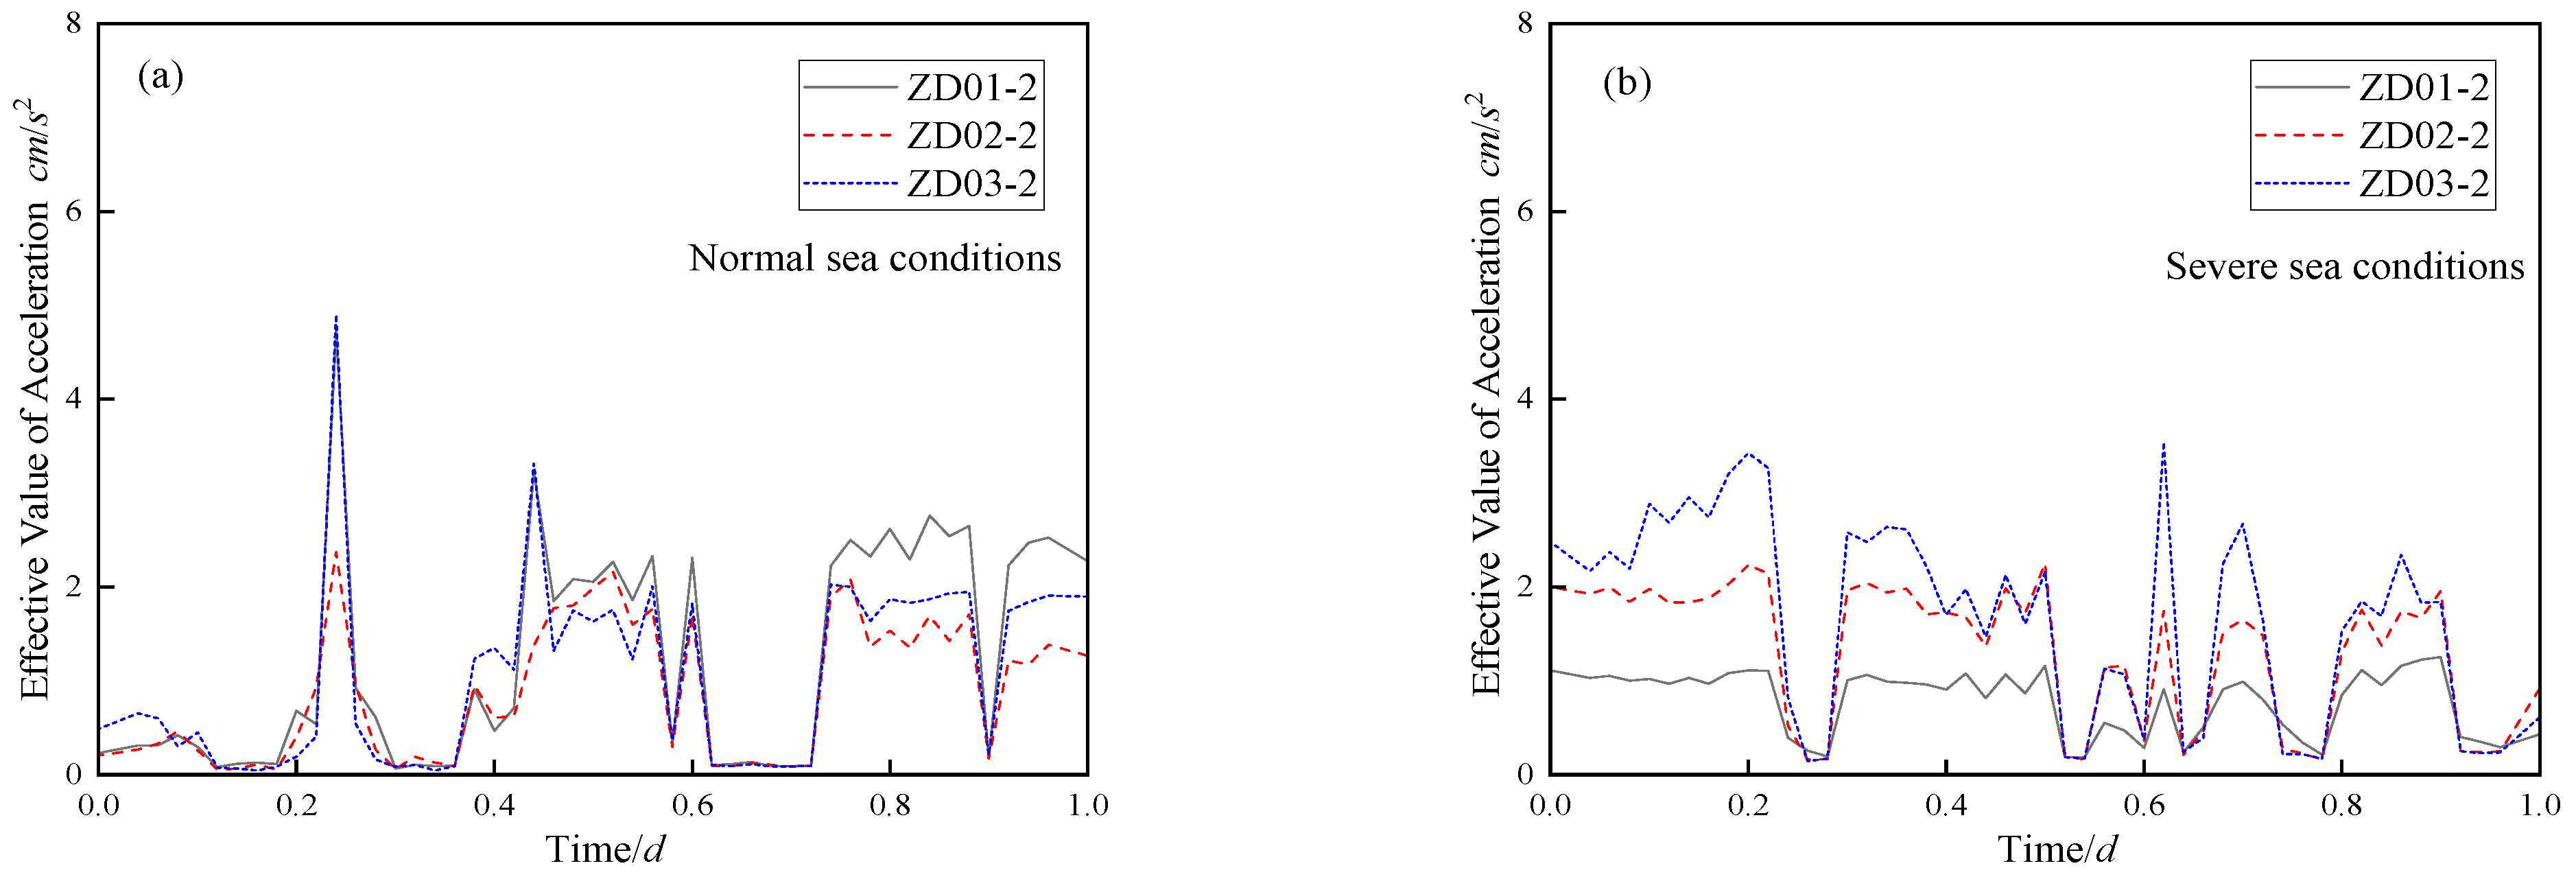
Figure 17 and Figure 18 present the variation rules of the tangential and radial accelerations of steel casings at different positions of the large temporary platform with respect to frequency. Under normal sea conditions, the variation trends of the effective values of tangential accelerations at different positions (ZD01, ZD02, and ZD03) are relatively consistent, and the overall fluctuations are relatively small. Although there are some peaks, these peaks occur at a low frequency and have a short duration. Compared with normal sea conditions, the fluctuations in the curves of the effective values of tangential and radial accelerations at different positions are significantly intensified under severe sea conditions. This indicates that severe sea conditions have a strong influence on the effective values of tangential and radial accelerations at different positions, making their changes more unstable and drastic. The values of the effective values of acceleration generally increase, and the frequency at which peaks appear significantly rises. The undulations of the curves are more frequent and intense, and the duration of these peaks is relatively long, not dropping back to a lower level as quickly as under normal sea conditions. This is because, under normal sea conditions, the energy of waves is relatively small, and the energy transferred to the platform is also relatively less. As a result, the motion response of the platform in the tangential direction is not intense, so the fluctuation of the effective value of tangential acceleration is small. However, under severe sea conditions, factors such as waves and wind possess greater energy and transfer more energy to the platform, leading to a more complex and intense dynamic response of the platform in the tangential direction, and thus causing large fluctuations in the effective value of tangential acceleration.
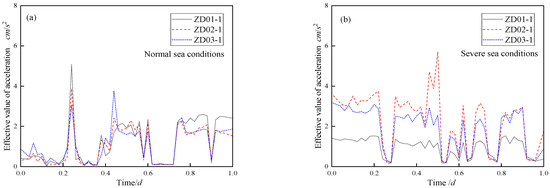
Figure 17.
Variation in the effective value of tangential acceleration at different positions of the offshore temporary platform with time: (a) normal sea conditions; and (b) severe sea conditions.
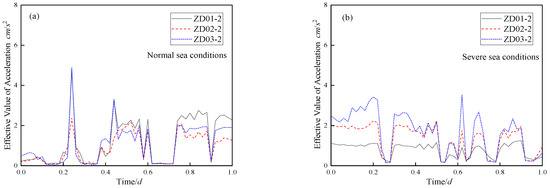
Figure 18.
Variation in the effective value of radial acceleration at different positions of the temporary platform with time: (a) normal sea conditions; and (b) severe sea conditions.
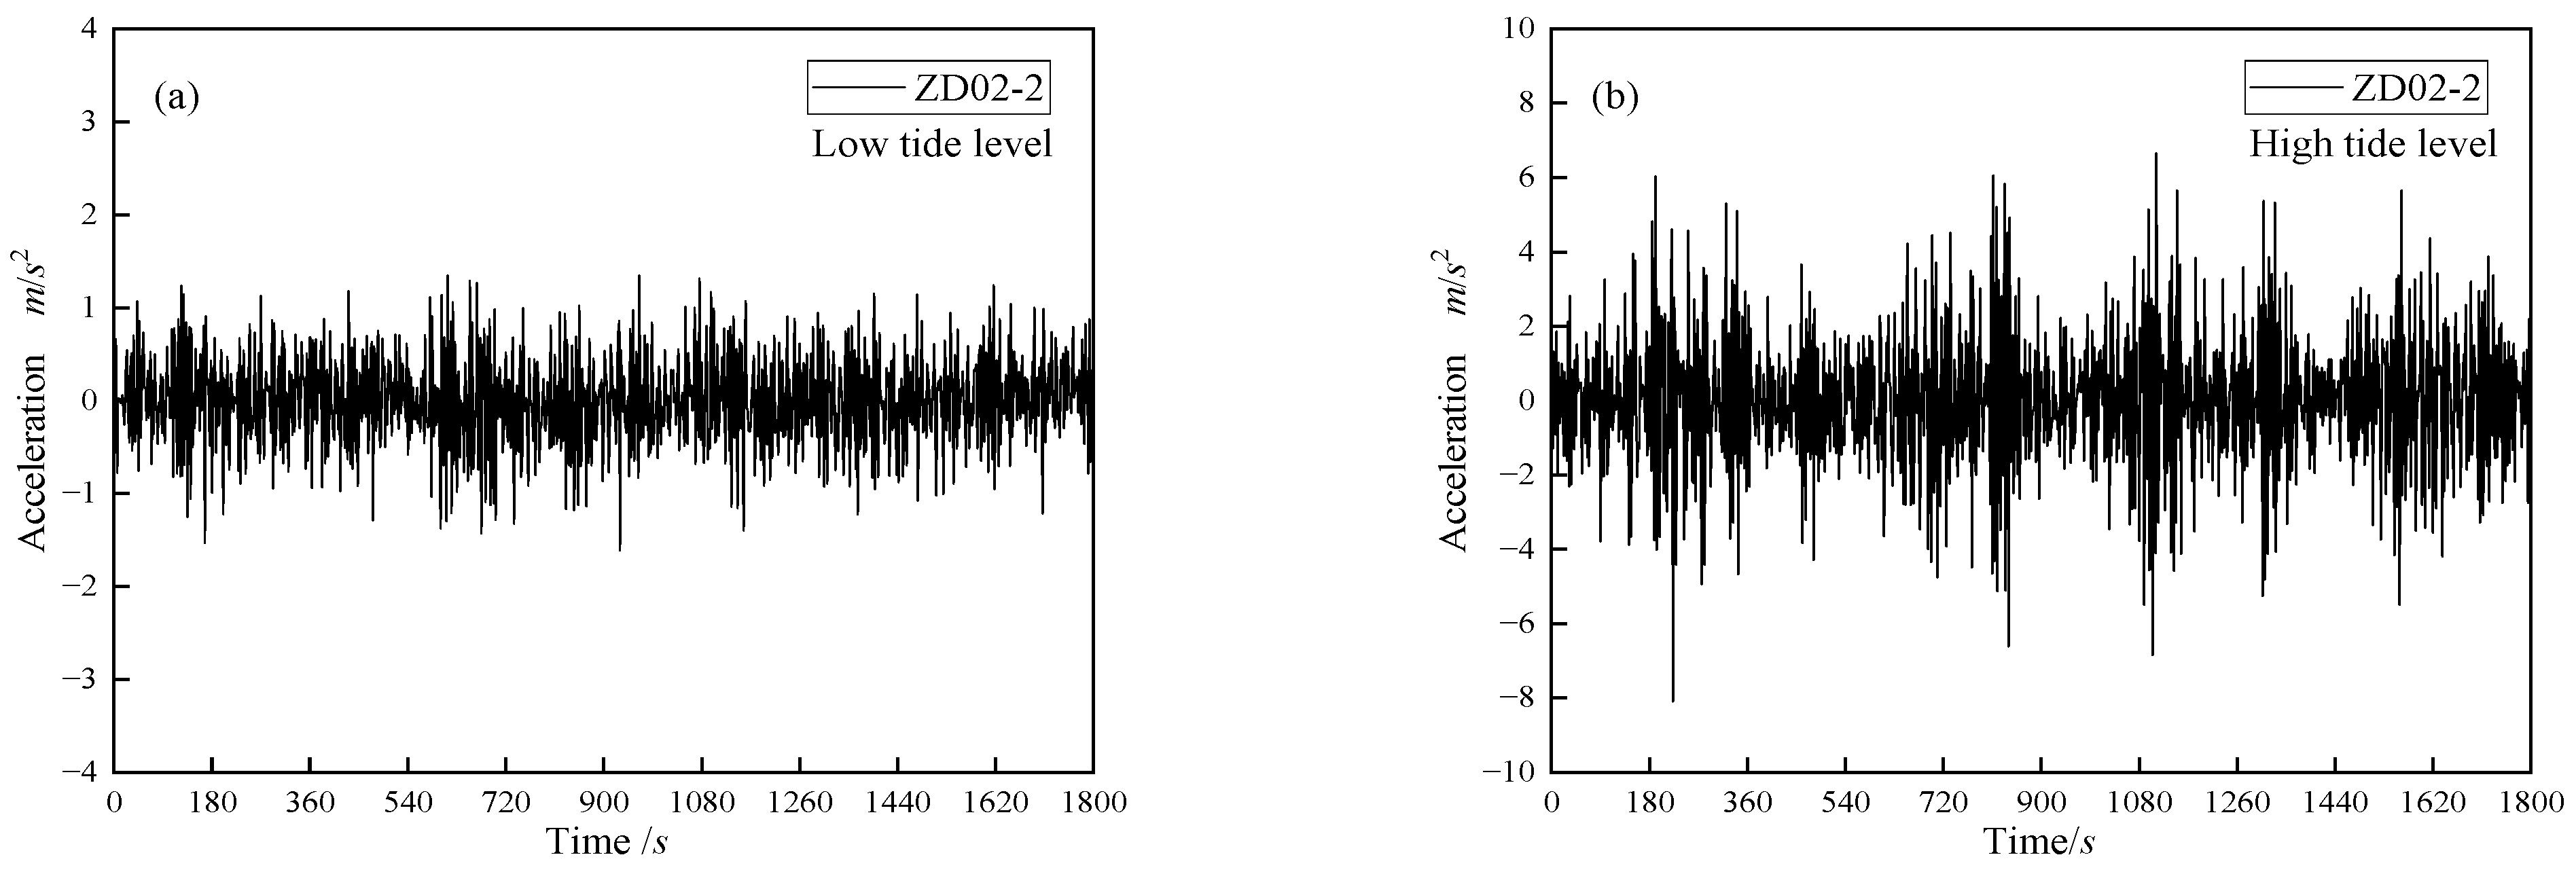
Figure 19 and Figure 20 show the variation in acceleration with time at position ZD02 of the offshore temporary work platform at high tide and low tide under severe sea conditions. As can be observed from the figures, under severe sea conditions, the tangential and radial accelerations of the offshore temporary platform fluctuate violently at high tide. This is because the seawater depth increases at high tide under severe sea conditions. The change in buoyancy affects the force balance of the platform, thus altering the vibration characteristics of the platform and leading to an increase in acceleration fluctuations.
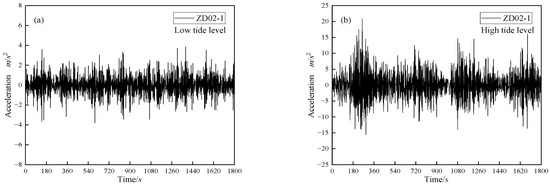
Figure 19.
Variation in tangential acceleration with time at the ZD02 location of the offshore temporary platform under severe sea conditions caused by Typhoon “Pulasan”: (a) low tide level; and (b) high tide level.
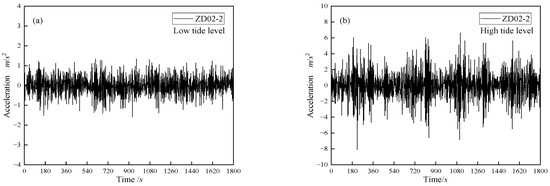
Figure 20.
Variation of radial acceleration with time at the ZD02 location of the offshore temporary platform under severe sea conditions caused by Typhoon “Pulasan”: (a) low tide level; and (b) high tide level.
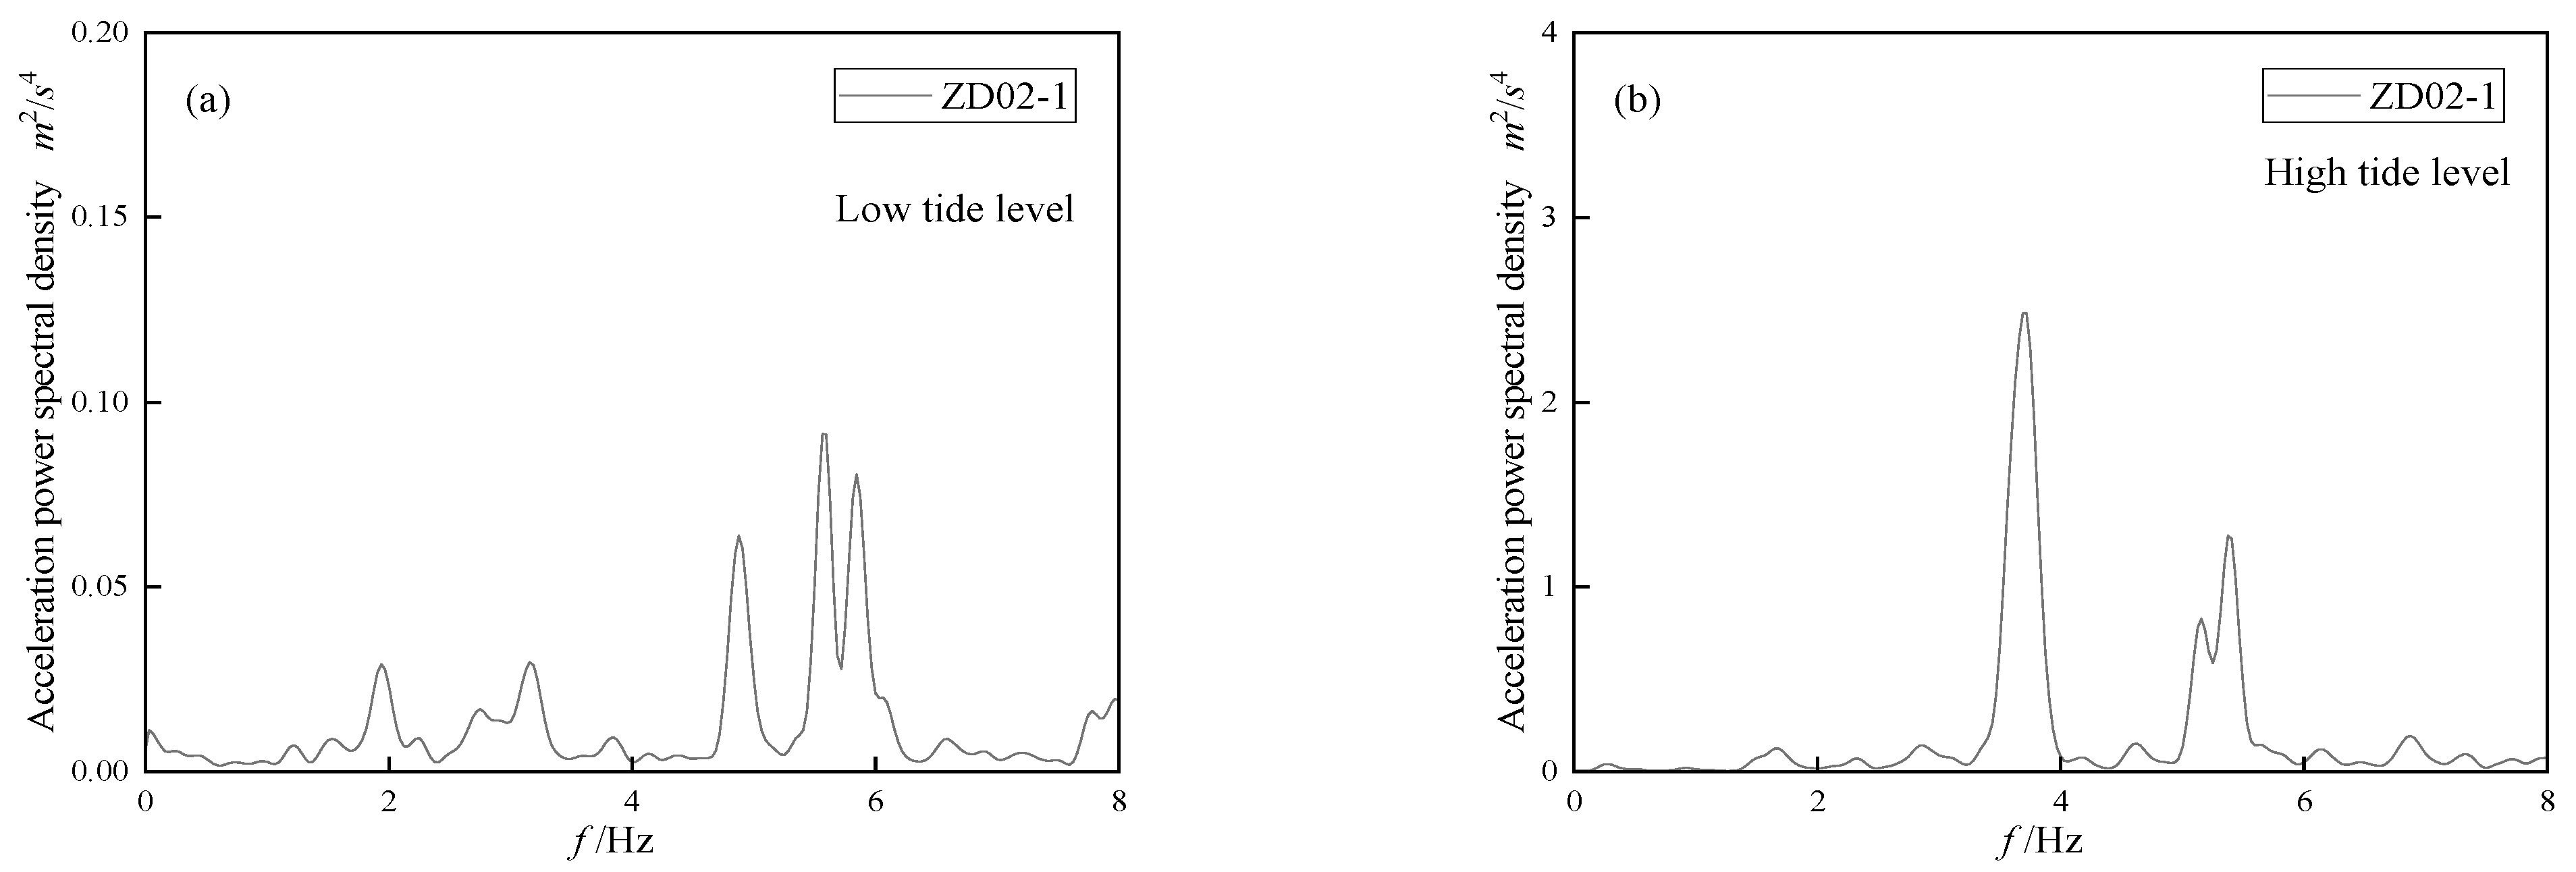
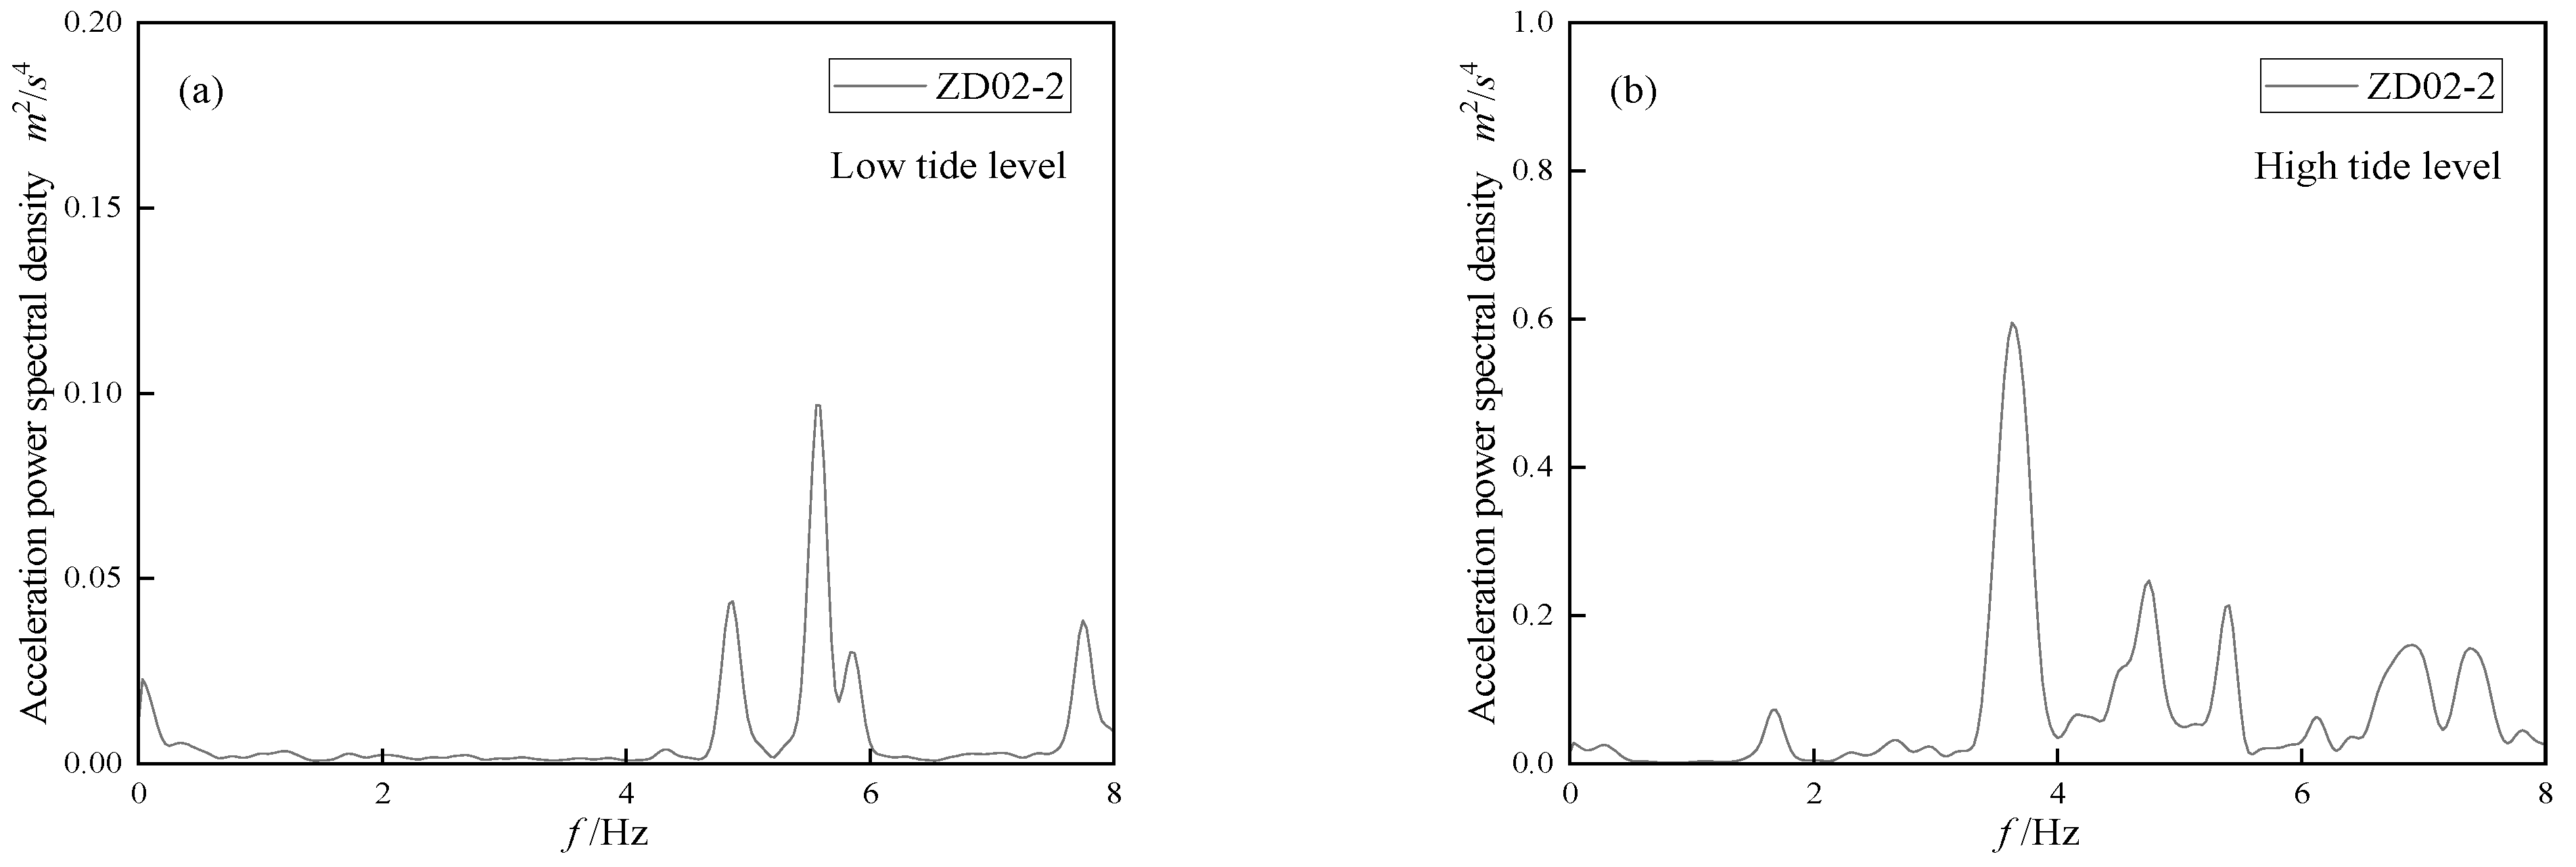
Figure 21 and Figure 22 describe the variations in the acceleration power spectra in the tangential and radial directions at position ZD02 with frequency when the offshore temporary work platform is at high and low tide under severe sea conditions. It can be found from the figures that, under severe sea conditions, the tide level has a significant impact on the acceleration power spectra of the offshore temporary platform. At the same tide level, the frequencies corresponding to the peak values of the radial and tangential acceleration power spectra of the offshore temporary platform are consistent. At high tide, the frequencies corresponding to the peak values of the tangential and radial acceleration power spectra at the position of the offshore temporary platform ZD02 are both (3.7 Hz), which is lower than the frequencies (5.6 Hz) corresponding to the peak values of the platform’s tangential and radial acceleration power spectra at low tide. This is because changes in the tide level can alter the hydrodynamic forces acting on the offshore temporary platform. At high tide, as the volume of the offshore temporary platform immersed in water increases, the buoyancy provided by the seawater rises. This causes a relative reduction in the stiffness of the offshore temporary platform system, leading to a decrease in the system’s natural frequency. As a result, the frequency corresponding to the peak of the acceleration power spectrum drops to 3.7 Hz. This is of great significance for the design, analysis, and safety assessment of offshore temporary platforms. It is necessary to fully consider the tide level factor in actual engineering to ensure the reliability and safety of the offshore temporary work platform.
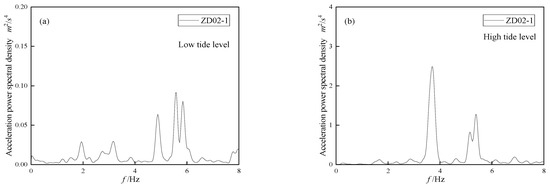
Figure 21.
Variation in the tangential acceleration power spectrum of the offshore temporary platform at position ZD02 with frequency under severe sea conditions caused by Typhoon “Pulasan”: (a) low tide level; and (b) high tide level.
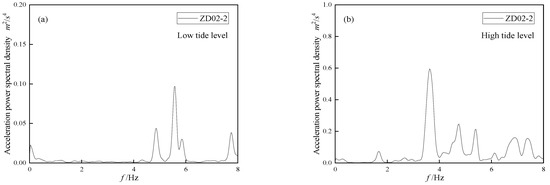
Figure 22.
Variation in the radial acceleration power spectrum of the offshore temporary platform at position ZD02 with frequency under severe sea conditions caused by Typhoon “Pulasan”: (a) low tide level; and (b) high tide level.
4. Concluding Remarks
Based on a grand bridge Project from Fujian Province in China, on-site monitoring tests were carried out on the temporary working platform. A high-precision and fully automatic monitoring system was employed to conduct all-weather and high-frequency monitoring on the inclination angle, vibration, and displacement and stress of the platform, as well as changes in the seawater level and flow velocity, so as to obtain their distribution and development laws. The following conclusions were drawn:
(1) Under normal and severe sea conditions, the flow velocity and tidal range are key factors influencing the stress distribution of offshore platforms. Under the severe sea conditions during typhoons, the stress of the offshore temporary work platform structure increases significantly as the tidal range increases, and the stress reaches its maximum value at the high tide level.
(2) Under severe sea conditions, compared with low tide levels, the acceleration of the offshore temporary working platform changes more drastically at high tide levels.
(3) Under severe sea conditions, the hydrodynamic pressure fluctuates violently and has a large amplitude. The fluctuation range of the effective value of tangential displacement under severe sea conditions is far greater than that under normal sea conditions, and relatively large peaks occur. The displacement changes at different positions are more drastic under severe sea conditions.
(4) Compared with the low tide level, the acceleration of the offshore temporary work platform changes more drastically at the high tide level under severe sea conditions. Under severe sea conditions, at high tide, the frequency corresponding to the peak value of the acceleration power spectrum of the offshore temporary platform is lower than that at low tide.
The main limitations of this study are as follows. Despite the utilization of a high-precision automatic monitoring system, the sensors are affected by electromagnetic interference and corrosion in the marine environment. This situation impacts the accuracy of the data used for analyzing the platform’s response. On the other hand, the marine environment is complex and variable. The monitoring period is relatively short, and only high tidal ranges and strong wind–wave conditions are taken into consideration, without accounting for factors such as seawater temperature. Nevertheless, through this research, a quantitative description of the response of large temporary working platforms for cross-sea bridges was provided, which offers a reference basis for disaster risk assessment and safety prevention and control work.
Author Contributions
Conceptualization, Q.X.; Software, Q.X.; Formal Analysis, Q.X.; Supervision, Q.X.; Visualization, Q.X.; Writing-original draft, Q.X.; Methodology, G.L.; Validation, G.L.; Visualization, G.L.; Investigation, G.L.; Resources, G.L.; Writing- review & editing, G.L. All authors have read and agreed to the published version of the manuscript.
Funding
This work has been supported by the Transportation Science and Technology Project of Fujian Provincial Department of Communications (No. ZH202302).
Institutional Review Board Statement
Not applicable.
Informed Consent Statement
Not applicable.
Data Availability Statement
Dataset available on request from the authors.
Conflicts of Interest
The authors declare no conflict of interest. Qin Xiong and Guanguo Liu are employees of Jiangsu Transportation Institute Group Co., Ltd. The company had no roles in the design of the study; in the collection, analysis, or interpretation of data; in the writing of the manuscript, or in the decision to publish the articles. The paper reflects the views of the scientists and not the company.
References
- Zheng, C.; Luo, T.; Luan, L. Lateral Kinematic Response of Offshore Pipe Piles to S-Wave Seismic Excitation. Int. J. Numer. Anal. Methods Geomech. 2023, 47, 1496–1518. [Google Scholar] [CrossRef]
- Bian, C.; Du, L.; Wang, G.; Li, X.; Li, W. Dynamic Response of Sea-Crossing Rail-cum-Road Cable-Stayed Bridge Influenced by Random Wind—Wave—Undercurrent Coupling. China Ocean. Eng. 2023, 37, 85–100. [Google Scholar] [CrossRef]
- Wang, B.; Cui, C.; Xu, C.; Meng, K.; Li, J.; Xu, L. A Novel Analytical Solution for Horizontal Vibration of Partially Embedded Offshore Piles Considering the Distribution Effect of Wave Loads. Ocean. Eng. 2024, 307, 118179. [Google Scholar] [CrossRef]
- Daocheng, Z.; Bo, Z.; Sisi, X.; Chengxun, W.; Jinping, O. Experimental study on dynamic effect of freestanding tower of sea-crossing bridge under wave load. Adv. Bridge Eng. 2021, 2, 9. [Google Scholar] [CrossRef]
- Li, C.; Wu, G.-Y.; Li, L.-X.; Liu, C.-G.; Li, H.-N.; Han, Q. A comprehensive performance evaluation methodology for sea-crossing cable-stayed bridges under wind and wave loads. Ocean. Eng. 2023, 280, 114816. [Google Scholar] [CrossRef]
- Mostafa, Y.E.; El Naggar, M.H. Response of fixed offshore platforms to wave and current loading including soil–structure interaction. Soil. Dyn. Earthq. Eng. 2004, 24, 357–368. [Google Scholar] [CrossRef]
- Wei, K.; Zhong, X.; Cai, H.; Li, X.; Xiao, H. Dynamic response of a sea-crossing cable-stayed suspension bridge under simultaneous wind and wave loadings induced by a landfall typhoon. Ocean. Eng. 2024, 293, 116659. [Google Scholar] [CrossRef]
- Fang, C.; Li, Y.; Chen, X.; Tang, H. Extreme Response of a Sea-Crossing Bridge Tower under Correlated Wind and Waves. J. Aerosp. Eng. 2019, 32, 05019003. [Google Scholar] [CrossRef]
- Boccotti, P. A field experiment on the small-scale model of a gravity offshore platform. Ocean. Eng. 1995, 22, 615–627. [Google Scholar] [CrossRef]
- Williams, M.S.; Thompson, R.S.G.; Houlsby, G.T. Non-linear dynamic analysis of offshore jack-up units. Comput. Struct. 1998, 69, 171–180. [Google Scholar] [CrossRef]
- Asiri, S.A.; AL-Zahrani, Y.Z. Theoretical Analysis of Mechanical Vibration for Offshore Platform Structures. World J. Mech. 2014, 4, 1–11. [Google Scholar] [CrossRef]
- Liu, Y.; Wan, D. Numerical simulation of motion response of an offshore observation platform in waves. J. Mar. Sci. Appl. 2013, 12, 89–97. [Google Scholar] [CrossRef]
- Zhang, Q.; Zhou, X.-L.; Wang, J.-H.; Guo, J.-J. Wave-induced seabed response around an offshore pile foundation platform. Ocean. Eng. 2017, 130, 567–582. [Google Scholar] [CrossRef]
- Ti, Z.; Zhang, M.; Li, Y.; Wei, K. Numerical study on the stochastic response of a long-span sea-crossing bridge subjected to extreme nonlinear wave loads. Eng. Struct. 2019, 196, 109287. [Google Scholar] [CrossRef]
- Lan, D.; Li, J.; Chen, J.; Xu, Q. Floor response spectra of offshore electrical platform under sea waves and earthquake. Ocean. Eng. 2022, 265, 112623. [Google Scholar] [CrossRef]
- Ghazi, Z.M.; Abbood, I.S.; Hejazi, F. Dynamic evaluation of jack-up platform structure under wave, wind, earthquake and tsunami loads. J. Ocean. Eng. Sci. 2022, 7, 41–57. [Google Scholar] [CrossRef]
- Park, M.; Koo, W.; Kawano, K. Dynamic response analysis of an offshore platform due to seismic motions. Eng. Struct. 2011, 33, 1607–1616. [Google Scholar] [CrossRef]
- Liu, S.; Li, H.; Zhang, J.; Yang, S.; Zhang, T. Shaking table test and numerical simulation of jacket offshore platform considering soil-water-structure interaction. Ocean. Eng. 2024, 313, 119542. [Google Scholar] [CrossRef]
- Huang, S.; Yu, D.; Bai, W.; Guo, X.; Dai, J. Experimental and numerical analysis of seismic performance of jacket platforms subjected to onshore and offshore earthquakes. Eng. Struct. 2024, 311, 118177. [Google Scholar] [CrossRef]


Disclaimer/Publisher’s Note: The statements, opinions and data contained in all publications are solely those of the individual author(s) and contributor(s) and not of MDPI and/or the editor(s). MDPI and/or the editor(s) disclaim responsibility for any injury to people or property resulting from any ideas, methods, instructions or products referred to in the content. |
© 2025 by the authors. Licensee MDPI, Basel, Switzerland. This article is an open access article distributed under the terms and conditions of the Creative Commons Attribution (CC BY) license (https://creativecommons.org/licenses/by/4.0/).