Article

Differential Impacts on Human Physiological Responses on Heatwave and Non-Heatwave Days: A Comparative Study Using Wearable Devices in Beijing

1
School of Land Science and Technology, China University of Geosciences, Beijing 100083, China
2
School of Mathematics and Physics, China University of Geosciences, Beijing 100083, China
3
Key Laboratory of Land Consolidation, Ministry of Natural Resources of the PRC, Guanying Yuan West 37, Beijing 100035, China
*
Author to whom correspondence should be addressed.
These authors contributed equally to this work.
Atmosphere 2025, 16(4), 413; https://doi.org/10.3390/atmos16040413
Submission received: 31 January 2025 / Revised: 19 March 2025 / Accepted: 27 March 2025 / Published: 1 April 2025
(This article belongs to the Special Issue Climate Change and Extreme Weather Disaster Risks)

Abstract

:
As global warming intensifies heatwave events, their impact on human health is becoming increasingly significant. To further understand the dynamic response of humans to heatwaves, this study selected samples from different age groups under various thermal conditions in Beijing, China. Physiological parameters, including blood pressure, blood glucose, heart rate, blood oxygen, and body temperature, were monitored during both heatwave and non-heatwave periods using wearable devices. The results show that during heatwaves, the average blood pressure increased by about 10%, blood glucose levels rose by about 4%, heart rates increased by about 12%, and blood oxygen levels decreased by an average of about 7%. These effects were particularly pronounced in people aged 50 and above, with heart rate and blood oxygen saturation showing significant age-related differences. The study indicates that heat waves have a more substantial impact on the elderly population, with age being a key factor in determining physiological responses to extreme heat. Therefore, it is necessary to develop age-specific health management strategies to address vulnerability under high-temperature conditions.

1. Introduction

Since the 21st century, heat wave events have become more frequent and serious around the world, causing a large number of casualties and economic losses [1,2]. This trend has significantly exacerbated threats to public health, with the number of cardiovascular disease-related deaths projected to rise to 4320 between 2036 and 2065 [3]. The detrimental effects of extreme heat are not limited to direct fatalities; they also result in heat-related illnesses, increased incidence rates [4], and profound impacts on quality of life and socioeconomic stability [5]. Despite the overwhelming evidence of the pervasiveness and severity of the effects of high temperatures, the impact of environmental changes on individual parameters still receives insufficient attention. Current research often falls short in providing real-time, individual-level data, especially in urban areas where heat wave events are severe [6]. This gap is significant because it limits our understanding of how physiological parameters, such as blood pressure and heart rate, respond to dynamic changes in temperature conditions [7]. Extreme heatwaves lead to increased mortality and morbidity, largely due to their impact on key physiological parameters [8]. High-temperature environments can elevate heart rate and blood pressure, reduce blood oxygen saturation, and elevate blood glucose levels, disrupting physiological and biochemical balance [9]. Understanding changes in these parameters can provide insight into the dynamic response between heat waves and individual physiological responses and is also essential for providing medical assistance and mitigating the health risks posed by rising global temperatures. However, current research has not fully explored the differences in health responses among diverse populations exposed to extreme heat. Factors such as individual physiological characteristics, health status, age, gender, and geographic location can lead to significant variations in heat adaptation and associated health risks. Furthermore, there has been insufficient comparative analysis of individual health responses under different weather conditions, particularly the same individual’s physiological reactions across varying temperature environments. Therefore, it is urgent to explore the differences in physiological responses among populations in high-temperature environments.
Record high temperatures around the world in recent years have made people realize that global warming is no longer just a warning but a stark reality. Governments and researchers are actively discussing strategies to help humans cope with and adapt to the effects of climate change, such as higher temperatures. China says strengthening international solidarity and cooperation and ensuring harmonious coexistence with nature are two major climate policies. In 2024, China’s National Science Review (NSR) organized an online forum [10] to discuss a more proactive approach that should be presented to the public: geoengineering, such as injecting aerosols into the stratosphere to increase solar reflection. The 2023 United Nations Climate Change Conference (COP28) in Dubai, UAE, is the largest conference of its kind. The post-2025 climate finance targets were created at the United Nations Climate Change Conference (COP29) in Baku, Azerbaijan, in 2024 to prepare for a new round of nationally determined contributions submitted by member states by February 2025 [11]. They all demonstrate the global determination to transition to green and low-carbon and a positive attitude to climate change.
In order to study the impact of high temperatures on human health, some scholars have designed thermal response experiments of various human parameters in outdoor activities under heat waves relying on outdoor thermal environment simulation laboratories [12]. The above research is of great significance to prevent the impact of extreme heat on human health. However, the existing research still lacks attention to the dynamic detection of human health under the influence of high temperatures.
The development of wearable devices provides an approach for dynamically monitoring the changes in physiological parameters of human health. Wearable devices are wearable computer devices that are controlled by and can interact with users and run continuously. Previous studies involve applications in medical and health fields, including monitoring cardiovascular health [13], prehabilitation in urological oncology [14], postoperative recovery monitoring, and the correlation between blood glucose variability [15], sleep quality, and recognizing human mental health conditions [16]. In the context of heatwave research, wearable devices offer distinct advantages; firstly, they enable real-time, continuous monitoring of individual physiological responses, such as heart rate and blood pressure, which are critical in the context of heat stress but challenging to capture with traditional research methods. Secondly, the portable nature of wearable devices allows for data collection across diverse populations and environments, enhancing the representativeness of findings and facilitating a more comprehensive analysis of heatwave impacts. The international research community has increasingly recognized the importance of monitoring human health in high-temperature environments, with a growing focus on the use of wearable devices for this purpose [17,18,19].
Regarding the selection of physiological indexes, we refer to previous studies. The blood pressure, blood oxygen, heart rate, blood glucose, and body temperature were chosen for monitoring. Elevated temperatures lead to increased heart rate and blood pressure as the body attempts to dissipate heat, detectable through ECG and PPG sensors [20]. Blood oxygen levels are monitored because changes occur due to increased respiration rates or exacerbation of respiratory issues from heat [21]. Blood glucose levels are essential due to the influence of stress and heat on glucose metabolism [22]. Body temperature is a direct indicator of the body’s thermoregulatory response to high temperatures, detectable by skin temperature sensors [23]. Real-time monitoring of these indicators is helpful for early detection of potential diseases in extreme heat. These indicators are critical for real-time health monitoring in extreme heat, facilitating early detection of potential heat-related illnesses [24].
Even within a city, people’s exposure to heat risk is not the same. This difference is primarily due to the uneven distribution of the urban thermal environment, such as the presence of urban heat islands, differences in vegetation cover across different areas, and variations in building density [25]. However, traditional wearable device health monitoring ignores this spatial difference and does not pay attention to the selection of spatial differences in the selection of samples [26]. For example, some scholars’ research is limited to patients in the department [27], which fails to reflect the comprehensive application of wearable devices in dynamic environments and cannot capture the true human response to heat exposure under different spatial conditions. According to existing research [28,29,30,31], the urban thermal environment and thermal risk have the characteristics of spatial differentiation, and the different levels of thermal exposure will give the human body different perceptions. Paying attention to the spatial differences between the urban thermal environment and thermal risk can help to explore different factors leading to their deterioration so as to formulate targeted improvement measures to reduce the impact on residents.
Therefore, compared with traditional health monitoring with wearable devices, our study has a more comprehensive sample selection, focusing on the aforementioned health indicators of individuals in different spaces and under different levels of heat exposure. Our study focuses on identifying patterns and correlations in the data that are indicative of the body’s response to thermal stress. We aimed to provide a detailed account of how high temperatures influence key physiological parameters, which forms the basis for further discussions on risk assessment and health policy development.

2. Materials and Methods
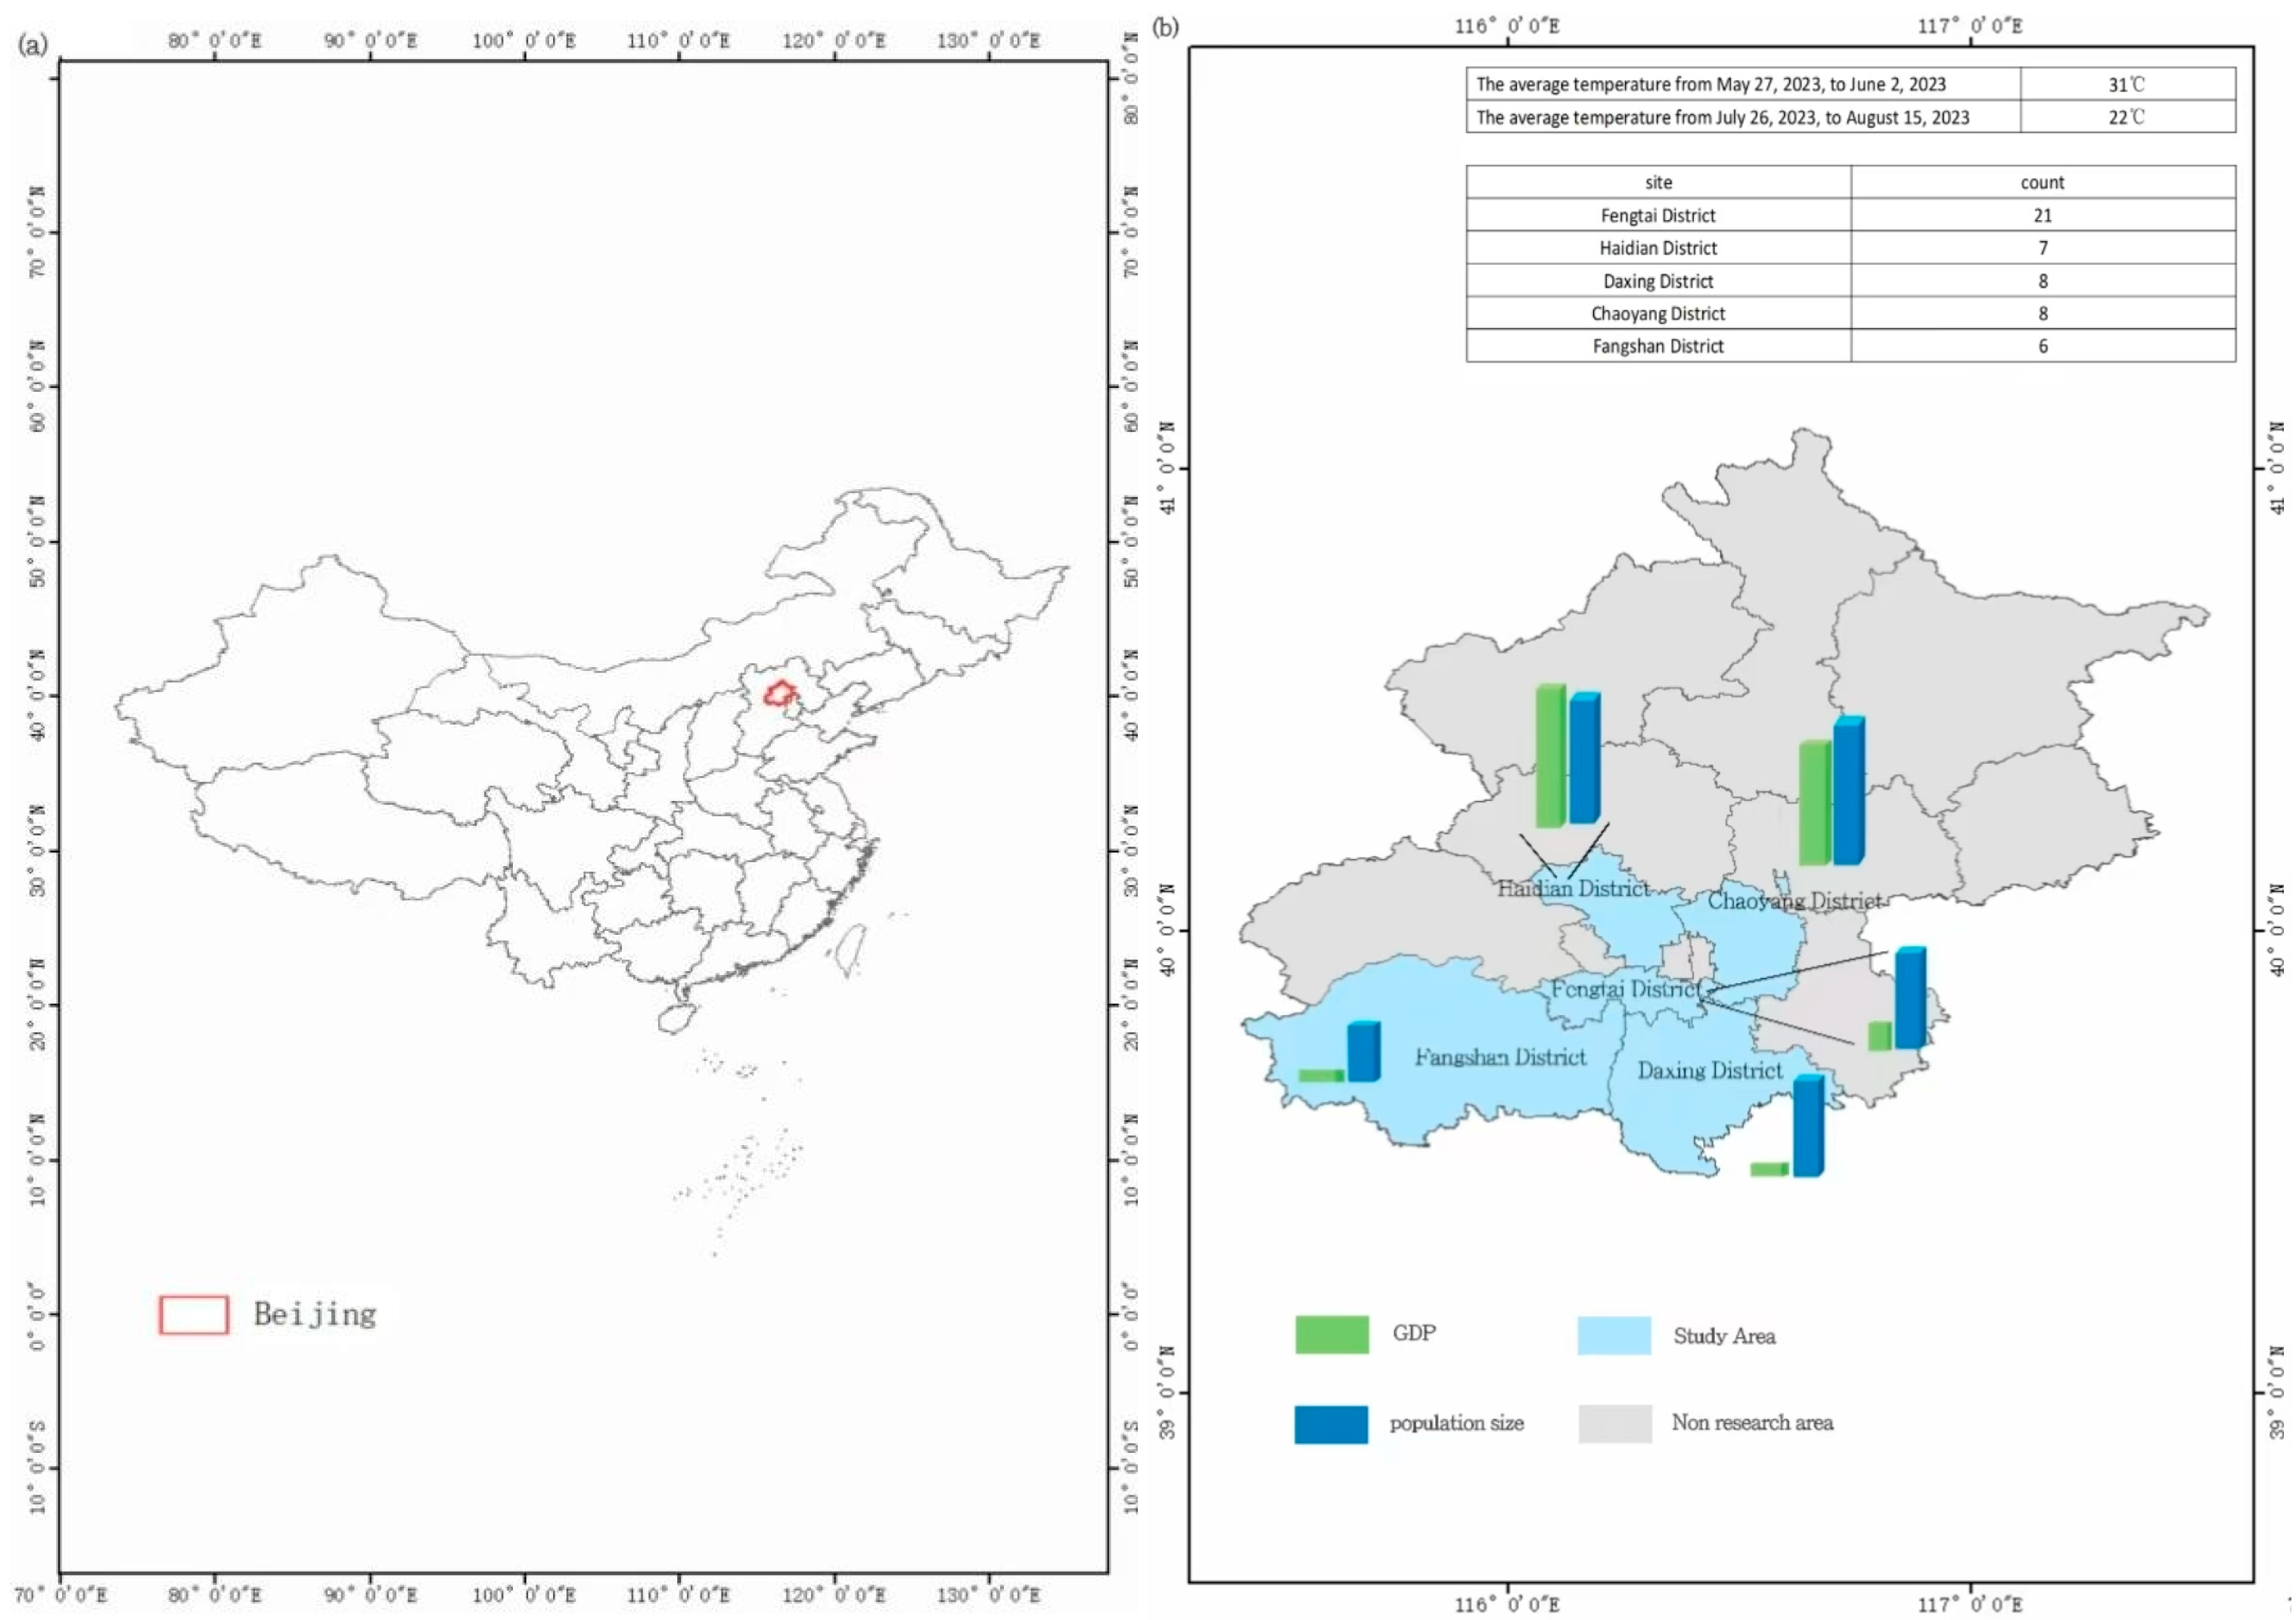
2.1. Study Area

This study was conducted in Beijing, a mega-city in northern China. Beijing, the capital of China and a major hub for economic and cultural activities is located in the northern part of the North China Plain. It has a warm temperate, semi-humid, and semi-arid monsoon climate, characterized by hot, humid summers with frequent heatwaves. Beijing’s topography varies, with higher elevations in the northwest and lower terrain in the southeast, influencing how different districts experience heat waves. According to existing research, the number of hot days, intensity and extremely high temperatures in summer in Beijing urban area have shown a significant increasing trend; from 1978 to 2020, the number of high-temperature days greater than or equal to 35 °C in Beijing increased significantly, accompanied by a significant advance in the onset time and a significant delay in the end time of high temperature [32]. The region has experienced increasingly severe heatwave risks, along with more frequent extreme weather events in recent years [33]. As of 2023, Beijing’s population stands at 21.858 million, distributed across 16 districts [34]. The working-age population (15–64 years) still represents 72.8% of the total population despite a steady decline and plays a key role in the city’s productivity. Meanwhile, 21.3% of the population is over 60 years old, and their health is directly linked to the demand for healthcare and eldercare resources. This aging population is particularly vulnerable to heat-related illnesses, making targeted interventions crucial [35]. Heatwaves in Beijing have led to increased morbidity and mortality, particularly among the elderly and those with pre-existing conditions [36].
Due to geographical differences and the multifactorial influence of socioeconomic activities, the risk of heat waves is not spatially uniform [37]. In this study, we selected Dongcheng, Xicheng, Fengtai, Haidian, Chaoyang, and Fangshan to ensure sample diversity (Figure 1). Districts such as Dongcheng, Xicheng, and Chaoyang are known for the growth of the tertiary sector and technological advancements, contrasting with more residential or industrial areas, thereby providing a comprehensive perspective on how different populations respond to heat waves.

2.2. Instruments and Data

This study used wearable devices to collect data, tackling the complexities of data collection in high-temperature environments (such as equipment instability, varying data accuracy, and participant discomfort). We chose blood pressure, blood oxygen, heart rate, blood glucose, and body temperature as indicators to measure, comprehensively revealing the dynamic physiological responses of individuals in high-temperature environments.
To ensure the accuracy and reliability of the data from the smartwatches, we compared nine different models of wearable devices available on the market. We concealed the brand names of the nine smartwatches to avoid potential misunderstandings arising from different interpretations of the brands and assigned them numbers from ① to ⑨. The evaluation was based on functional characteristics relevant to our research objectives, including sensor performance, data accuracy, battery life, and user comfort (Table 1). After comprehensive assessment and personal wear-testing, we chose Model ⑧ with the highest overall performance to monitor the physiological indicators of the subjects. Additionally, we further validated the data accuracy of this model by comparing its results with those of traditional medical devices.

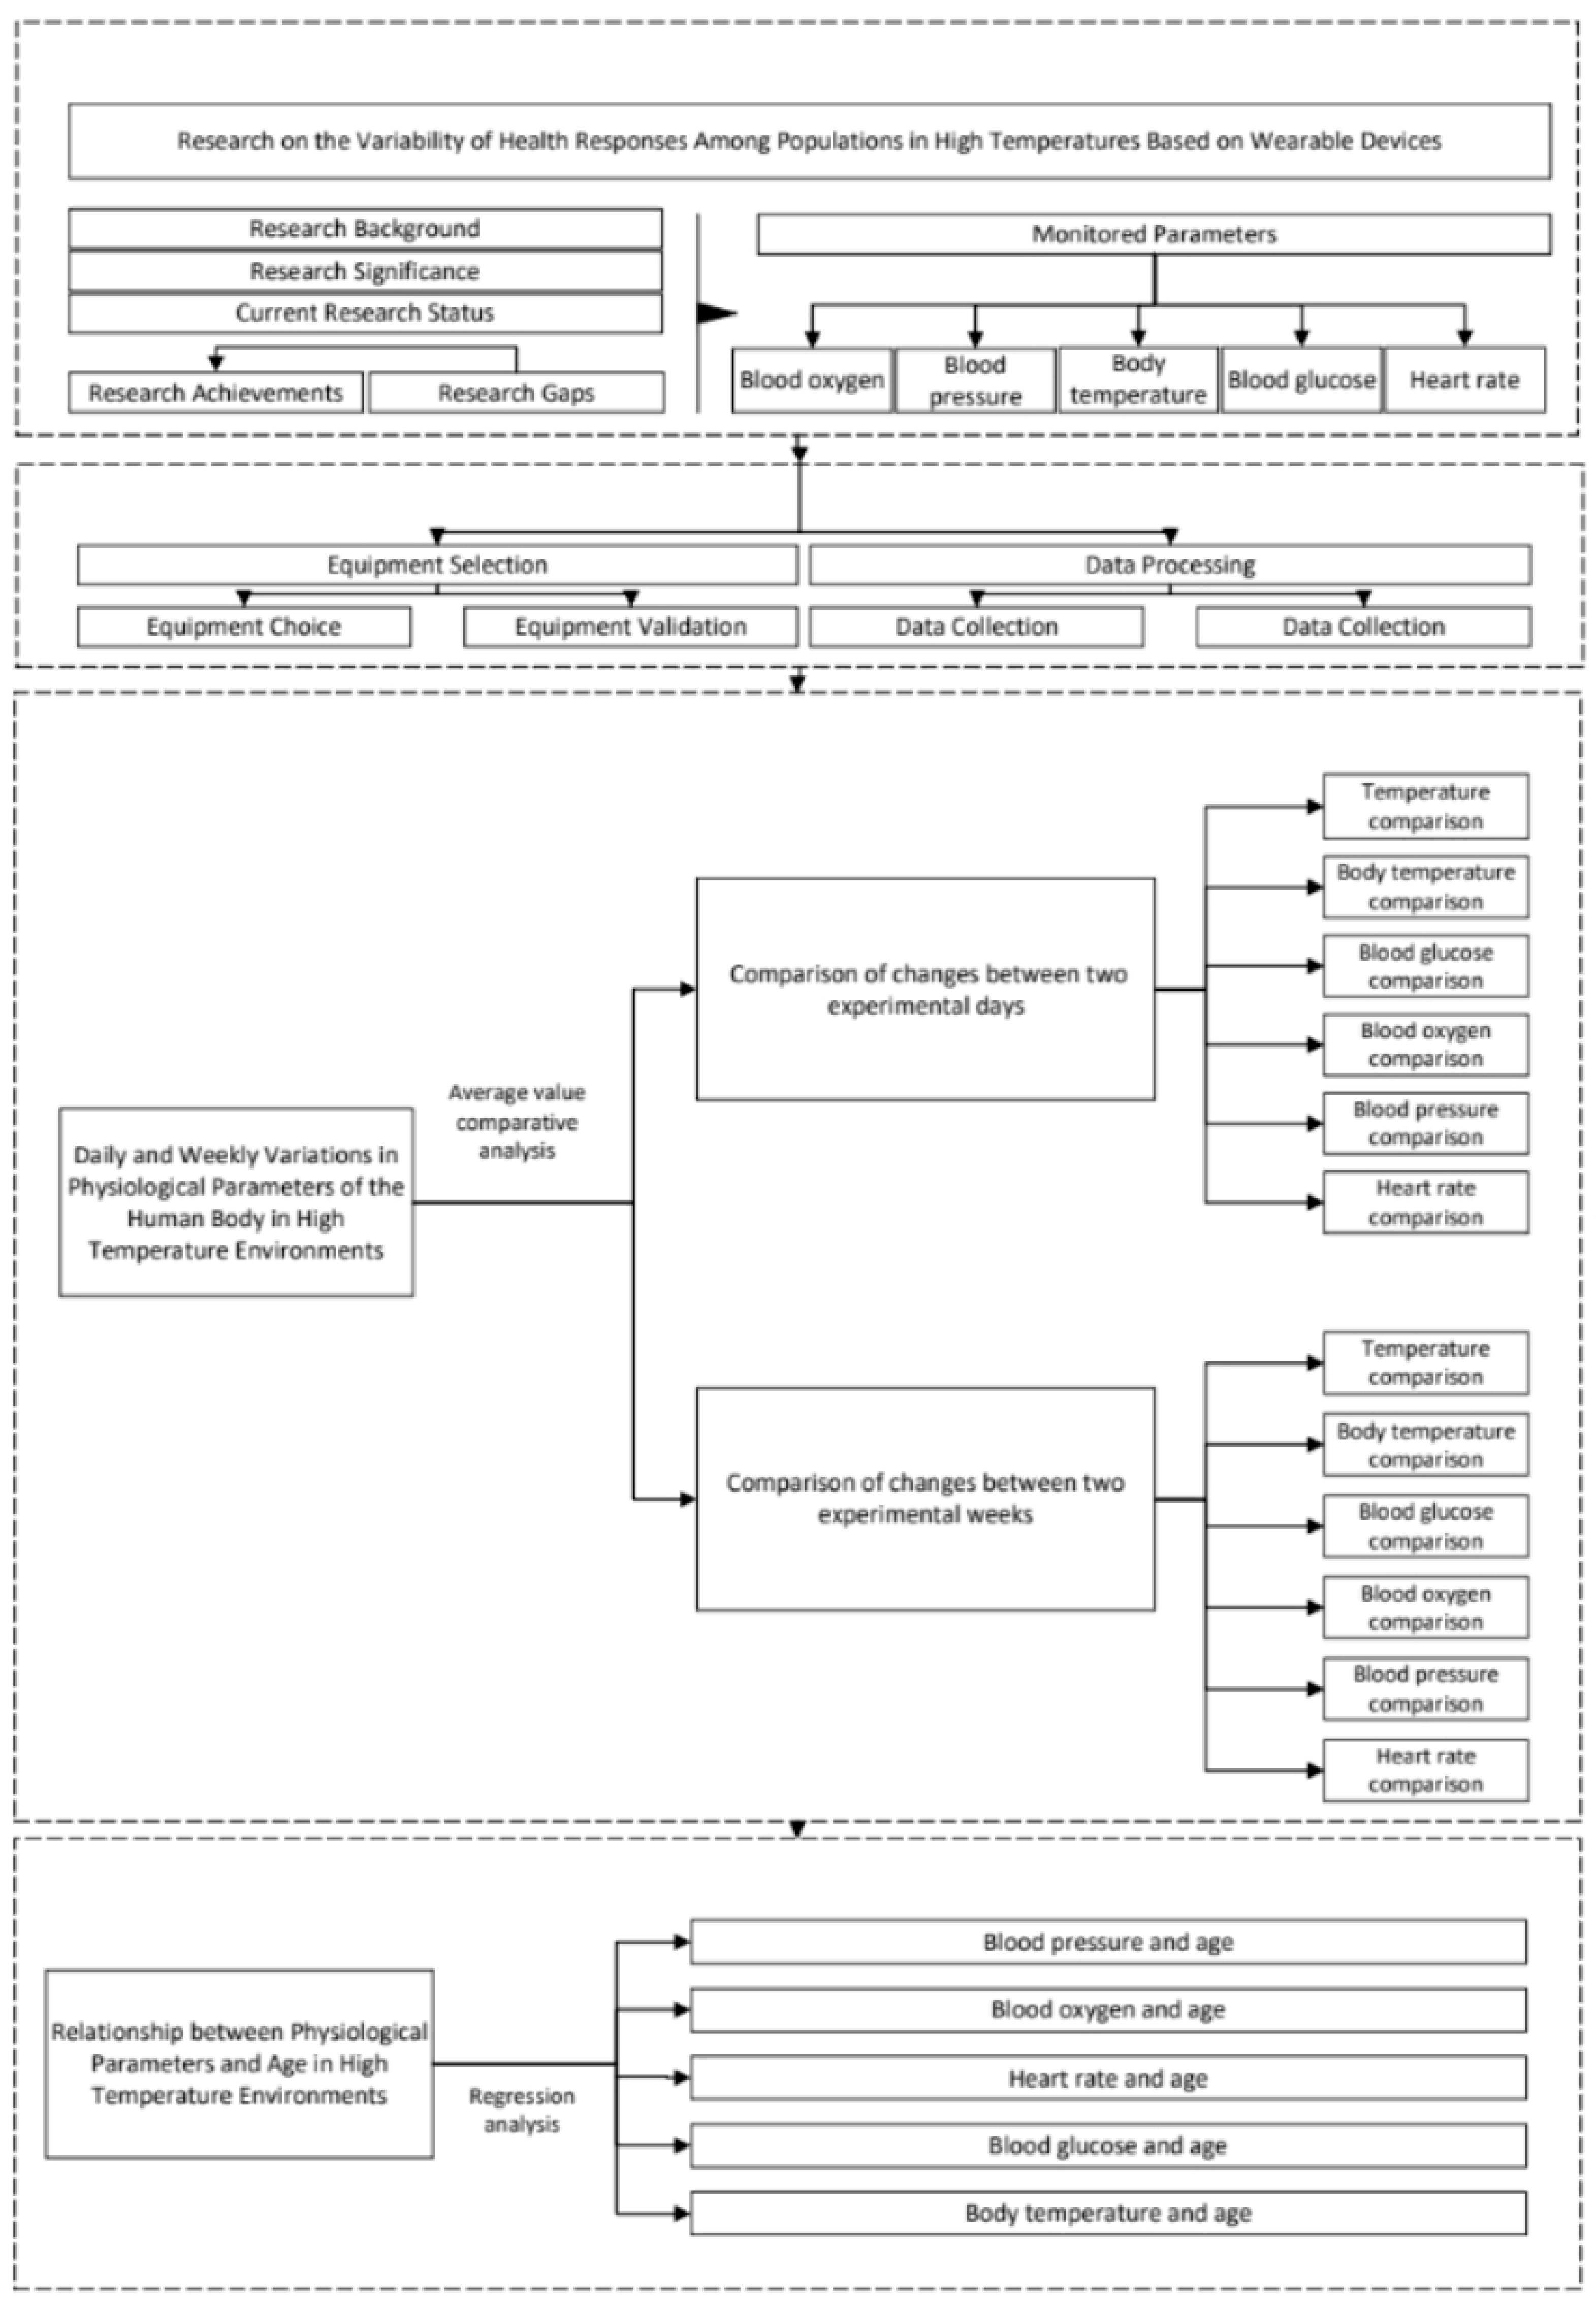
2.3. Technical Approach

Our methodology involved deploying smartwatches equipped with advanced sensors to capture real-time physiological data, including blood pressure, blood oxygen saturation, heart rate, blood glucose levels, body temperature, and sleep quality. To balance resource efficiency and feasibility, the study sample size was set at 50. During the study, the research team regularly monitored environmental temperatures to ensure the reliability of the data. The physiological data collected by the smartwatches were automatically transmitted in real time to a central research database. Throughout the study, we conducted quality control checks to ensure the integrity of data transmission. Through rigorous data validation and comparison, we ensured the accuracy and reliability of the smartwatch data, thereby establishing a solid foundation for our research. This validation was crucial in ensuring the scientific credibility of our results. By conducting this study, we systematically collected physiological data using 50 smartwatches, thereby documenting the direct impact of high temperatures on human health indicators. The continuous monitoring enabled by these devices allowed us to gather comprehensive datasets that reflect the immediate physiological responses to heat exposure. Additionally, our study investigated whether high temperatures significantly affect physiological parameters across different age groups, the role of age in these physiological changes under high-temperature conditions, and whether high temperatures exacerbate age-related trends in these parameters.
In this study, we obtained the environmental temperature data from the China Meteorological Administration during the monitoring period, which has a high level of accuracy. Based on the acquired environmental temperature data, the study divided the monitoring into two distinct phases: the non-heatwave period (from 27 May 2023 to 2 June 2023) and the high-temperature heatwave period (from 26 July 2023 to 15 August 2023). The selection of these two periods aimed to capture the physiological impacts under different temperature conditions for data collection. The average temperature difference between the two periods was 9 °C. Before the experiment, 50 interviewees were provided with detailed training on using the smartwatches, ensuring they understood how to maintain consistent use throughout the study. The basic information of participants, including age, gender, and lifestyle, was gathered via questionnaire (Table 2). To guarantee data accuracy and reliability, our study was designed to cover complete cycles and regular daily routines. We selected full daily cycles as the study period to capture participants’ physiological responses at different times. All participants were required to wear smartwatches during daily activities, with the aim of maintaining nearly 24-h continuous use.
Finally, to explore the impact of other factors on human physiological indicators in high-temperature environments, a questionnaire survey was conducted. Auxiliary questionnaires were used to ensure participants’ consistent schedules and daily routines in both phases, enhancing the credibility and comparability of the results. Small rewards were offered as an incentive for participation. A total of 50 respondents completed the survey [38]. The questionnaire consisted of 33 questions, including a series of questions related to individual behaviors and preferences in high-temperature environments, and the questionnaire had more questions about frequency, for example, at what temperature to take action, how often to buy fruit and cold drinks in the summer, how often to travel, how much time to spend outdoors, and whether to use air conditioning or fans when resting at night.
The study compared the average daily and weekly values of physiological parameters (temperature, blood glucose, blood oxygen, body temperature, blood pressure, and heart rate) during the non-heatwave and high-temperature heatwave periods. The purpose of this analysis was to reveal how changes in environmental temperature influence the fluctuations of these physiological indicators.
To understand the health risks posed by elevated temperatures, we analyzed the extreme values of these physiological parameters in both periods. By comparing daily and weekly extremes between the two conditions, we explored how high temperatures contribute to more pronounced fluctuations in physiological responses, potentially increasing the risk of heat-related health issues. A key component of our study was to evaluate how age correlates with physiological responses during both non-heatwave and heatwave conditions. To achieve this, we employed Pearson regression analysis, a statistical method that measures the linear relationship between two continuous variables. This analysis was performed to quantify the impact of high temperatures on physiological changes across various age groups. Pearson regression was chosen for its effectiveness in determining the strength and direction of the relationship between age and physiological parameters such as blood pressure, heart rate, blood glucose levels, and body temperature. The analysis was conducted by fitting a linear model to the data from each age group, with age as the independent variable and the physiological parameters as the dependent variables. For each physiological parameter, we calculated the Pearson correlation coefficient (r), which ranges from −1 to 1, with values close to −1 or 1 indicating a strong relationship and a value close to 0 indicating a weak relationship. Additionally, we assessed the statistical significance of the relationship using the p-value, with a common threshold of p < 0.05 considered to indicate a significant correlation (Figure 2).

3. Results

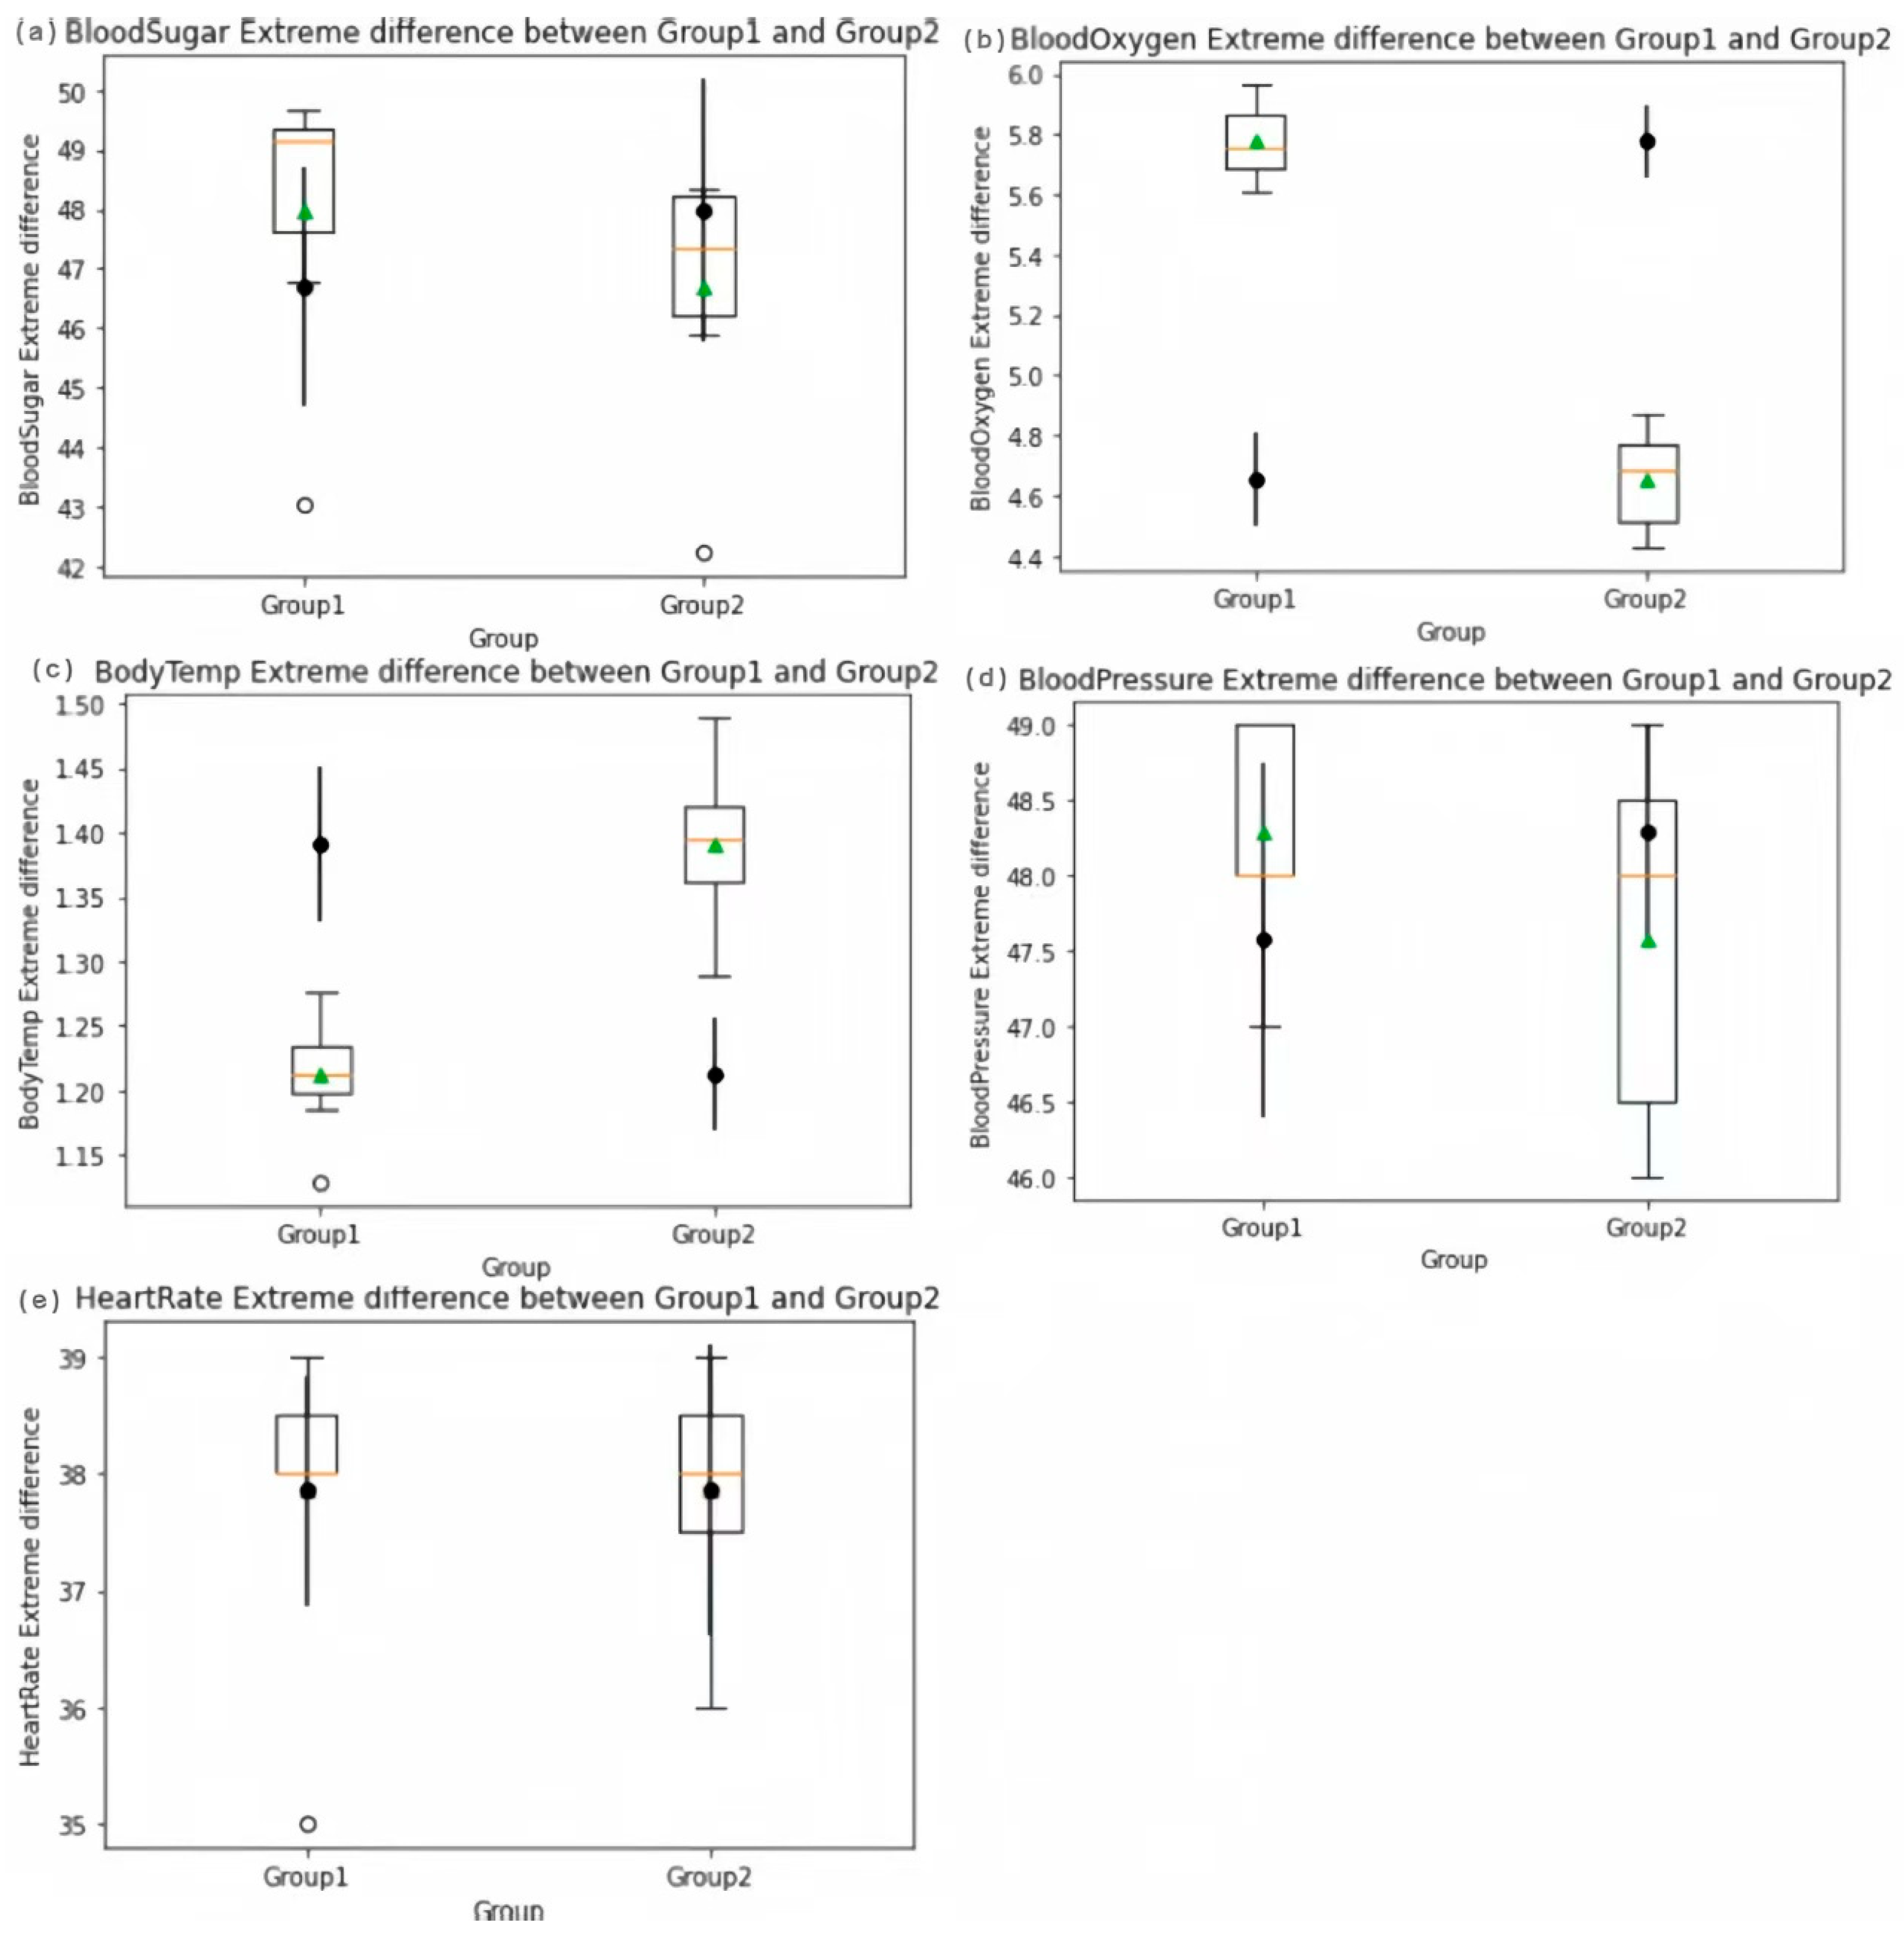
3.1. Daily and Weekly Variations of Human Physiological Parameters

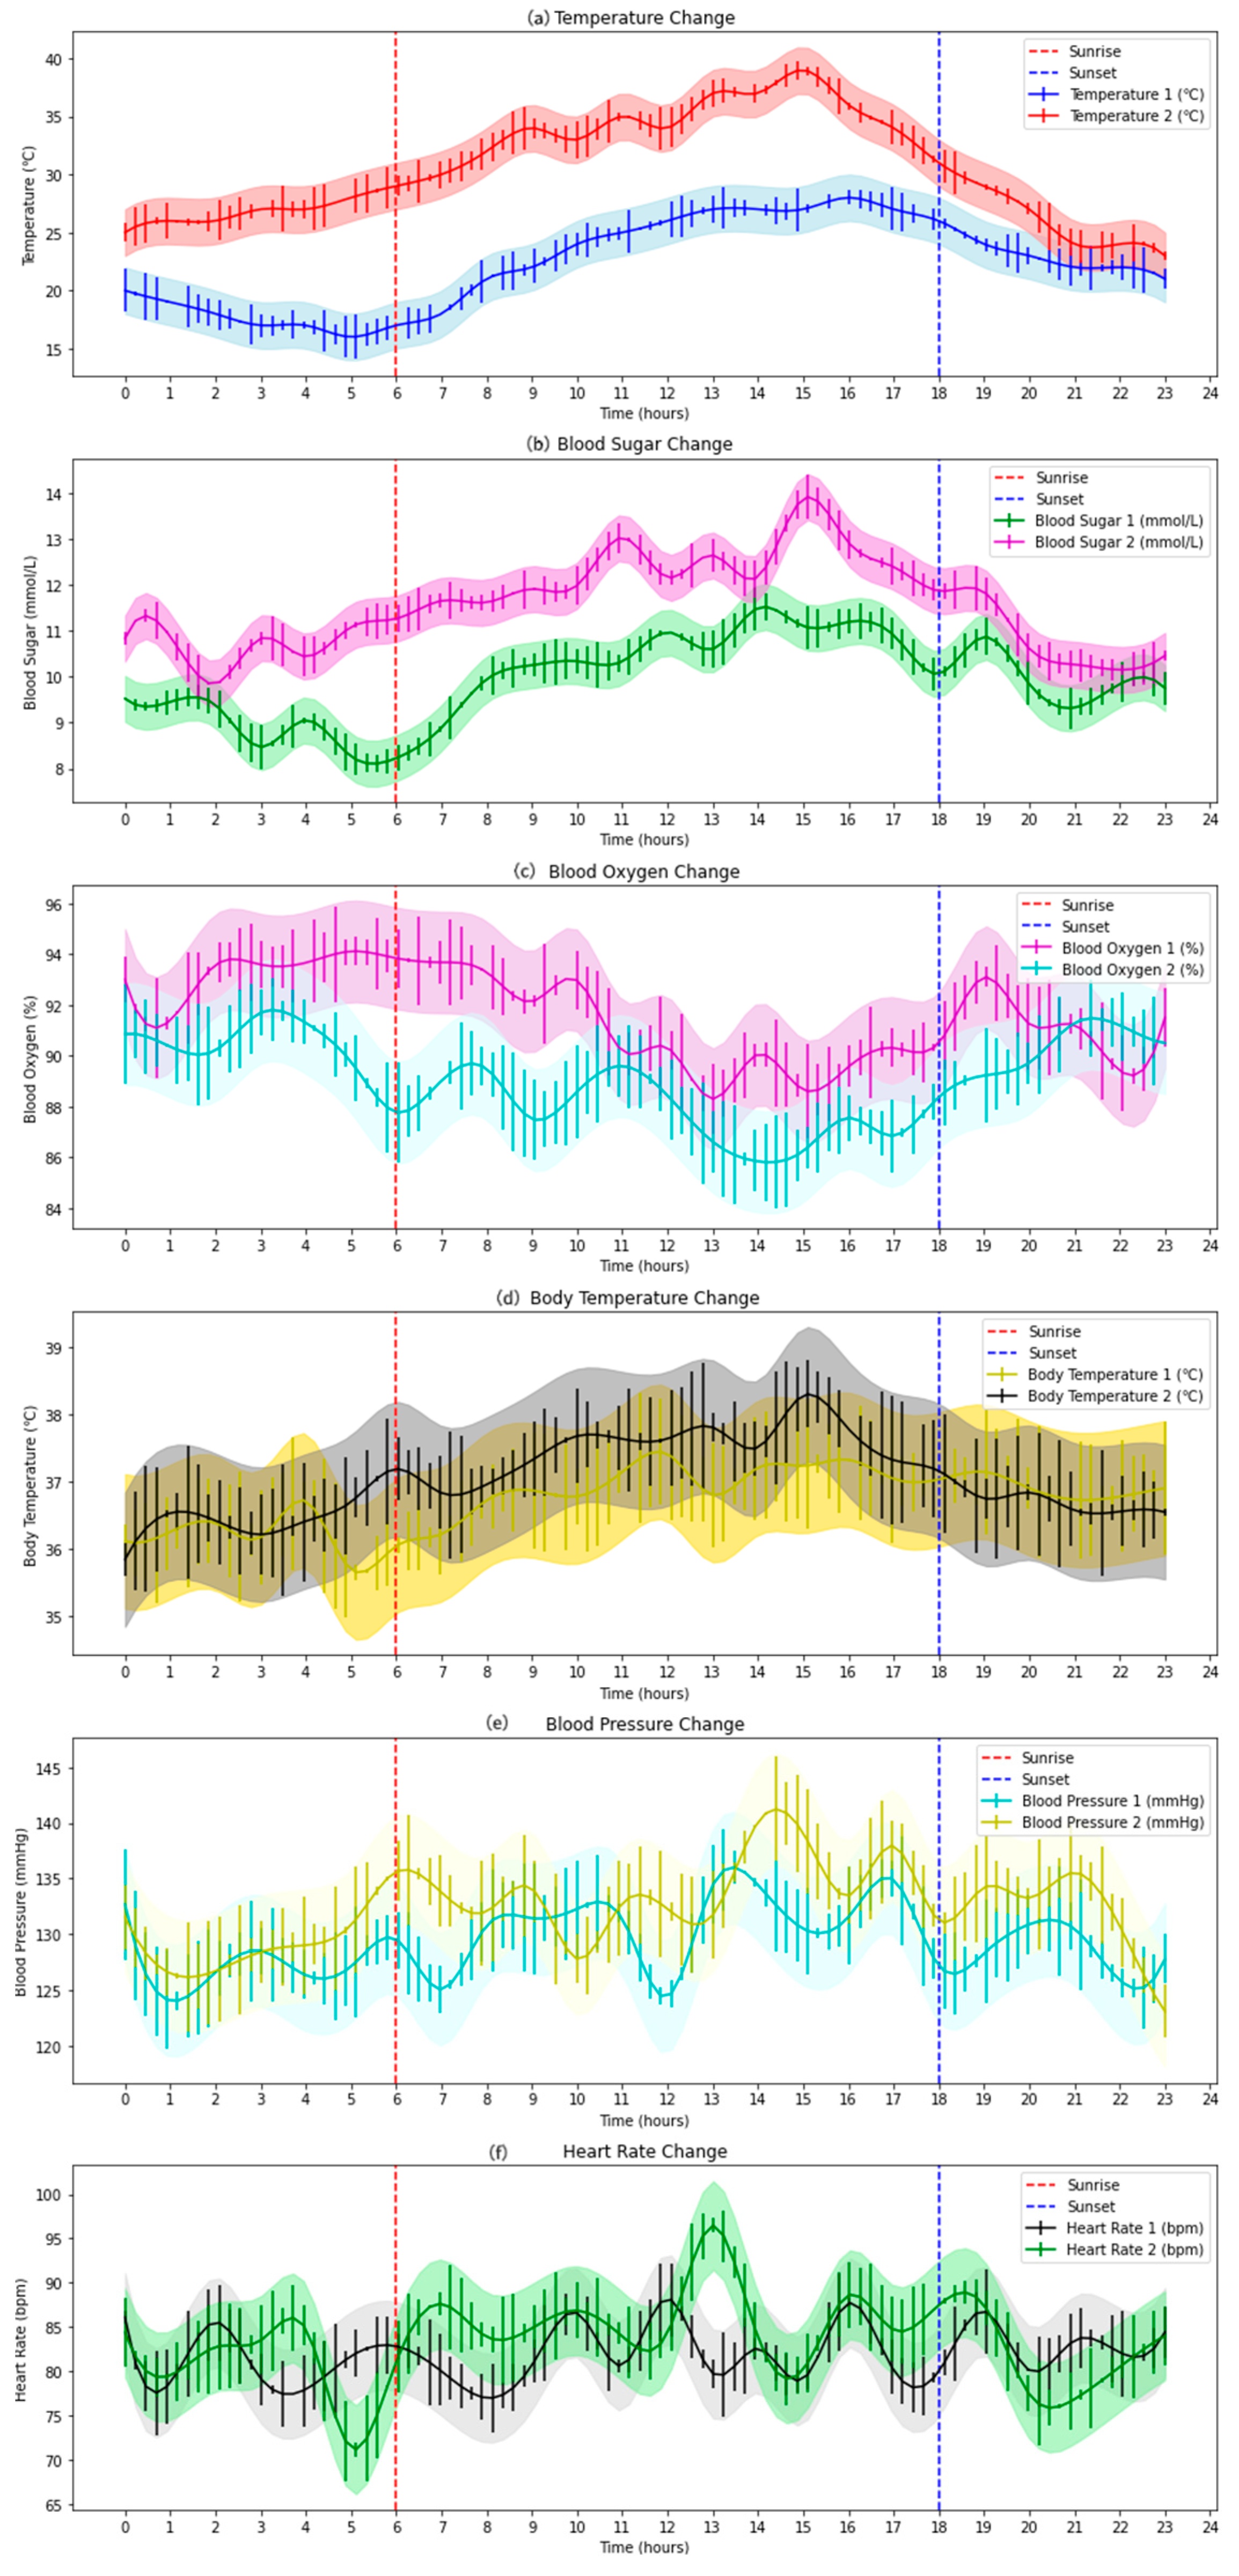
3.1.1. Changes in Daily Average Values of Human Physiological Parameters

The values of blood oxygen and body temperature were generally higher during the high-temperature heatwave period compared to the non-heatwave period. The graph indicates sunrise and sunset with asymptotic lines, facilitating the comparison between daytime and nighttime (Figure 3). Within a day, the levels of body temperature, blood glucose, and blood oxygen remained relatively stable during both the high-temperature heatwave period and the non-heatwave period, with overall minimal fluctuations. However, under high-temperature conditions, the levels of all three parameters were consistently higher than those during the non-heatwave period, with blood glucose and blood oxygen showing more significant increases. Blood glucose exhibited a noticeable decrease after sunset, gradually rising after sunrise and reaching its peak at approximately 14:00–15:00 in the afternoon, coinciding with the peak outdoor temperature. Similarly, body temperature also peaked at this time. In contrast, blood oxygen levels showed an upward trend after sunset, gradually decreasing after sunrise until reaching their lowest point at approximately 14:00. Blood pressure fluctuated significantly within a day, with more pronounced changes observed during the high-temperature heatwave period, peaking at approximately 14:00–15:00 in the afternoon and generally higher levels during this period. The heart rate exhibited similar pronounced fluctuations, with a noticeably greater amplitude during the high-temperature heatwave period, peaking at approximately 13:00 in the afternoon.
Whether comparing the changes in various values within a day or comparing the values between high-temperature and non-high-temperature conditions, high temperatures have an impact. Thus, body temperature, blood glucose, blood oxygen, blood pressure, and heart rate are all affected by high temperatures, resulting in changes.
In comparing the two rounds of testing, we depicted the weekly changes in temperature, blood glucose, blood oxygen, body temperature, blood pressure, and heart rate (Figure 4). Physiological parameters such as blood glucose, blood oxygen, and body temperature exhibit periodic changes over the course of a week, with specific patterns as follows: The overall trend of blood glucose levels is quite irregular, reaching their lowest point at midnight, then gradually increasing, peaking at noon, and subsequently decreasing again until they reach their lowest point at midnight once more. This cyclical pattern repeats daily. Additionally, under high-temperature conditions (Group 2), blood glucose levels are generally higher compared to non-high-temperature conditions (Group 1), indicating that high temperatures can elevate blood glucose levels. Blood oxygen levels also display irregular changes, peaking in the early morning hours, then gradually decreasing, reaching their lowest point in the evening, and then gradually increasing again until they peak in the early morning hours. This pattern suggests an increase in blood oxygen levels during sleep and a gradual decrease during daytime activities, forming a daily cyclical pattern. Furthermore, under high-temperature conditions (Group 2), blood oxygen levels are generally lower than those under non-high-temperature conditions (Group 1), indicating that high temperatures lead to a decrease in blood oxygen levels. The body activates regulatory mechanisms in high-temperature environments to cope with these effects, which can impact blood oxygen concentrations.
However, it is important to note that individual differences, environmental conditions, and health status can also influence changes in blood oxygen levels, leading to variations in specific circumstances [21]. Body temperature follows a similar cyclical pattern, reaching its lowest point at midnight, then gradually increasing, peaking at noon, and then gradually decreasing again until it reaches its lowest point at midnight. Since environmental temperatures also exhibit similar changes throughout the day, it can be inferred that body temperature is influenced by environmental temperature. Additionally, comparative results show that under high-temperature conditions (Group 2), body temperature is higher than under non-high-temperature conditions (Group 1), further demonstrating that high temperatures lead to an increase in body temperature. As for blood pressure and heart rate, their changes over the course of a week do not display significant periodic patterns. However, both blood pressure and heart rate are susceptible to a wide range of external factors and individual physiological factors, leading to fluctuations [39,40]. Further observation should be conducted based on changes in blood pressure and heart rate within a day.
Based on the above analysis, the human physiological parameters exhibiting trends similar to temperature are blood glucose and body temperature, both of which increase as temperature rises. Conversely, blood oxygen levels show an opposite trend, decreasing as temperature rises. These findings are consistent with the body’s efforts to maintain homeostasis under thermal stress. Moreover, our analysis revealed that blood glucose and blood oxygen exhibit relatively significant fluctuations over the course of a week. Specifically, there is a difference of 3.5 mmol/L between the maximum and minimum values of blood glucose and approximately 7% between the maximum and minimum values of blood oxygen within a week. These fluctuations underscore the dynamic nature of these parameters in response to environmental temperature changes. In addition to blood glucose and blood oxygen, heart rate also demonstrated notable variations. During the heatwave period, the heart rate exhibited more pronounced fluctuations, with extreme values showing a greater range compared to the non-heatwave period. This suggests that the cardiovascular system is actively responding to the increased metabolic demands and the body’s efforts to dissipate heat under high-temperature conditions. The physiological stress of heat exposure appears to elicit a more robust cardiovascular response, as evidenced by the heightened variability in heart rate. Due to the body’s thermoregulation mechanism, changes in body temperature are relatively gradual, with minimal difference between the maximum and minimum values over the course of a week. This more moderate response in body temperature, despite significant environmental changes, indicates the body’s inherent capacity to regulate temperature within a narrow range, even when faced with extreme conditions.

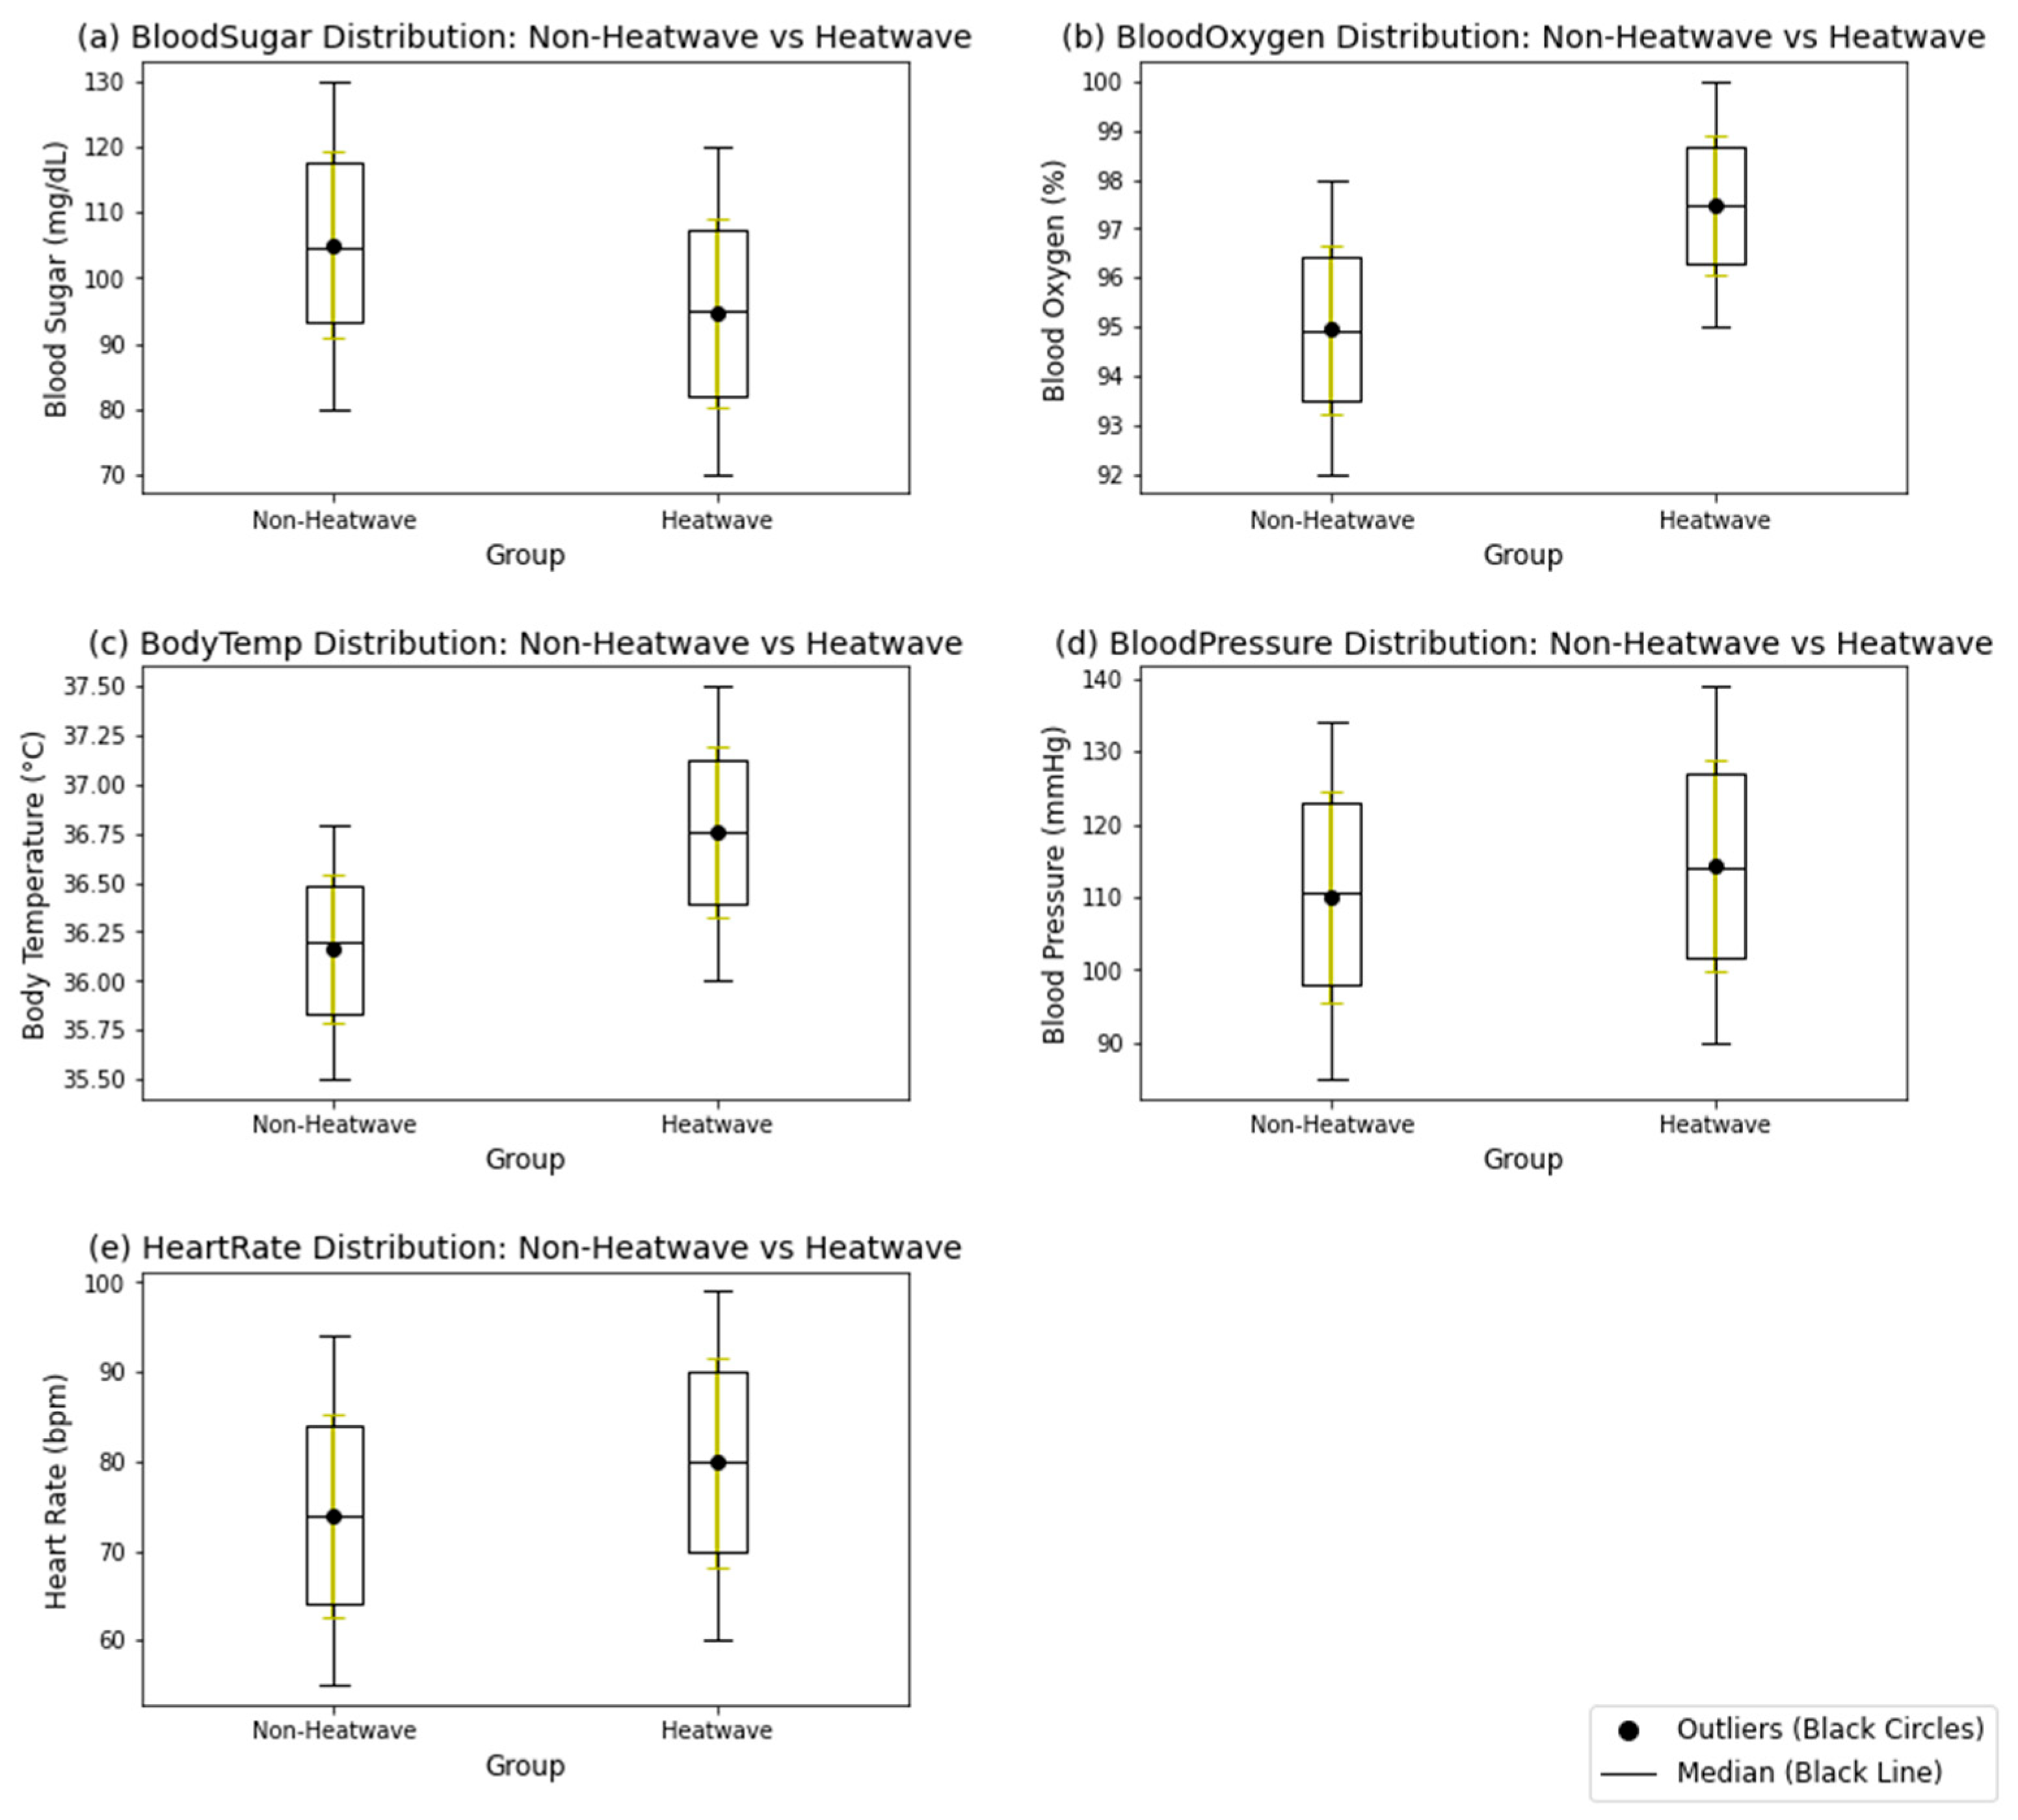
3.1.2. Changes in Weekly Average Values of Human Physiological Parameters

Study of Daily Variations

The observed variations in physiological parameters throughout the day reveal the circadian rhythm of the human body. Parameters such as blood glucose, blood oxygen, body temperature, blood pressure, and heart rate exhibit significant changes both under non-high-temperature conditions and high-temperature conditions (Figure 5).
Under non-high-temperature conditions, blood glucose levels tend to remain relatively stable throughout the day. However, under high-temperature conditions, the variability in blood glucose levels slightly decreases, with an overall trend towards lower levels. Regardless of the temperature conditions, blood oxygen levels exhibit relatively minor fluctuations. Notably, under high-temperature conditions, there is a slight increase in the upper limit of blood oxygen levels, suggesting an adaptive response to warmer environments. Body temperature generally rises under high-temperature conditions, with a more pronounced range of variation, indicating physiological adjustments to the external environment. A comparison of the fluctuation ranges for extreme body temperature values between the two conditions shows that, under high-temperature conditions, the extremes of body temperature are generally higher than under non-high-temperature conditions, accompanied by more significant fluctuations. This suggests a more dynamic physiological response to heat. Furthermore, blood pressure tends to increase under high-temperature conditions, with considerable fluctuations, which may correlate with the rise in body temperature. To enhance blood circulation and reduce body temperature, physiological adjustments are made, particularly during the daytime, leading to an upward trend in heart rate.
In high-temperature conditions, the body faces greater heat stress, necessitating stronger physiological adjustments to adapt to the external environment. Specifically, blood glucose levels decreased by an average of 4% under high-temperature conditions, likely as the body reduces heat production and energy metabolism to maintain energy balance. Blood oxygen levels increased slightly by about 7%, possibly to enhance oxygen delivery and promote heat dissipation through increased metabolism. Body temperature rose by approximately 0.5 °C, reflecting the body’s natural physiological response to elevated external temperatures, which involves enhanced heat dissipation and regulation of blood circulation to maintain thermal balance. High temperatures also led to an average increase in blood pressure by approximately 10%, a result of vasodilation, fluid loss, and an accelerated heart rate to maintain tissue oxygen and nutrient supply. Heart rate increased by approximately 12%, further aiming to boost cardiac output, promoting blood circulation to regulate body temperature and sustain physiological functions [41].
During the daytime, the body is more influenced by direct sunlight and external heat, resulting in relatively higher blood pressure, heart rate, and body temperature to enhance heat dissipation and blood circulation to cope with high-temperature environments. During the nighttime, the body is in a resting and recovery phase, and physiological parameters remain relatively stable. However, due to the decrease in temperature during the night in the high-temperature period, the increase in muscle shivering leads to an increase in glucose uptake [42]; at night, during the high-temperature period, blood sugar drops slightly.

Study of Weekly Variations

The impact of high-temperature environments on human physiological parameters exhibits a certain regularity over a weekly time scale while also being influenced by individual lifestyle habits and work status (Figure 6).
Throughout the week, there is a slight upward trend in blood glucose levels. Under non-high-temperature conditions, the blood glucose remains relatively stable, whereas under high-temperature conditions, both the upper quartile, median and lower quartile of blood glucose show increases, indicating a slight elevation in blood glucose levels due to high temperatures. Blood oxygen saturation exhibits a relatively stable trend throughout the week, with minimal variation observed under both non-high-temperature and high-temperature conditions, with only a slight decrease observed under high temperatures. Body temperature shows a slight upward trend over the week, particularly under high-temperature conditions, where the upper limit, upper quartile, and median of body temperature all increase. This is because the body requires more heat dissipation to maintain stable body temperature in high-temperature environments. Meanwhile, blood pressure shows relatively unstable changes throughout the week, especially under high-temperature conditions, with a larger range of variation. Under non-high-temperature conditions, blood pressure shows a slight decrease, while under high-temperature conditions, both the upper limit and upper quartile of blood pressure increase, possibly due to vasoconstriction induced by high temperatures [43].
Data collected during the study shows that the variations in blood glucose and blood pressure are more pronounced on working days compared to rest days, particularly under high-temperature conditions. On working days, blood glucose and blood pressure levels tend to be higher, likely due to the combined effects of work pressure and the high-temperature environment. On the other hand, resting days generally exhibit lower levels of these physiological parameters, as individuals may engage in more relaxation and recovery. In contrast, blood oxygen levels and body temperature display relatively stable changes on both working and resting days. The data suggest that these parameters are less influenced by external high-temperature conditions than blood glucose and blood pressure. These observations indicate that the physiological impact of high-temperature environments is amplified by additional stress factors such as work. The higher blood glucose and blood pressure observed on working days may result from a combination of heat stress and work-related physical and mental exertion. This highlights the importance of managing both environmental conditions and workload to mitigate potential health risks. In contrast, the more stable patterns observed in blood oxygen and body temperature suggest that the body has a greater ability to regulate these parameters under varying conditions of work and rest. However, the overall trends still suggest a mild impact of high temperatures, albeit to a lesser degree than what is observed for blood glucose and blood pressure.

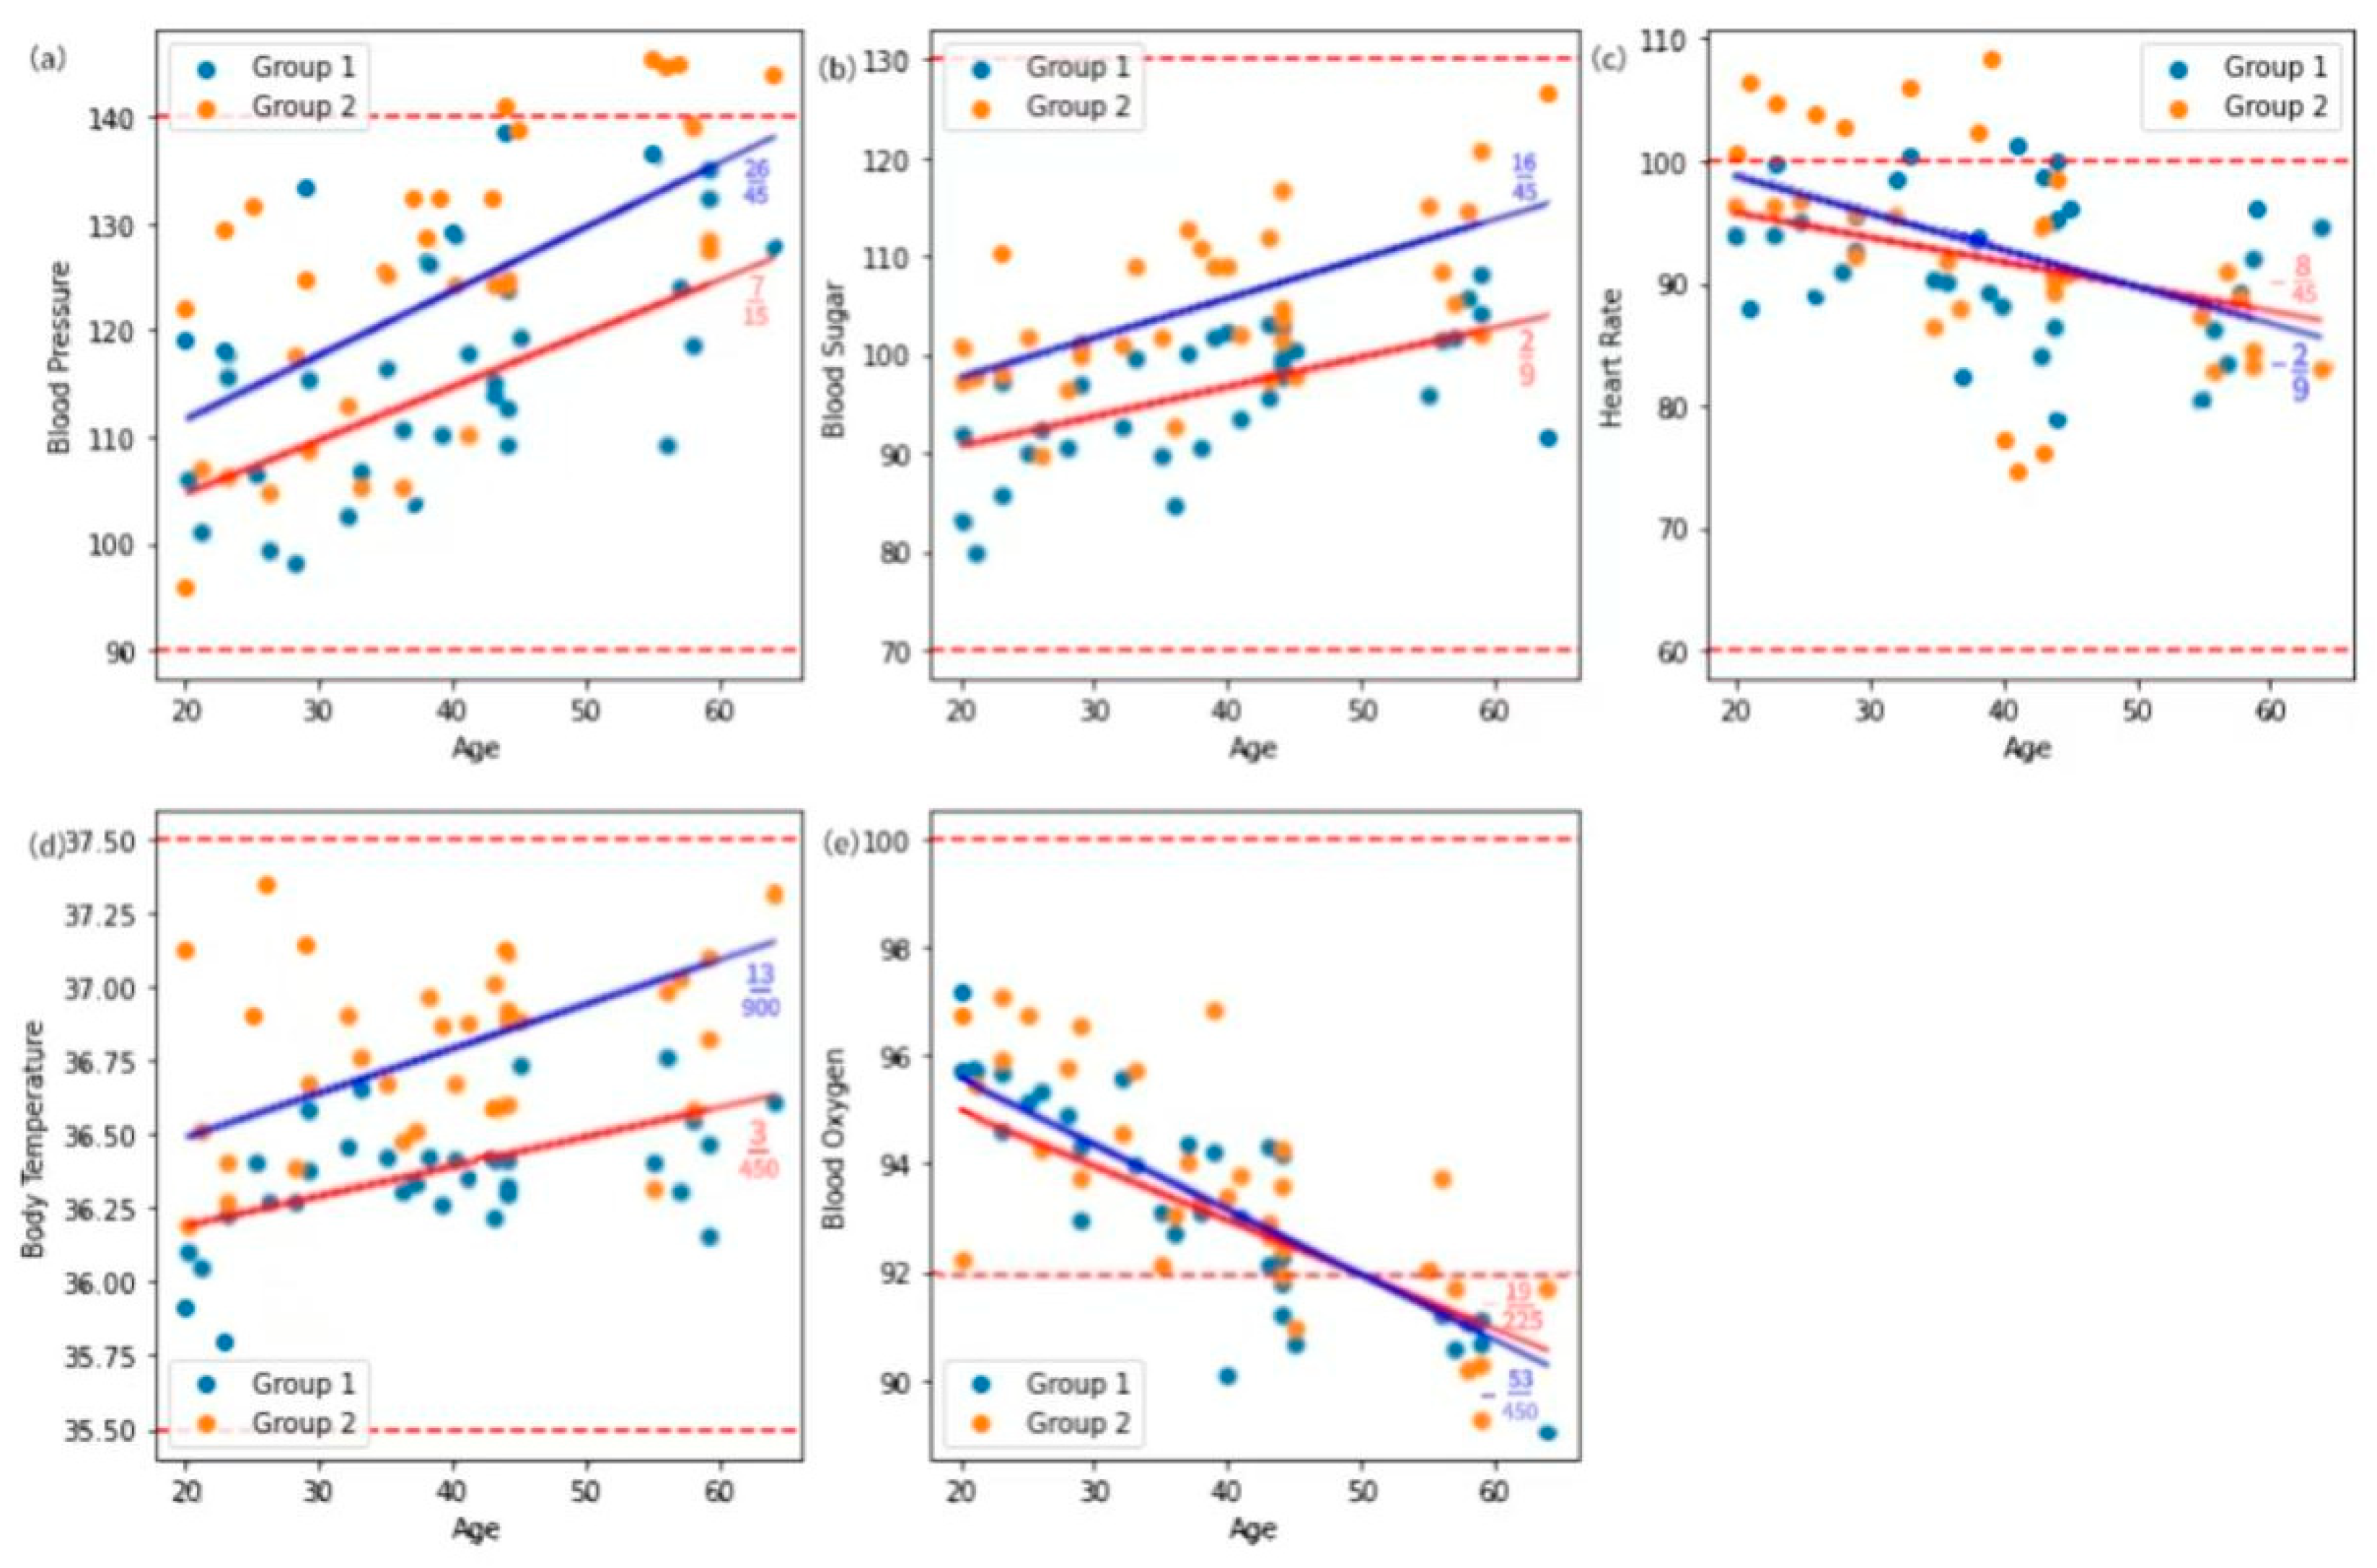
3.2. Relationship Between Human Physiological Parameters and Age

Under heatwave conditions, age has an impact on individual physiological parameters, with certain physiological indicators showing more sensitivity and pronounced changes [44]. Figure 7 shows that in heatwave conditions, the changes in blood glucose, blood pressure, and heart rate are more intense. Blood pressure increases with age (r = 0.1723, p < 0.05), which is particularly evident during heatwaves. Blood glucose levels also rise with age (r = 0.2208, p < 0.05), and this trend becomes more pronounced under high-temperature conditions. Although the negative correlation between blood oxygen levels and age is not significant (r = −0.0442, p > 0.05), the changes in blood oxygen become more dramatic under heatwave conditions. Heart rate increases with age (r = 0.1454, p < 0.05), and this increase is more apparent during heatwaves. Body temperature, which shows a weak negative correlation with age (r = −0.1131, p < 0.05), is more sensitive to changes in the elderly under heatwave conditions.
Therefore, based on the regression analysis of age and physiological parameters from two rounds of monitoring data (Figure 8), the red line represents the trend of the first round (normal environment) test data, while the blue line represents the trend of the second round (high-temperature environment) test data. The results indicate that the high-temperature environment has a significant impact on the physiological parameter changes across different age groups. Although the high-temperature environment did not alter the basic relationship between physiological indicators such as blood pressure, heart rate, blood glucose, body temperature, and age, it made these relationships closer and more significant.
Specifically, the high-temperature environment exacerbates the upward trend of blood pressure with age. The downward trend of blood oxygen in specific age groups is accelerated under high-temperature conditions. The changes in heart rate, blood glucose, and body temperature with age are also more significant. Meanwhile, the presence of anomalous data points is the result of the combined effects of the high-temperature environment, individual differences, the health status of the study subjects, and data collection errors. These findings suggest the complexity of human physiological mechanisms in high-temperature environments, with differences in age groups potentially affecting the extent of heat impacts. Therefore, age factors should be considered in health management, and corresponding preventive and regulatory measures should be taken to address the effects of high-temperature environments on individuals of different age groups.

3.2.1. Relationship Between Blood Pressure and Age

Under high-temperature heatwave conditions, blood pressure is higher (Figure 8a). The regression line of the first round under normal temperature shows the trend of blood pressure indicators with age in a normal temperature environment. According to the illustration, blood pressure indicators show an upward trend with age, consistent with common physiological principles, as arteries become harder with age, leading to an increased likelihood of elevated blood pressure [45]. The regression line in the second round under high-temperature conditions shows how blood pressure indicators change with age. Compared to the first round, the slope of the regression line in the second round is slightly larger, indicating a closer relationship between blood pressure and age in high-temperature environments and more significant changes. Since the slope of the regression line in the second round is slightly larger than that of the first, high temperatures exacerbate the upward trend of blood pressure with age. No intersection points between the two regression lines are observed within the range of age and blood pressure depicted in the graph, suggesting that the high-temperature environment does not significantly alter the fundamental relationship between blood pressure and age across the entire age range. The high-temperature environment did not significantly alter the basic relationship between blood pressure and age but made the relationship between blood pressure and age closer and more significant.

3.2.2. Relationship Between Blood Glucose and Age

With the increase in age, blood glucose levels show an upward trend, a trend that is more pronounced under high-temperature conditions (Figure 8b). Under normal temperature conditions, the first round of regression lines indicates an age-related increase in blood glucose levels. Under high-temperature conditions, the second round of regression lines has a steeper slope, indicating a stronger influence of age on blood glucose levels. This suggests that in high-temperature environments, the body’s metabolic activity is heightened, leading to an increased blood glucose response to age-related changes. Both sets of regression lines, in both normal and high-temperature environments, show that blood glucose levels are within the normal healthy range across all ages. This indicates that while high temperatures can affect blood glucose levels, they do not cause levels to exceed the normal range. The high-temperature environment did not significantly alter the basic relationship between blood glucose and age [46] but made the relationship between blood glucose and age more significant.

3.2.3. Relationship Between Heart Rate and Age

With the increase in age, heart rate indicators show a downward trend (Figure 8c). However, under high-temperature conditions, the decline in heart rate indicators is less than that under non-high-temperature conditions, indicating that the impact of high-temperature environments on heart rate is more significant. At the age of 50, the two regression lines intersect, which means that at this age point, the impact of the two tested environments on heart rate indicators is roughly equal. High-temperature conditions have a negative impact on residents under 50 but a positive impact on those over 50. This intersection point coincides with the intersection point in the blood oxygen-age regression graph at the same age range. The high-temperature environment did not significantly alter the basic relationship between heart rate and age but made the relationship between heart rate and age closer and more significant.

3.2.4. Relationship Between Body Temperature and Age

With the increase in age, body temperature indicators show an upward trend (Figure 8d). However, under high-temperature conditions, the increase in individual body temperature is more significant, indicating that the high-temperature environment exacerbates the trend of rising body temperature with age. In a normal temperature environment, body temperature indicators show a slight upward trend with increasing age. Under high-temperature conditions, this upward trend is more pronounced, indicating that the high-temperature environment makes the impact of age on body temperature more significant. Across the entire age range, the high-temperature environment does not fundamentally change the basic relationship between body temperature and age. This suggests that even under high-temperature conditions, body temperature remains within the normal healthy range without abnormally high levels. The high-temperature environment did not significantly alter the basic relationship between body temperature and age but made the relationship between body temperature and age more significant.

3.2.5. Relationship Between Blood Oxygen and Age

With increasing age, blood oxygen levels generally decline, and high-temperature environments accelerate this downward trend. After the age of 50, the body’s ability to regulate blood oxygen levels decreases, resulting in lower blood oxygen levels in both normal and high-temperature environments.
Both regression lines show a negative slope (Figure 8e). As age increases, blood oxygen concentration tends to decline. However, under high-temperature conditions, an individual’s blood oxygen concentration is lower than in non-high-temperature conditions. There is a crossover at the age of 50, which implies that high-temperature conditions have a negative impact on residents under 50, as blood oxygen concentration is crucial for health. However, for those over 50, high temperatures slow down the decline in blood oxygen concentration, which is a positive effect.

3.2.6. Variation of Physiological Parameters in Age

By comparing the changes in physiological parameters of people of different age groups under high-temperature conditions, we have revealed the significant impact of age on physiological indicators. With increasing age, blood pressure, heart rate, and blood sugar levels tend to rise, while blood oxygen levels slightly decrease, and body temperature shows a slight downward trend. These findings indicate that as people age, their adaptive capacity to high-temperature environments and physiological functions change. In this study, we also observed that heatwave conditions exacerbated the changes in blood oxygen saturation, heart rate, and blood sugar levels. These changes were primarily negative. Additionally, the impact of heat waves on heart rate and blood oxygen saturation, two physiological indicators, intersects at the age of 50. For individuals over 50, the effects of heat waves on heart rate and blood oxygen saturation show a positive side.

4. Discussion

The core objective of this study was to investigate the differential impacts of heat waves on physiological indicators across various age groups. The results indicate that heat waves significantly affect key physiological parameters such as heart rate, blood oxygen saturation, and blood glucose, with distinct age-related differences. The impact of heat waves on heart rate and blood oxygen saturation changes around the age of 50, suggesting that individuals in this age group may exhibit different adaptive responses to extreme heat. This finding provides important insights for identifying vulnerable populations. Traditionally, assessments of heat-related health risks have focused on individuals aged 65 and above, based on the World Health Organization’s definition of older age groups and data on the physiological vulnerability of the elderly to extreme heat [1,35,36]. However, there is currently a lack of monitoring specifying the age threshold for the differential impacts of heatwaves on various populations. This highlights the need for more nuanced approaches to risk assessment. Our study provides evidence that could refine or enhance existing evaluation criteria, suggesting that the age threshold for heatwave sensitivity may be lower than currently recognized. It may be appropriate to consider lowering the age threshold for targeted heatwave interventions.
For individuals under the age of 50, the study shows that heat waves lead to increased heart rate, elevated blood glucose levels, and decreased blood oxygen saturation. These changes may indicate metabolic and cardiovascular stress under high temperatures. Younger individuals generally have higher activity levels than older adults, and their activities are often more intense [47]. When engaging in activities in high-temperature environments, the heart rate significantly increases to meet the body’s demands for oxygen and energy. The body’s thermoregulation, water and salt metabolism, and cardiovascular system also experience additional stress [48]. Moreover, physical activity in high temperatures can lead to increased sweating, which may cause dehydration and electrolyte imbalances, thereby affecting blood glucose levels and cardiovascular function [49]. Additionally, activities in high temperatures can cause peripheral vasodilation, increasing the burden on the heart and further affecting heart rate and blood pressure [50].
For individuals over the age of 50, the study suggests that the impact of heat waves on heart rate and blood oxygen saturation may be less pronounced compared to younger individuals. This may indicate that with increasing age, the body’s adaptive capacity to heatwaves changes, and individuals in this age group may exhibit some resilience to extreme heat. However, it is important to note that this resilience does not imply complete immunity to heat-related health risks. Future research is needed to further elucidate the physiological mechanisms behind these age differences and to develop health management strategies tailored to different age groups.
Our study emphasizes the importance of considering age as a critical factor in heatwave risk assessment. Based on Spearman correlation analysis, our conclusion is that in high-temperature environments, factors other than age have relatively weak effects on physiological indicators. Specifically, education level, income level, health status, and the prevalence of air conditioning show almost no significant correlation with physiological parameters. This implies that regardless of education level, income level, health status, or the prevalence of air conditioning, there is no significant impact on physiological indicators. Through our questionnaire survey, we found that age may be a decisive factor in high-temperature environments [51]. As people age, they tend to become more cautious and take more measures to protect their health in high-temperature environments [52].
Despite these important findings, our study has some limitations. The relatively small sample size may limit our ability to detect subtle changes in certain physiological indicators. A smaller sample size can lead to insufficient statistical power, making it difficult to detect weaker associations between age and physiological indicators. Future studies may consider expanding the sample size to enhance the representativeness and statistical significance of the results. The finding that education level, income level, health status, and the prevalence of air conditioning have weak correlations with physiological indicators may also be limited by sample selection and analysis methods. Secondly, there were some difficulties in the device recovery process. The challenges posed by high-temperature environments to the stability and durability of equipment led to technical failures in some smartwatches during data collection, resulting in partial data loss. These issues highlight the importance of selecting high-performance, stable monitoring equipment for high-temperature studies. Further research is needed to determine whether factors other than age have relatively weak effects on the physiological state of the population under high-temperature conditions when conducting large sample size analyses and using other analytical methods [53].

5. Conclusions

This study utilized wearable devices to monitor real-time physiological responses of individuals during heatwave and non-heatwave periods, with a particular focus on the differences among various age groups. The findings revealed the impact of high-temperature environments on health indicators and underscored the practical significance of these changes for health assessment and management. The results indicated that high-temperature environments affected key physiological indicators such as blood glucose, blood oxygen, and body temperature. Blood glucose levels exhibited more pronounced daily fluctuations during high-temperature periods, suggesting an increased demand for energy and a higher metabolic rate under such conditions. Changes in blood oxygen levels revealed variations in the human body’s oxygen requirements at different times of the day, with high temperatures intensifying the need for oxygen. The cyclical changes in body temperature were closely related to environmental temperatures, with more significant fluctuations under high-temperature conditions. This result highlights the physiological challenges of maintaining a constant body temperature in a high-temperature environment and is crucial for developing effective heat adaptation strategies.
The relationships between blood glucose, blood pressure, heart rate, and body temperature emphasize the varying adaptive capacities of different age groups under high-temperature conditions, necessitating the consideration of age factors in health management and the implementation of corresponding preventive and regulatory measures to better address the physiological effects of high temperatures on the human body. These conclusions are based on real-time monitoring data collected during the study, providing new insights into the human body’s adaptive mechanisms under high-temperature conditions and offering a scientific basis for health risk assessment and work scheduling in high-temperature environments.

Author Contributions

Conceptualization, T.S. and Q.L.; methodology, M.X.; software, G.S.; validation, T.S., Y.K. and G.S.; formal analysis, T.S.; investigation, T.S.; resources, M.X.; data curation, G.S.; writing—original draft preparation, T.S. and Q.L.; writing—review and editing, T.S., Y.K., Q.L. and M.X.; visualization, G.S.; supervision, M.X. and Q.L.; project administration, T.S. and Q.L. All authors have read and agreed to the published version of the manuscript.

Funding

This research was funded by the National Natural Science Foundation of China [Grant No. 42171110].

Institutional Review Board Statement

Not applicable.

Informed Consent Statement

Informed consent was obtained from all subjects involved in the study.

Data Availability Statement

Data will be made available on request. The data are not publicly available due to the protection of participant privacy.

Acknowledgments

We are grateful to the editors and anonymous reviewers for their helpful comments on the original manuscript.

Conflicts of Interest

The authors declare no conflicts of interest.

References

  1. Romanello, M.; Napoli, C.D.; Drummond, P.; Green, C.; Kennard, H.; Lampard, P.; Scamman, D.; Walawender, M.; Ali, Z.; Ameli, N.; et al. The 2023 Report of the Lancet Countdown on Health and Climate Change: The Imperative for a Health-Centred Response in a World Facing Irreversible Harms. Lancet 2023, 402, 2346–2394. [Google Scholar] [CrossRef] [PubMed]
  2. Wang, D.; Sun, Y. Long-Term Changes in Summer Extreme Wet Bulb Globe Temperature over China. J. Meteorol. Res. 2021, 35, 975–986. [Google Scholar] [CrossRef]
  3. Hsiang, S.M.; Burke, M. Temperature and mortality: An analysis of the United States from 2000 to 2019. JAMA 2021, 326, 1039–1049. [Google Scholar]
  4. Climate Change Is Bad for Health but Climate Services Save Lives. WMO News. 2 November 2023. Available online: https://wmo.int/media/news/climate-change-bad-health-climate-services-save-lives (accessed on 11 December 2023).
  5. Campbell-Lendrum, D.; Neville, T.; Schweizer, C.; Neira, M. Climate change and health: Three grand challenges. Nat. Med. 2023, 29, 1631–1638. [Google Scholar] [CrossRef] [PubMed]
  6. Kjellstrom, T.; Holmer, I.; Lemke, B. Workplace Heat Stress, Health, and Productivity. J. Occup. Environ. Med. 2016, 58, e86–e91. [Google Scholar]
  7. Gonzalez-Alonso, J.; Crandall, C.G.; Johnson, J.M. The Cardiovascular Challenge of Exercising in the Heat. J. Appl. Physiol. 2008, 105, 682–688. [Google Scholar] [CrossRef]
  8. Ha, C.-M.; Park, S.; Choi, Y.-K.; Jeong, J.-Y.; Oh, C.J.; Bae, K.-H.; Lee, S.J.; Kim, J.-H.; Park, K.-G.; Jun, D.Y.; et al. Activation of nrf2 by dimethyl fumarate improves vascular calcification. Vasc. Pharmacol. 2014, 63, 29–36. [Google Scholar] [CrossRef]
  9. Wang, M.-Z.; Zhang, S.; Wang, S.-G. Research Progress of Influence of High Temperature and Heat Wave on Human Health. J. Environ. Health 2012, 29, 662–664. [Google Scholar]
  10. He, Z. Geoengineering: Proactive Measures to Tackle Climate Change. Natl. Sci. Rev. 2024, 11, 299–304. [Google Scholar]
  11. Yan, Y.; Zhang, H. Tackling Climate Change: China in Action. China Today 2024, 73, 26–31. [Google Scholar]
  12. He, B. High-Temperature Work and Human Thermal Response: Factors and Assessment of Heat Stress. Ph.D. Thesis, Chongqing University, Chongqing, China, 2023. (In Chinese). [Google Scholar]
  13. Wang, Y.; Zou, Y.; Li, Z. Emerging intelligent wearable devices for cardiovascular health monitoring. Nano Today 2024, 59, 102544. [Google Scholar] [CrossRef]
  14. Knudsen, M.T.; Hoyer, S.; Frost, F. Prehabilitation in Urological Oncology: A Systematic Review. BJU Int. 2020, 125, 483–493. [Google Scholar]
  15. Gustafsson, U.O.; Scott, M.J.; Schwenk, W.; Demartines, N.; Roulin, D.; Francis, N.; McNaught, C.E.; MacFie, J.; Liberman, A.S.; Soop, M.; et al. Guidelines for Perioperative Care in Elective Colonic Surgery: Enhanced Recovery After Surgery (ERAS) Society Recommendations. World J. Surg. 2011, 35, 245–256. [Google Scholar]
  16. Yin, F.; Hongsen, N.; Shin, Y.K.; Li, Y.; Kim, E.S.; Kim, N.Y. A wearable device based on the ionic liquid decorated sponge-like ultraviolet-curable resin for recognizing human mental health conditions. Nano Energy 2023, 118 Pt B, 109039. [Google Scholar] [CrossRef]
  17. Contini, M.S.; Martins, L.E.G. Wearable Device Sensing Technologies: A Systematic Literature Review. Res. Biomed. Eng. 2024, 40, 69–84. [Google Scholar] [CrossRef]
  18. Ichwana, D.; Ikhlas, R.Z.; Ekariani, S. Heart Rate Monitoring System During Physical Exercise for Fatigue Warning Using Non-invasive Wearable Sensor. In Proceedings of the International Conference on Information Technology Systems and Innovation (ICITSI 2008), Bandung, Indonesia, 22 October 2008; pp. 497–502. [Google Scholar] [CrossRef]
  19. Vonteddu, S.N.R.; Nunna, P.; Jain, S.; Diwakar, G. Smart Wearable Wristband for Patients’ Health Monitoring System through IoT. In Proceedings of the International Conference on Power, Energy, Control and Transmission Systems (ICPECTS 2022), Chennai, India, 8 December 2022; pp. 1–6. [Google Scholar] [CrossRef]
  20. Masoumian Hosseini, M.; Masoumian Hosseini, S.T.; Qayumi, K.; Hosseinzadeh, S.; Sajadi Tabar, S.S. Smartwatches in Healthcare Medicine: Assistance and Monitoring; A Scoping Review. BMC Med. Inform. Decis. Mak. 2023, 23, 248. [Google Scholar] [CrossRef]
  21. Andersen, Z.J.; Vicedo-Cabrera, A.M.; Hoffmann, B.; Melén, E. Climate Change and Respiratory Disease: Clinical Guidance for Healthcare Professionals. Breathe 2023, 19, 220222. [Google Scholar] [CrossRef] [PubMed]
  22. Vedantam, D.; Poman, D.S.; Motwani, L.; Asif, N.; Patel, A.; Anne, K.K. Stress-Induced Hyperglycemia: Consequences and Management. Cureus 2022, 14, e26714. [Google Scholar] [CrossRef]
  23. Romanovsky, A.A. Skin Temperature: Its Role in Thermoregulation. Acta Physiol. 2014, 210, 498–507. [Google Scholar] [CrossRef]
  24. Hasan, F.; Marsia, S.; Patel, K.; Agrawal, P.; Razzak, J.A. Effective Community-Based Interventions for the Prevention and Management of Heat-Related Illnesses: A Scoping Review. Int. J. Environ. Res. Public Health 2021, 18, 8362. [Google Scholar] [CrossRef]
  25. Ma, Y.; Lu, L.; Xiao, D.; Cai, M.; Ren, C.; Zhou, M.; Hui, W.; Li, Q. Urban Thermal Environment Analysis by Local Climate Zone in Beijing. J. Beijing Norm. Univ. (Nat. Sci.) 2022, 58, 901–909. [Google Scholar] [CrossRef]
  26. Hernandez, N.; Castro, L.; Medina-Quero, J.; Favela, J.; Michán, L.; Mortenson, W.B. Scoping Review of Healthcare Literature on Mobile, Wearable, and Textile Sensing Technology for Continuous Monitoring. J. Healthc. Inform. Res. 2021, 5, 270–299. [Google Scholar] [CrossRef] [PubMed]
  27. Nehra, K.A.; Gettman, T.M.; Rivera, E.M.; Agarwal, D.; O’Neil, D.; Jenkins, S.; Viers, B. Patients Are Willing to Utilize Wearable Devices for Their Care: A Survey of Perceptions and Acceptance of Wearable Technology for Health Monitoring in a Urological Patient Population. Urol. Pract. 2017, 4, 508–514. [Google Scholar] [CrossRef] [PubMed]
  28. Chen, B.; Xie, M.; Feng, Q.; Li, Z.; Chu, L.; Liu, Q. Heat Risk of Residents in Different Types of Communities from Urban Heat-Exposed Areas. Sci. Total Environ. 2021, 768, 145052. [Google Scholar] [CrossRef]
  29. Liu, Q.; Xie, M.; Wu, R.; Xue, Q.; Chen, B.; Li, Z.; Li, X. From Expanding Areas to Stable Areas: Identification, Classification, and Determinants of Multiple Frequency Urban Heat Islands. Ecol. Indic. 2021, 130, 108046. [Google Scholar] [CrossRef]
  30. Xuecheng, F.; Lei, Y.; Shuo, S. Accessing the Heat Exposure Risk in Beijing–Tianjin–Hebei Region Based on Heat Island Footprint Analysis. Atmosphere 2022, 13, 739. [Google Scholar] [CrossRef]
  31. Lei, J.; Xie, M.; Chen, B.; Su, W.; Zhao, X.; Wu, R. Key areas and measures to mitigate heat exposure risk in highly urbanized city: A case study of Beijing, China. Urban Clim. 2024, 53, 101748. [Google Scholar]
  32. Qunfang, H. Variation Characteristics of Summer High Temperature and Its Influence on Urban Heat Island Intensity in Beijing. Meteorol. Sci. Technol. 2023, 51, 66–74. (In Chinese) [Google Scholar] [CrossRef]
  33. Liu, Q.; Xie, M.; Peng, J.; Zhou, X.; Yang, K.; Zhu, R.; Liu, Y. Revealing the Urban Heat Exposure Risk Network: Exploring the Possibility of Mitigating Heat-Related Risks from a Network Perspective. Sustain. Cities Soc. 2024, 112, 105592. [Google Scholar] [CrossRef]
  34. Lu, S.; Jia, W.; Shuping, C. Population Spatial Distribution Based on Luojia 1-01 Nighttime Light Image: A Case Study of Beijing. Chin. Geogr. Sci. 2021, 31, 966–978. [Google Scholar]
  35. Chen, Y.; Qin, X. The Impact of Extreme Temperature Shocks on the Health Status of the Elderly in China. Int. J. Environ. Res. Public Health 2022, 19, 15729. [Google Scholar] [CrossRef] [PubMed]
  36. Wang, Y.; Ren, Y.; Song, L.; Xiang, Y. Responses of extreme high temperatures to urbanization in the Beijing–Tianjin–Hebei urban agglomeration in the context of a changing climate. Meteorol. Appl. 2021, 28, e2024. [Google Scholar]
  37. Cai, F.; Liu, C.; Gerten, D.; Yang, S.; Zhang, T.; Lin, S.; Kurths, J. Pronounced Spatial Disparity of Projected Heatwave Changes Linked to Heat Domes and Land-Atmosphere Coupling. npj Clim. Atmos. Sci. 2024, 7, 225. [Google Scholar] [CrossRef]
  38. Jiayan, L.; Ranhao, S.; Jialei, L.; Yongfu, M.; Meng, Z.; Liding, C. Human Extreme Heat Protective Behaviours: The Effects of Physical Risks, Psychological Perception, and Public Measures. Humanit. Soc. Sci. Commun. 2024, 11, 327. [Google Scholar]
  39. Parati, G.; Ochoa, J.; Lombardi, C.; Bilo, G. Assessment and Management of Blood-Pressure Variability. Nat. Rev. Cardiol. 2013, 10, 143–155. [Google Scholar] [CrossRef]
  40. Fatisson, J.; Oswald, V.; Lalonde, F. Influence Diagram of Physiological and Environmental Factors Affecting Heart Rate Variability: An Extended Literature Overview. Heart Int. 2016, 11, e32–e40. [Google Scholar] [CrossRef]
  41. Lv, Y.; Huo, Z. Special Environmental Physiology; Military Medical Science Press: Beijing, China, 2003. (In Chinese) [Google Scholar]
  42. Hu, Y.; Zhang, P.; Ding, B.; Cao, X.; Zhong, Y.; Lee, K.O.; Ma, J.H. Response of Blood Glucose and GLP-1 to Different Food Temperature in Normal Subjects and Patients with Type 2 Diabetes. Nutr. Diabetes 2022, 12, 28. [Google Scholar] [CrossRef]
  43. Pastor, M.C. Hyperthermia Decreases the Response to Vasoconstrictors in Rat Portal Veins. Eur. J. Pharmacol. 2004, 494, 191–197. [Google Scholar]
  44. Wolsk, E.; Bakkestrom, R.; Thomsen, H.J.; Balling, L.; Andersen, M.J.; Dahl, J.S.; Hassager, C.; Møller, J.E.; Gustafsson, F. The Influence of Age on Hemodynamic Parameters During Rest and Exercise in Healthy Individuals. JACC Heart Fail. 2016, 5, 337–346. [Google Scholar]
  45. Suzuki, Y.; Kaneko, H.; Yano, Y.; Okada, A.; Itoh, H.; Matsuoka, S.; Fujiu, K.; Yamaguchi, S.; Michihata, N.; Jo, T.; et al. Age-Dependent Relationship of Hypertension Subtypes With Incident Heart Failure. J. Am. Heart Assoc. 2022, 11, e025406. [Google Scholar] [CrossRef]
  46. Ou, Q.; Wu, R. The Relationship Between Blood Sugar and Age. Intermed. Med. J. 1996, 3, 18–19. (In Chinese) [Google Scholar]
  47. Sun, S.; Guo, Y.; Ruan, Y.; Zheng, Y.; Huang, Z.Z.; Shi, Y.; Wu, F. Association Between Quality of Life and Physical Activity Among People Aged 50 Years and Over. Chin. J. Epidemiol. 2019, 40, 1245–1251. [Google Scholar] [CrossRef]
  48. Mostardi, R.; Kubica, R.; Veicsteinas, A.; Margaria, R. The Effect of Increased Body Temperature Due to Exercise on the Heart Rate and on the Maximal Aerobic Power. Eur. J. Appl. Physiol. 1974, 33, 237–245. [Google Scholar] [CrossRef] [PubMed]
  49. Sehgal, S.; Gupta, S.; Mishra, M.K. Electrolytes and Acid-Base Disorders. In Clinical Applications of Biomolecules in Disease Diagnosis; Singh, R.L., Singh, P., Pathak, N., Eds.; Springer: Singapore, 2024; p. 7. [Google Scholar] [CrossRef]
  50. Kenny, G.P.; Notley, S.R.; Flouris, A.D.; Nybo, L. Effects of Increased Activity Level on Physiological and Subjective Responses at Different High Temperatures. Appl. Ergon. 2021, 93, 103384. [Google Scholar]
  51. Wang, L.Y.; Feng, M.; Hu, X.Y.; Tang, M.L. Association of Daily Health Behavior and Activity of Daily Living in Older Adults in China. Sci. Rep. 2023, 13, 19484. [Google Scholar] [CrossRef]
  52. Lim, C.L. Fundamental Concepts of Human Thermoregulation and Adaptation to Heat: A Review in the Context of Global Warming. Int. J. Environ. Res. Public Health 2020, 17, 7795. [Google Scholar] [CrossRef]
  53. Cramer, M.N.; Gagnon, D.; Laitano, O.; Crandall, C.G. Human Temperature Regulation Under Heat Stress in Health, Disease, and Injury. Physiol. Rev. 2022, 102, 1907–1989. [Google Scholar] [CrossRef]
Figure 1. Overview of the study area. (a) Study area location; (b) information on the survey points.
Atmosphere 16 00413 g001
Figure 2. Technology roadmap.
Atmosphere 16 00413 g002
Figure 3. Parameter changes during heatwave and non-heatwave periods. In the illustration, the first round represents the non-heatwave period, and the second round represents the high-temperature heatwave period. (a) Temperature Change: The average daily temperature during the heatwave and non-heatwave periods; (b) Blood Sugar Change: The daily variation in blood glucose levels; (c) Blood Oxygen Change: The daily variation in blood oxygen levels; (d) Body Temperature Change: The daily variation in body temperature; (e) Blood Pressure Change: The daily variation in blood pressure; (f) Heart Rate Change: The daily variation in heart rate.
Atmosphere 16 00413 g003
Figure 4. Comparison of Weekly Changes in Physiological Indicators between Two Groups. In the illustration, the first round represents the non-heatwave period, and the second round represents the high-temperature heatwave period. (a) Weekly temperature variation: The hourly monitored values for each day during heatwave and non-heatwave periods; (b) Weekly Blood Sugar Variation: The weekly variation in blood glucose levels; (c) Weekly Blood Oxygen Variation: The weekly variation in blood oxygen levels; (d) Weekly Body Temperature Variation: The weekly variation in body temperature; (e) Weekly Blood Pressure Variation: The weekly variation in blood pressure; (f) Weekly Heart Rate Variation: The weekly variation in heart rate.
Atmosphere 16 00413 g004
Figure 5. Comparison of Daily Extremes in Physiological Indicators between Two Groups. In the illustration, the first round represents the non-heatwave period, and the second round represents the high-temperature heatwave period. (a) Blood Sugar: Extreme difference between Group 1 and Group 2: showing the differences in extreme values of blood glucose between the non-heatwave and heatwave periods within a single day; (b) Blood Oxygen: Extreme difference between Group 1 and Group 2: reflecting the differences in extreme values of blood oxygen levels within a single day; (c) Body Temperature Extreme difference between Group 1 and Group 2: showing the differences in extreme values of body temperature within a single day; (d) Blood Pressure; Extreme difference between Group 1 and Group 2: reflecting the differences in extreme values of blood pressure within a single day; (e) Heart Rate: Extreme difference between Group 1 and Group 2: showing the differences in extreme values of heart rate between the two periods within a single day.
Atmosphere 16 00413 g005
Figure 6. Comparison of Daily Extremes in Physiological Indicators between Two Groups. In the illustration, the first round represents the non-heatwave period, and the second round represents the high-temperature heatwave period. (a) Blood Oxygen: Extreme difference between Group 1 and Group 2 reflecting the differences in extreme values of blood oxygen levels within a week; (b) Blood Oxygen: Extreme difference between Group 1 and Group 2 reflecting the differences in extreme values of blood oxygen levels within a single day; (c) Body Temperature: Extreme difference between Group 1 and Group 2 showing the differences in extreme values of body temperature within a week; (d) Blood Pressure: Extreme difference between Group 1 and Group 2 reflecting the differences in extreme values of blood pressure within a week; (e) Heart Rate: Extreme difference between Group 1 and Group 2 showing the differences in extreme values of heart rate between the two periods within a week.
Atmosphere 16 00413 g006
Figure 7. Correlation Study between Age and Physiological Parameters.
Atmosphere 16 00413 g007
Figure 8. Regression Analysis Scatterplot between Age and Physiological Parameters. In the illustration, the first round represents the non-heatwave period, and the second round represents the high-temperature heatwave period. The red line represents the regression line for the first round, and the blue line represents the regression line for the second round. (a) The linear relationship between blood pressure and age during the high-temperature period and the non-high-temperature period; (b) The linear relationship between blood glucose and age during the heatwave period and the non-heatwave period; (c) The linear relationship between heart rate and age during the high-temperature period and the non-high-temperature period; (d) The linear relationship between body temperature and age during the heatwave period and the non-heatwave period; (e) The linear relationship between blood oxygen saturation and age during the heatwave period and the non-heatwave period.
Atmosphere 16 00413 g008
Table 1. Wearable Device Evaluation Table.
Feature/Product NameWearing PositionBattery LifeGPS AccuracySleep Quality MonitoringHeart Rate MonitoringBody Temperature MonitoringHigh-Temperature AlertBlood Oxygen Monitoring
Wrist5–18 h××
Wrist3–12 days×××
Wrist3–12 days×××
Wrist7–14 days×
Wrist10–14 days×××
Finger4–7 days××
Wrist3–5 days××
Wrist3–7 days×
Wrist10–14 days×××
“×” indicates that the feature is imperfect. “√” indicates that the feature is well-developed.
Table 2. Summary of Partial Information of Participants.
FactorsClassificationPercentage
GenderMale77.1%
Female22.9%
Age<3025.7%
30–5051.4%
>5022.9%
Education LevelHigh school/Technical school or below25.7%
High school/Technical school54.3%
Bachelor’s degree and above20.0%
Geographical LocationFengtai District41.4%
Haidian District14.3%
Daxing District15.7%
Chaoyang District15.7%
Fangshan District12.9%
Outdoor Activity Frequency (Per Day)None or very little51.4%
Two hours or more11.4%
Six hours or more37.2%
Monthly Income<10008.6%
1000–500045.7%
5000–10,00011.4%
>10,00034.3%
Coping StrategiesYes60.0%
No40.0%
Social SupportYes62.8%
No37.2%
Disclaimer/Publisher’s Note: The statements, opinions and data contained in all publications are solely those of the individual author(s) and contributor(s) and not of MDPI and/or the editor(s). MDPI and/or the editor(s) disclaim responsibility for any injury to people or property resulting from any ideas, methods, instructions or products referred to in the content.

