Article

Identifying the Signature of the Solar UV Radiation Spectrum

by
Andrea-Florina Codrean
,
Octavian Madalin Bunoiu
and
Marius Paulescu
*
Faculty of Physics, West University of Timisoara, V. Parvan 4, 300223 Timisoara, Romania
*
Author to whom correspondence should be addressed.
Atmosphere 2025, 16(4), 427; https://doi.org/10.3390/atmos16040427
Submission received: 11 March 2025 / Revised: 29 March 2025 / Accepted: 3 April 2025 / Published: 6 April 2025
(This article belongs to the Section Upper Atmosphere)

Abstract

:
The broadband spectrum of solar radiation is commonly characterized by indices such as the average photon energy (APE) and the blue fraction (BF). This work explores the effectiveness of the two indices in a narrower spectral band, namely the ultraviolet (UV). The analysis is carried out from two perspectives: sensitivity to the changes in the UV spectrum and the uniqueness (each index value uniquely characterizes a single UV spectrum). The evaluation is performed in relation to the changes in spectrum induced by the main atmospheric attenuators in the UV band: ozone and aerosols. Synthetic UV spectra are generated in different atmospheric conditions using the SMARTS2 spectral solar irradiance model. The closing result is a new index for the signature of the solar UV radiation spectrum. The index is conceptually just like the BF, but it captures the specificity of the UV spectrum, being defined as the fraction of the energy of solar UV radiation held by the UV-B band. Therefore, this study gives a new meaning and a new utility to the common UV-B/UV ratio.

1. Introduction

Solar ultraviolet (UV) radiation designates the spectral range from 100 to 400 nm. The UV spectrum itself is typically divided into three spectral bands: UV-C (100–280 nm), UV-B (280–315 nm), and UV-A (315–400 nm) (see, e.g., ref. [1]). Solar UV radiation influences many natural processes related to the environment and human health, both in positive and negative ways [2]. UV-C is a life-killing radiation, but it does not reach the Earth’s surface, being completely absorbed by the stratospheric ozone layer. A large part of UV-B radiation is also absorbed in the atmosphere. The remaining part (less than 10%) significantly impacts the biosphere [3]. UV-A radiation is less unsafe than UV-B, mainly contributing to premature aging of human skin.
At ground level, solar UV radiation consists of UV-A radiation and a much smaller part of UV-B radiation (roughly less than 5%). If we refer to the impact on human health, UV radiation, but especially the small part of UV-B, is responsible for skin burning, retinal damage, and skin cancer [4]. All the biological effects (be it humans, marine animals, or plants) have a fundamentally spectral character, depending strongly and nonlinearly on the wavelength of photons. A photon-induced biological effect is typically quantified by the so-called biological action function B(λ), sometimes called the action spectrum. This function measures the efficiency with which a photon of wavelength λ leads to a specific biological effect. The mathematical representation of B(λ) is empirically formalized, starting from the spectral response of a biological endpoint experimentally measured under well-defined conditions [5,6]. Figure 1a illustrates probably the most common biological action function, namely the standard erythemal action function, as agreed by the Commission Internationale de l’Éclairage (CIE) in 1987 [7].
Biologically effective solar irradiance Ge is evaluated by weighing solar UV spectral irradiance G(λ) with a specific biological action function B(λ), i.e., G e λ = G λ B λ . Thus, the study of the effects of solar UV radiation on the biosphere forms a multifaceted research area, with the UV radiation itself being the common subject of both the radiative transfer through the atmosphere and photon-induced biological processes. This study is covered by the first topic, focusing on the characterization of the solar UV radiation spectrum. The relevance of this study is argued further from a photobiology perspective.
The level of UV radiation on the ground is largely determined by the amounts of stratospheric ozone and clouds [9]. Any change in the thickness of the ozone layer is viewed with concern due to the potentially harmful effects on the biosphere. Thus, the trend of both stratospheric ozone and tropospheric ozone is monitored and analyzed [10]. Atmospheric aerosols influence the level of UV radiation to a lesser extent than ozone and clouds [11]. However, aerosols can contribute significantly to the changing of the direct-to-diffuse ratio of UV radiation. Due to the low spatial density of UV radiation monitoring stations, modeling solar UV irradiance based on atmospheric parameters and broadband measurements is an intensely researched topic (e.g., refs. [12,13]). The parameterization of effective UV irradiance has been and is being intensively investigated, as well (e.g., refs. [14,15]).
Both processes, atmospheric ozone absorption and aerosol extinction, impact the spectrum of UV radiation under clear sky conditions. Changes in the spectral distribution cannot be detected by common radiometric measurements/estimations in the UV band. Similar values of solar UV irradiance can result from the integration of a bluer (more short-wavelength photons) or redder (more long-wavelength photons) solar UV spectrum. Even if identical solar UV irradiances are measured, the different spectral distributions can induce different, even significantly different, efficiencies of various biological processes. Figure 1b illustrates this physical phenomenon. Thus, Figure 1b shows two synthetic solar UV spectra generated at the same atmospheric optical mass m = 3 but under different atmospheric conditions (see Section 3.2 for details about UV spectra generation). The first spectrum, G1(λ), was generated considering a small amount of ozone (lO3 = 0.25 cm·atm) in the atmosphere and a low loading of the atmosphere with fine aerosols (Ångström turbidity coefficient β = 0.03, Ångström exponent α = 2). For the generation of the second spectrum G2(λ), the atmosphere was considered to contain a large amount of ozone (lO3 = 0.55 cm·atm) and the same low loading with aerosols (β = 0.03) but with a predominant coarse mode (α = 0.2). Even though the difference between the spectra in Figure 1b is visible to the naked eye, the irradiances corresponding to the two spectra have the same value: 0.28 μ m 0.4 μ m G 1 λ d λ = 0.28 μ m 0.4 μ m G 2 λ d λ = 25.3 W / m 2 . Figure 1b also shows the effective biological irradiances G e 1 λ = G 1 λ B λ and G e 2 λ = G 2 λ B λ , considering the erythemal action function (Figure 1a) and exposures to UV radiation with spectral characteristics G1(λ) and G2(λ), respectively. It can be seen that G1(λ) causes an erythemal action about four times greater than G2(λ), even if the same UV irradiances were to be measured.
Generally, exposure to UV radiation of the same power but with different spectral distributions can produce biological effects with significantly different efficiency. To understand the biological response of solar UV radiation, it is not enough to measure/estimate solar irradiance in the UV spectral band, but information about its spectral distribution is also necessary. Thus, a spectral index that characterizes the specificity of a UV radiation spectrum becomes of substantial interest.
Unlike the UV band, characterization of the broadband solar radiation spectrum based on spectral indices is a common practice and constitutes a current research topic [16]. Research is carried out mainly in relation to the spectral response of solar cells [17,18], formalized similarly to the spectral response of a living organism exposed to UV radiation. The broadband solar radiation spectrum is commonly characterized by two indices: the average photon energy (APE) and the blue fraction (BF) [16]. Each index roughly marks the broadband solar radiation spectrum by an individual numerical value. As their name suggests, APE represents the average value of the photon energy in the spectrum, while the BF measures the enhancement of the bluer part of the spectrum. APE is the most used quantifier for specifying the distinctive characteristics of the solar radiation spectrum. The two indices are mathematically defined in Section 2.
The objective of this study is to explore the effectiveness of broadband spectral indexes in characterizing the UV solar radiation spectrum and to propose a new UV-specific spectral index.
The remainder of the paper is organized as follows. The spectral indices APE and BF are defined in Section 2. Section 3 discusses the research methodology and the results. Section 3.1 introduces the new UV-specific spectral indices. Section 3.2 summarizes the process of generating synthetic UV spectra. The results of the proposed index evaluation are presented in Section 3.3 (sensitivity) and Section 3.4 (uniqueness). Section 4 gathers the main conclusions.

2. Signatures of Solar Radiation Spectrum

Generally, APE is defined as the integrated spectral solar irradiance G(λ) divided by the integrated photon flux density:
A P E = λ 1 λ 2 G λ d λ q h c λ 1 λ 2 λ G λ d λ
where q denotes the elementary charge, h is Planck’s constant, and c is the light speed. In other words, Equation (1) defines APE as the ratio of energy to the number of photons that carry this energy in a spectral band [ λ 1 , λ 2 ] . APE is usually expressed in eV. For broadband, the integration limits are λ 1 = 0.28 μ m and λ 2 = 4.0 μ m . APE is a good enough index for capturing the specific signature of a particular spectral distribution in the solar radiation spectrum [19,20]. To apply Equation (1) in UV, it is enough to change the integration domain to the range of wavelengths that define the UV band, i.e., λ 1 = 0.28 μ m and λ 2 = 0.4 μ m . An APE greater than a reference value characterizes a blueshift in the UV spectrum. An APE lower than the reference value characterizes a redshift in the UV spectrum. The choice of the reference spectrum in the UV range is explained in Section 3.2.
The blue fraction, BF, is defined as the ratio of solar irradiance in an arbitrary “blue” band to the broadband solar irradiance:
B F = λ 1 λ M G λ d λ λ 1 λ 2 G λ d λ
where λ M splits the spectrum into two disjointed domains, one towards blue and another towards red. The BF was originally defined in relation to photovoltaic (PV) applications with λ M = 0.65 μ m [16]. To apply Equation (2) in the UV band, as for APE, λ 1 = 0.28 μ m , λ 2 = 0.4 μ m , and an appropriate value for λ M has to be found.

3. Results and Discussions

This section presents the main results of the study. First, the new indices proposed for characterizing the solar UV radiation spectrum are introduced. Then, the effectiveness of the three indices in characterizing the solar UV spectrum is explored, studying how they capture the variability in the spectrum at ground level. The analysis is carried out from the two following perspectives: sensitivity to the changes in the solar UV spectrum and uniqueness (each index value uniquely characterizes a single UV spectrum). An important piece of this study is the collection of synthetic UV spectra, which cover a wide range of atmospheric conditions. Therefore, the procedure for generating the spectra is presented in quite detail.

3.1. Proposal for Signatures of the Solar Radiation Spectrum in the UV Band

In this study, three indices for the characterization of the UV solar radiation spectrum at ground level are explored. These indices are defined as follows:
1.
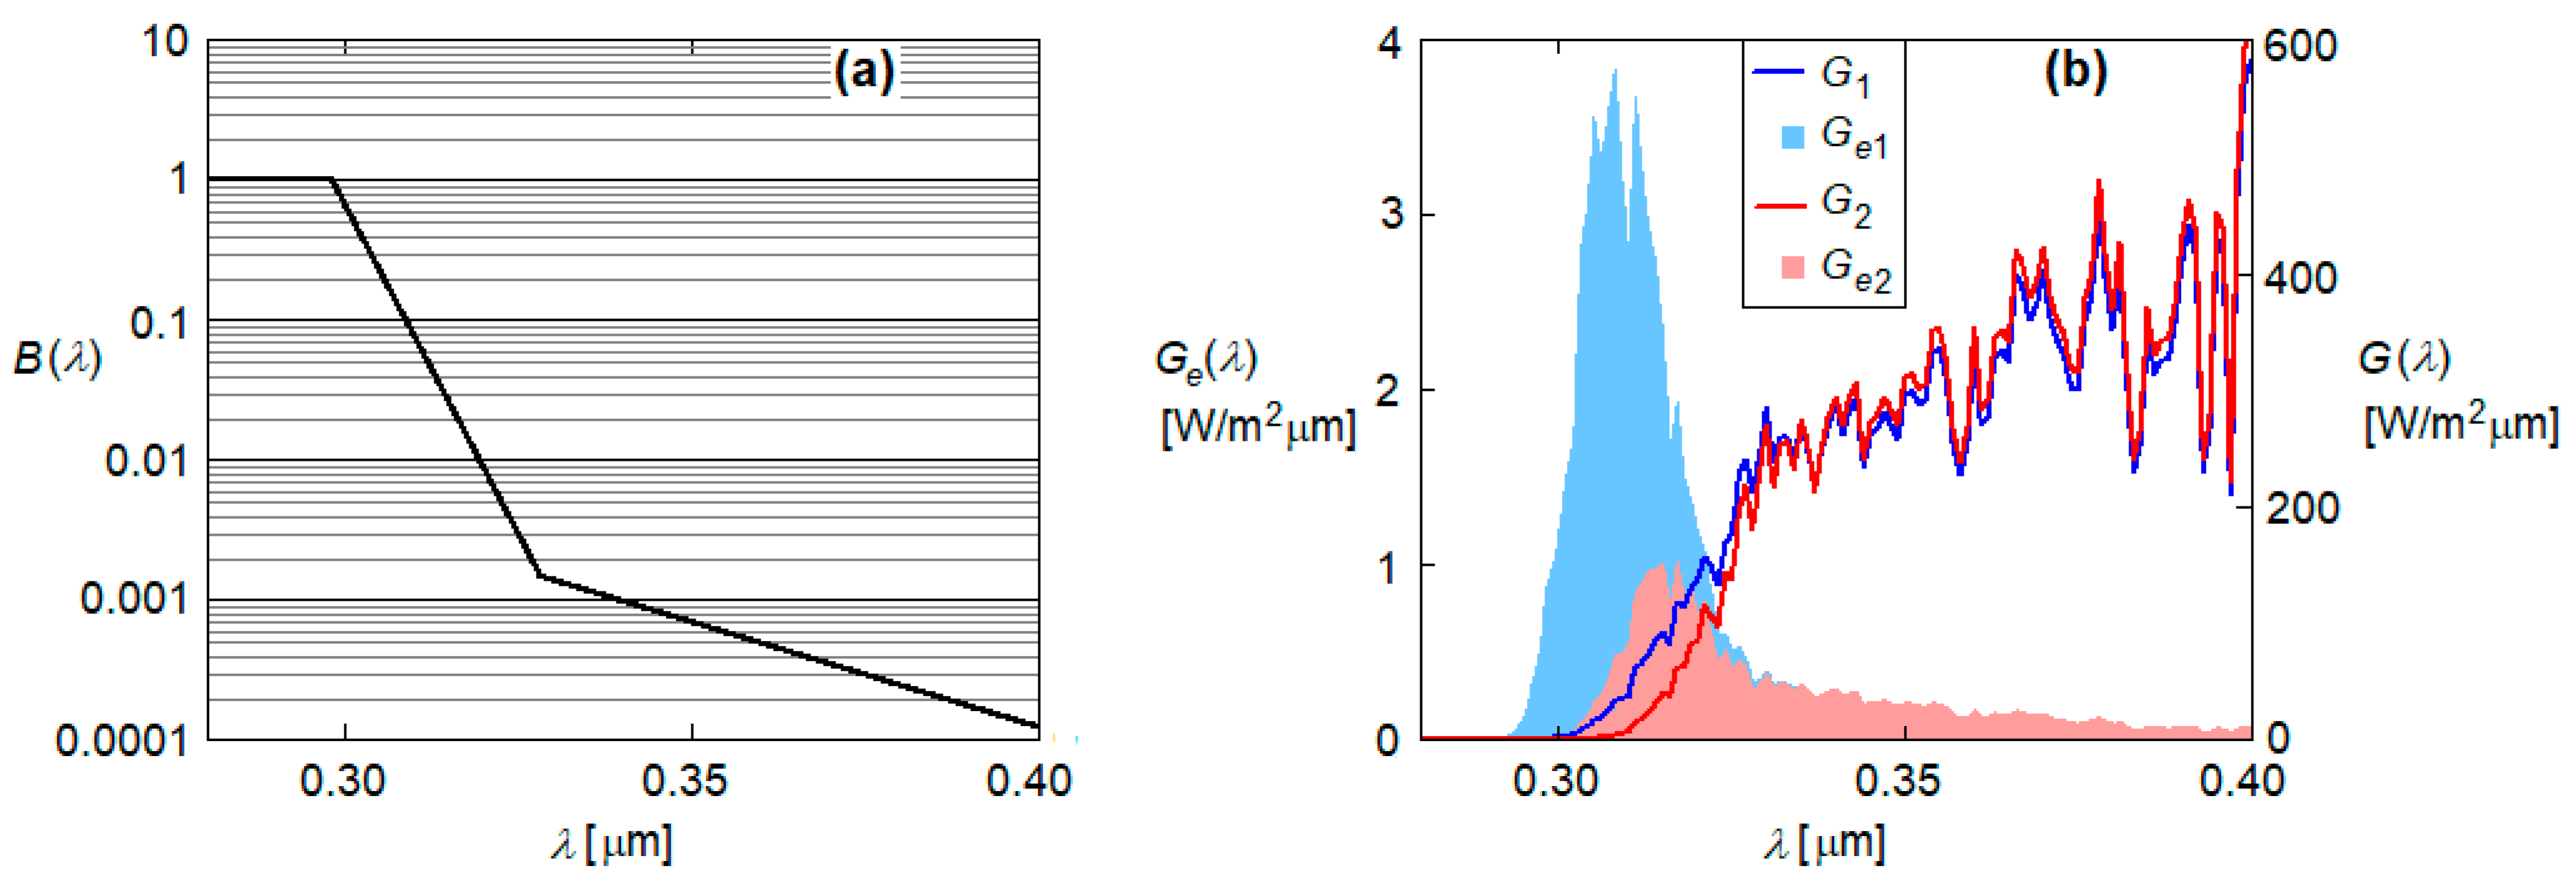
APEUV is defined by Equation (1), where the integration domain was restricted to the UV band λ 1 = 0.28 μ m and λ 2 = 0.4 μ m .
2.
BF1/2 is defined by Equation (2), with λ M = 0.3637 μ m . This proposal emerges naturally, as λ M divides the reference UV spectrum into two equal parts in terms of energy. BF1.2 > 1 indicates a blueshift in the UV spectrum, while BF1/2 < 1 indicates a redshift.
3.
BFUVB/UV is also defined by Equation (2), but with λ M = 0.315 μ m . BFUVB/UV captures the specificity of the UV band, being defined as the fraction of the energy of solar UV radiation held by UV-B.
The last two proposed indices are formally defined as the BF, the difference being given by the threshold λ M that delimits the bluer domain from the redder one. Even if BF1/2 and BFUVB/UV are natively identical, as the test analysis shows (Section 3.3), the choice of the threshold value λ M significantly influences their properties.
At this end, it is important to stress that the UV-B/UV ratio was investigated from various perspectives [21] but never as a signature for the UV spectrum.

3.2. Synthetic UV Spectra

This study was conducted with synthetically generated spectra of solar UV radiation using the SMARTS2 model [22]. SMARTS2 is a widely recognized and applied model for evaluating the components of solar spectral irradiance [23]. The use of synthetic spectra is preferable for at least two reasons: (1) there are very few radiometric stations that monitor spectral solar irradiance, and the establishment of a database covering all atmospheric conditions is far from feasible; and (2) the use of synthetic spectra ensures uniform coverage of the ranges of variation in the atmospheric parameters, which would be almost impossible with measured spectra. SMARTS2 was implemented in a simplified version, adapted to the UV band. The specific elements in our implementation are summarized next.
Due to their large transmittance in the UV range, the absorption of water vapor and uniformly mixed gas was neglected. Thus, the specific atmospheric transmittances associated with these two attenuation processes were assumed to be equal to one. A second assumption was made on the Sun elevation angle h. Only values h > 11.2° are considered, corresponding to an atmospheric optical mass m = 4.90, calculated with the widely used Kasten and Young equation [24]. This hypothesis allows for the simplified relationship between the Sun elevation angle and the atmospheric optical mass m as sin h = 1 / m , and further, the explicit formulation as a function of m of the specific atmospheric transmittance. At the limit, the 1/sin(11.2°) approximation leads to m = 5.0, which is the maximum value considered in this study. As h increases, the difference between the 1 / sin h approximation and the atmospheric optical mass calculated with the Kasten and Young equation drops sharply.
The direct-normal spectral solar irradiance G d n is expressed as a function of the atmospheric optical mass m, ozone content in the atmospheric column lO3, nitrogen dioxide content in the atmospheric column lNO2, Ångström turbidity coefficient β (as a measure of the atmospheric aerosol loading), and Ångström exponent α (as a measure of the aerosol granularity):
G d n λ , m , l O 3 , l N O 2 , α , β = G e λ τ O 3 m , λ , l O 3 τ N O 2 m , λ , l N O 2 τ R m , λ τ a m , λ , α , β
τ denotes a specific atmospheric transmittance associated with an extinction process: ozone absorption ( τ O 3 ), nitrogen dioxide absorption ( τ N O 2 ), Rayleigh scattering ( τ R ), and aerosol extinction ( τ a ).
The diffuse spectral solar irradiance is calculated as a sum of two components corresponding to Rayleigh ( G d R ) and aerosol ( G d a ) scattering processes:
G d λ , m , l O 3 , l N O 2 , α , β , S S A , g = G d R λ , m , l O 3 , l N O 2 , α , β , S S A , g + G d a λ , m , l O 3 , l N O 2 , α , β , S S A , g
G d R λ , m , l O 3 , l N O 2 , α , β , S S A = 1 2 G e λ τ O 3 λ , l O 3 , m τ N o 2 λ , l N O 2 , m τ a a λ , m , α , β , S S A 1 τ R λ , m 0.9 1 m
G d a λ , m , l O 3 , l N O 2 , α , β , S S A , g = = γ a ( m , g ) G e λ τ O 3 λ , m , l O 3 τ N O 2 λ , l N O 2 , m τ R λ , m τ a a λ , m , α , β , S S A 1 τ a s λ , m , α , β , S S A 1 m
where τ a a and τ a s denote the specific atmospheric transmittances associated with aerosol absorption and scattering, respectively. τ a a and τ a s depend on the single scattering albedo SSA, a measure of aerosol absorptivity. The downward fraction γ a in Equation (6) is expressed as a function of the aerosol asymmetry factor g.
In a horizontal plane, the global spectral solar irradiance is just the sum of the beam and diffuse components:
G λ , m , l O 3 , l N O 2 , α , β , S S A , g = G d n λ , m , l O 3 , l N O 2 , α , β 1 m + G d λ , m , l O 3 , l N O 2 , α , β , S S A , g
Equations (3)–(7) are written underlining the dependence of the UV irradiance on the wavelength λ, atmospheric optical mass m, and the physical parameters of the aerosols α, β, SSA, and g. Reference [22] provides a full description of the specific atmospheric transmittances τ and the extraterrestrial UV spectrum G e λ .
The reference spectrum is defined by the following values of the atmospheric parameters (commonly accepted as average values in the continental area at mid-latitudes in the northern hemisphere): ozone column content lO3,0 = 0.35 cm·atm, nitrogen dioxide column content lNO2,0 = 0.0002 cm·atm, Ångström turbidity coefficient β0 = 0.079, Ångström exponent α0 = 1.3, single scattering albedo SSA0 = 0.95, and aerosol asymmetry factor g0 = 0.7.
In the UV spectral band (0.28–0.4 µm), SMARTS2 provides the G e λ and the absorption coefficients at 121 wavelengths at a 1 nm resolution [22]. To accurately define BF1/2 (see Section 3.1), we increased the spectral density ten times using linear interpolation. As a result, to be consistent, in the case of all three indices, the investigation was conducted based on an extraterrestrial spectrum and absorption coefficients defined at 1201 wavelengths, with a resolution of 0.1 nm.
Figure 2 shows 15 synthetic spectra of global solar irradiance in the UV band, considering different atmospheric conditions. The spectra were generated with Equation (7), aiming to isolate the impact of ozone and aerosol in the extinction of solar radiation. Each spectrum was generated, considering an atmospheric optical mass m = 3 and with reference parameters, except for one. In each frame of Figure 2, in addition to the reference value, the exception parameter takes two more values, namely (rather empirical) the minimum and maximum values. While the ozone amount changes significantly in the UV-B/UV ratio, aerosol scattering changes the spectrum in the entire UV band. Figure 2a isolates the effect of the ozone content in the atmospheric column lO3, underlining the redshift of spectra as lO3 increases. Figure 2b–e shows the effect of the aerosol parameters, Ångström turbidity coefficient β (Figure 2b), Ångström exponent α (Figure 2c), single scattering albedo SSA (Figure 2d), and aerosol asymmetry factor g (Figure 2e) on the UV spectrum. The changes in the aerosol amount (Figure 2b) and absorptivity (Figure 2d) have the strongest influence on the UV spectral irradiance level, while the asymmetry factor of aerosols has a very small influence (Figure 2e). Apparently, aerosols modify the level of UV spectral irradiance without a shift effect visible to the naked eye. However, even if the eye cannot distinguish a shift in the UV spectrum as a result of the action of aerosols on solar radiation, the existence of this shift is anticipated by the nonlinear extinction of spectral solar radiation by aerosols. The proposed spectral indices have the ability to measure the deviation of the spectrum towards being redder or bluer (Section 3.3). Figure 2 is mainly intended to provide more understanding of the variations in the spectral indices with the modification of atmospheric parameters.

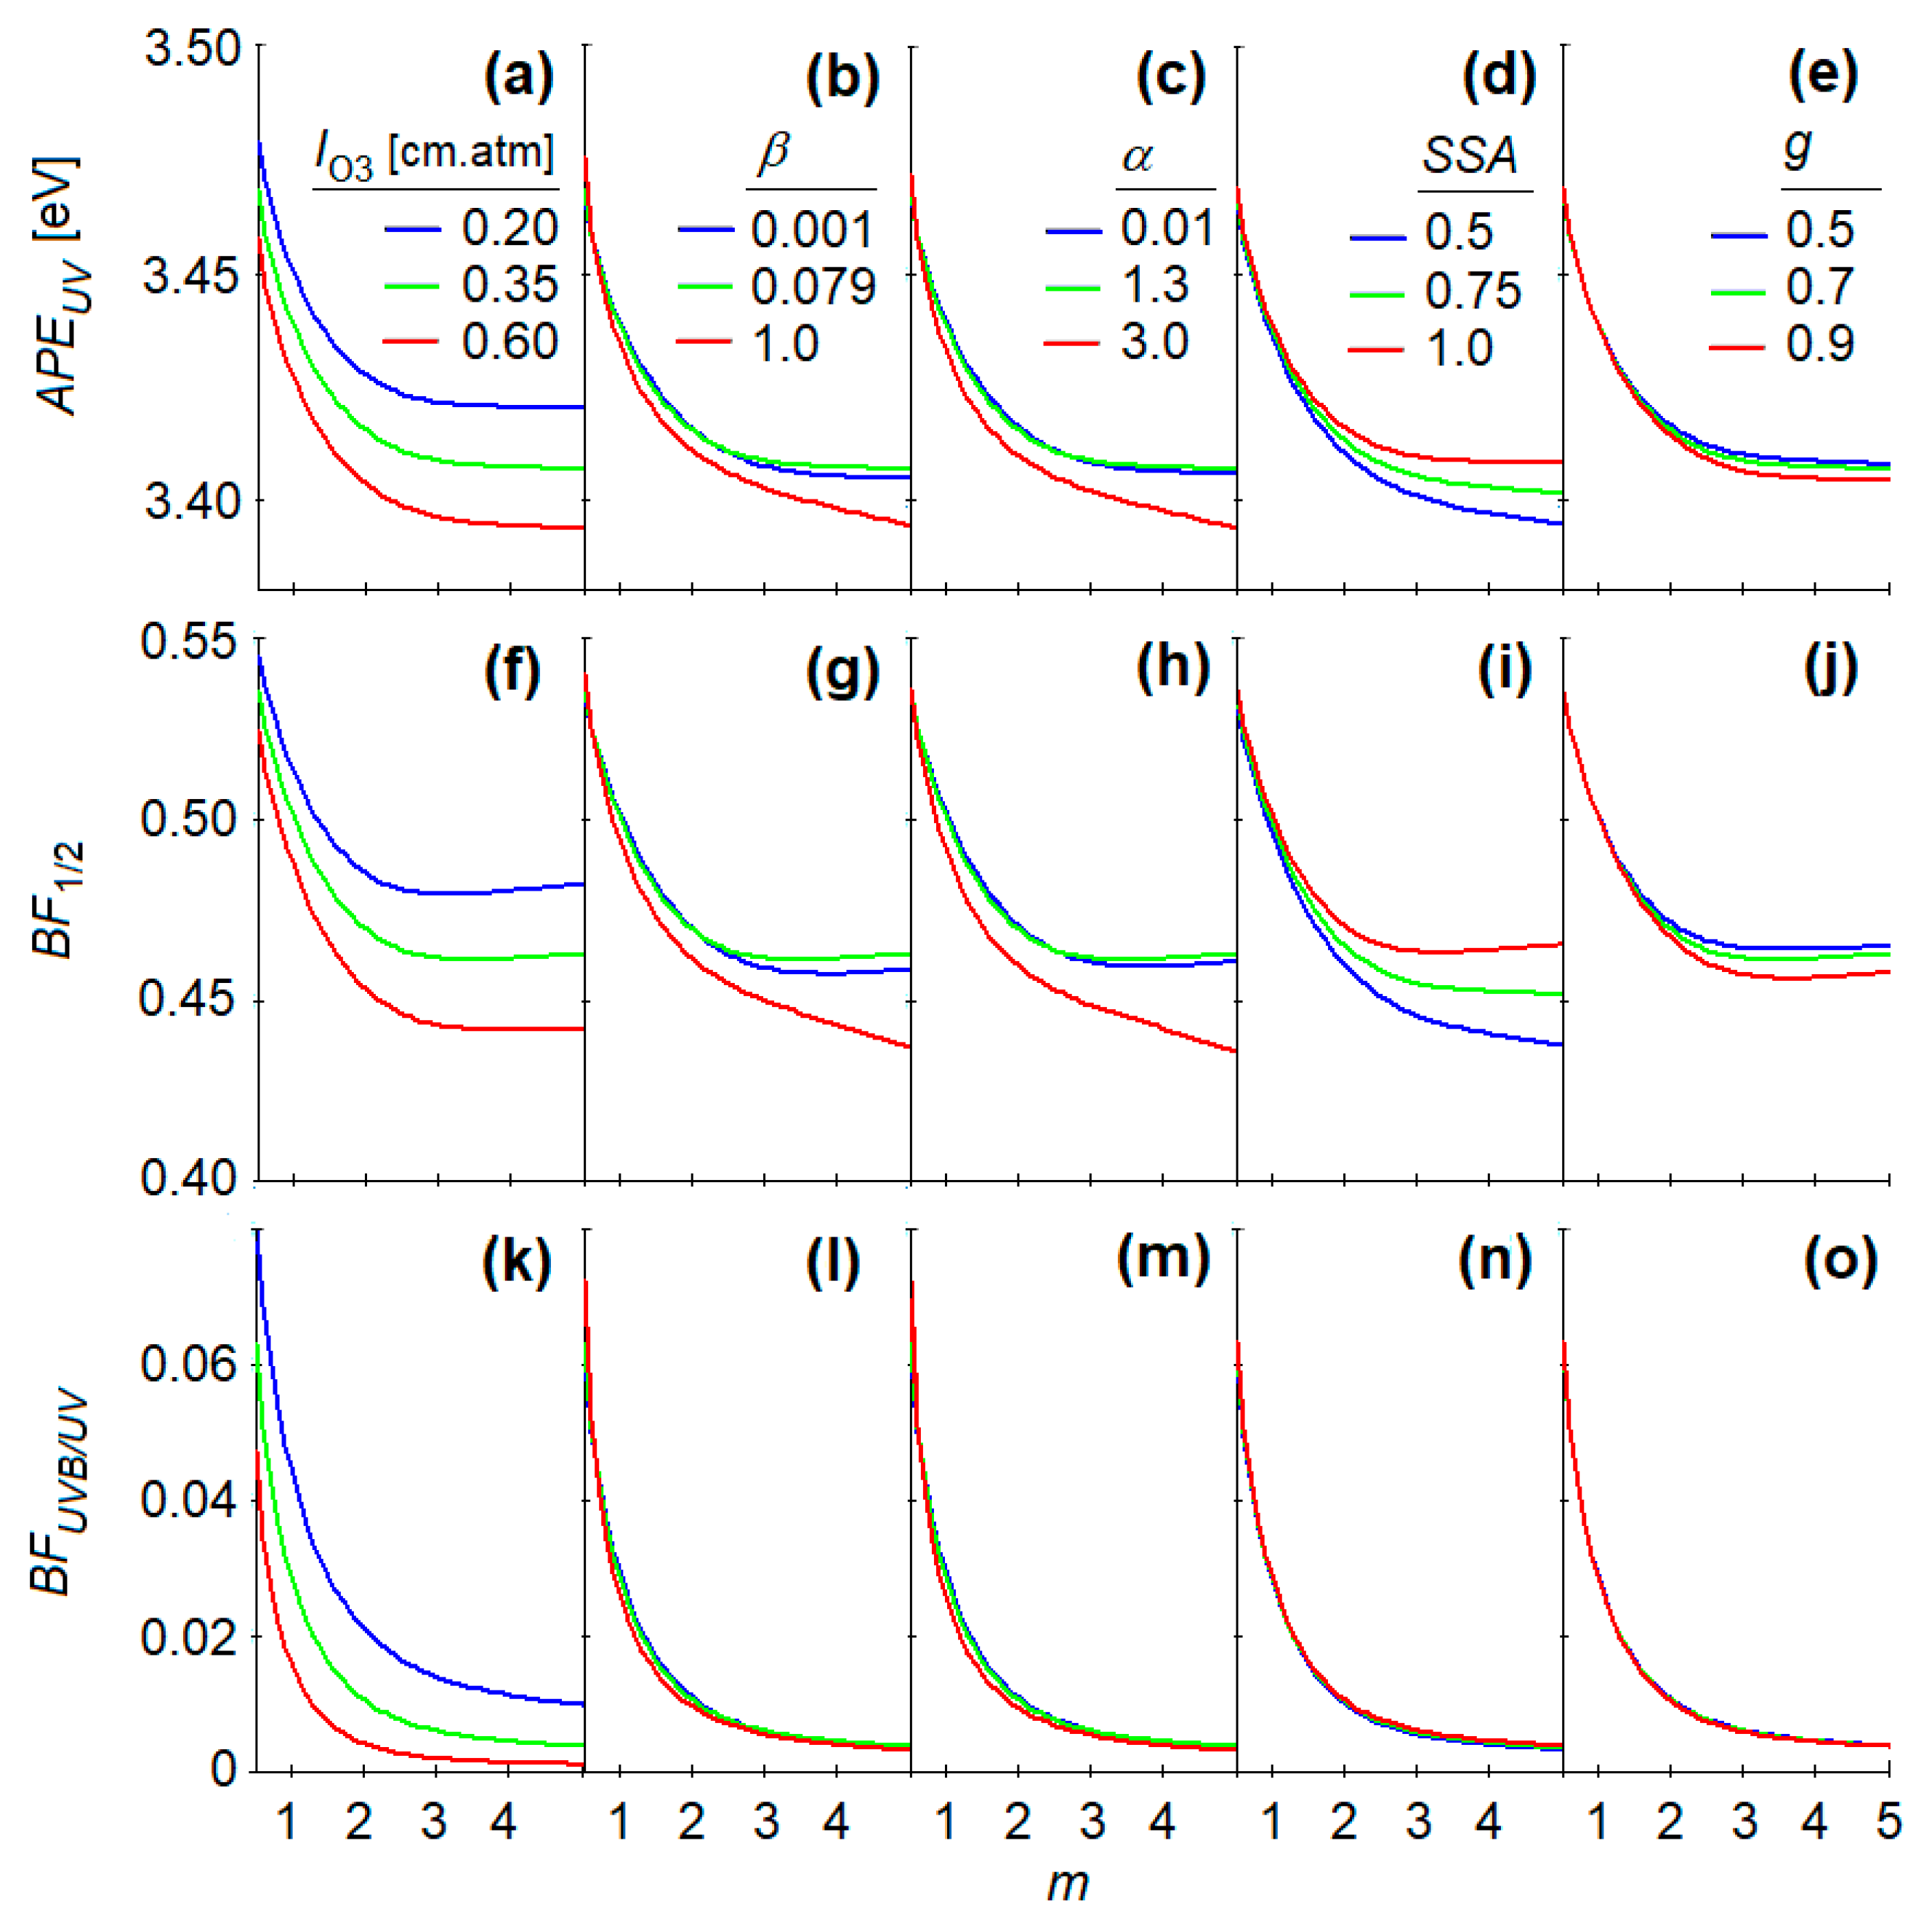
3.3. Sensitivity Analysis

The sensitivity of the spectral indices was evaluated in relation to the changes in the UV solar spectrum induced by the atmospheric attenuators, as illustrated in Figure 2. The results are summarized in Figure 3, where the variations in the spectral indices APEUV, BF1/2, and BFUVB/UV are plotted against the atmospheric optical mass m. The graphs capture the individual effects of the atmospheric parameters on each spectral index. The values of the spectral indices at m = 3 represent precisely the signatures of the spectra shown graphically in Figure 2. At first glance, it is noticeable that the three indices are nonlinear with respect to m. For a given atmosphere, the variations in the indices with respect to m have roughly the same shape, while the magnitudes are significantly different.
The very strong influence of ozone absorption on the UV spectrum is well captured by all three indices (Figure 3a,f,k). According to the classification of aerosols from Ref. [25], Figure 3c,h,m indicates that different types of aerosols determine different values of the indices. For a given atmospheric mass, the indices reach the highest values in the case of an atmosphere predominantly loaded with desert dust. The transition to a predominantly mixed/urban-industrial aerosol does not induce a significant change in the indices. Differently, the indices notably decrease when the aerosol resulting from biomass burning becomes predominant. Changes in the aerosol amount and properties (with a lower influence on the UV spectrum than ozone) are differently captured by the indices. While APEUV and BF1/2 vary similarly with the atmospheric mass and aerosol parameters (the frame pairs in Figure 3b–e,g–j), BFUVB/UV does not seem to distinguish the changes in the spectrum due to aerosols (Figure 3l–o).
The merit of Figure 3 is to reveal the variations in the indices with atmospheric optical mass and atmospheric parameters. The variation domains of the indices are in different orders of magnitude: 100 for APEUV, 10−1 for BF1/2, and 10−2 for BFUVB/UV. The sensitivity of each index is discussed next.
The larger the range of variation in an index, the more sensitive it is to the variation of an atmospheric parameter. To compare the indices with different ranges of variation, normalization to the mean was applied. Thus, a rough comparison of the sensitivity of the three indices can be made in terms of relative variation, defined as follows:
R E = I m a x I m i n μ
where I denotes one of the three indices APEUV, BF1/2, and BFUVB/UV. The subscripts indicate that these values are calculated at the boundaries of one of the atmospheric parameters, with the others being kept constant at the reference value. For example, if we study the sensitivity of APEUV to ozone variation, then I max m = A P E U V m , l O 3 , max , α 0 , β 0 , S S A 0 , g 0 and I min m = A P E U V m , l O 3 , min , α 0 , β 0 , S S A 0 , g 0 . µ represents the arithmetical mean of the two extreme values, i.e., μ = I min + I max / 2 .
Figure 4 illustrates, in terms of RE, the sensitivity of APEUV, BF1/2, and BFUVB/UV with respect to the atmospheric optical mass m. The graphs overall confirm the observations related to the influence of different atmospheric parameters on the UV spectrum. Whatever the index, ozone determines its largest variation, and the aerosol asymmetry factor is the smallest. By far, the lowest sensitivity is shown by APEUV. The highest sensitivity is shown by BFUVB/UV. The difference in sensitivity from one index to another is approximately one order of magnitude: 10−3 for APEUV, 10−2 for BF1/2, and 10−1 for BFUVB/UV.

3.4. Uniqueness

For a spectral index to actually represent a signature of a solar radiation spectrum, it must meet the requirement of uniqueness. Practically, this means that quasi-identical spectra (from the point of view of energy distribution) must sign with the same value as the index. Since BFUVB/UV proved to be the most sensitive index, the results of the uniqueness study are reported only for this. This study was conducted by adapting the procedure applied to evaluate the APE uniqueness in broad spectral bands [19]. The procedure developed for the UV spectral band contains the following steps:
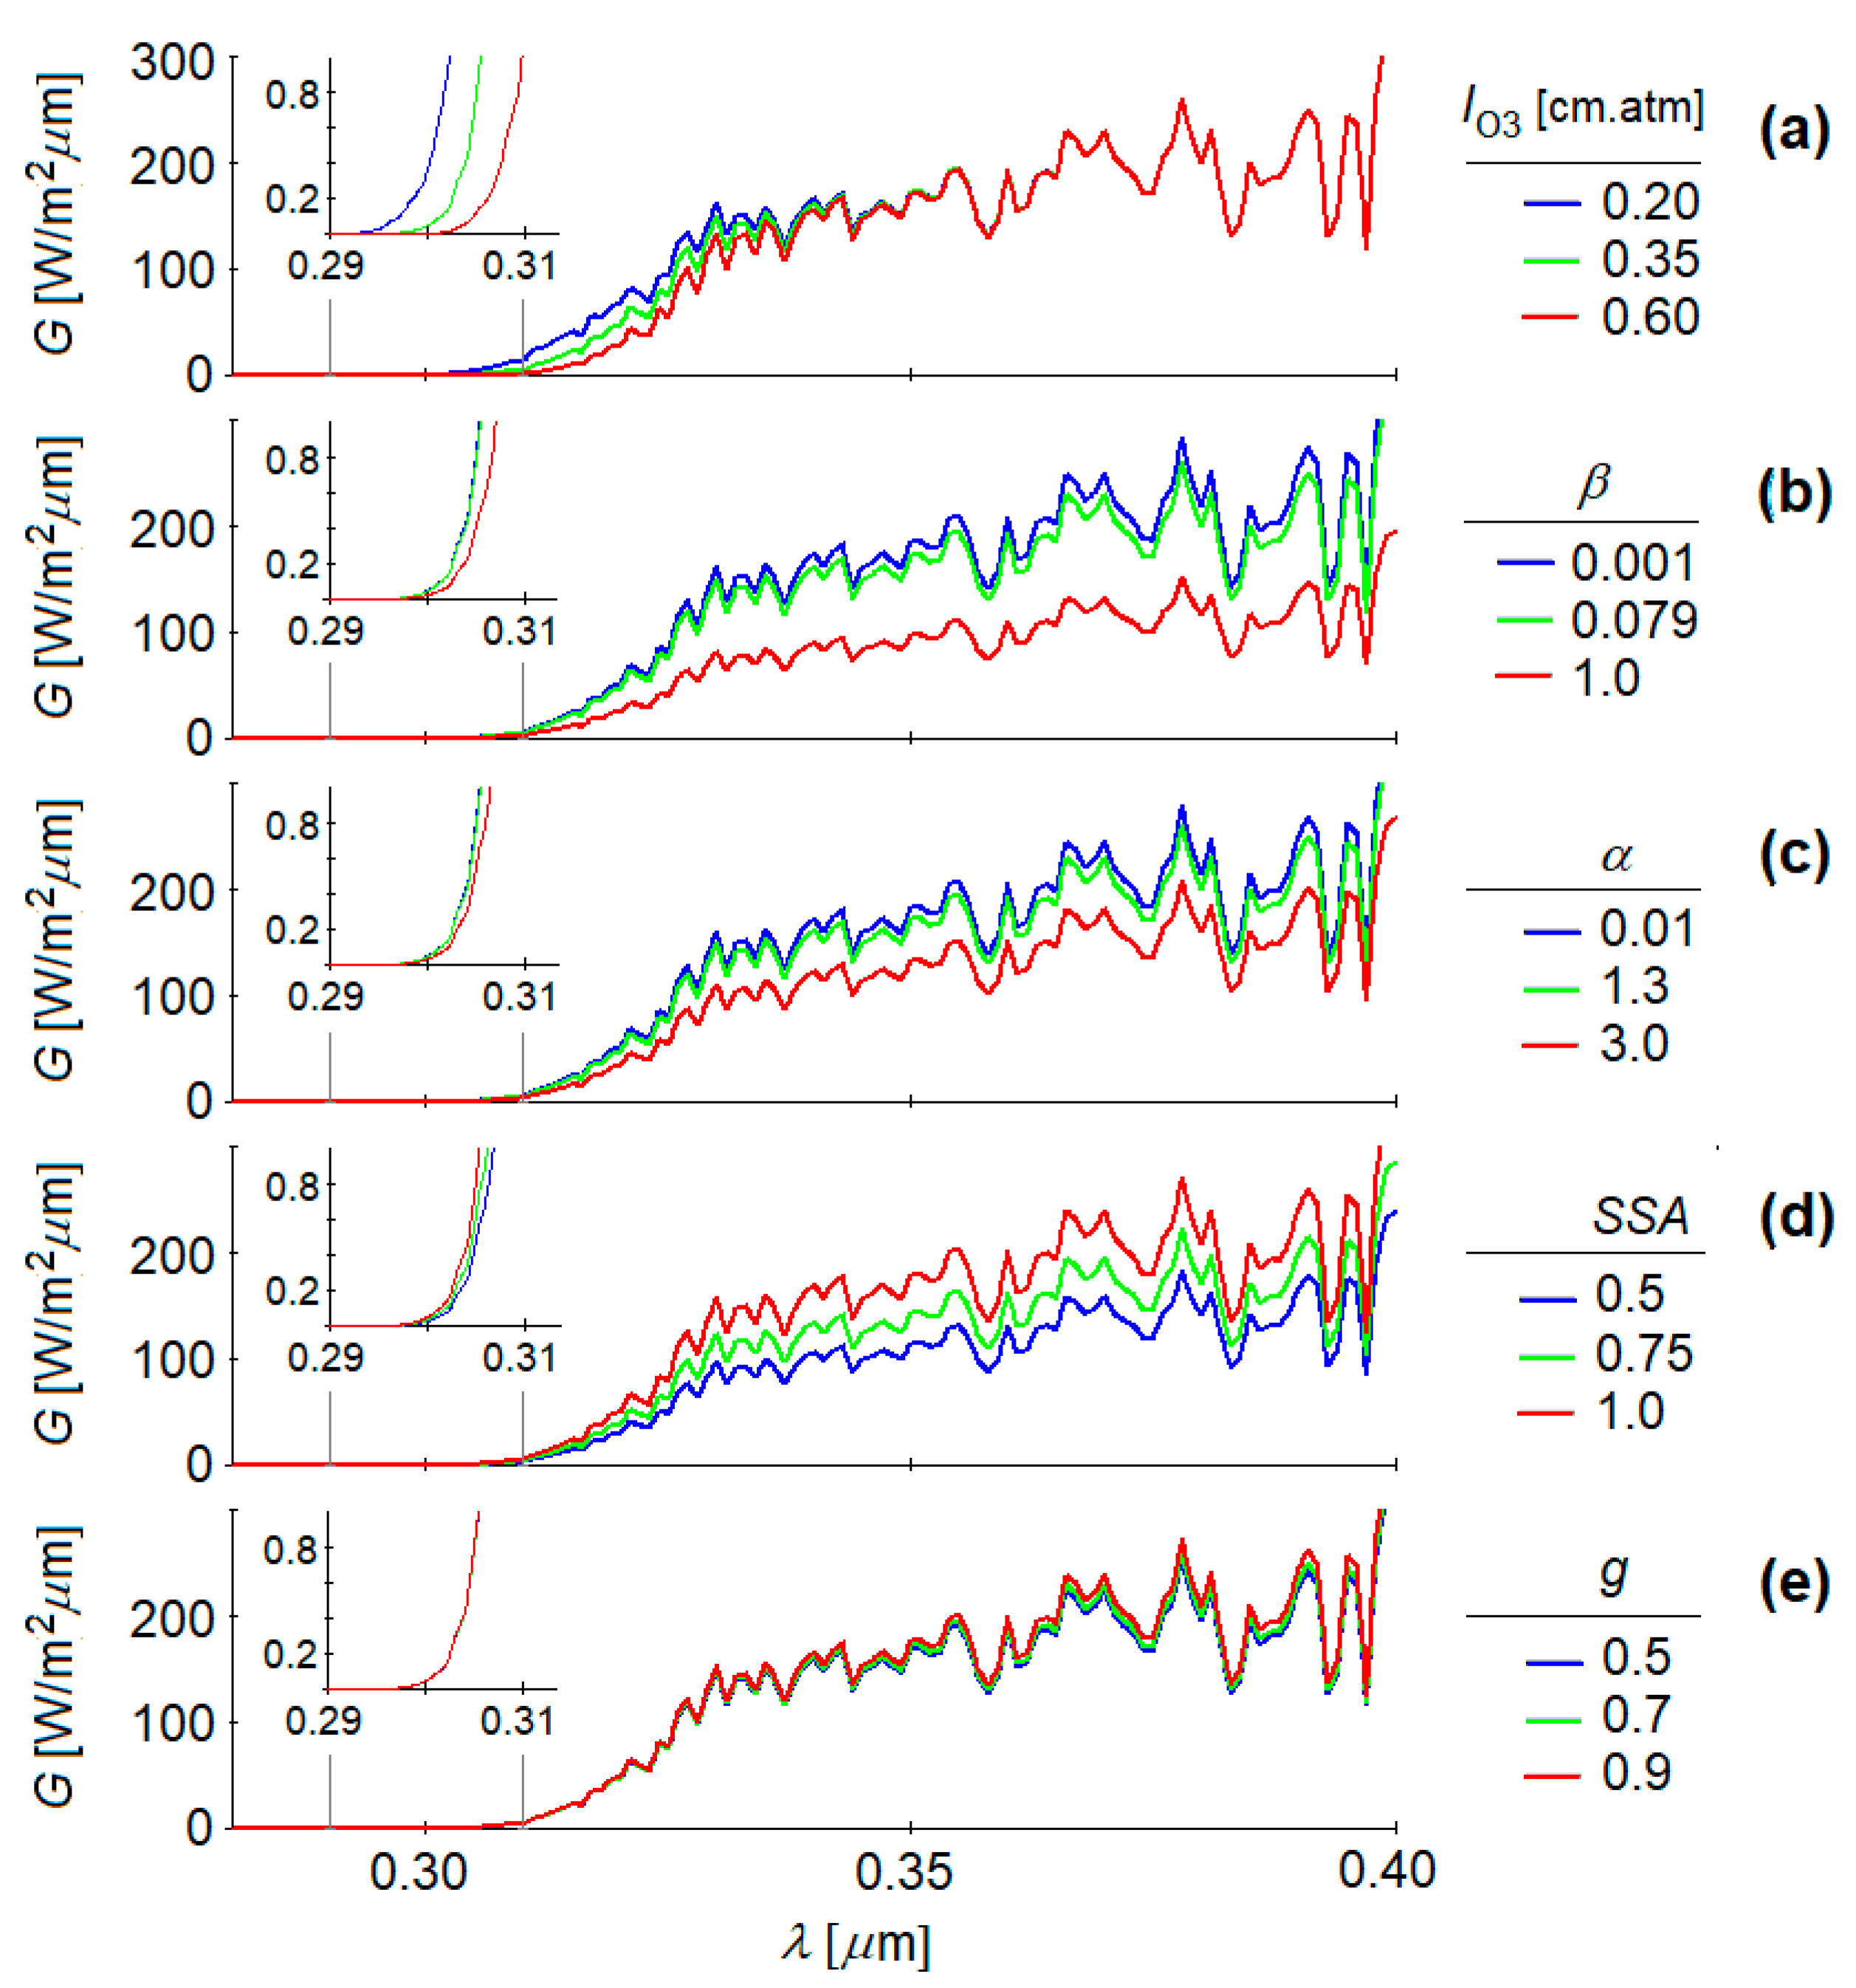
  • The spectra of solar UV radiation were generated by varying the atmospheric parameters in Equation (7), aiming to cover the atmospheric conditions found in the actual measurements. More precisely, the spectra were generated considering the following values of the atmospheric parameters: 9 values for atmospheric optical mass, from m = 1 to m = 5 with a step of 0.5; 6 for the ozone column content from lO3 = 0.3 cm·atm to lO3 = 0.55 cm·atm with a step of 0.5 cm·atm; 10 for the Ångström turbidity coefficient, from β = 0.02 to β = 0.2; 8 for the Ångström exponent, from α = 0.1 to α = 2.9 with a step of 0.4; 6 for the single scattering albedo, from SSA = 0.7 to SSA = 1 with a step of 0.05. Thus, a total of 25,920 solar UV spectra were generated.
  • The BFUVB/UV index was calculated for each spectrum, retaining only the first three decimal places. The 25,920 spectra show 34 distinct signatures between 0.000 and 0.033.
  • To evaluate how different (in terms of energy distribution) the spectra that have the same sign are, the UV band, 0.28 … 0.4 µm, was divided into 24 disjoint spectral bands, each with a 5 nm width. For each spectrum, the percentage P [%] of the total irradiance from each spectral band was calculated.
  • The spectra were distributed in 34 bins according to their signatures (from BFUVB/UV = 0.000 to BFUVB/UV = 0.033). In other words, each bin contains only spectra that have the same signature. The number of spectra differs significantly from one bin to another, decreasing with an increasing BFUVB/UV. The first bins (BFUVB/UV < 0.06) contain over 2000 spectra, the middle bins contain hundreds of spectra, and the bins at the other end (BFUVB/UV > 0.29) contain only tens of spectra.
  • Finally, for each signature (or bin), the distribution of P in each of the 24 spectral bands was analyzed.
Figure 5 illustrates comprehensively the results of the uniqueness study. For three signatures, BFUVB/UV = 0.005, BFUVB/UV = 0.015, and BFUVB/UV = 0.030, Figure 5 presents the mean percentage of the total UV irradiance in each of the 24 spectral bands. A boxplot summarizing the location, spread, and skewness of the P data in each spectral band is superimposed on the mean. At first glance, it is noticeable with the naked eye that regardless of the atmospheric conditions, the spectral distribution of P is approximately similar. As BFUVB/UV increases, the amplitude of P decreases, and the spectra become bluer (an atmosphere depleted of ozone). A visual inspection of the boxplots shows that in each spectral band, P is clustered in a narrow range around the mean. At low values of BFUVB/UV, a few outliers are visible, indicating the existence of spectra for which deviations from the mean of P occur in some spectral bands. As BFUVB/UV increases, the outliers fade, and, at high values of BFUVB/UV, the outliers disappear completely. From the analysis performed on all the clusters (the results for three of them are exemplified in Figure 5), it can be concluded that from the perspective of uniqueness, BFUVB/UV represents a reasonable signature of the solar UV spectrum.

4. Conclusions

This study explored the feasibility of using the average photon energy APE and blue fraction BF to characterize the solar UV radiation spectrum. The closing result is a new index assimilated to the signature of the solar UV radiation spectrum. This index is BFUVB/UV, defined as the fraction of the energy of solar UV radiation held by the UV-B band. The index sensitivity was evaluated in relation to the changes in the solar spectrum induced by the main atmospheric attenuators in the UV band: ozone absorption and aerosol extinction. BFUVB/UV proved to be a very sensitive index to changes in the solar radiation spectrum, significantly outperforming APEUV. BFUVB/UV can distinguish differences between two spectra that are not visible to the naked eye. A second study, conducted from the perspective of uniqueness, shows that a BFUVB/UV value roughly characterizes a single UV spectrum. Based on all the results, it can be concluded that BFUVB/UV represents a reasonable signature of the solar UV spectrum. Therefore, this work provides a new meaning and new utility to the common UV-B/UV ratio. Having as inspiration the photovoltaic field, the proposed index can be used to quantify the impact of changes in the solar radiation spectrum on the biologically effective UV irradiance.

Author Contributions

Conceptualization, A.-F.C. and M.P.; methodology, A.-F.C. and O.M.B.; software, A.-F.C. and M.P.; formal analysis, A.-F.C., O.M.B. and M.P.; investigation, A.-F.C., O.M.B. and M.P.; writing—original draft preparation A.-F.C., O.M.B. and M.P.; writing—review and editing, A.-F.C., O.M.B. and M.P.; supervision, M.P. All authors have read and agreed to the published version of the manuscript.

Funding

This research received no external funding.

Institutional Review Board Statement

Not applicable.

Informed Consent Statement

Not applicable.

Data Availability Statement

The original contributions presented in this study are included in the article. Further inquiries can be directed to the corresponding author.

Conflicts of Interest

The authors declare no conflicts of interest.

References

  1. Cottin, H.; Kotler, J.M.; Billi, D.; Cockell, C.; Demets, R.; Ehrenfreund, P.; Elsaesser, A.; d’Hendecourt, L.; van Loon, J.J.W.A.; Martins, Z.; et al. Space as a Tool for Astrobiology: Review and Recommendations for Experimentations in Earth Orbit and Beyond. Space Sci. Rev. 2017, 209, 83–181. [Google Scholar] [CrossRef]
  2. Ahmad, S.I. (Ed.) Ultraviolet Light in Human Health, Diseases and Environment; Springer: Cham, Switzerland, 2017. [Google Scholar] [CrossRef]
  3. Ballare, C.L.; Caldwell, M.M.; Flint, S.D.; Robinson, S.A.; Bornman, J.F. Effects of solar ultraviolet radiation on terrestrial ecosystems. Patterns, mechanisms, and interactions with climate change. Photochem. Photobiol. Sci. 2011, 10, 226–241. [Google Scholar] [CrossRef] [PubMed]
  4. Tang, X.; Yang, T.; Yu, D.; Xiong, H.; Zhang, S. Current insights and future perspectives of ultraviolet radiation (UV) exposure: Friends and foes to the skin and beyond the skin. Environ. Int. 2024, 185, 108535. [Google Scholar] [CrossRef] [PubMed]
  5. Pitts, D.G.; Cullen, A.P.; Hacker, P.D. Ocular effects of ultraviolet radiation from 295 to 365 nm. Investig. Ophthalmol. Vis. Sci. 1977, 16, 932–939. [Google Scholar]
  6. Farr, P.M.; Diffey, B.L. The erythemal response of human skin to ultraviolet radiation. Brit. J. Dermatol. 1985, 113, 65–76. [Google Scholar] [CrossRef]
  7. McKinlay, A.F.; Diffey, B.L. A reference spectrum for ultraviolet induced erythema in human skin. CIE J. 1987, 6, 17–22. [Google Scholar]
  8. Webb, A.R.; Slaper, H.; Koepke, P.; Schmalwieser, A.W. Know Your Standard: Clarifying the CIE Erythema Action Spectrum. Photochem. Photobiol. 2011, 87, 483–486. [Google Scholar] [CrossRef]
  9. Chubarova, N.E.; Pastukhova, A.S.; Zhdanova, E.Y.; Volpert, E.V.; Smyshlyaev, S.P.; Galin, V.Y. Effects of Ozone and Clouds on Temporal Variability of Surface UV Radiation and UV Resources over Northern Eurasia Derived from Measurements and Modeling. Atmosphere 2020, 11, 59. [Google Scholar] [CrossRef]
  10. Bencherif, H.; Toihir, A.M.; Mbatha, N.; Sivakumar, V.; du Preez, D.J.; Bègue, N.; Coetzee, G. Ozone Variability and Trend Estimates from 20-Years of Ground-Based and Satellite Observations at Irene Station, South Africa. Atmosphere 2020, 11, 1216. [Google Scholar] [CrossRef]
  11. Zhao, S.; Xin, H.; Wu, S.; Sun, Y.; Hu, B. Attenuation of Ultraviolet Radiation by Aerosols and Clouds in Beijing Area in 2005–2020. Atmosphere 2024, 15, 311. [Google Scholar] [CrossRef]
  12. Paulescu, M.; Stefu, N.; Tulcan-Paulescu, E.; Calinoiu, D.; Neculae, A.; Gravila, P. UV solar irradiance from broadband radiation and other meteorological data. Atmos. Res. 2010, 96, 141–148. [Google Scholar] [CrossRef]
  13. Habte, A.; Sengupta, M.; Gueymard, C.A.; Narasappa, R.; Rosseler, O.; Burns, D.M. Estimating Ultraviolet Radiation from Global Horizontal Irradiance. IEEE J. Photovolt. 2019, 9, 139–146. [Google Scholar] [CrossRef]
  14. Paulescu, E.; Stefu, N.; Gravila, P.; Boata, R.S.; Pop, N.; Paulescu, M. Procedure of embedding biological action functions into the atmospheric transmittance. Theor. Appl. Climatol. 2012, 109, 323–332. [Google Scholar] [CrossRef]
  15. Malinovic, S.; Mihailovic, D.T.; Kapor, D.V.; Mijatovic, Z.; Arsenic, I. NEOPLANTA: A Short Description of the First Serbian UV Index Model. J. Appl. Meteorol. Climatol. 2006, 45, 1171–1177. [Google Scholar] [CrossRef]
  16. Gueymard, C.A. Assessment of the global applicability of three leading indices that characterize the spectral distribution of solar irradiance impacting various photovoltaic technologies. Energy Convers. Manag. 2023, 295, 117602. [Google Scholar] [CrossRef]
  17. Daxini, R.; Wu, Y. Review of methods to account for the solar spectral influence on photovoltaic device performance. Energy 2024, 286, 129461. [Google Scholar] [CrossRef]
  18. Chantana, J.; Imai, Y.; Kawano, Y.; Hishikawa, Y.; Nishioka, K.; Minemoto, T. Impact of average photon energy on spectral gain and loss of various-type PV technologies at different locations. Renew. Energy 2020, 145, 1317–1324. [Google Scholar] [CrossRef]
  19. Minemoto, T.; Nakada, Y.; Takahashi, H.; Takakura, H. Uniqueness verification of solar spectrum index of average photon energy for evaluating outdoor performance of photovoltaic modules Sol. Energy 2009, 83, 1294. [Google Scholar]
  20. Nofuentes, G.; Gueymard, C.A.; Aguilera, J.; Perez-Godoy, M.D.; Charte, F. Is the average photon energy a unique characteristic of the spectral distribution of global irradiance? Sol. Energy 2017, 149, 32–43. [Google Scholar] [CrossRef]
  21. Kollias, N.; Ruvolo, E., Jr.; Sayre, R.M. The Value of the Ratio of UVA to UVB in Sunlight. Photochem. Photobiol. 2011, 87, 1474–1475. [Google Scholar] [CrossRef]
  22. Gueymard, C.A. SMARTS2 A Simple Model of the Atmospheric Radiative Transfer of Sunshine: Algorithms and Performance Assessment. Florida Solar Energy Center Report. 1995; FSEC-PF-270-95. Available online: https://www.nrel.gov/grid/solar-resource/smarts.html (accessed on 1 March 2025).
  23. Gueymard, C.A. The SMARTS spectral irradiance model after 25 years: New developments and validation of reference spectra. Sol. Energy 2019, 187, 233–253. [Google Scholar] [CrossRef]
  24. Kasten, F.; Young, A. Revised optical air mass tables and approximation formula. Appl. Opt. 1989, 28, 4735–4738. [Google Scholar] [PubMed]
  25. Blaga, R.; Calinoiu, D.; Paulescu, M. A one-parameter family of clear-sky solar irradiance models adapted for different aerosol types. J. Renew. Sustain. Energy 2021, 13, 023701. [Google Scholar]
Figure 1. (a) Erythemal action function. The graph was built with data retrieved from [8]. (b) Spectral UV solar irradiance G(λ) (lines G1 and G2) and the biological effective solar UV irradiance Ge(λ) (solid bars Ge1 and Ge2). The two spectra, G1 and G2, were generated considering different atmospheric conditions: (blue graphs) a small amount of ozone and a low loading of the atmosphere with fine aerosols, and (red graphs) a large amount of ozone and the same low loading of the atmosphere with aerosols, but with coarse aerosols.
Atmosphere 16 00427 g001
Figure 2. Synthetic UV spectra generated with SMARTS2, considering an atmospheric optical mass m = 3. The curve parameters are: (a) ozone column content lO3, (b) Ångström turbidity coefficient β, (c) Ångström exponent α, (d) single scattering albedo SSA, and (e) aerosol asymmetry factor g. The other atmospheric parameters were kept to the reference values. The inner windows focus on the wavelength range 0.29–0.31 µm.
Atmosphere 16 00427 g002
Figure 3. Variations in the UV spectral indices with respect to the atmospheric optical mass: (ae) average photon energy APEUV, (fj) blue fraction BF1/2 with λ M = 0.3637 μ m in Equation (2), and (ko) blue fraction BFUVB/UV with λ M = 0.315 μ m in Equation (2). The curve parameters are: (a,f,k) ozone column content lO3, (b,g,l) Ångström turbidity coefficient β, (c,h,m) Ångström exponent α, (d,i,n) single scattering albedo SSA, and (e,j,o) aerosol asymmetry factor g. The other atmospheric parameters were kept to the reference values.
Atmosphere 16 00427 g003
Figure 4. Relative variation RE of the three indices (a) APEUV, (b) BF1/2, and (c) BFUVB/UV with respect to the atmospheric optical mass m. The curve parameters are as follows: ozone column content lO3, Ångström turbidity coefficient β, Ångström exponent α, single scattering albedo SSA, and aerosol asymmetry factor g.
Atmosphere 16 00427 g004
Figure 5. Mean percentage P[%] of the total UV irradiance evaluated in disjoint spectral bands of a 5 nm width each (solid bars). At the top of each bar, a boxplot indicates the spread of the percentages in each spectral band. The graphs are built based on spectra characterized by the following values of BFUVB/UV: (a) 0.005, (b) 0.015, and (c) 0.030.
Atmosphere 16 00427 g005
Disclaimer/Publisher’s Note: The statements, opinions and data contained in all publications are solely those of the individual author(s) and contributor(s) and not of MDPI and/or the editor(s). MDPI and/or the editor(s) disclaim responsibility for any injury to people or property resulting from any ideas, methods, instructions or products referred to in the content.

