Abstract
Festivals are significant markers of cultural heritage and community traditions. Nevertheless, every year, significant increases in pollution levels are recorded during celebratory events, due to the overuse of firecrackers. This study evaluated gaseous and particulate matter (PM) concentrations using a gas and particulate sampler, alongside noise levels measured by a sound level meter, during the pre-to-post-Diwali period of 2023 and 2024 in Malda, India, and PM concentrations in Warsaw, Poland in 2024, using a DustAir dust meter. The results indicated that during Diwali, the concentrations of PM2.5 and PM1 exceeded the standard set by the World Health Organization, while gaseous pollutants remained within acceptable limits. Since no standards set for PM1 exist, PM2.5 criteria were utilized as a benchmark. Additionally, on New Year’s Eve in Warsaw, concentrations of PM10, PM2.5, and PM1 surpassed the standard around midnight, while gaseous pollutants remained within the standard range. An elemental analysis revealed 13 elements in Diwali PM samples, with toxic metals like arsenic and cadmium more prevalent in PM1. The risk of carcinogenic and non-carcinogenic effects through ingestion was higher for children compared to adults. The findings of this study could potentially raise awareness among researchers and policymakers, prompting them to develop sustainable substitutes for firecrackers and sparklers.
1. Introduction
Festivals are significant events that commemorate cultural traditions and heritage, each with distinctive cultural significance and traditions that bring people together and foster a sense of joy [1]. These events are often celebrated by vibrant displays of fireworks and lights, creating an atmosphere of celebration and excitement. However, beyond the vibrant festive celebrations lies a pressing environmental concern: anthropogenic activities during festival celebrations are a key driver of short-term air pollution episodes, degrading air quality and posing a significant threat for the environment and human health [2]. One such festival is Diwali, the festival of lights, commemorated with much enthusiasm across India. Diwali epitomizes the victory of light over darkness, overshadows traditional and religious boundaries, and is celebrated with candles, lights, firecrackers, and fireworks displays [3]. The bursting of firecrackers is most prevalent throughout Diwali and continues over the following days (post Diwali) [4]. Another such festive event is the New Year celebrations, marking the shift from the old year to the new year and celebrated across the globe, which illuminates the sky with firecrackers and fireworks displays [5].
Firecrackers are combustible products wrapped in cardboard/paper with a plastic casing designed to produce auditory and visual effects during celebrations [6]. These explosive items are composed of a meticulously orchestrated blend of oxidizing agents, fuel, coloring agents/colorants, and binders [3]. The oxidizing agents, such as chlorates, perchlorates, and nitrates, supply the requisite oxygen necessary for the firecracker to ignite and facilitate the explosion [1,3]; however, perchlorates can negatively impact drinking water, as well as surface and groundwater quality, and thus indirectly affect human health [7,8]. Fuels like charcoal and sulfur serve to sustain the fire; the mixture of fuel and oxidizers is highly explosive when ignited. The primary component of fireworks is gunpowder, which is a blend of charcoal (15%), sulfur (10%), potassium nitrate (5%), and small percentages of toxic elements, such as barium, magnesium, manganese, copper, chromium, strontium, and titanium [3,9,10]. The binder holds the mixture in place until it burns out, while colorants produce captivating and vibrant colors and sparkles [3]. The bright yellow color is produced by sodium compounds, while carbon or iron produces fiery orange hues. Strontium carbonates or copper compounds generate blue and red colors, and titanium, aluminum, and magnesium compounds emit a sparkling white color. Barium salts, including barium chlorate, barium nitrate, and barium monochloride, generate a bright green color [11]. However, some colorants, such as barium ion and soluble barium compounds, have been prohibited due to their toxic and detrimental effects on human health, including respiratory tract irritation, skin allergies, more severe respiratory, cardiovascular, neurological, developmental problems, and even carcinogenic effects [12].
The bursting and burning of firecracker propellants, such as black powder and modern pyrotechnic formulations, release a variety of hazardous air pollutants, such as gaseous pollutants, including nitrogen oxides (NOx), carbon monoxide (CO), carbon dioxide (CO2), and sulfur dioxide (SO2), and a range of particulate matter (PM), with aerodynamic diameters less than 10 μm (coarse PM/PM10), less than 2.5 μm (fine PM/PM2.5), and less than 1 μm (ultrafine PM/PM1) [13]. In addition, the heat generated from the ignition and combustion of firecrackers facilitates the thermal activation of carboxylic acid derivatives [14]. These accumulated carboxylic acids subsequently undergo photochemical reactions, leading to the formation of secondary organic aerosol (SOA) [15,16]. The volatility characteristics of carboxylic acids are critical to assess the atmospheric fate and transport of SOA [17], as volatility influences their partitioning between the gas and particle phases, thereby influencing air quality, visibility, and human health [18,19,20]. Collectively, the excessive use of firecrackers during the festival have turned it into a short-term pollution-inducing event, detrimental to local air quality and causing deleterious health consequences [1].
Exposure to elevated PM and PM-associated trace metals concentrations has been linked to a range of health problems, including respiratory and cardiovascular disease [9,21,22,23]. A sudden surge in PM concentration can cause a cascade of detrimental health effects, including asthma, allergies, cardiovascular and lung diseases, and even the likelihood of cancer [24,25]. Moreover, PM’s physical and chemical properties can change during firework displays, resulting in a substantial increase in detrimental health effects during firework activity than in non-firecracker-exploding periods [11,24]. Both short-term and long-term exposure to PM has been associated with heightened morbidity and mortality rates [26]. Short-term exposure, which may last from few hours to several days, has been associated with increased hospitalizations, as well as mortality and morbidity related to respiratory and cardiovascular diseases [27,28]. Li et al. [29] reported a significant correlation between short-term exposure to a 10- μg m−3 increase in ambient PM2.5 and subsequent increases in hospitalizations and mortality due to chronic obstructive pulmonary diseases (COPDs) [29]. In vitro studies have shown that exposure to PM leads to both genotoxic and cytotoxic effects on living organisms [30,31]. Acute exposure to PM is associated with cellular damages, reactive oxygen species (ROS) inductions, inflammatory responses, mutations, DNA damage, and even cell death [32,33]. PM-induced oxidative stress triggers inflammation and cytotoxicity through complex mechanisms depending on the size and chemical composition of PM [33]. A study in Nanjing, China reported that the toxicity of PM2.5 is greater than that of PM10; however, the capacity of PM10 to induce pro-inflammatory cytokines is comparable to that of PM2.5 [34]. The genotoxicity of PM is also influenced by particle size and chemical composition. A study conducted in Manila, Philippines, revealed that size-segregated PM demonstrated distinct genotoxic effects; in particular, PM2.5 was found to be more genotoxic than PM1 [35]. Another study in Kuala Lumpur, Malaysia, reported that the genotoxicity of PM0.1 was higher than PM1, underscoring the significant impact of size-related variations in PM on the genotoxic effects [36]. Additionally, fireworks explosions produce high noise levels that can cause annoyance, stress, and even partial and complete deafness in extreme cases [25]. Children, aged persons, and people with pre-existing medical problems are particularly more susceptible to the firework-associated health effects [13].
This study aims to evaluate ambient air quality during Diwali celebrations in Malda, West Bengal, India, and New Year’s Eve celebrations in Warsaw, Poland, Europe. The study further examines the noise level, elemental characterization, and associated carcinogenic and non-carcinogenic risks during Diwali. This research will provide insights into the impact of festive celebrations on air quality; this study aims to provide information for designing and implementing public policies and mitigation strategies to reduce the adverse effects of PM pollution during these events in different environments.
2. Materials and Methods
The study was carried out for the two phases in two distinct locations, i.e., pre-to-post-Diwali celebrations in Malda, West Bengal, India, in 2023 and 2024, and New Year celebrations during Poland in 2024.
2.1. Ambient Air-Monitoring Location, Schedule, and Meteorological Data
2.1.1. Diwali Celebrations in Malda, West Bengal, India (2023 and 2024)
The monitoring of PM and gaseous pollutants was conducted for 24 h (10 AM to 10 AM the following day) with 24 h intervals between successive monitoring sessions, excluding Diwali 2024 (36 h monitoring). In 2023, Diwali was celebrated on 12 November. Data collection spanned four days, starting from 8 to 9 November, which was recorded as the background or pre Diwali with no firecracker activity. Diwali monitoring was conducted on 12–13 November, followed by post-Diwali 1 on 14–15 November, and concluded with post-Diwali 2 monitoring from 16 to 17 November. In 2024, Diwali was celebrated over two days, from 31st October–1st November, due to the alignment of the lunar calendar. Pre-Diwali monitoring was conducted on 27–28 October, followed by Diwali monitoring on 31 October–2 November (from 5 PM to 5 AM, total 36 h). Post-Diwali 1 monitoring was conducted on 3–4 November and post-Diwali 2 on 5–6 November. Since pollutant concentrations reached to background levels by post-Diwali 2, post-Diwali 3 data were not included further.
During the pre-to-post-Diwali period, the ambient air-monitoring location was located in the residential hub of English Bazar, the municipal town of the Malda district (Figure 1a); the Diwali celebration is observed in Malda, celebrated with great eagerness, and is marked by a large-scale burning of firecrackers and bangers, which is particularly prevalent on the festive day and following days. The English Bazar municipality serves as the district headquarters of Malda, the central northern district of West Bengal, and the northeastern region of India [37]. According to the census report (2011), the city has a population of approximately four million, covering an area of 3733 square kilometers, with an average population density of 1069 persons per square kilometer [38]. This region is undergoing intensive pressure due to booming populations, rural-to-urban shifting, massive urban built-up areas, increasing synthetic/impermeable building materials, and a surge in energy consumption. The English Bazar has now become the sixth most prosperous conurbation of West Bengal [39]. Additionally, the district is home to one state street (SH-10) and two national streets (NH34 and NH81) with higher vehicular activities [40]. The emission from these vehicles, compounded by the lack of vehicle regularization, significantly contribute to the atmospheric pollution of the area. The interplay of urbanization, industrial activities, and vehicular emissions adversely impacts the ambient air quality in the region. Furthermore, the coastal sea-salt spray from the nearby Bay of Bengal also exacerbates the pollution levels here [41]. The monitoring site was approximately 100 m from the national highway (NH-34), which endures high-density traffic. In addition, the railway track, next to NH-34, is also a minefield of pollution in this area. The monitoring was carried out over the pre-to-post-Diwali period (pre Diwali, Diwali, post-Diwali 1, post-Diwali 2).
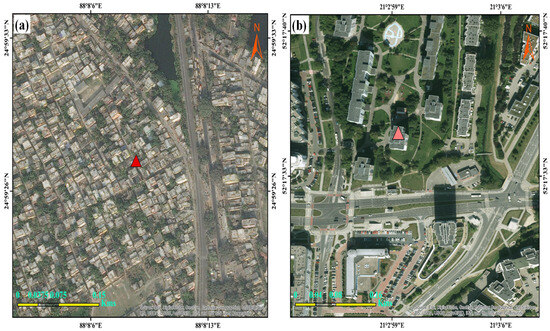
Figure 1.
The map illustrates the study areas, denoted by triangles (∆). The locations included are: (a) English Bazar, Malda, and (b) Warsaw, Poland. The satellite images were obtained using Google Maps; Google. They are available online at https://www.google.com/maps (accessed on 11 January 2025).
Three gaseous pollutants (NO2, SO2, and O3) were monitored by the ‘gaseous pollutants sampler’ (APM 433, Envirotech Instruments, Pvt. Ltd., New Delhi, India) with an error rate of ±10%. The gaseous sampler operated at a flow rate of 1 L per minute (LPM). NO2, SO2, and O3 were monitored according to the modified method of Jacob and Hochheiser [42], West and Gaeke [43], and Byers and Saltzman [44], respectively. Additionally, PM2.5 and PM1 were monitored by a ‘fine particulate sampler PM2.5-10’ (GTI-375, Greintech Instruments, New Delhi, India) with 16.67 LPM flow rate and a ‘PM1 sampler’ (APM 577, Envirotech Instruments, Pvt. Ltd., New Delhi, India) 10 LPM flow rate, respectively, according to the guideline of the Central Pollution Control Board (CPCB, GOI) [45,46]. The PM1 sampler, designed by IIT Kanpur, has a lower detection limit of 2 μg m−3 and an upper detection limit of 500 μg m−3, with an error rate of ±10%, while the fine particulate sampler PM2.5-10 has a lower detection limit of 15 μg m−3 and an upper detection limit of 1000 μg m−3, with an error rate of ±5%. In compliance with the guidelines set forth by the CPCB and the ‘United States Environmental Protection Agency’ (US EPA), samplers were placed on a wooden platform on the terrace, ~10 m above the ground to ensure optimal air circulation and suitable distance from direct pollution source, high-rise buildings, and certain trees that can release pollen [41]. The PM2.5 and PM1 fractions were collected using polytetrafluoroethylene (PTFE) filters (diameter: 46.2 mm) (Whatman, Maidstone, UK). Each year, a total of eight filters were employed: four for PM1 and four for PM2.5, corresponding to the pre-Diwali, Diwali, post-Diwali 1, and post-Diwali 2 periods. All PTFE filters were measured prior to and after monitoring to evaluate the concentration of PM pollutants.
The concentration of PM was calculated using the following formula, which measures the amount of PM in micrograms per cubic meter of air.
C = ((WF − WI) × Conversion factor)/V
C = concentration of particulate matter (μg m−3); WF = final weight of filter paper in gm; WI = initial weight of filter paper in gm; conversion factor (from gm to μg) = 106; V = total volume of air passed through sampler (m3) = (final DGM—initial DGM).
2.1.2. Quality Assurance and Quality Control
For the quality assurance, the pre-conditioning and post-conditioning of filters are conducted with utmost care. PM2.5 and PM1 particles were collected using PTFE filters due to their inert properties, which confer minimal organic impurities and low moisture-absorbing capacity [47]. To ensure proper equilibration and minimum moisture content, the filters were maintained in a controlled environment at 25 ± 2 °C and 45 ± 5% relative humidity for a duration of 24 h prior to their use. To safeguard the filter paper from contamination and exposure to open laboratory environments, the filters were placed in sample carriers for transport to the sampling site. To minimize potential effect of body moisture, non-serrated forceps were utilized for handling the filters, and these were thoroughly cleaned with ethanol before and after each use [41]. Ater sampling, the filters are kept in same controlled environment for 24 h. The weights of the filter papers were recorded both before and after sampling, utilizing a micro-electronic balance (Sartorius, Goettingen, Germany) with a sensitivity of 0.1 mg. To minimize potential errors, the initial and final weights were re-weighed multiple times to ensure repeatability and to eliminate any uncertainties. Furthermore, consistent calibration of the samplers is critical for maintaining the integrity of the samplers. The calibration of the samplers was conducted directly by the manufacturer, Envirotech Instruments, New Delhi, India before the sampling.
2.1.3. New Year Celebrations in Warsaw, Poland, Europe (2024)
During the New Year celebrations on 31st December–1st January, 2023–2024, the PM monitoring location was located in the residential hub of Warsaw (Figure 1b), the largest city in Poland and the 7th most populous city in European agglomerations, with almost 1.9 million residents [48]. Warsaw’s urban landscape is defined by a robust industrial sector that fuels economic growth and an extensive transportation network, and high-rise buildings. Collectively, these elements complicate the air-quality scenario, resulting in heightened levels of pollution that persist even during periods of festive celebrations [49,50]. Amidst the celebratory atmosphere, characterized by the dazzling fireworks, the city faced significant challenges with elevated levels of air pollutants. This concerning trend is consistent with the environmental issues encountered in other major European urban centers.
Measurements of PM concentrations were conducted using the DustAir dust meter (EMAG-SERWIS, Katowice, Poland), a portable monitoring device developed by the Central Mining Institute (Główny Instytut Górniczy) and manufactured by EMAG-SERWIS. PM measurements were conducted outside a selected apartment in a residential area of Warsaw to provide a comprehensive understanding of air-quality dynamics in urban environments. The device is capable of measuring three PM fractions: PM10, PM2.5, and PM1, providing real-time air-quality data through an integrated sensor system. The DustAir dust meter utilizes laser-scattering technology to determine the mass concentration of airborne particles, ensuring high sensitivity and accuracy in data collection. Sensor operates with a lower detection limit of 2 μg m−3 and an upper detection limit of 800 μg m−3, effectively measuring airborne particles in the size ranges of PM1 (0.1–1.0 μm), PM2.5 (0.3–2.5 μm), and PM10 (1.0–10 μm) with a measurement error of ±10% for PM1 and ±5% for PM2.5 and PM10. The device was configured to record PM concentrations at regular intervals, and measurements were stored in the internal memory for subsequent analysis. To ensure the reliability of the measurements, the DustAir device was previously calibrated in a controlled laboratory environment and cross-validated with other reference-grade air-quality measurement instruments to ensure accuracy before deployment. The DustAir device was operated in compliance with recommended environmental conditions, avoiding extreme temperatures and high humidity levels that could affect sensor performance. Data on gaseous pollutants were obtained from Główny Inspektorat Ochrony Środowiska “https://powietrze.gios.gov.pl/pjp/content/about_us (accessed on 15 February 2025)” with an uncertainty level of approximately ±5%.
2.1.4. Meteorological Parameters
The meteorological data used in this study were obtained from the National Aeronautics and Space Administration Prediction of Worldwide Energy Resources (NASA POWER), a satellite-based weather system “https://power.larc.nasa.gov (accessed on 18 January 2025)”. Data can be accessed by entering the latitude and longitude of the desired location. The system accommodates data acquisition for various scales, including single points, regional areas, and global extents [51,52]. The accuracy of the meteorological data is validated through direct comparisons with surface site observations, ensuring both global coverage and temporal consistency.
2.1.5. Air-Quality Index (AQI)
The Air-Quality Index (AQI) is a quantitative measure of air quality, calculated based on data from various criteria pollutants, such as PM10, PM2.5, NOx, SO2, O3, CO, and NH3. For AQI computations, a minimum of three pollutants is required, with at least one being either PM10 or PM2.5 [53]. In this study, for Malda, four criteria pollutants (PM2.5, SO2, O3, and NOX), and four criteria pollutants (PM10, PM2.5, CO, and O3) are employed, to determine the AQI value and assess the air quality of the location. The AQI was calculated using an Excel template developed by the CPCB, which is available at “https://app.cpcbccr.com/ccr_docs/AQI%20-Calculator.xls (accessed on 23 December 2024)” [54]. The AQI value serves as a useful measure for examining the impacts of air pollution on human health after being exposed to the air in a specific location over a defined period [53]. There are six distinct categories within AQI classifications. The AQI values are separated into six color-coded groups: good (dark green), satisfactory (light green), moderate (yellow), poor (orange), very poor (red), and severe (dark red), depending on whether the AQI values range from 0 to 50, 51–100, 101–200, 201–300, 301–400, and greater than 401, respectively [54].
2.2. Noise-Level Monitoring
A digital sound-level meter (Model no: SL-4030, Lutron, Taiwan, China) with an uncertainty of ±0.1 dB, was employed to monitor the noise level at designated study sites. The sound-level meter was mounted on a sturdy tripod at a distance of 5 m from the firecracker bursting zone. The instrument was preset to ‘A-weighting’ and ‘Slow’ positions to ensure accuracy prior to the commencement of monitoring. The monitoring was carried out at two-hour intervals, spanning 24 h. Before commencing the measurements, the instrument underwent internal calibration using the internal sound-level calibrator, ensuring precise readings.
2.3. Elemental Characterization
The elemental components in PM pollution samples were analyzed using an inductively coupled plasma-optical emission spectrometer (ICP-OES) (Model: Optima 2100 DV, Perkin Elmer, Waltham, MA, USA), as described by Das et al. [41] with a minor modification. This instrument integrates the performance of a simultaneous analysis system while retaining the flexibility of conventional systems, thus facilitating a comprehensive analysis of elements based on their background levels and concentrations, with high accuracy and precision. To prepare the samples, the exposed PM2.5 and PM1 filters were weighed, cut, and subsequently immersed in a digestion solution comprising nitric acid (HNO3) and hydrochloric acid (HCl) in a 1:3 ratio. Specifically, 20 mL of HNO3 and 60 mL of HCl were measured, and the total volume was adjusted to 100 mL by the addition of double-distilled water. The mixture was then allowed to digest for a period of 24 h to ensure complete digestion of the samples. Following this, the resultant solution was dried in a hot-air oven at a temperature of 180 °C for 2 h and subsequently filtered for elemental characterization purposes. Blank filters were subjected to identical treatment protocols for comparative analysis. For the purposes of quality assurance and quality control, multi-element standard solutions (Catalog Numbers: 109487 and 111355) were utilized. The analytical procedures were repeated several times to obtain reliable and consistent data.
Stringent quality-control measures were implemented to ensure precision and accuracy. Before analysis, all glassware used for digestion was pre-treated with acid digestion solution for at least 24 h, and subsequently rinsed three times with double-distilled water. The Whatman (USA) filter papers were employed, due to stability and high purity, ensuring reliable results during chemical speciation. Sampled filters were analyzed immediately to prevent cross-contamination and analytical errors. Standard analytical reagents with trace-level impurities were sourced from Merck, Delhi. Precision and accuracy were maintained by analyzing replicates of samples and sample blanks. The limits of quantification of the instrument were confirmed prior to the final calculation of results pertaining to heavy metals. The error percentage was estimated to be ±5% based on repetitive analyses.
2.4. Health-Risk Assessment Due to Short-Term Exposure
Risk assessments play a critical role in understanding the effects of PM on human health. Numerous epidemiological studies have provided compelling evidence to support the notion that airborne PM is strongly associated with the induction of serious adverse health effects [55,56]. Toxic elements, despite comprising a small fraction of PM, can have significant health implications. Exposure to PM-bound metals primarily occurs through three pathways: (a) direct ingestion through food, drinks, or hand-to-mouth contact; (b) inhalation through the nose and mouth; and (c) dermal absorption through skin contact [57]. According to the US EPA [58] and previous studies [57,59], risks associated with inhalation and ingestion are usually more apparent than dermal contact, while the risks associated with exposing the dermal contact area to fireworks are highly unknown [27]. Consequently, this study focuses on ingestion and inhalation routes for assessing short-term exposure. The chemical daily intake (CDI) from ingestion and the exposure concentration (EC) from inhalation were calculated following the ‘human health evaluation manual’ and ‘supplemental guidance for inhalation risk assessment’ by USEPA outlined in the literature [57,58,59,60,61]. Since festive pollution is a short-term exposure event, where increases in elemental concentration persist for a few hours to one day, exposure days are adjusted accordingly to reflect this temporal aspect [27]. The equations were as follows:
where C: mass concentration of toxic elements in PM (mg/kg);
Chemical daily intake (through ingestion),
CDIing = (C × IngR × EF × ED × CF)/(AT × BW)
CDIing = (C × IngR × EF × ED × CF)/(AT × BW)
Exposure concentration (through inhalation),
ECinh = (Cv × ET × EF × ED)/ATn
ECinh = (Cv × ET × EF × ED)/ATn
IngR: ingestion rate (200 mg/day for juveniles, 100 mg/day for adults);
EF: exposure frequency, indicating the number of exposure days per year (1 day);
(Since elemental concentration varied daily, EF was calculated separately for each day);
ED: exposure duration (6 years for juveniles, 24 years for adults);
CF: conversion factor (10−6 kg/mg);
AT: averaging time (ED × 1 day);
BW: body weight (15 kg for juveniles, 70 kg for adults);
Cv: concentration of toxic elements in PM (μg m−3);
ET: exposure time (24 h/day);
ATn: average time (ED × 24 h/day) [27,57,58,60,61,62,63].
The presence of harmful substances in PM can pose significant risks to human health, including both cancerous and non-cancerous effects. These hazards were calculated by carcinogenic risk (CR) and hazard quotient (HQ), respectively. The CR was determined using both ingestion (CRing) and inhalation (CRinh) routes of exposure to estimate carcinogenic risk, while the HQ was also determined using ingestion (HQing) and inhalation (HQinh) exposure to evaluate the non-carcinogenic risk. According to USEPA, the acceptable level of carcinogenic risk should fall between 1 × 10⁻⁶ and 1 × 10⁻⁴ [57]. On the contrary, an HQ value below 1 suggests a low likelihood of non-carcinogenicity, while a value higher than one indicates a higher risk of adverse health effects [57]. Furthermore, the hazard index (HI) is employed to calculate the cumulative impact of different substances or exposure pathways. The equations were as follows:
Carcinogenic risk (through ingestion): CRing= CDIing × SFo
Carcinogenic risk (through inhalation): CRinh= IUR × ECinh
Hazard quotient (through ingestion): HQing= CDIing/RfDo
Hazard quotient (through inhalation): HQinh= ECinh/ (RfCi × 1000 μg/mg)
Hazard index: HI= ∑HQ
The following parameters (SFo, IUR, RfDo, RfCi) were obtained from the US EPA:
CDIing = chemical daily intake through ingestion (already mentioned above);
SFo = oral slope factor (mg per kg-day)−1;
IUR = inhalation unit risk (μg/m3)−1;
ECinh = exposure concentration through inhalation (already mentioned above);
RfDo = oral reference dose (mg per kg-day);
RfCi = inhalation reference concentration (mg/m3) [57,64].
2.5. Enrichmrnt Factor (EF) Analysis
Enrichment factor (EF) analysis was performed to determine the origin of various elements and the extent of anthropogenic influence. The analysis assessed the level of enrichment of each element in relation to its relative abundance in crustal versus non-crustal sources and was used to distinguish between the origin of the elements either from natural or anthropogenic sources. For this study, iron was utilized as the reference element [65].
The EF of elements was calculated using the following formula [41]
where Ex = element of interest; and Eref = reference element.
Values of the enrichment factor below one indicate minimal enrichment, suggesting a crustal or natural origin of the elements. Conversely, elements with moderate enrichment, reflected in values ranging from one to ten, indicate an anthropogenic origin. A higher EF value, exceeding ten, signifies higher enrichment, which typically indicates a non-crustal origin, often associated with combustion activities, industrial emissions, and car exhausts [47,66].
2.6. Statistical Analysis
All the statistical analyses were carried out using SPSS software (SPSS Statistics ver. 21.0), with a significance threshold of p < 0.05 [41]. The wind-rise plots were made using WRPLOT view ver. 7.0.0 (Lakes Software, Waterloo, ON, Canada) [20]. The Hybrid Single-Particle Lagrangian Integrated Trajectory (HYSPLIT) model was employed to calculate backward air-mass trajectories converging at Malda and Poland across various altitudes. Data for the backward trajectories were sourced from the Air-Resource Laboratory (ARL) datasets under the National Oceanic and Atmospheric Administration (NOAA), “https://www.ready.noaa.gov/HYSPLIT.php (accessed on 18 January 2025)”, utilizing the GDAS model [67]. The TrajStat software (version 3.9.4; http://www.meteothink.org/) was utilized to create 72 h backward trajectories at different altitudes (500 m, 1000 m, 2000 m) above ground level (AGL), originating from different sites [47]. Additionally, isentropic trajectories were analyzed as they consider the adiabatic vertical movements of air parcels during transport and are less susceptible to inaccuracies in fundamental meteorological data.
3. Results and Discussion
3.1. Air-Quality Monitoring During Festivities
To assess the impact of festival-related pollution, a control period was established in both locations. In Malda, India, pre-Diwali days served as the reference baseline, while in Warsaw, the control period was set on the morning of 31 December 2023 before the peak pollution spike. The background concentrations of PM were significantly lower before the Diwali and New Year festivities in Malda and Poland, respectively, but spiked dramatically during festive celebrations.
3.1.1. Diwali
The concentration of NO2 and SO2 gases increased by 1.25 and 2.43 times, respectively, in 2023, and 1.3 and 1.72 times, respectively, in 2024—during Diwali—compared to the pre-Diwali period (Figure 2a). The concentration of O3 increased by 1.8 and 2.05 times during Diwali compared to the pre-Diwali period, in 2023 and 2024, respectively. The concentration of these gases showed a consistent upward trend from pre Diwali to Diwali and then decreased gradually afterward, as depicted in Figure 2a. Despite the concentration spike, the concentration of NO2, SO2, and O3 remained within the permissible limits of World Health Organization (WHO) of 25, 40, and 100 μg m−3, respectively. The surge in NO2 gas concentration was attributed to firecracker combustion that contain potassium nitrate, a potent oxidizer that releases NO2, causing deleterious health impacts [21]. Furthermore, a higher concentration of SO2 poses a higher risk as it accumulates on fine PM fractions’ surfaces and enters the body through the lungs and can remain there for a long time [3]. The concentration of NO2 was higher than SO2 throughout the monitoring days but remained within the standard. Similar findings were observed in previous studies [4,68,69]. Ambade [68] reported that the concentration of NO2 and SO2 gases remained within the National Ambient Air-Quality Standard (NAAQS) limit (80 μg m−3) in Jamshedpur city during Diwali festivities in 2014. Similarly, Mandal et al. [69] found that the concentration of NO2 remained within the limit in Mumbai and Kolkata during festivities, except for Delhi, and the concentration of SO2 remained within the limit in the aforementioned three cities. During the study, the concentration of O3 was also increased during Diwali but remained within the permissible standard. These findings were consistent with Mandal et al. [69], where the surface concentration of O3 remained within acceptable limits in Delhi and Mumbai, except in Kolkata. Generally, O3 formation is attributed to photochemical reactions involving NOx and volatile organic compounds’ (VOCs’) emission into the atmosphere from diverse sources in the presence of sunlight [70]. Fireworks and firecrackers can also produce O3 at ground level [3,13,71]. Colored firecrackers can emit O3 upon igniting, regardless of the presence of sunlight and NOx [71,72].
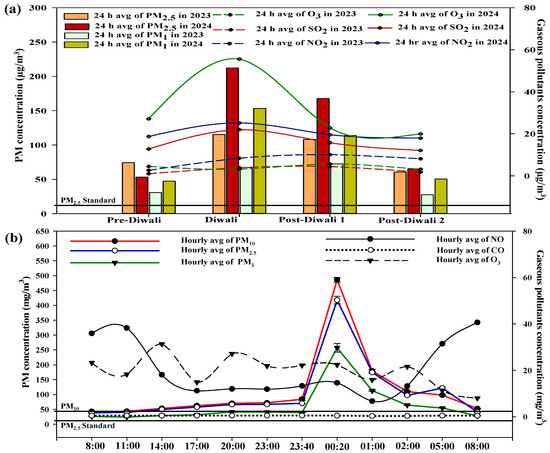
Figure 2.
(a) The 24 h daily average mass concentrations of gaseous pollutants, including ozone (O3), nitrogen dioxide (NO2), sulfur dioxide (SO2), and particulate matter (PM2.5 and PM1) concentrations during the pre-Diwali, Diwali, and post-Diwali days in Malda, West Bengal, India, in 2023 and 2024; (b) the hourly average concentration of gaseous pollutants (NO, CO, and O3), as well as different PM fractions (PM10, PM2.5, and PM1) during New Year festivities in Warsaw, Poland, 2024. The figure represents a significant spike in pollution level during the festive period in both the study areas. The superimposed black lines represent the World Health Organization’s (WHO) standard concentration limits for PM2.5 (15 μg m−3) in Malda and PM10 (45 μg m−3) and PM2.5 (15 μg m−3) in Warsaw, providing a reference point for assessing the severity of PM pollution during the study period.
The 24 h average concentration of PM2.5 ranged from 60.7 over the pre-Diwali period to 108.2 μg m−3 on Diwali 2023, which is almost double the pre-Diwali level, and from 53.4 over the pre-Diwali period to 212.4 μg m−3 on Diwali 2024, emphasizing the significant pollution created by firecrackers (Figure 2a). The PM2.5 concentration further increased to 115.4 μg m−3 on post-Diwali 1 and then decreased to background levels (74.4 μg m−3) on post-Diwali 2 in 2023, and 167.7 μg m−3 on post-Diwali 1 and 65.2 μg m−3 on post-Diwali 2 in 2024. PM concentration further spiked in post-Diwali 1, mainly due to the combustion of firecrackers during the Diwali festivities. The aerosols emitted from these firecrackers persisted in the atmosphere, contributing to a marked elevation in PM levels both during and after the festival period. Previous studies have also documented a rise in PM concentration during the celebrations, being significantly greater than the WHO standards during the celebrations than on other days [73,74,75,76]. Chhabra et al. [73] reported that the fine PM concentration was 82.8 μg m−3 in Ahmedabad city in 2017, during Diwali, which was comparatively lower than the concentration reported in our study. However, the concentration of PM was significantly lower in our study when compared with other megacities, i.e., Delhi [69,74,75], Kolkata [24,69], Lucknow [76], Faridabad [76], and Varanasi [4]. The PM1 concentration ranged from 27.6 to 72.6 μg m−3 from pre Diwali to Diwali on 2023, almost 2.6 times higher than before, and from 47.4 to 153.4 μg m−3 from pre Diwali to Diwali 2024, almost 3.2 times higher than before. The concentration then decreased gradually on post-Diwali 1 (67.3 μg m−3) and post-Diwali 2 (30.8 μg m−3) in 2023, and post-Diwali 1 (113.8 μg m−3) and post-Diwali 2 (50.5 μg m−3) in 2024. The PM2.5 concentration exceeded the WHO standard of 15 μg m−3 for PM2.5 during the monitoring period. Since there are no PM1 standards set by the WHO, the PM2.5 standards were used as reference points for PM1. The 24 h concentration of PM1 was higher than the WHO standard for PM2.5 (15 μg m−3) throughout the study period, for both 2023 and 2024. The release of firecrackers during the festival night and the subsequent nights resulted in a significant surge in atmospheric PM concentrations, emphasizing the association between firecracker bursting and atmospheric PM [1].
3.1.2. New Year
Figure 2b shows the average gaseous pollutants and PM concentrations on New Year’s Day. PM10 concentration spiked up to 486 μg m−3 from 43 μg.m−3, indicating the highest concentrations were found around midnight (00:20 h), coinciding with the new year. Regarding PM2.5, the concentration spiked up to 417.6 μg m−3 from 38.4 μg m−3, while PM1 concentration spiked up to 257 μg m−3 from 24 μg m−3. The spike in PM10, PM2.5, and PM1 concentration was 11, 10.8, and 10.7 times higher than the control period. The concentrations of PM10 and PM2.5 were higher than the WHO standard of 45 and 15, respectively. Although the WHO has not established standard for PM1, the concentration of PM1 was still found to be higher than the PM2.5 standard. Similarly, Drewnick et al. [77] reported that the pollutant concentration peaked at midnight during New Year fireworks events in central Germany. Another study in Slovakia reported that PM10 concentration during New Year celebration hours was statistically significant [78]. Li et al. [79], in their study of data using 335 Chinese cities from 2015 to 2017, reported that fireworks increased the PM10 by 44% and PM2.5 by 89%. Our study revealed that higher PM concentrations were measured at the breathing zone, indicating higher real-life personal exposure levels during the burning of firecrackers. O3 displayed a significant decline during the night hours, likely due to the lower temperatures and the less sunshine hours in winter, which hinder photochemical reactions required for O3 formation. However, a subtle uptick was detected at midnight, setting it apart from the surrounding hours. A similar pattern observed with NO2, while CO showed nonsignificant variation throughout the day.
Diurnal Variation
Figure 2b shows the diurnal variation in PM concentrations on New Year’s Day. The findings depicted a notable variation in PM concentration in all groups. The nighttime concentrations were notably higher, followed by the afternoon, while daytime levels remained minimal during New Year’s Eve. This pattern coincides with periods of high pyrotechnic activity, transportation, and other anthropogenic activity.
3.2. Meteorological Attributes Influencing Pollution
Meteorological attributes are key drivers of air pollution, as they influence the diffusion and dispersion of pollutants over a geographical region [80]. Table 1 shows the meteorological parameters during Diwali 2023 and 2024 and New Year celebrations in 2024. During Diwali, Malda recorded lower temperatures in 2023 than in 2024. The onset of Diwali coincides with the beginning of the winter season, and the New Year happens in the mid-winter, characterized by reduced temperature (often negative temperatures in Warsaw), high humidity, low winds, and shallow mixing height, which can further enhance the accumulation of PM in the atmosphere [81]. Previous studies have found that lower temperature facilitated higher pollutant load, while higher air temperature allows the pollutants to dilute quickly [82,83,84]. Additionally, in winter, the surface air tends to be significantly colder and denser, leading to temperature inversion, where a warmer layer air overlays the colder air near the surface, effectively trapping the latter beneath it. The inversion layer can result in the accumulation of pollutants, thereby degrading air quality [82,83]. Regarding humidity, high moisture content facilitates the reduction in pollutants and vice versa [85,86]. Malda recorded an elevated humidity level in the year 2024 compared to that in 2023, and Poland recorded a high humidity level. However, despite the higher humidity, the pollution load increases significantly, indicating the rampant burning of firecrackers. Moreover, low wind speed and shallow mixing height further facilitate pollutant accumulation during Diwali and New Year. A lower mixing height decreases vertical dispersion and restrains ambient aerosols within the restricted mixing layer near the ground surface, resulting in a buildup of particles in this region [41]. In addition, low wind speed reduced the dispersion of particles, which in turn increased the pollutant’s concentration in the area. Complex topography and land-use patterns of urbanized areas can create internal boundary layers, leading to intricate wind flows and stagnant conditions with restricted airflow, which can further exacerbate the impact [87].

Table 1.
Different meteorological parameters of English Bazaar, Malda, during the Diwali festivities, 2023 and 2024 and the New Year celebration in Warsaw, Poland in 2024.
3.2.1. Wind-Rose Plot
The wind-rose diagram illustrates the direction and speed of wind in the study area during the Diwali and New Year festivities (Figure 3). During Diwali 2023, the predominant wind direction was blowing from the northwest side, whereas in Diwali 2024, the winds primarily originated from the northeast. In contrast, during the New Year celebration in 2024, the wind was blowing from an east–south direction. The wind speed has a significant effect on the dispersion of pollutants; low wind speeds, high humidity, and low temperatures significantly impact pollutant dispersion by decreasing the mixing height, leading to increased pollutant deposition in the lower atmosphere of the study area [88,89].
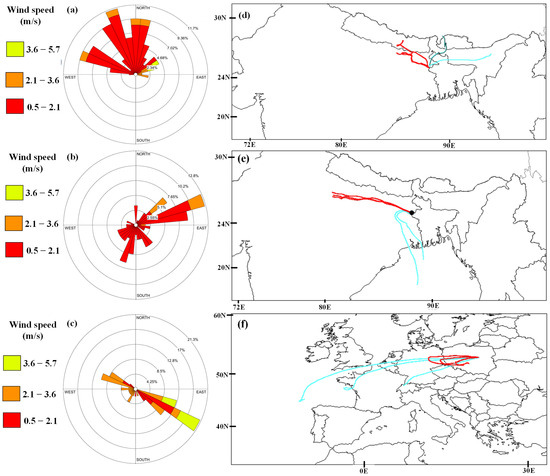
Figure 3.
A wind-rose diagram showing the distribution of wind speed and wind direction during festive celebrations in (a) Malda, 2023, (b) Malda, 2024, and (c) Warsaw, 2024. The HYSPLIT was used to generate 72 h backward trajectories at various altitudes above ground level (AGL) for the sampling period, highlighting the origin of air pollutants at the study site, as well as (d) Malda, 2023, (e) Malda, 2024, and (f) Warsaw, 2024 during festive celebrations. The backward trajectories indicate the backwards path of an air sample to determine its origin and understand the influence of different sources on air quality. The air-mass back trajectory was downloaded using https://www.ready.noaa.gov/HYSPLIT.php (accessed on 18 January 2025). The distinct source regions are represented by different lines (red- and blue-colored), revealing the complex interplay between various emission sources at the study site.
3.2.2. Backward Trajectory
Trajectory analysis was performed to identify the possible transport pathways of PM from source regions to the study sites (Figure 3). The air-mass back trajectory was generated at various altitudes during pre-to-post Diwali and New Year celebrations at Malda and Warsaw, respectively. The HYSPLIT model was utilized to generate 72 h backward trajectories at multiple altitudes above ground level for the sampling period, providing valuable insights into the origin of air pollutants at the study sites. The analysis revealed distinct differences in air-mass transport patterns between the two study sites during celebration periods. The air masses reaching Malda during Diwali celebrations exhibited different transport patterns in 2023 and 2024. In 2023, the air masses originated from Nepal, China, Bhutan, and Bihar, indicating a significant influence from trans-boundary sources. In 2024, the air masses originated from Allahabad, Lucknow, Kanpur, and the Bay of Bengal, suggesting a stronger influence from regional-scale transport within India. In contrast, during New Year’s celebrations in Warsaw (2024), the air masses reaching the study site originated from the surrounding regions, including Germany, France, Poland, and the Atlantic Ocean. This suggests that the air quality at the Warsaw site during New Year’s celebrations was also influenced by the regional-scale transport of pollutants from these areas. These findings highlight the complex and dynamic nature of air-mass transport pathways, which can vary significantly depending on the location, time, and meteorological conditions, and significantly influence pollutants concentration.
3.3. Air Quality Index
The AQI measures current pollution levels and serves as an indicator of the prevailing pollution levels. The AQI is derived from the concentration of various pollutants, including PM, NO2, SO2, and O3. The AQI is categorized into six groups, with each group representing a different level of air quality, ranging from ‘good’ (0–50), ‘satisfactory’ (51–100), ‘moderately polluted’ (101–200), ‘poor’ (201–300), ‘very poor’ (301–400), and ‘severe air quality’ (401–500). Each group has a specific color, with each color denoting the associated health problems [90]. AQI falls in a poor and very poor category on Diwali and post-Diwali 1 in 2023 and 2024, respectively, indicating several health problems. The AQI value increased by 42% on 2024 compared to 2023, during Diwali festivities, emphasizing the escalating health concerns associated with festive celebrations. On the contrary, during the midnight New Year celebrations, the AQI level spiked to the severe category, which is likely to affect everyone and necessitates limiting outdoor exposure to minimize the risk of adverse health effects. The color-coded AQI of the study area and associated health problems during the festivities are given in Table 2.
Table 2.
Air-Quality Index (AQI) of English Bazaar, Malda (2023 and 2024) and Warsaw (2024), Poland during Diwali and the New Year festivities, respectively.
3.4. Assessment of Noise Pollution
Figure 4 presents the results of noise monitoring in Malda throughout the festivities. The permissible noise limits were found to be surpassed throughout the overall study period. On the celebration day, the highest levels were recorded during the day between 11:00 and 13:00 h and between 17:00 and 23:00 h in the evening. The noise level was higher during the day, particularly 11:00–13:00 h, and 15:00–23:00 h in the late afternoon to night, during Diwali. The recorded noise levels were 134.1 ± 1.96 dB (A) and 139.5 ± 2.48 dB (A) and 134.1 ± 2.40 dB during the daytime and at night in 2023 and 2024, respectively, exceeding the standards set by the CPCB for residential areas by 55 dB [91]. The daytime noise levels were attributed to the large number of people visiting temples to pray, as well as the use of microphones in pavilions/pandals. In contrast, the use of music systems, CD players, cultural programs, and mainly the bursting of firecrackers, contributed to higher noise levels in the evenings. However, the noise levels decreased significantly after 23:00 h, as most people went to sleep. The sound level on Diwali was 13% more than pre-Diwali and 17% lower in post-Diwali 1 than Diwali. According to another study [92], the sound level during the ‘Kali Puja’/Diwali celebrations increased by 19.2% compared to non-festive days in Asansol city. Similarly, Mahecha et al. [93] reported a 30% higher noise level on festive days than on non-festive days in Jaisalmer.
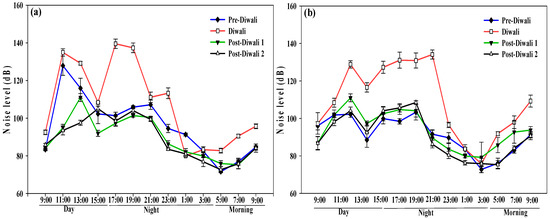
Figure 4.
Noise-level assessment of study area during pre- to post-Diwali period in (a) 2023; (b) 2024.
3.5. Elemental Composition of PM
The ICP-OES was employed to analyze PM2.5 and PM1 bound elements, including arsenic (As), calcium (Ca), cadmium (Cd), chromium (Cr), copper (Cu), iron (Fe), lithium (Li), magnesium (Mg), manganese (Mn), strontium (Sr), titanium (Ti), vanadium (V), and zinc (Zn). The percentage increase/decrease in elemental concentration is displayed in Figure 5. The study’s findings revealed a surge in Fe concentration in PM2.5 samples during the celebration and afterwards, with an increase of up to 120% and 104% during Diwali and post-Diwali 1, respectively, when compared to the background levels. The observed rise in Fe concentration can be attributed to its use in firecracker manufacturing, resulting in excessive consumption during the celebration period [3]. Likewise, the concentration of Sr increased by 80% and 42% in PM2.5 samples, and by 1% and 8% in PM1 samples during Diwali and the next day, correspondingly. Furthermore, Ti concentrations increased by 100% in both PM2.5 and PM1 during Diwali, while Zn concentration increased by 73% and 7%, and 10% and 16% during Diwali and post-Diwali 1, respectively, in both PM2.5 and PM1 samples. The detected elements were the signature colorants of firecrackers, with Cu (blue), Fe (orange), Sr (red), Mg, Ti (white), and Zn used to create smoke effects [11,94,95]. Previous studies also reported Cu, Mg, Sr, and Zn as tracers of firecrackers, highlighting the association between firecrackers and air quality [95,96]. Moreover, the presence of toxic heavy metals such as arsenic and cadmium was only detected in PM1 and not in PM2.5. Thus, ultrafine fractions are aforethought to be more toxic. The festival night observed 166% and 284% higher concentrations of As and Cd, respectively, than before the festival. The concentration of As and Cd gradually decreased up to 76% and 87%, respectively, on the following day of Diwali, which may be due to the transportation and diffusion properties of elements. Such toxic elements affect human health and the ecosystem, especially for aged individuals and children and individuals suffering from respiratory diseases, cardiovascular illness, and asthma/bronchitis [97]. However, the percentage increase/decrease in the concentration of some elements was significantly greater during the after-celebration period than on the main festival day, which might be a consequence of the persisting presence of fine and ultrafine fractions in the atmosphere leading to a significant surge in the concentration of PM during and after the festival period.
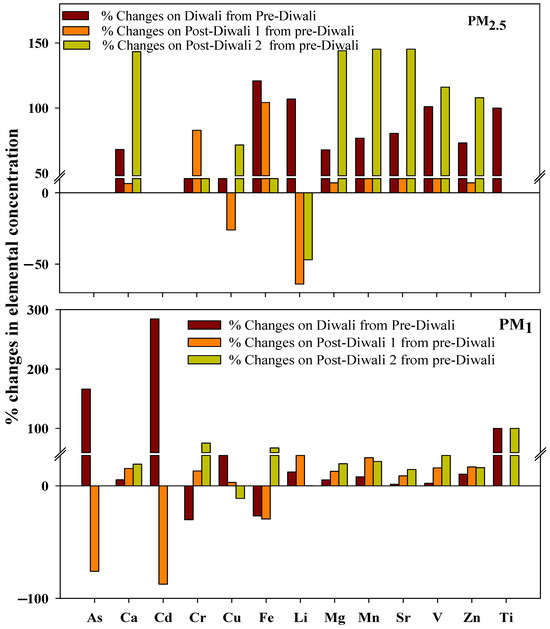
Figure 5.
Percentage variation in elements in PM2.5 and PM1 obtained through inductively coupled plasma-optical emission spectrometry (ICP-OES) during the pre- to post-Diwali period.
For Poland, no elemental analysis was performed, as the focus was on PM concentration levels. However, the inclusion of Warsaw’s data provides a comparative framework for assessing firework-related pollution in different environments.
3.6. Health-Risk Assessment
Inhalation and ingestion are often the principal routes of human exposure to airborne pollutants, which can determine carcinogenic or non-carcinogenic risks. The carcinogenic and non-carcinogenic risk values associated with PM-bound toxic elements are presented in Figure 6. The probability of cancer development due to the ingestion of toxic elements surpasses that of inhalation. Children are more vulnerable to these risks than adults. The carcinogenic risk was higher on the celebration day than on the pre- or post-Diwali days. The levels of CRing and CRinh for As, Cd, and Cr in the area were higher than the safe level of 1 × 10⁻⁴ for both adults and children, indicating that the three elements pose considerable threats to residents’ health. Among these toxic elements, As concentration was significantly higher, indicating particular concern. The ‘International Agency for Research on Cancer (IARC)’ has categorized arsenic and arsenic-related substances as Group 1 carcinogens. Arsenic and its derivatives are carcinogenic for humans [98]. Arsenic was detected solely in ultrafine fractions of PM, not in fine fractions, emphasizing that it can easily penetrate lung tissue and the blood system [99]. Consequently, the level of toxic element pollution in the study area could be considered extremely severe. Long-term exposure to such contaminated air will likely increase the cancer rate for residents.
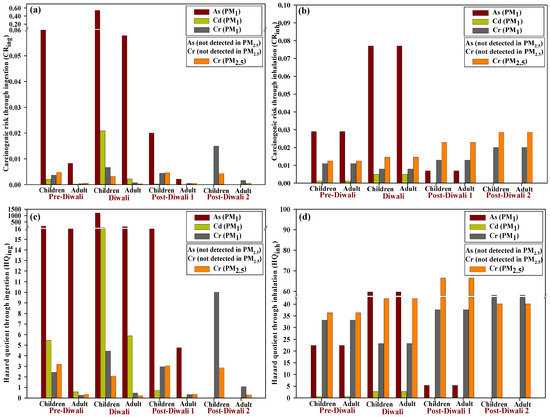
Figure 6.
A health-risk assessment of PM2.5 and PM1-bound toxic elements during pre-to-post Diwali days. (a) The carcinogenic risks (CR) through ingestion (CRing); (b) CR through inhalation (CRinh); (c) hazard quotients (HQ) through ingestion (HQing); and (d) HQ through inhalation (HQinh). Acceptable CR values range from 1 × 10⁻⁶ to 1 × 10⁻⁴, while HQ values exceeding 1 indicate a potential risk of adverse health effects.
According to the US EPA guidelines, an HQ greater than one may lead to potential adverse health effects, while, an HQ of less than 1 for non-carcinogens indicates a minimal non-carcinogenic risk for inhabitants. The ingestion HQ of As and the inhalation HQ of As and Cr exceeded the acceptable limit. In particular, the HQ values concerning ingestion were significantly higher in children than in adults. These values were found to be more evident during the main celebration day, subsequent to days before and following. Increased pollution from fireworks and other sources leads to higher concentrations of toxic pollutants in the air. Among these elements, arsenic was most abundant in ultrafine fractions and posed the most significant risk. In regard to fine PM fractions, chromium, followed by cadmium, had significantly higher non-cancer risks. In summary, the study revealed that the levels of carcinogenic and non-carcinogenic risks in these elements are concerning, surpassing the acceptable limit. Similarly, hazard index values exceeded the safe limit in this region. The exposure to these pollutants can pose a significant threat to human health, especially to those who spend a significant amount of time outdoors, regardless of their profession or age group. Children are more prone to adverse health impacts than adults, indicating that proactive measures should be taken to safeguard the environment.
3.7. Enrichment Factor Analysis
The enrichment factor (EF) analysis was performed separately for the pre-Diwali, Diwali, and post-Diwali days to identify the sources of individual elements. The EF values for each element are presented in Table 3, revealing that all elements detected in PM2.5 and PM1 samples exhibited EF values > 1 throughout the study period, suggesting these elements are primarily derived from non-crustal and anthropogenic sources. The observed EF values can be attributed to the characteristics of the region, particularly its proximity to small-scale factories, NH-34, and railway tracks, which contribute to increased vehicular activity and industrial emissions. Moreover, most elements, particularly Sr, Mg, Mn, and Ti, the significant markers of firecracker emissions, exhibited higher EF values during Diwali compared to the pre-Diwali period. This finding was consistent with previous studies that reported increased concentrations of fireworks tracers, such as Sr and Ba, in Amritsar [100] and Al, K, and Mg in Delhi [96]. The variation in EF values of firecracker trace elements during festive periods indicates that firecracker emissions during Diwali significantly contribute to the elevated levels of these elements. Furthermore, the persistence of elevated EF values during post-Diwali days implies that these anthropogenic sources continue to influence the elemental composition of PM2.5 and PM1 in the region, as celebrations involving firecrackers often persist after 1–2 days following the festival.
Table 3.
Enrichment factors of various elements in PM2.5 and PM1 over the pre-Diwali to post-Diwali days, using Fe as the reference element (EF values < 1 = crustal or natural origin of the elements; 1–10 = anthropogenic origin; >10 = non-crustal, particularly car-exhaust emissions, combustion activities, and industrial emissions).
4. Conclusions
Diwali and the new year have been celebrated with great enthusiasm for centuries. However, the overuse of sparklers and firecrackers during this celebration has detrimental impacts on our surroundings and public health, causing air and noise pollution. This study conducted ambient air-quality monitoring during the Diwali festival in Malda in 2023 and 2024 and the New Year celebration in Warsaw in 2024. The findings found that gaseous and particulate pollutants spike during the Diwali period and the PM concentration spikes during New Year celebrations, particularly at midnight. Although the concentration of gaseous pollutants remained within the permissible limits of WHO, particulate pollutants exceeded standard in both locations. The AQI during Diwali falls in the poor category in 2023 and the very poor category in 2024, respectively, becoming severe during midnight New Year celebrations, indicating health risks. Firecracker signature trace elements like Fe, Mg, Mn, Sr, Ti, and Zn were detected in PM2.5 and PM1 samples during Diwali. PM1 contained toxic heavy metals like arsenic and cadmium, highlighting the hazardous potential of ultrafine fractions. Although elemental analysis was not performed for Poland, the inclusion of its PM concentration data is valuable for understanding the global impact of festival-related pollution. Future studies could incorporate chemical composition analysis for Poland, allowing for a more comprehensive comparison. The heath-risk assessment revealed that children are more susceptible to ingestion-related cancer risks than adults. Similarly, the non-carcinogenic risks associated with ingestion pathways were found to be higher in children than in adults when compared to inhalation pathways. The sound level was maximum during the day (134.9 ± 1.96 dB) and nighttime (139.5 ± 2.48 dB) over Diwali. However, the concentration of pollutants decreased gradually, demonstrating nature’s capacity to purify itself and self-heal.
Short-term exposure to these pollutants with significantly higher concentrations can cause acute health illness. Moreover, the onset of Diwali and the new year coincides with the post-monsoon/winter season (lower temperature, slow wind, increased humidity), which reduces the dispersion of pollutants, and in turn, further exacerbates the effects. In addition, firecracker bursting and explosions also increase noise-pollution levels. In light of these findings, it is imperative to create awareness about the harmful effects of burning firecrackers and sparklers on the environment and public health. Celebrating festivities in an eco-friendly way is crucial, and government regulations should be implemented to control pollution and achieve a sustainable atmosphere. Although nature has a self-purification capability and can disperse pollutants over time, it is essential to take responsibility and make eco-friendly choices to ensure a healthy and sustainable environment for future generations.
Author Contributions
All the authors have contributed to the article. Writing—original draft, A.R.; Methodology, A.R. and R.P.; Data curation, A.R. and R.P.; Formal analysis, A.R. and S.K.B.; Writing—review and editing, M.M., D.P., R.P., A.P. and A.S; Conceptualization, A.S. and R.P.; Supervision, A.S. All authors have read and agreed to the published version of the manuscript.
Funding
AR and MM acknowledge the financial support in the form of Junior Research Fellowship (Ref. No.: CSIR-HRDG Ref No: Sept/06/22(i)EU-V) and Senior Research Fellowship (Ref. No.: CSIR-UGC SRF; Award No. 16-6(DEC.2018)/2019(NET/CSIR) from the Council of Scientific and Industrial Research (CSIR), MHRD, Govt. of India, and University Grants Commission (UGC), MHRD, Govt. of India, respectively. RP too acknowledge partial financial support from the National Science Centre, Poland (Grant no. 2020/39/D/NZ9/00969). For the purpose of Open Access, the author has applied a CC-BY public copyright license to any author-accepted manuscript (AAM) version arising from this submission.
Institutional Review Board Statement
Not applicable.
Informed Consent Statement
Not applicable.
Data Availability Statement
The data presented in this study are openly available from Zenodo.org at 10.5281/zenodo.15051768; reference number 15051768.
Acknowledgments
AS gratefully acknowledges the Department of Science & Technology and Biotechnology (DST&BT), Government of West Bengal, India for providing the financial support in the form of a research project (Memo No.: 207 (Sanc.)-ST/P/S&T/5G-14/2018, dated: 20 February 2019). The authors also acknowledge the infrastructural support in the form of the DBT-BOOST program, Department of Science & Technology and Biotechnology, GoWB, GoI (Ref. No. 1089/BT(Estt)/1P-07/2018; dated: 24 January 2019) and the Department of Botany, University of Gour Banga, Malda, West Bengal, India.
Conflicts of Interest
The authors declare no conflicts of interest.
References
- Kotnala, G.; Kumar, M.; Sharma, A.K.; Dhaka, S.K.; Gadi, R.; Ghosh, C.; Saxena, M.; Sharma, S.K.; Saha, A.R.; Nautiyal, A.; et al. Variations in chemical composition of aerosol during Diwali over mega city Delhi, India. Urban Clim. 2021, 40, 100991. [Google Scholar] [CrossRef]
- Yusuf, T.G.; Ikusemiju, T.M.; Habeeb, A.S. Perception of Awon Mass Wedding Festival by Contemporary Shao Community of Kwara State, Nigeria. Int. J. Herit. Tour. Hosp. 2020, 14, 52–60. [Google Scholar] [CrossRef]
- Chanchpara, A.; Muduli, M.; Prabhakar, V.; Madhava, A.K.; Thorat, R.B.; Haldar, S.; Ray, S. Pre-to-post Diwali air quality assessment and particulate matter characterization of a western coastal place in India. Environ. Monit. Assess. 2023, 195, 413. [Google Scholar] [CrossRef] [PubMed]
- Pratap, V.; Saha, U.; Kumar, A.; Singh, A.K. Analysis of air pollution in the atmosphere due to firecrackers in the Diwali period over an urban Indian region. Adv. Space Res. 2021, 68, 3327–3341. [Google Scholar] [CrossRef]
- Tanda, S.; Ličbinský, R.; Hegrová, J.; Goessler, W. Impact of New Year’s Eve fireworks on the size resolved element distributions in airborne particles. Environ. Inter. 2019, 128, 371–378. [Google Scholar] [CrossRef]
- Pervez, S.; Chakrabarty, R.K.; Dewangan, S.; Watson, J.G.; Chow, J.C.; Matawle, J.L. Chemical speciation of aerosols and air quality degradation during the festival of lights (Diwali). Atmos. Pollut. Res. 2016, 7, 92–99. [Google Scholar] [CrossRef]
- Brandhuber, P.; Clark, S.; Morley, K. A review of perchlorate occurrence in public drinking water systems. J. Am. Water Works Assoc. 2009, 101, 63–73. [Google Scholar] [CrossRef]
- Wu, Q.; Zhang, T.; Sun, H.; Kannan, K. Perchlorate in tap water, groundwater, surface waters, and bottled water from China and its association with other inorganic anions and with disinfection byproducts. Arch. Environ. Contam. Toxicol. 2010, 58, 543–550. [Google Scholar] [CrossRef]
- Liu, J.; Chen, Y.; Chao, S.; Cao, H.; Zhang, A. Levels and health risks of PM2. 5-bound toxic metals from firework/firecracker burning during festival periods in response to management strategies. Ecotoxicol. Environ. Saf. 2019, 171, 406–413. [Google Scholar] [CrossRef]
- Hu, U.; Sun, Y.; Yang, G.; Liu, M.; Gao, Y.; Lin, L.; Li, Q. Spring Festival Firework Activities Exacerbate Toxic Effects of Aerosol Essential Components. J. Hazard. Mat. 2025, 490, 137874. [Google Scholar] [CrossRef]
- Mehra, S.; Mawari, G.; Kumar, N.; Daga, M.K.; Singh, M.M.; Joshi, T.; Gargava, P.; Bhattacharjee, M.; Shukla, V.; Jha, M.K.; et al. Ecofriendly (green) firecrackers vs old firecrackers and their health effects: A systemic review. Atmos. Poll. Res. 2022, 41, 1095–1105. [Google Scholar] [CrossRef]
- Moffett, D.; Smith-Simon, C.; Stevens, Y.W. Toxicological Profile for Barium and Barium Compounds; United States Department of Health and Human Services: Washington, DC, USA, 2007; pp. 1–184. Available online: https://stacks.cdc.gov/view/cdc/6955/cdc_6955_DS1.pdf (accessed on 8 February 2024).
- Singh, A.; Pant, P.; Pope, F.D. Air quality during and after festivals: Aerosol concentrations, composition and health effects. Atmos. Res. 2019, 227, 220–232. [Google Scholar] [CrossRef]
- Zhang, S.; Han, X.; Shi, J.; Liu, Y.; Lei, Z. Fire Extinguishing Composition Comprising Carboxylic Acid Derivative. U.S. Patent No. 9,974,992, 22 May 2018. [Google Scholar]
- Tsai, Y.I.; Kuo, S.C. Contributions of low molecular weight carboxylic acids to aerosols and wet deposition in a natural subtropical broad-leaved forest environment. Atmos. Environ. 2013, 81, 270–279. [Google Scholar] [CrossRef]
- Salo, K.; Jonsson, A.M.; Andersson, P.U.; Hallquist, M. Aerosol volatility and enthalpy of sublimation of carboxylic acids. J. Phys. Chem. A 2010, 114, 4586–4594. [Google Scholar] [CrossRef]
- Huang, W.; Wu, C.; Gao, L.; Gramlich, Y.; Haslett, S.L.; Thornton, J.; Lopez-Hilfiker, F.D.; Lee, B.H.; Song, J.; Saathoff, H.; et al. Variation in chemical composition and volatility of oxygenated organic aerosol in different rural, urban, and mountain environments. Atmos. Chem. Phys. 2024, 24, 2607–2624. [Google Scholar] [CrossRef]
- Kuo, S.C.; Tsai, Y.I.; Sopajaree, K. Emission characteristics of carboxylates in PM2. 5 from incense burning with the effect of light on acetate. Atmos. Environ. 2016, 138, 125–134. [Google Scholar] [CrossRef]
- Liang, C.W.; Chang, C.C.; Liang, J.J. The impacts of air quality and secondary organic aerosols formation on traffic accidents in heavy fog–haze weather. Heliyon 2023, 9, e14631. [Google Scholar] [CrossRef]
- Mandal, M.; Popek, R.; Przybysz, A.; Roy, A.; Das, S.; Sarkar, A. Breathing Fresh Air in the City: Implementing Avenue Trees as a Sustainable Solution to Reduce Particulate Pollution in Urban Agglomerations. Plants 2023, 12, 1545. [Google Scholar] [CrossRef]
- Verma, C.; Deshmukh, D.K. The ambient air and noise quality in India during Diwali festival: A review. Recent Res. Sci. Technol. 2014, 6, 203–210. [Google Scholar]
- Popek, R.; Roy, A.; Mandal, M.; Przybysz, A.; Drążkiewicz, K.; Romanowska, P.; Sarkar, A. Enhancing Urban Sustainability: How Spatial and Height Variability of Roadside Plants Improves Pollution Capture for Greener Cities. Sustainability 2024, 16, 11131. [Google Scholar] [CrossRef]
- Roy, A.; Mandal, M.; Das, S.; Popek, R.; Rakwal, R.; Agrawal, G.K.; Awasthi, A.; Sarkar, A. The cellular consequences of particulate matter pollutants in plants: Safeguarding the harmonious integration of structure and function. Sci. Total Environ. 2024, 914, 169763. [Google Scholar] [CrossRef] [PubMed]
- Chatterjee, A.; Sarkar, C.; Adak, A.; Mukherjee, U.; Ghosh, S.K.; Raha, S. Ambient air quality during Diwali Festival over Kolkata-a mega-city in India. Aerosol Air Qual. Res. 2013, 13, 1133–1144. [Google Scholar] [CrossRef]
- Tanaka, T.; Inaba, R.; Aoyama, A. Noise and low-frequency sound levels due to aerial fireworks and prediction of the occupational exposure of pyrotechnicians to noise. J. Occup. Health 2016, 58, 593–601. [Google Scholar] [CrossRef]
- WHO. Air Quality, Energy and Health. 2025. Available online: https://www.who.int/teams/environment-climate-change-and-health/air-quality-and-health/health-impacts/types-of-pollutants (accessed on 17 March 2025).
- Mishra, M.; Boopathy, R.; Mallik, C.; Das, T. The Diwali festival: Short-term high effect of fireworks emissions on particulates and their associated empirically calculated health risk assessment at Bhubaneswar city. Environ. Geochem. Health 2024, 46, 21. [Google Scholar] [CrossRef]
- Orellano, P.; Reynoso, J.; Quaranta, N.; Bardach, A.; Ciapponi, A. Short-term exposure to particulate matter (PM10 and PM2. 5), nitrogen dioxide (NO2), and ozone (O3) and all-cause and cause-specific mortality: Systematic review and meta-analysis. Environ. Inter. 2020, 142, 105876. [Google Scholar] [CrossRef]
- Li, M.H.; Fan, L.C.; Mao, B.; Yang, J.W.; Choi, A.M.; Cao, W.J.; Xu, J.F. Short-term exposure to ambient fine particulate matter increases hospitalizations and mortality in COPD: A systematic review and meta-analysis. Chest 2016, 149, 447–458. [Google Scholar] [CrossRef]
- Galeano-Páez, C.; Brango, H.; Pastor-Sierra, K.; Coneo-Pretelt, A.; Arteaga-Arroyo, G.; Peñata-Taborda, A.; Espitia-Pérez, P.; Ricardo-Caldera, D.; Humanez-Álvarez, A.; Londoño-Velasco, E.; et al. Genotoxicity and Cytotoxicity Induced In Vitro by Airborne Particulate Matter (PM2.5) from an Open-Cast Coal Mining Area. Atmosphere 2024, 15, 1420. [Google Scholar] [CrossRef]
- Tavangar, F.Z.; Javeri, Z.; Nikaeen, M.; Sharafi, M.; Mohammadi, F.; Karimi, H.; Nafez, A.H. Cytotoxicity and genotoxicity of fine particulate matter (PM2.5): A polluted city experiencing Middle East dust events. Air Qual. Atmos. Health 2024, 17, 789–798. [Google Scholar] [CrossRef]
- Yan, Z.; Ge, P.; Lu, Z.; Liu, X.; Cao, M.; Chen, W.; Chen, M. The Cytotoxic Effects of Fine Particulate Matter (PM2.5) from Different Sources at the Air–Liquid Interface Exposure on A549 Cells. Toxics 2024, 12, 21. [Google Scholar] [CrossRef]
- Roy, R.; Jan, R.; Bhor, R.; Pai, K.; Satsangi, P.G. Size-fractionated ambient particulate matter induce toxicity: Oxidative potential, cytotoxic effect and inflammatory potential. Atmos. Environ. 2023, 312, 120032. [Google Scholar] [CrossRef]
- Zhang, D.; Li, H.; Luo, X.S.; Huang, W.; Pang, Y.; Yang, J.; Tang, M.; Mehmood, T.; Zhao, Z. Toxicity assessment and heavy metal components of inhalable particulate matters (PM2.5 & PM10) during a dust storm invading the city. Process Saf. Environ. Prot. 2022, 162, 859–866. [Google Scholar] [CrossRef]
- Estonilo, M.K.G.; Cazeñas, J.A.; Villafuerte, C.J.; Deocaris, C.; Caraos, G.; Robles, G.J.; Galvez, M.C.; Asaad, C.; Vallar, E. Genotoxicity of PM2.5 and PM1.0 Particulates on Human Peripheral Blood Lymphocytes in Manila, Philippines. Atmosphere 2022, 13, 6. [Google Scholar] [CrossRef]
- Ooi, T.C.; Ezza, N.; Siew, E.L.; Sharif, R.; Jamhari, A.A.; Rajab, N.F. Mammalian Lung Cell Cytotoxicity and Genotoxicity Evaluation of Organic and Inorganic PM 1 and PM 0.1 of Urban Air at UKM, Malaysia. Malays. J. Med. Health Sci. 2023, 19, 45–51. [Google Scholar]
- District Industrial Profile 2022-23. Available online: http://www.sisikolkata.gov.in/uploads/2021/03/districtprofiles/2022-23/malda.pdf (accessed on 16 December 2024).
- Maldah (Malda District) District—Population 2011–2024. Available online: https://www.census2011.co.in/census/district/6-maldah.html (accessed on 26 December 2024).
- Malda, West Bengal. Available online: https://initially.fandom.com/wiki/Malda,_West_Bengal#cite_note-1 (accessed on 16 December 2024).
- Das, S.; Sarkar, A. Utilization of mango plants (Mangifera indica L.) as in situ bio-monitoring tool against vehicular air pollution along National and State Highways: A case study from Malda district, West Bengal, India. J. Biol. Today’s World 2022, 11, 1–4. [Google Scholar]
- Das, S.; Roy, A.; Masiwal, R.; Mandal, M.; Popek, R.; Chakraborty, M.; Prasad, D.; Chyliński, F.; Awasthi, A.; Sarkar, A. Comprehensive Analysis of PM1 Composition in the Eastern Indo-Gangetic Basin: A Three-Year Urban Study. Sustainability 2023, 15, 14894. [Google Scholar] [CrossRef]
- Jacobs, M.B.; Hochheiser, S. Continuous sampling and ultra micro determination of nitrogen dioxide in air. Anal. Chem. 1958, 30, 426–428. [Google Scholar] [CrossRef]
- West, P.W.; Gaeke, G.C. Fixation of sulfur dioxide as disulfitomercurate (II) and subsequent colorimetric estimation. Anal. Chem. 1956, 28, 1816–1819. [Google Scholar] [CrossRef]
- Byers, D.H.; Saltzman, B.E. Determination of ozone in air by neutral and alkaline iodide procedures. Amer. Indus. Hyg. Assoc. J. 1958, 19, 251–257. [Google Scholar] [CrossRef]
- Central Pollution Control Board, Ministry of Environment & Forests, Government of India, Guidelines for the Measurement of Ambient Air Pollutants. Available online: https://cpcb.nic.in/openpdffile.php?id=UmVwb3J0RmlsZXMvMjdfMTQ1ODExMDQyNl9OZXdJdGVtXzE5Nl9OQUFRTVNfVm9sdW1lLUkucGRm (accessed on 24 March 2024).
- Das, S.; Barman, C.; Roy, A.; Mandal, M.; Popek, R.; Adit, A.; Sarkar, A. Air pollution may alter reproductive dynamics/efficacy in plants: Correlative evidences from an urban sprawl in Eastern Indo-Gangetic plain. Aerobiologia 2024, 41, 35–53. [Google Scholar] [CrossRef]
- Roy, A.; Das, S.; Singh, P.; Mandal, M.; Kumar, M.; Rajlaxmi, A.; Vijayan, N.; Awasthi, A.; Chhetri, H.; Roy, S.; et al. Summer-Time Monitoring and Source Apportionment Study of Both Coarse, Fine, and Ultra-Fine Particulate Pollution in Eastern Himalayan Darjeeling: A Hint to Health Risk During Peak Tourist Season. MAPAN J. Metrol. Soc. India 2024, 39, 995–1009. [Google Scholar] [CrossRef]
- The Statistial Offices. Warszawie. 2025. Available online: https://warszawa.stat.gov.pl/warszawa/ (accessed on 12 January 2025).
- Holnicki, P.; Tainio, M.; Kałuszko, A.; Nahorski, Z. Burden of mortality and disease attributable to multiple air pollutants in Warsaw, Poland. Inter. J. Environ. Res. Public Health 2017, 14, 1359. [Google Scholar] [CrossRef] [PubMed]
- Starzomska, A.; Strużewska, J. A six-year measurement-based analysis of traffic-related particulate matter pollution in urban areas: The case of Warsaw, Poland (2016–2021). Arch. Environ. Prot. 2024, 50, 75–84. [Google Scholar] [CrossRef]
- Carrara, E.R.; Lopes, P.S.; Reis, A.C.Z.; Silva, J.X.; Dias, L.C.D.C.M.; Schultz, É.B.; Marques, D.B.D.; da Silva, D.A.; Veroneze, R.; Andrade, R.G.; et al. NASA POWER satellite meteorological system is a good tool for obtaining estimates of the temperature-humidity index under Brazilian conditions compared to INMET weather stations data. Inter. J. Biometeorol. 2023, 67, 1273–1277. [Google Scholar] [CrossRef]
- Aboelkhair, H.; Morsy, M.; El Afandi, G. Assessment of agroclimatology NASA POWER reanalysis datasets for temperature types and relative humidity at 2 m against ground observations over Egypt. Adv. Space Res. 2019, 64, 129–142. [Google Scholar] [CrossRef]
- Kumar, S.; Dwivedi, S.K. Assessment of air quality in Lucknow, India during the festival of Diwali for four successive years amid the COVID-19 pandemic lockdown. Phys. Chem. Earth 2023, 131, 103439. [Google Scholar] [CrossRef]
- Central Pollution Control Board. Air Quality Index (AQI) Report; Central Pollution Control Board: New Delhi, India, 2012; Available online: https://cpcb.nic.in/openpdffile.php?id=UmVwb3J0RmlsZXMvMTI5OF8xNjI4NjY0MzY3X21lZGlhcGhvdG8yMDg3NS5wZGY= (accessed on 19 March 2025).
- Hayes, R.B.; Lim, C.; Zhang, Y.; Cromar, K.; Shao, Y.; Reynolds, H.; Silverman, D.T.; Jones, R.R.; Park, Y.; Jerrett, M.; et al. PM2.5 air pollution and cause-specific cardiovascular disease mortality. Int. J. Epidemiol. 2019, 49, 25–35. [Google Scholar] [CrossRef]
- Thangavel, P.; Park, D.; Lee, Y.C. Recent Insights into Particulate Matter (PM2.5)-Mediated Toxicity in Humans: An Overview. Int. J. Environ. Res. Public Health 2022, 19, 7511. [Google Scholar] [CrossRef]
- Du, L.; Wang, Y.; Wu, Z.; Hou, C.; Mao, H.; Li, T.; Nie, X. PM2.5-Bound Toxic Elements in an Urban City in East China: Concentrations, Sources, and Health Risks. Int. J. Environ. Res. Public Health 2019, 16, 164. [Google Scholar] [CrossRef]
- EPA. Risk Assessment Guidance for Superfund. Volume I: Human Health Evaluation Manual (Part A); EPA/540/1-89/002; United States Environmental Protection Agency (USEPA): Washington, DC, USA, 1989. Available online: http://www.epa.gov/oswer/riskassessment/ragsa/ (accessed on 20 March 2024).
- Kissel, J.C. Exposure Science: Dermal Contact. In Encyclopedia of Environmental Health, 2nd ed.; Elsevier: Amsterdam, The Netherlands, 2019; pp. 816–822. [Google Scholar] [CrossRef]
- EPA. Risk Assessment Guidance for Superfund Volume I: Human Health Evaluation Manual (Part E, Supplemental Guidance for Dermal Risk Assessment); Office of Superfund Remediation and Technology Innovation: Washington, DC, USA, 2004. Available online: http://www.epa.gov/oswer/riskassessment/ragse/index.htm (accessed on 20 March 2024).
- Risk Assessment Guidance for Superfund Volume I: Human Health Evaluation Manual. Part F: Supplemental Guidance for Inhalation Risk Assessment. Available online: http://www.epa.gov/oswer/riskassessment/ragsf/index.htm (accessed on 20 March 2024).
- Regional Screening Level Equations. Available online: https://www.epa.gov/risk/regional-screening-levels-rsls-equations-may-2016. (accessed on 21 March 2024).
- Jena, S.; Singh, G. Human health risk assessment of airborne trace elements in Dhanbad, India. Atmos. Pollut. Res. 2017, 8, 490–502. [Google Scholar] [CrossRef]
- Regional Screening Levels (RSLs)—Generic Tables (2023). Available online: http://www.epa.gov/region9/superfund/prg/index.html (accessed on 21 March 2024).
- Tasić, M.; Rajšić, S.; Tomašević, M.; Mijić, Z.; Aničić, M.; Novaković, V.; Marković, M.D.; Marković, A.D.; Lazić, L.; Radenković, M.; et al. Assessment of air quality in an urban area of Belgrade, Serbia. In Environmental Technologies, New Developments; I-Tech Education and Publishing: Vienna, Austria, 2008; pp. 209–244. [Google Scholar] [CrossRef]
- Kayee, J.; Sompongchaiyakul, P.; Sanwlani, N.; Bureekul, S.; Wang, X.; Das, R. Metal concentrations and source apportionment of PM2. 5 in Chiang Rai and Bangkok, Thailand during a biomass burning season. ACS Earth Space Chem. 2020, 4, 1213–1226. [Google Scholar] [CrossRef]
- Stein, A.F.; Draxler, R.R.; Rolph, G.D.; Stunder, B.J.B.; Cohen, M.D.; Ngan, F. NOAA’s HYSPLIT Atmospheric Transport and Dispersion Modeling System. Bull. Am. Meteorol. Soc. 2015, 96, 2059–2077. [Google Scholar] [CrossRef]
- Ambade, B. The air pollution during Diwali festival by the burning of fireworks in Jamshedpur city, India. Urban Climb 2018, 26, 149–160. [Google Scholar] [CrossRef]
- Mandal, J.; Chanda, A.; Samanta, S. Air pollution in three megacities of India during the Diwali festival amidst COVID-19 pandemic. Sustain. Cities Soc. 2022, 76, 103504. [Google Scholar] [CrossRef]
- What Is Ozone? USEPA. Available online: https://www.epa.gov/ozone-pollution-and-your-patients-health/what-ozone (accessed on 6 April 2024).
- Nanda, C.; Kant, Y.; Gupta, A.; Mitra, D. Spatio-temporal distribution of pollutant trace gases during diwali over india. ISPRS Ann. Photogramm. Remote Sens. Spat. Inf. Sci. 2018, 4, 339–350. [Google Scholar] [CrossRef]
- Attri, A.; Kumar, U.; Jain, V. Formation of ozone by fireworks. Nature 2001, 411, 1015. [Google Scholar] [CrossRef]
- Chhabra, A.; Turakhia, T.; Sharma, S.; Saha, S.; Iyer, R.; Chauhan, P. Environmental impacts of fireworks on aerosol characteristics and radiative properties over a mega city, India. City Environ. Inter. 2020, 7, 100049. [Google Scholar] [CrossRef]
- Saxena, P.; Srivastava, A.; Verma, S.; Shweta; Singh, L.; Sonwani, S. Analysis of Atmospheric Pollutants During Fireworks Festival ‘Diwali’ at a Residential Site Delhi in India. In Measurement, Analysis and Remediation of Environmental Pollutants; Gupta, T., Singh, S., Rajput, P., Agarwal, A., Eds.; Energy, Environment, and Sustainability; Springer: Singapore, 2020; pp. 91–100. [Google Scholar] [CrossRef]
- Mandal, P.; Prakash, M.; Bassin, J.K. Impact of Diwali celebrations on urban air and noise quality in Delhi City, India. Environ. Monit. Assess. 2012, 184, 209–215. [Google Scholar] [CrossRef]
- Ganguly, N.D.; Tzanis, C.G.; Philippopoulos, K.; Deligiorgi, D. Analysis of a severe air pollution episode in India during Diwali festival-a nationwide approach. Atmósfera 2019, 32, 225–236. [Google Scholar] [CrossRef]
- Drewnick, F.; Hings, S.S.; Curtius, J.; Eerdekens, G.; Williams, J. Measurement of fine particulate and gas-phase species during the New Year’s fireworks 2005 in Mainz, Germany. Atmos. Environ. 2006, 40, 4316–4327. [Google Scholar] [CrossRef]
- Iľko, I.; Peterková, V.; Maniak, J.; Štefánik, D. The Impact of the New Year Celebration on the Air-Pollution in Slovakia. J. Environ. Earth Sci. 2024, 6, 232–281. [Google Scholar] [CrossRef]
- Li, Y.; Li, R.; Wang, S.; Wei, W. Fireworks celebrations and air pollution: Evidence from Chinese Lunar New Year. J. Environ. Plan. Manag. 2023, 68, 640–660. [Google Scholar] [CrossRef]
- Mcgregor, G.R. Basic meteorology. In Air Pollution and Health; Academic Press: Cambridge, MA, USA, 1999; pp. 21–49. [Google Scholar] [CrossRef]
- Mukherjee, S.; Dutta, M.; Ghosh, A.; Chatterjee, A. A year-long study on PM2.5 and its carbonaceous components over eastern Himalaya in India: Contributions of local and transported fossil fuel and biomass burning during premonsoon. Environ. Res. 2022, 212, 113546. [Google Scholar] [CrossRef] [PubMed]
- Tiwari, S.; Thomas, A.; Rao, P.; Chate, D.M.; Soni, V.K.; Singh, S.; Hopke, P.K. Pollution concentrations in Delhi India during winter 2015–16: A case study of an odd-even vehicle strategy. Atmos. Pollut. Res. 2018, 9, 1137–1145. [Google Scholar] [CrossRef]
- Cichowicz, R.; Wielgosiński, G.; Fetter, W. Dispersion of atmospheric air pollution in summer and winter season. Environ. Monit. Assess. 2017, 189, 605. [Google Scholar] [CrossRef]
- Ravindra, K.; Singh, T.; Mor, S.; Singh, V.; Mandal, T.K.; Bhatti, M.S.; Beig, G. Real-time monitoring of air pollutants in seven cities of North India during crop residue burning and their relationship with meteorology and transboundary movement of air. Sci. Total Environ. 2019, 690, 717–729. [Google Scholar] [CrossRef]
- Shuangchen, M.; Jin, C.; Kunling, J.; Lan, M.; Sijie, Z.; Kai, W. Environmental influence and countermeasures for high humidity flue gas discharging from power plants. Renew. Sustain. Energy Rev. 2017, 73, 225–235. [Google Scholar] [CrossRef]
- Zhong, J.; Zhang, X.; Dong, Y.; Wang, Y.; Liu, C.; Wang, J.; Zhang, Y.; Che, H. Feedback effects of boundary-layer meteorological factors on cumulative explosive growth of PM 2.5 during winter heavy pollution episodes in Beijing from 2013 to 2016. Atmos. Chem. Phys. 2018, 18, 247–258. [Google Scholar] [CrossRef]
- Murthy, B.S.; Latha, R.; Tiwari, A.; Rathod, A.; Singh, S.; Beig, G. Impact of mixing layer height on air quality in winter. J. Atmos. Sol. Terres. Phys. 2020, 197, 105157. [Google Scholar] [CrossRef]
- Flowerday, C.E.; Stanley, R.S.; Lawson, J.R.; Snow, G.L.; Brewster, K.; Goates, S.R.; Paxton, W.F.; Hansen, J.C. A ten-year historical analysis of urban PM10 and exceedance filters along the Northern Wasatch Front, UT, USA. Sci. Total Environ. 2025, 959, 178202. [Google Scholar] [CrossRef]
- Atabi, F.; Mirzahosseini, S.A.H. GIS-based assessment of cancer risk due to benzene in Tehran ambient air. Inter. J. Occup. Med. Environ. Health 2013, 26, 770–779. [Google Scholar] [CrossRef]
- Kanchan, K.; Gorai, A.K.; Goyal, P. A Review on Air Quality Indexing System. Asian J. Atmos. Environ. 2015, 9, 101–113. [Google Scholar] [CrossRef]
- STATUS OF AMBIENT NOISE LEVEL IN INDIA 2016, CPCB. Available online: https://cpcb.nic.in/noise_data/Noise_Report_2016.pdf (accessed on 11 April 2024).
- Banerjee, D.; Niyogi, B.K. Assessment of noise pollution in Asansol during Kali Puja festival. Indian J. Environ. Ecoplan. 2007, 14, 517–520. [Google Scholar]
- Mahecha, G.S.; Bamniya, B.R.; Kapasya, V.; Meena, R.S. Noise pollution monitoring during Diwali festival in Golden city Jaisalmer of Rajasthan, India. Environmentalist 2012, 32, 415–419. [Google Scholar] [CrossRef]
- Perrino, C.; Tiwari, S.; Catrambone, M.; Dalla Torre, S.; Rantica, E.; Canepari, S. Chemical characterization of atmospheric PM in Delhi, India, during different periods of the year including Diwali festival. Atmos. Pollut. Res. 2011, 2, 418–427. [Google Scholar] [CrossRef]
- Yilmaz, E.; Karaman, E. Functional crackers: Incorporation of the dietary fibers extracted from citrus seeds. J. Food Sci. Technol. 2017, 54, 3208–3217. [Google Scholar] [CrossRef]
- Tandon, A.; Yadav, S.; Attri, A.K. City-wide sweeping a source for respirable particulate matter in the atmosphere. Atmos. Environ. 2008, 42, 1064–1069. [Google Scholar] [CrossRef]
- Singh, D.P.; Gadi, R.; Mandal, T.K.; Dixit, C.K.; Singh, K.; Saud, T.; Singh, N.; Gupta, P.K. Study of temporal variation in ambient air quality during Diwali festival in India. Environ. Monit. Assess. 2010, 169, 1–13. [Google Scholar] [CrossRef]
- Arsenic, WHO. Available online: https://www.who.int/news-room/fact-sheets/detail/arsenic (accessed on 12 April 2024).
- Mao, S.; Li, S.; Wang, C.; Liu, Y.; Li, N.; Liu, F.; Huang, S.; Liu, S.; Lu, Y.; Mao, Z.; et al. Is long-term PM1 exposure associated with blood lipids and dyslipidemias in a Chinese rural population? Environ. Inter. 2020, 138, 105637. [Google Scholar] [CrossRef]
- Asif, M.; Bhatti, M.S.; Dhuria, R.S.; Yadav, S. Source apportionment of metal ions in ambient air (PM2.5) during firecracker bursting: A case study of Amritsar Diwali on 24 October 2022. Urban Clim. 2024, 53, 101796. [Google Scholar] [CrossRef]


Disclaimer/Publisher’s Note: The statements, opinions and data contained in all publications are solely those of the individual author(s) and contributor(s) and not of MDPI and/or the editor(s). MDPI and/or the editor(s) disclaim responsibility for any injury to people or property resulting from any ideas, methods, instructions or products referred to in the content. |
© 2025 by the authors. Licensee MDPI, Basel, Switzerland. This article is an open access article distributed under the terms and conditions of the Creative Commons Attribution (CC BY) license (https://creativecommons.org/licenses/by/4.0/).