Article

Simultaneous Determination of Six Common Microplastics by a Domestic Py-GC/MS

1
Shanghai Key Laboratory of Atmospheric Particle Pollution and Prevention (LAP3), National Observations and Research Station for Wetland Ecosystems of the Yangtze Estuary, Department of Environmental Science and Engineering, Fudan University, Shanghai 200438, China
2
ThermoFisher Scientific China, Shanghai 201203, China
3
Institute of Eco-Chongming (IEC), Chongming District, Shanghai 202162, China
*
Author to whom correspondence should be addressed.
Atmosphere 2025, 16(4), 476; https://doi.org/10.3390/atmos16040476
Submission received: 19 March 2025 / Revised: 14 April 2025 / Accepted: 16 April 2025 / Published: 19 April 2025

Abstract

:
Pyrolysis coupled with gas chromatography–mass spectrometry (Py-GC/MS) is a novel technology capable of detecting micro- and nanoplastics without a size limit. However, the application of Py-GC/MS to airborne microplastic analysis remains inconsistent. This study explores optimal Py-GC/MS procedures using a domestic HenxiTM PY-1S pyrolyzer-based Py-GC/MS. The initial weight loss of PVC occurs at approximately 260 °C, indicating that the maximum thermal desorption temperature prior to pyrolysis should not exceed 250 °C. To avoid interference from semi-volatile organics present in the sample and injected air, it is essential to purge the sample with pure helium at elevated temperatures before pyrolysis. Microplastic standards can be prepared by ultrasonicating a water–microplastic dispersion system. Significant interactions between microplastic mixtures were observed during co-pyrolysis, indicating that the interactions of mixtures cannot be ignored during the optimization of quantitative references. The optimal procedure features good linearity (R2 > 0.98), low detection limit (0.06~0.0002 μg), and acceptable precisions (RSD < 10% in 8 days). Microplastics determined by the domestic PY-1S pyrolyzer coupled with a GC/MS system are comparable to those of the well-established PY-3030D-based Py-GC/MS, indicating that the domestic pyrolyzer coupled with GC/MS is a reliable and powerful tool for microplastic analysis.

1. Introduction

Microplastics (MPs), defined as plastic particles smaller than 5 mm, pose a significant environmental challenge. Due to their low cost and versatile properties, plastics are widely used across various sectors such as food packaging, textiles, and consumer products. The increasing production and consumption of plastics contribute to the proliferation of plastic waste, with global estimates of 270 million tons by 2060 [1]. Plastics degrade into microparticles through environmental processes such as ultraviolet radiation, mechanical abrasion, and microbial activity. Due to their low density and high resistance to degradation, microplastics can spread worldwide through ocean currents and atmospheric transport, leading to widespread environmental impacts [2].
Microplastics have been detected in rivers [3], oceans [4], and atmosphere [5,6]. A recent study showed that the average concentration of microplastics in PM2.5 (particulate matter less than 2.5 μm in aerodynamic diameter) reached 5.6 μg m−3 in Shanghai [7]. The presence of microplastics in the environment raises concerns due to their potential adverse effects on ecosystems and organisms. Previous studies suggested that microplastics might act as vectors for pathogens and viruses and accumulate in various organisms’ tissues and organs after ingestion or inhalation [8,9]. Notably, the annual inhalation of microplastic particles exceeds the dietary intake for adults [10]. Laboratory studies have shown that inhaled airborne microplastics can induce nasal and lung microbial imbalance [11], impair lung function through lung microbiota/TLR4-mediated iron homeostasis imbalance [12], and accelerate aging of human lung epithelial cells and mouse lungs by inducing ROS signaling [13], posing a serious threat to human health.
Micro-Fourier transform infrared spectroscopy (μ-FTIR) is a valuable tool for identifying microplastics by measuring the absorption of infrared light by their molecular bonds. μ-FTIR has been extensively applied to determine microplastics in atmospheric environments [14,15,16] and the respiratory systems of humans and animals [17,18,19]. However, due to its detection limitations, μ-FTIR may struggle to accurately detect microplastics and nanoplastics in PM2.5, posing challenges in assessing their potential adverse effects on ecosystems and human health [20,21,22,23].
Pyrolysis is the thermal degradation of organic matter and microplastics at higher temperatures in an inert atmosphere [24]. Pyrolysis-gas chromatography/mass spectrometry (Py-GC/MS) has been developed to characterize microplastics in ambient samples [25,26,27,28]. In the Py-GC/MS system, microplastics are first broken down into many simple molecules via pyrolysis and then resolved through their characteristic pyrolysates in GC/MS. As a thermoanalytical method for determining the mass concentration of nano- and microplastics, Py-GC/MS offers a powerful tool for quantifying microplastics without a lower size limit [29]. Recently, Sheng et al. [28] proposed a Py-GC/MS method for determining the concentration of polystyrene in PM1.0. Luo et al. [20] developed a novel Py-GC/MS/MS strategy to quantify polyethylene in PM2.5. However, the Py-GC/MS method for aerosol microplastics remains controversial, particularly regarding the thermal program, quantitative indicator, and calibrant preparation [29].
The most commonly used pyrolyzer is the EGA/PY-3030D from Frontier Laboratories Ltd. (Fukushima, Japan [7,28,30,31,32,33,34]. Other types of pyrolyzers, such as the PYRO from Gerstel (Mülheim, Germany) [35] and the Pyroprobes 5150 and 6150 from CDS Analytical (Oxford, MS, USA) [23,36], have also been employed for microplastic determination. Recently, a cost-effective furnace-type pyrolyzer has been developed by Shanghai Henxi Scientific Instrument Company (Shanghai, China). This study investigates the optimal Py-GC/MS procedures using the domestic pyrolyzer in China coupled with a GC/MS system (ISQ 7610, Thermo Scientific, Waltham, MA, USA).

2. Materials and Methods

2.1. Reagents

Microplastic standards are commercial powders. Polystyrene (PS, 3 μm), and polymethyl methacrylate (PMMA, 6 μm) were purchased from Ruixiang Plasticization Company (Dongguan, China). Polyethylene terephthalate (PET, 10 μm), polyvinylchloride (PVC, 6 μm), and polyethylene (PE, 6 μm) were purchased from Huachuang Plastics Company (Dongguan, China). Polypropylene (PP, 48 μm) was purchased from Zhongxin Plastic Company (Dongguan, China). Unlike the study by Luo et al. [20] in which PE microparticles were dispersed in ethanol, the stock suspension was prepared by ultrasonically dispersing microplastics in Milli-Q water (18.2 MΩ cm−1) in this study.

2.2. Atmospheric Sampling

The PM2.5 sampling was conducted on the rooftop of the Fourth Teaching Building on the main campus of Fudan University (121.50° E, 31.3° N), which was approximately 20 m above the ground. The sampling site is located in the urban area of Shanghai, where commercial, residential, and traffic emissions are heavily mixed. Before sampling, Pallflex Tissuquartz air monitoring filters (Pall 7204, 8 in ×10 in) were heated at 450 °C for 6 h to remove possible impurities. An intelligent large-flow air particulate sampler (TH-1000CII, Wuhan Tianhong, Wuhan, China) was employed to collect PM2.5 samples at a flow rate of 1.05 m3 h−1, where ambient air was sampled directly into the PM2.5 impactor made of aluminum alloy followed by aerosols being collected on the quartz filter. The sampling period was from 19 to 25 March 2023, with daytime sampling from 6:00 a.m. to 5:00 p.m. and night sampling from 6:00 p.m. to 5:00 a.m. the next day. The collected PM2.5 samples were stored at −18 °C for analysis.

2.3. Thermogravimetric Analysis (TGA) of Microplastics

TAG measurements were conducted using a simultaneous thermal analyzer Discovery™ SDT 650 (TA Instruments, New Castle, DE, USA) with 5.140 mg PE, 6.087 mg PS, 3.469 mg PVC, 14.197 mg PET, 8.938 mg PP, and 7.147 mg PMMA microplastics in platinum pans. The samples were heated from 50 °C to 800 °C under a continuous flow of pure N2 gas at 50 mL min−1. The thermal decomposition procedure in this work was: first, the temperature was increased from 50 °C to 300 °C with a scan rate of 20 °C min−1, then the temperature was increased from 300 °C to 800 °C with a scan rate of 50 °C min−1 after being kept at 300 °C for 1 min.

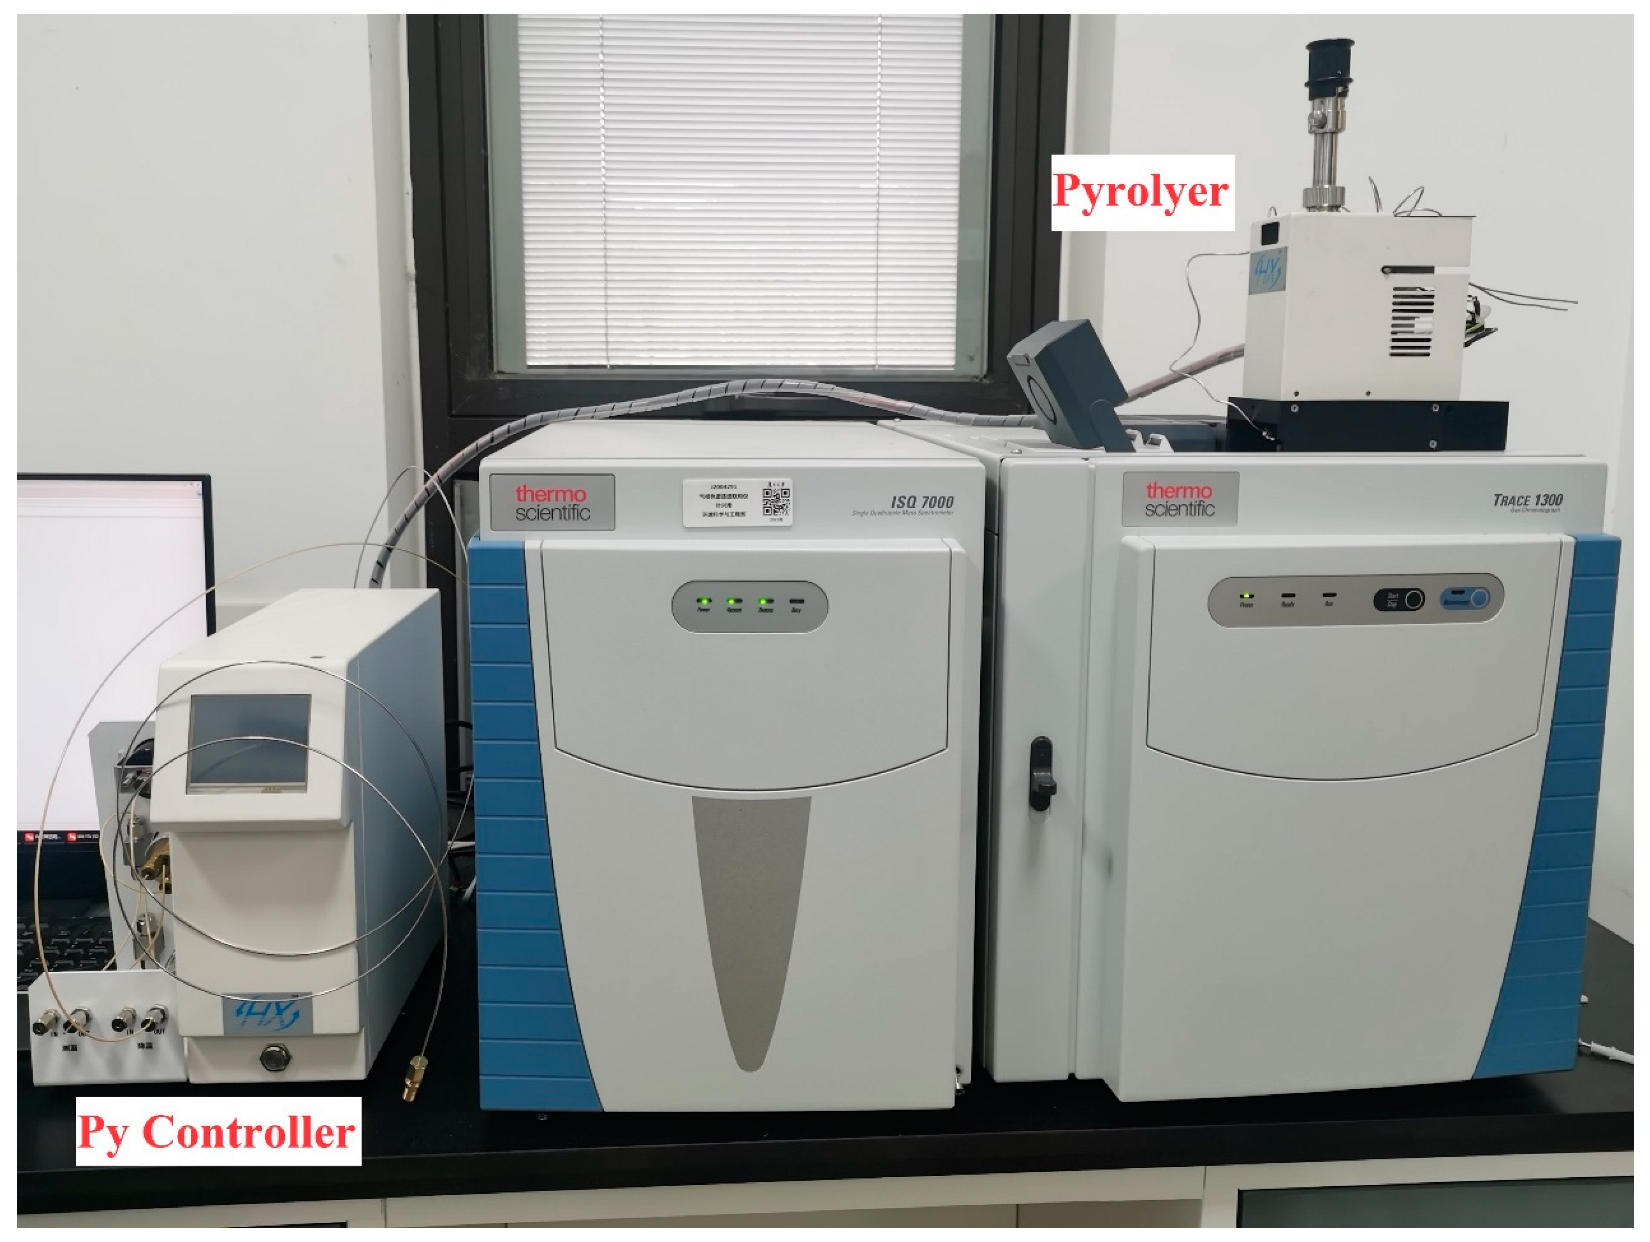
2.4. Py-GC/MS Analysis

The pyrolysis-GC/MS system used in this study consists of a Henxi PY-1S pyrolyzer (Shanghai, China) coupled with a Thermo Scientific ISQ 7610 single-quadrupole GC/MS (Figure 1). The pyrolyzer with a heating microfurnace is installed at the inlet of the GC front. Helium (He, a purity of 0.9999) serves as the carrier gas throughout the system. When a sample was introduced, the pyrolysis cup was initially suspended in the 90–100 °C preheating zone under He purging for 10 min and then the pyrolysis cup fell into the pyrolysis furnace, where the sample was thermally decomposed into low-molecular-weight gaseous compounds under He atmosphere. These pyrolysis products were immediately transferred to the GC column for separation followed by MS detection. To avoid the condensation of high-molecular-weight pyrolysates, temperatures of the pyrolyzer interface and the injection port of GC were set at 320 °C and 300 °C, respectively. Detailed instrumental parameters are summarized in Table 1. Microplastic standards were prepared by diluting the stock suspension under ultrasonic conditions. Prior to analysis, the microplastic standards with different concentrations were transferred to pyrolysis cups and then dried at 90 °C for 40 min to remove water. In contrast, 6 mm diameter discs were punched from a sheet of quartz filter containing PM2.5 and placed in the pyrolysis cup without pretreatment. To remove residual air and potential semi-volatile organics (e.g., benzene) in the sample, the pyrolysis cup was suspended in the 90–100 °C preheating zone under He purging for 10 min. Then the pyrolysis cup fell into the pyrolysis furnace for flash pyrolysis.

3. Results and Discussion

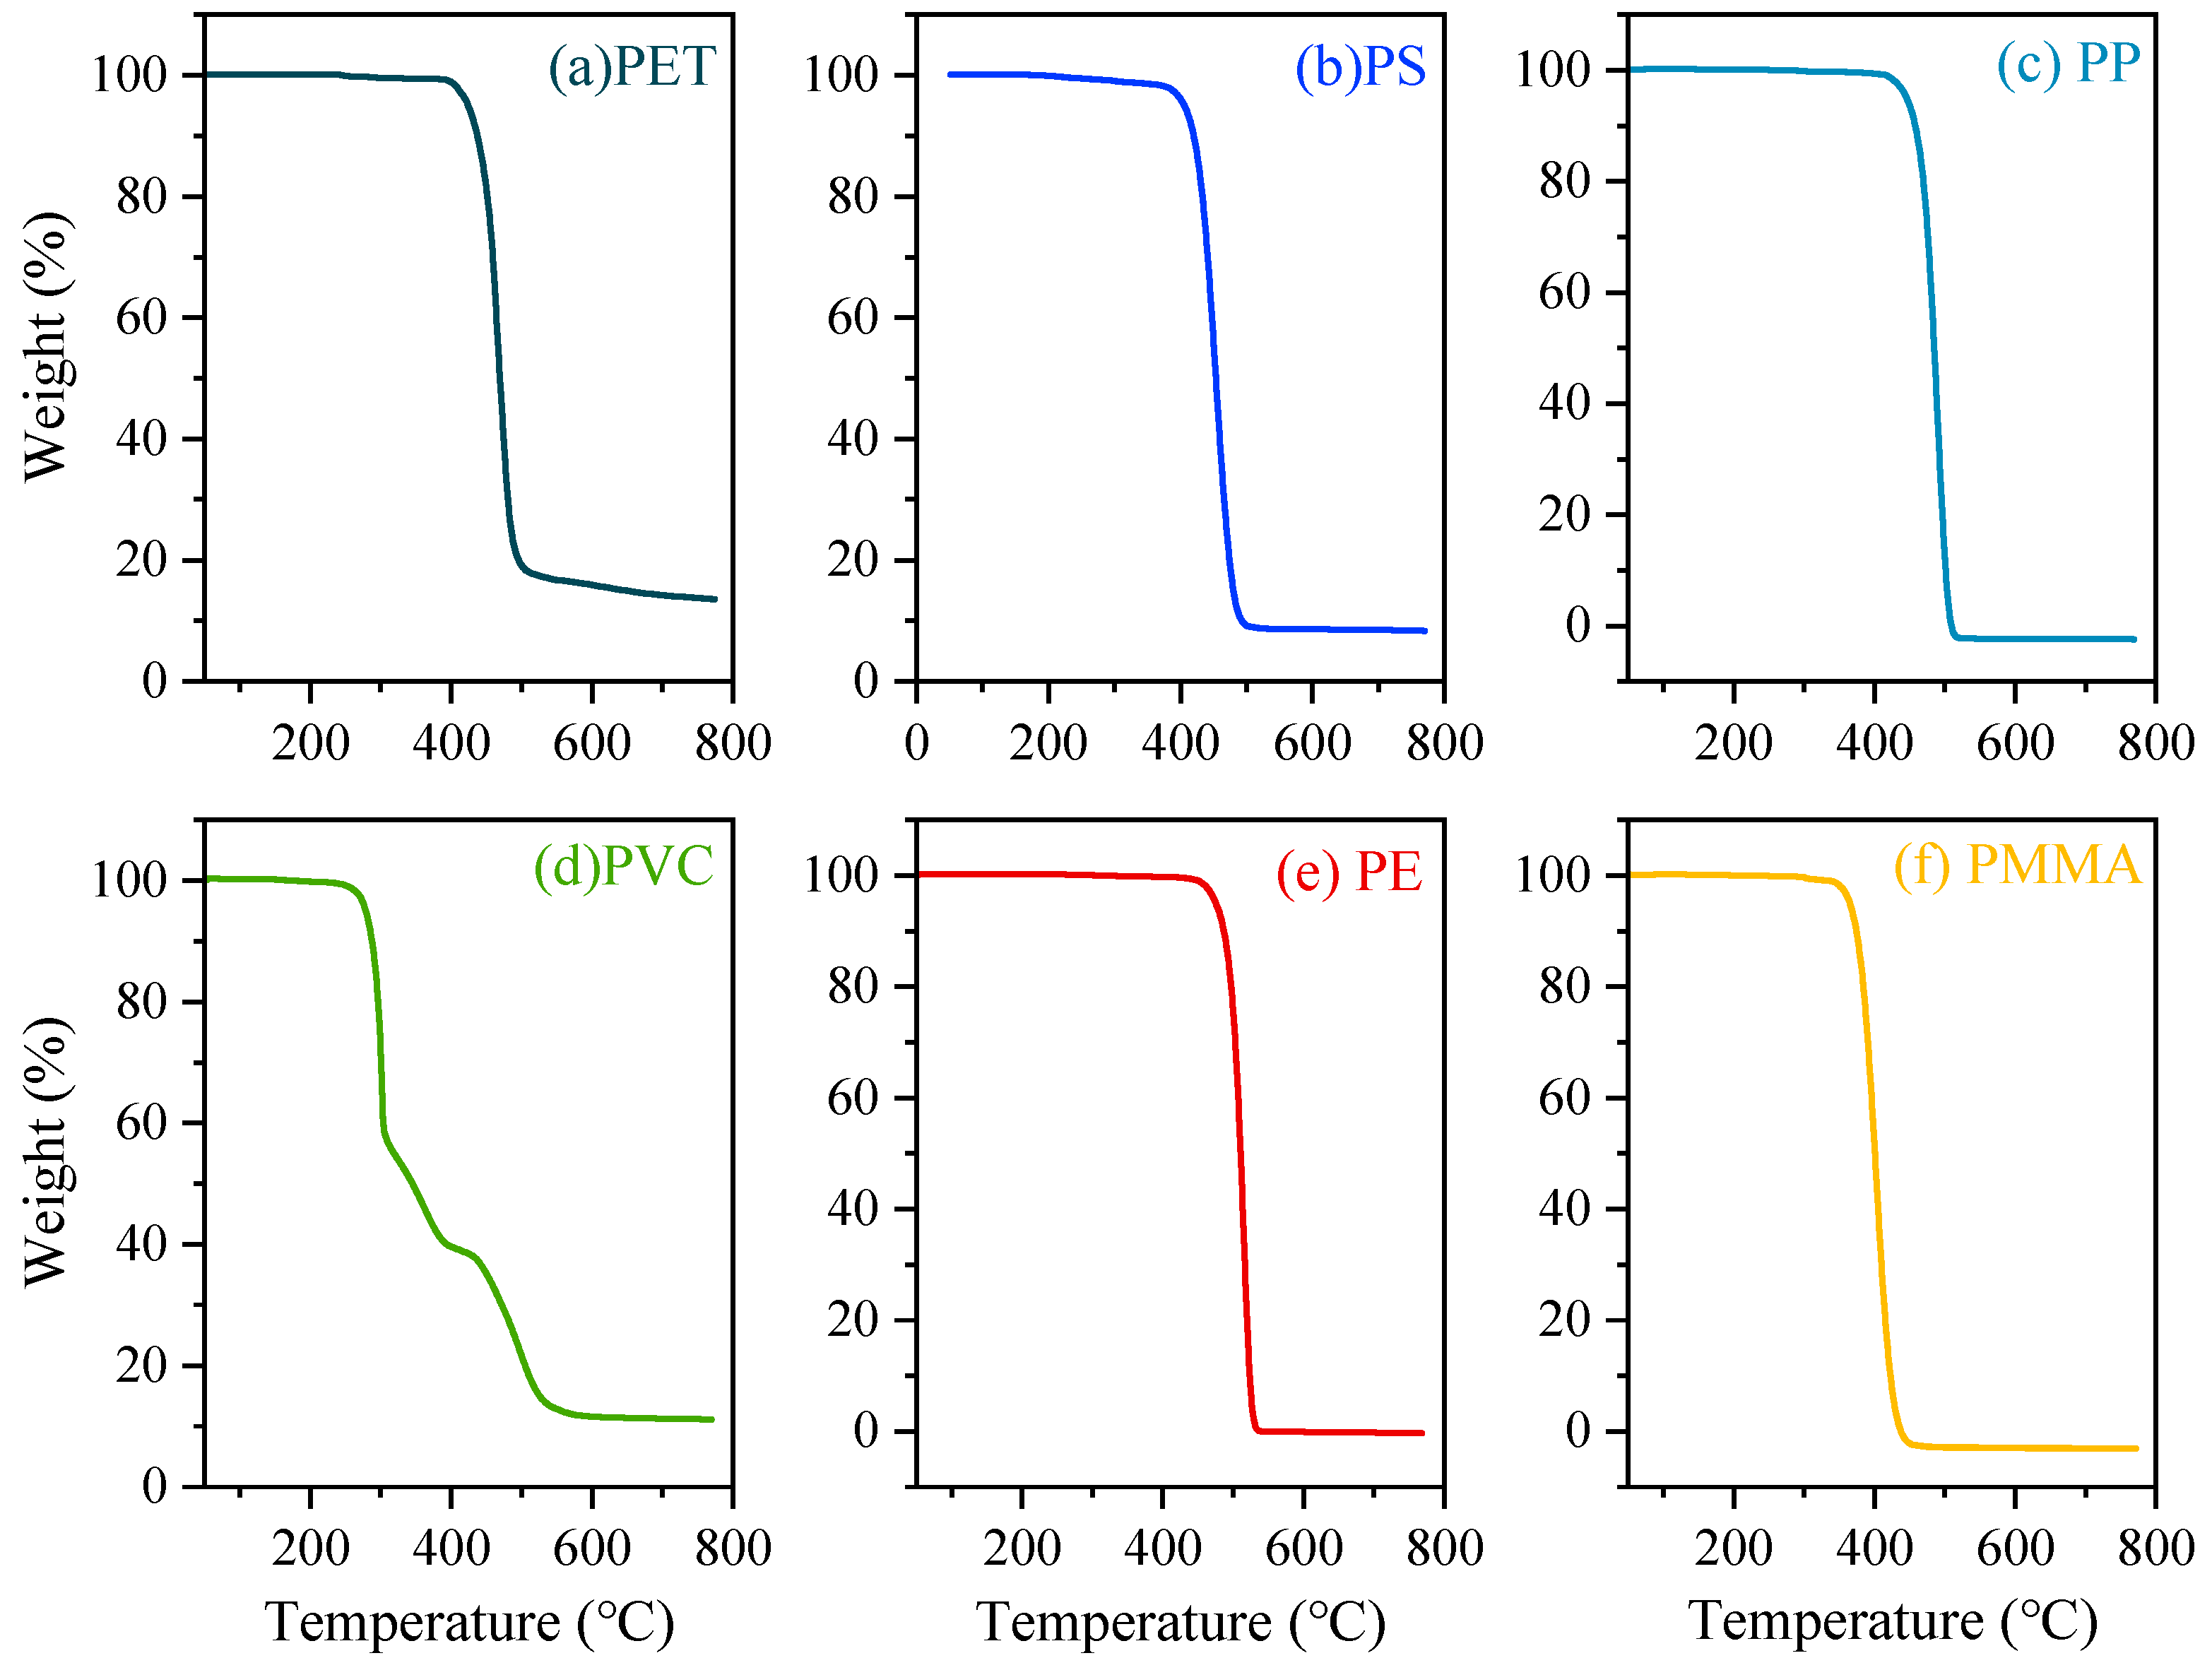
3.1. TGA Curves of Typical Microplastics

The pyrolysis temperature range was determined using thermogravimetric analysis. Figure 2 shows the weight loss profiles associated with microplastic decomposition. The thermal decomposition of PS, PE, PET, PP, and PMMA microparticles began above 350 °C. In contrast, the initial weight loss of PVC began at about 260 °C, and the remaining mass was less than 60% at 300 °C. Thermal desorption (TD) followed by flash pyrolysis was extensively applied for microplastic analysis, and the maximum TD temperature was often set at 300 °C [31,35]. These findings suggest that the maximum TD temperature in Py-GC/MS analysis should not exceed 250 °C when PVC is among the target analytes. Similarly, the pyrolysis temperature for the first shot should not exceed 250 °C when a two-shot method is used in the Py-GC/MS analysis. A full decomposition was observed below 550 °C for all micro-sized polymers, indicating that pyrolysis temperatures above 550 °C are suitable for the Py-GC/MS identification of microplastics.

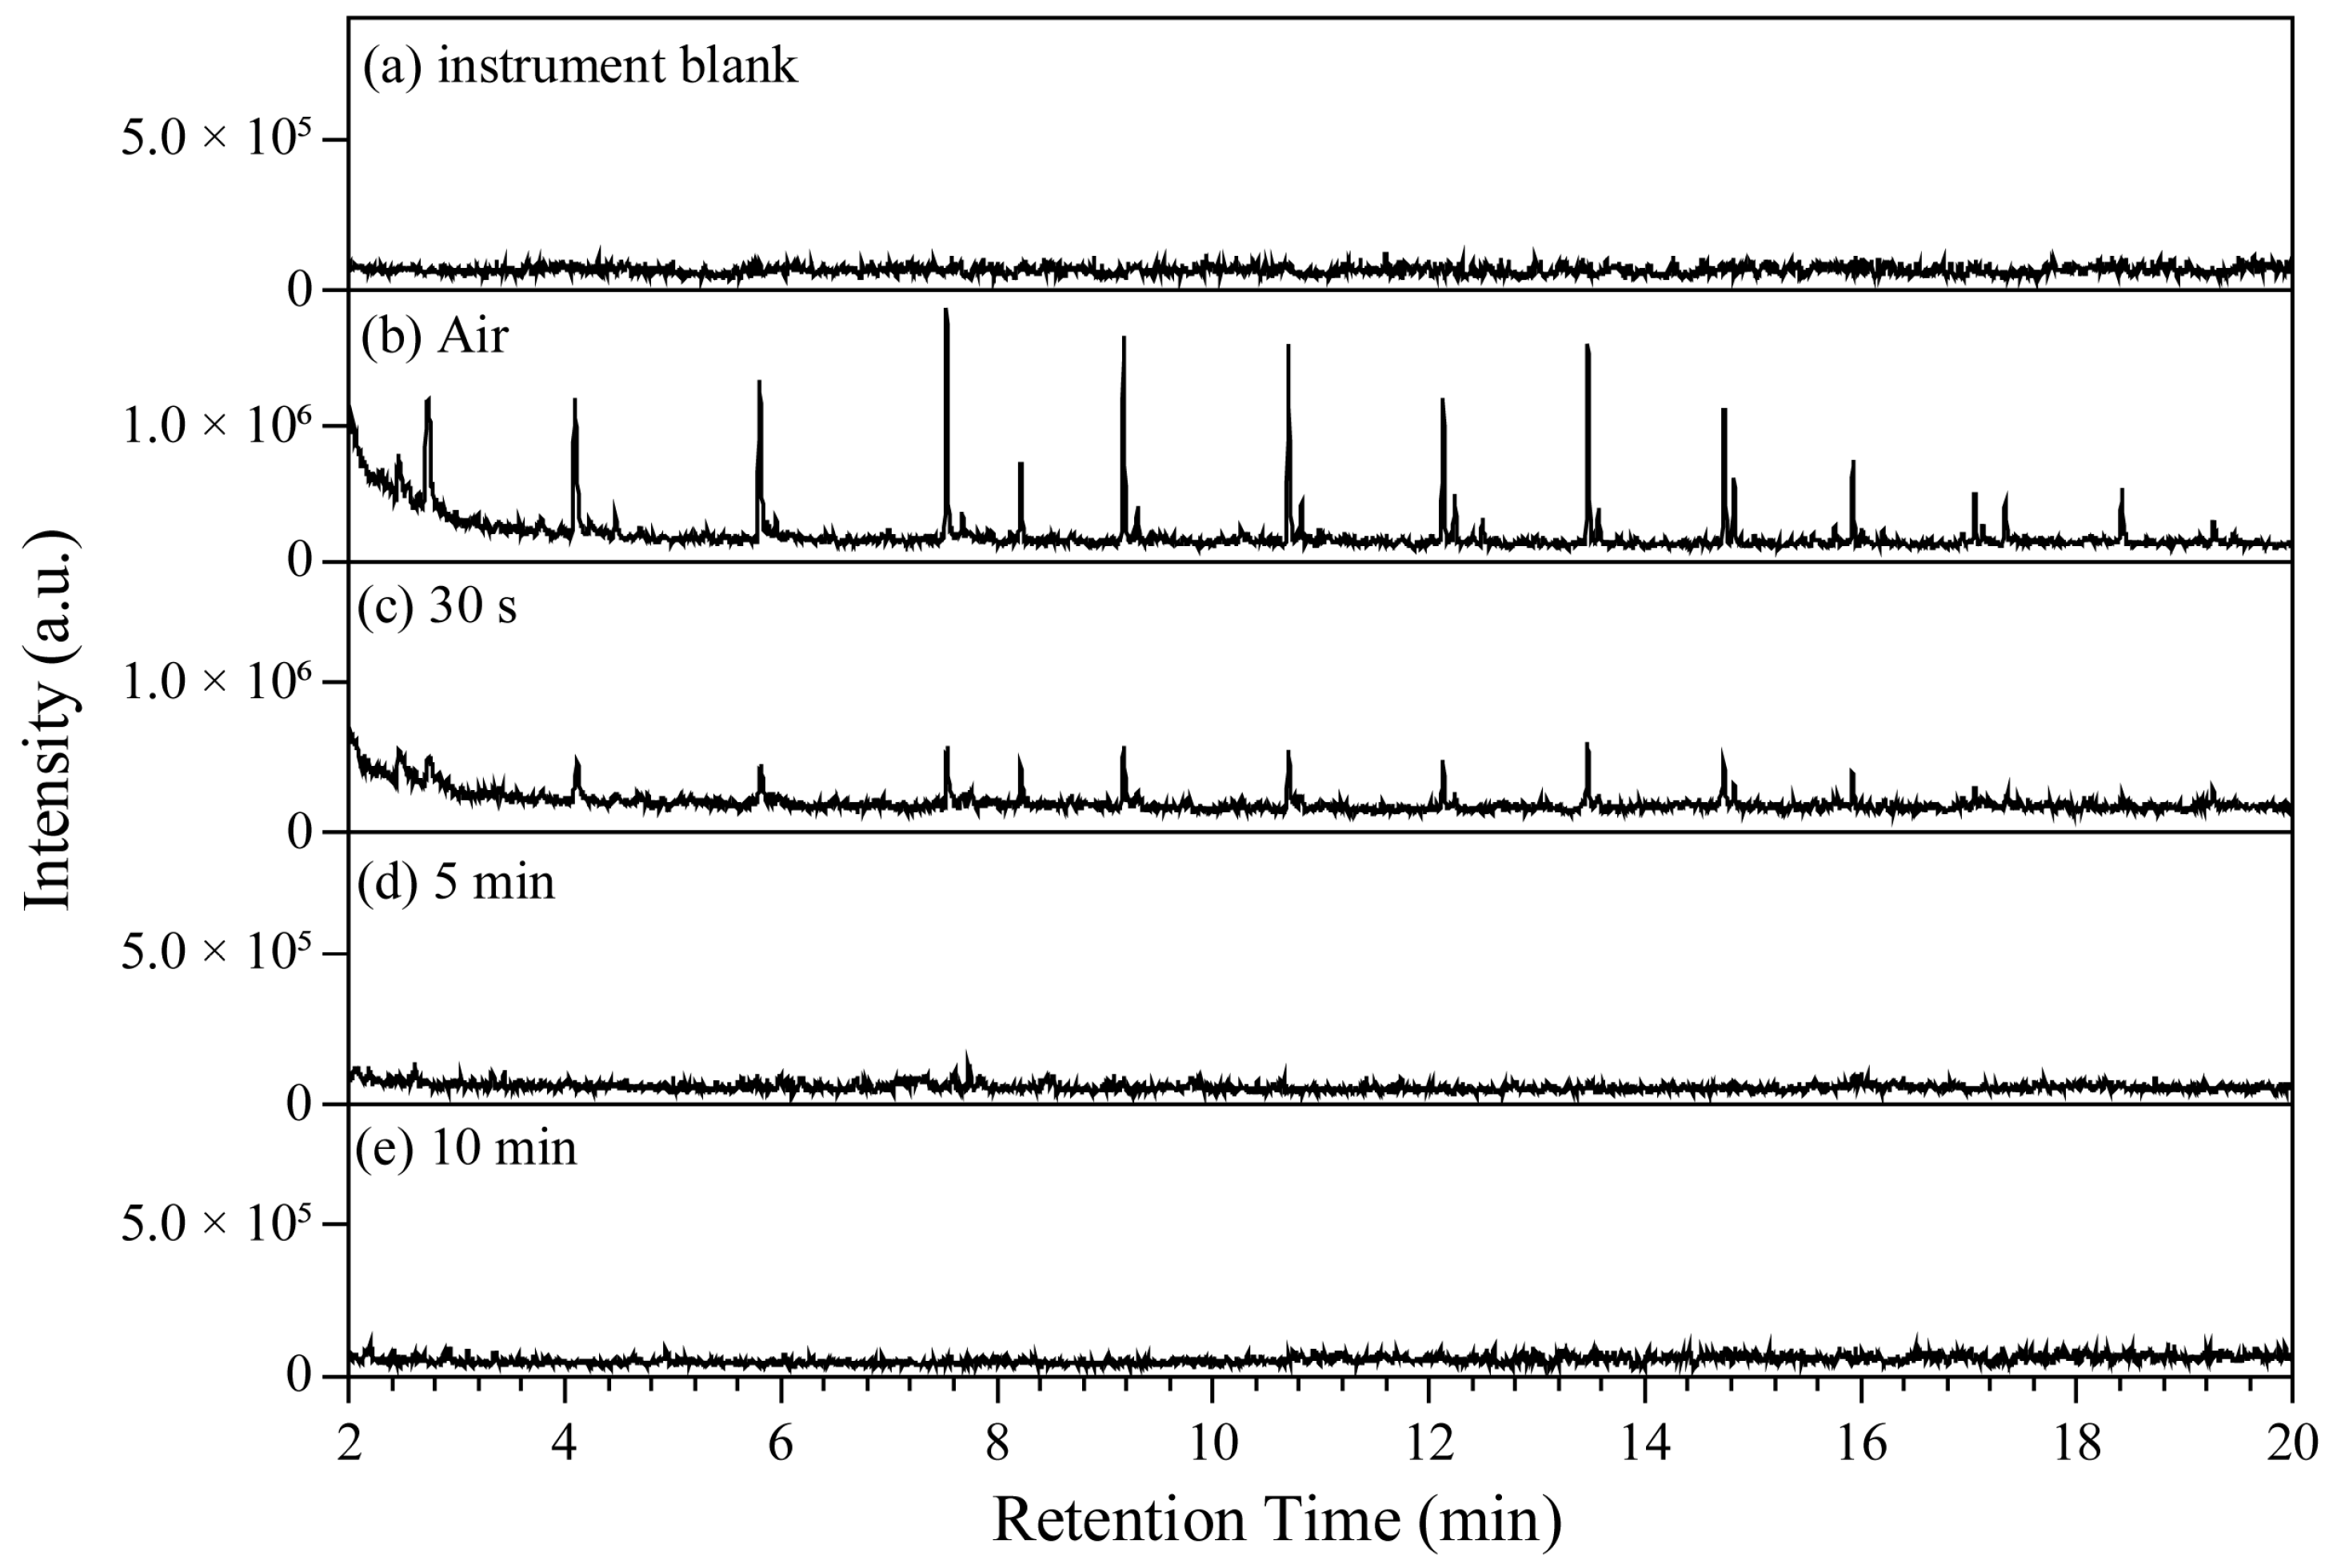
3.2. Interference from Injection Air

Unlike conventional needle injection for GC/MS, the pyrolysis furnace should remain open when the pyrolysis cup is introduced, leading to potential contamination from indoor air. Figure 3 compares Total Ion Current (TIC) chromatograms of injection blanks with and without helium purge pretreatment prior to flash pyrolysis. Only weak background noise was observed in the TIC chromatogram of the instrument blank. During the processing of the injection blank, the empty pyrolysis cup was immediately dropped into the pyrolysis zone after closing the pyrolysis furnace. There were more than 10 peaks in the TIC chromatograms with higher intensities within the 7–14 min retention time range, indicating substantial interference from ambient pollutants. We could not identify the chemical structures of these pollutants because they matched less than 15% of the compounds in the NIST mass spectral library. Although none of the peaks corresponded to the monomers of the target microplastics, the existing air pollutants might interfere with the reconstruction of the pyrolysis fragments derived from microplastics, hindering the identification of target microplastics. When purged with helium for 30 s before flash pyrolysis, these peaks remained in the TIC chromatogram but their intensities were markedly reduced. After purging for 5 min, the TIC chromatogram closely resembled that of the instrument blank. Based on these results, we set the purging time for each injection to 10 min in the subsequent Py-GC/MS analysis.

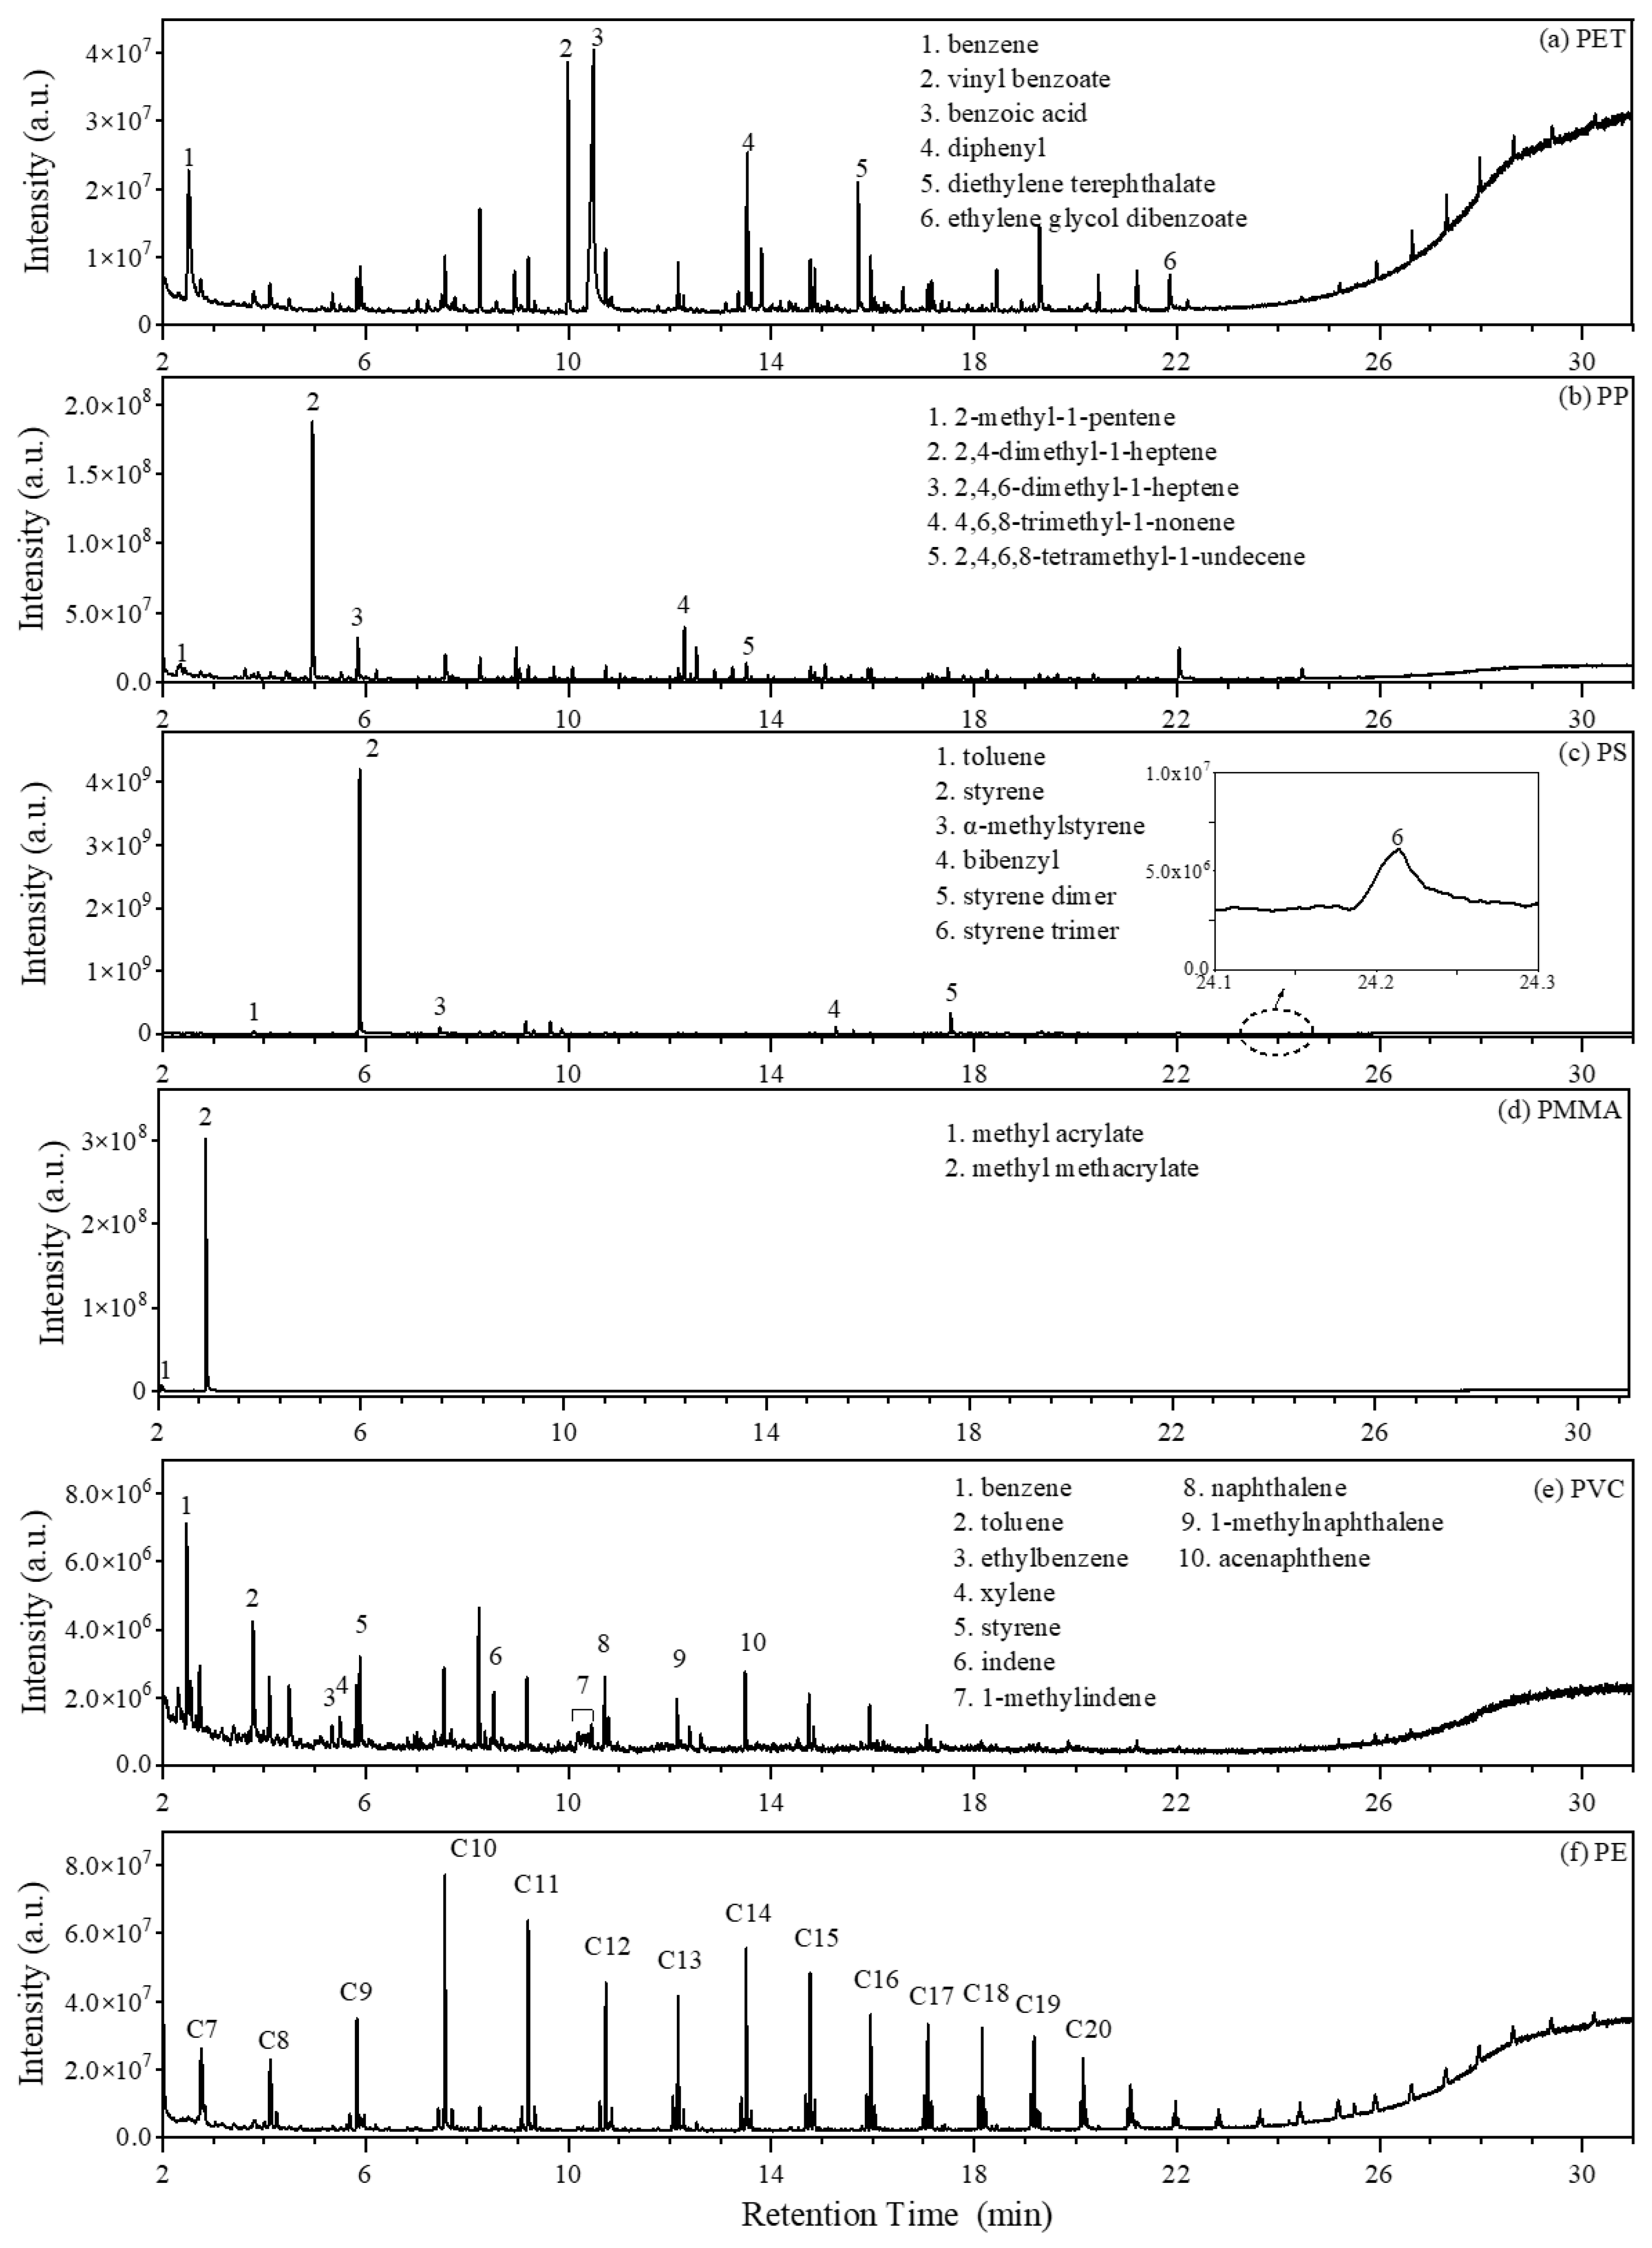
3.3. Py-GC/MS Chromatograms of Microplastic Standards

The Henxi Py-GC/MS system was used to identify the typical pyrolysates of microplastics in full scan mode for each microplastic standard. Figure 4 displays the Py-GC/MS TIC chromatograms of six common microplastic standards. The obtained chromatograms were compared with both the NIST mass spectral library and literature data reported by Tsuge et al. [37]. Characteristic pyrolysates are labeled in each chromatogram. A microplastic was quantified from a characteristic pyrolysate based on the following criteria: (1) the specific compound as a characteristic pyrolysate for a certain microplastic; (2) relatively rare compounds in the atmospheric environment; (3) pyrolysates with strong signal intensities. Table 2 summarizes the characteristic pyrolysates for quantifying the six common microplastics.
Benzene, vinyl benzoate, benzoic acid, diphenyl, divinyl terephthalate, and ethylene glycol dibenzoate are marked as characteristic pyrolysates of PET. Among them, vinyl benzoate, benzoic acid, and divinyl terephthalate have previously been used as quantitative markers [33,34,38]. Given its specific origin from PET, diphenyl is also a suitable candidate for quantification. The main products of PP are 2,4-dimethyl-1-heptene, 2,4,6-trimethyl-1-heptene, 4,6,8-trimethyl-1-nonene, and 2,4,6,8-tetramethyl-1-undecene. As the most abundant pyrolysate, 2,4-dimethyl-1-heptene was suggested as a quantitative indicator of PP [30]. In the TIC chromatogram of PE, pyrolysates in the range of C9–C16 exhibited similar signal intensities. 1-octene (C8), 1-nonene (C9), 1-decene (C10), 1-undecene (C11), 1-dodecene (C12), 1-tridecene (C13), 1-tetradecane (C14), 1-pentadecene (C15), and 1-cetene (C16) were identified as characteristic pyrolysates of PE. The pyrolysis of PMMA produces a large amount of methyl methacrylate (MMA) with a trace amount of methyl acrylate, suggesting that depolymerization into monomers is the dominant process for PMMA pyrolysis. For PS, styrene is the dominant characteristic pyrolysate, followed by styrene dimer, toluene, bibenzyl, and α-methylstyrene, indicating that the depolymerization of PS into styrene monomers is the main thermal cracking reaction [39]. Although the styrene trimer has been previously used as a quantitative reference for PS [28], it was excluded from this study due to its lower intensity and longer retention time. Similar to PET and PE, PVC exhibits a complex pyrolysis profile. The pyrolysis of PVC mainly involves dehydrochlorination and the cleavage of the methylene group, resulting in a diverse range of pyrolysates [39]. Benzene, toluene, ethylbenzene, styrene, indene, 1-methylindene, naphthalene, 1-methylnaphthalene, and acenaphthene are marked as characteristic pyrolysates of PVC. Benzene was extensively used as the quantitative indicator of PVC due to its largest abundance [33,38,40,41]. Considering that benzene is an important pyrolysate of widely used PET, we excluded benzene as quantitative reference for PVC in this study. To further improve sensitivity and selectivity, Selected Ion Monitoring (SIM) was employed in the subsequent quantitative analysis of microplastics in which the mass spectrometer was configured to determine only the specific m/z values corresponding to the characteristic pyrolysates listed in Table 2.

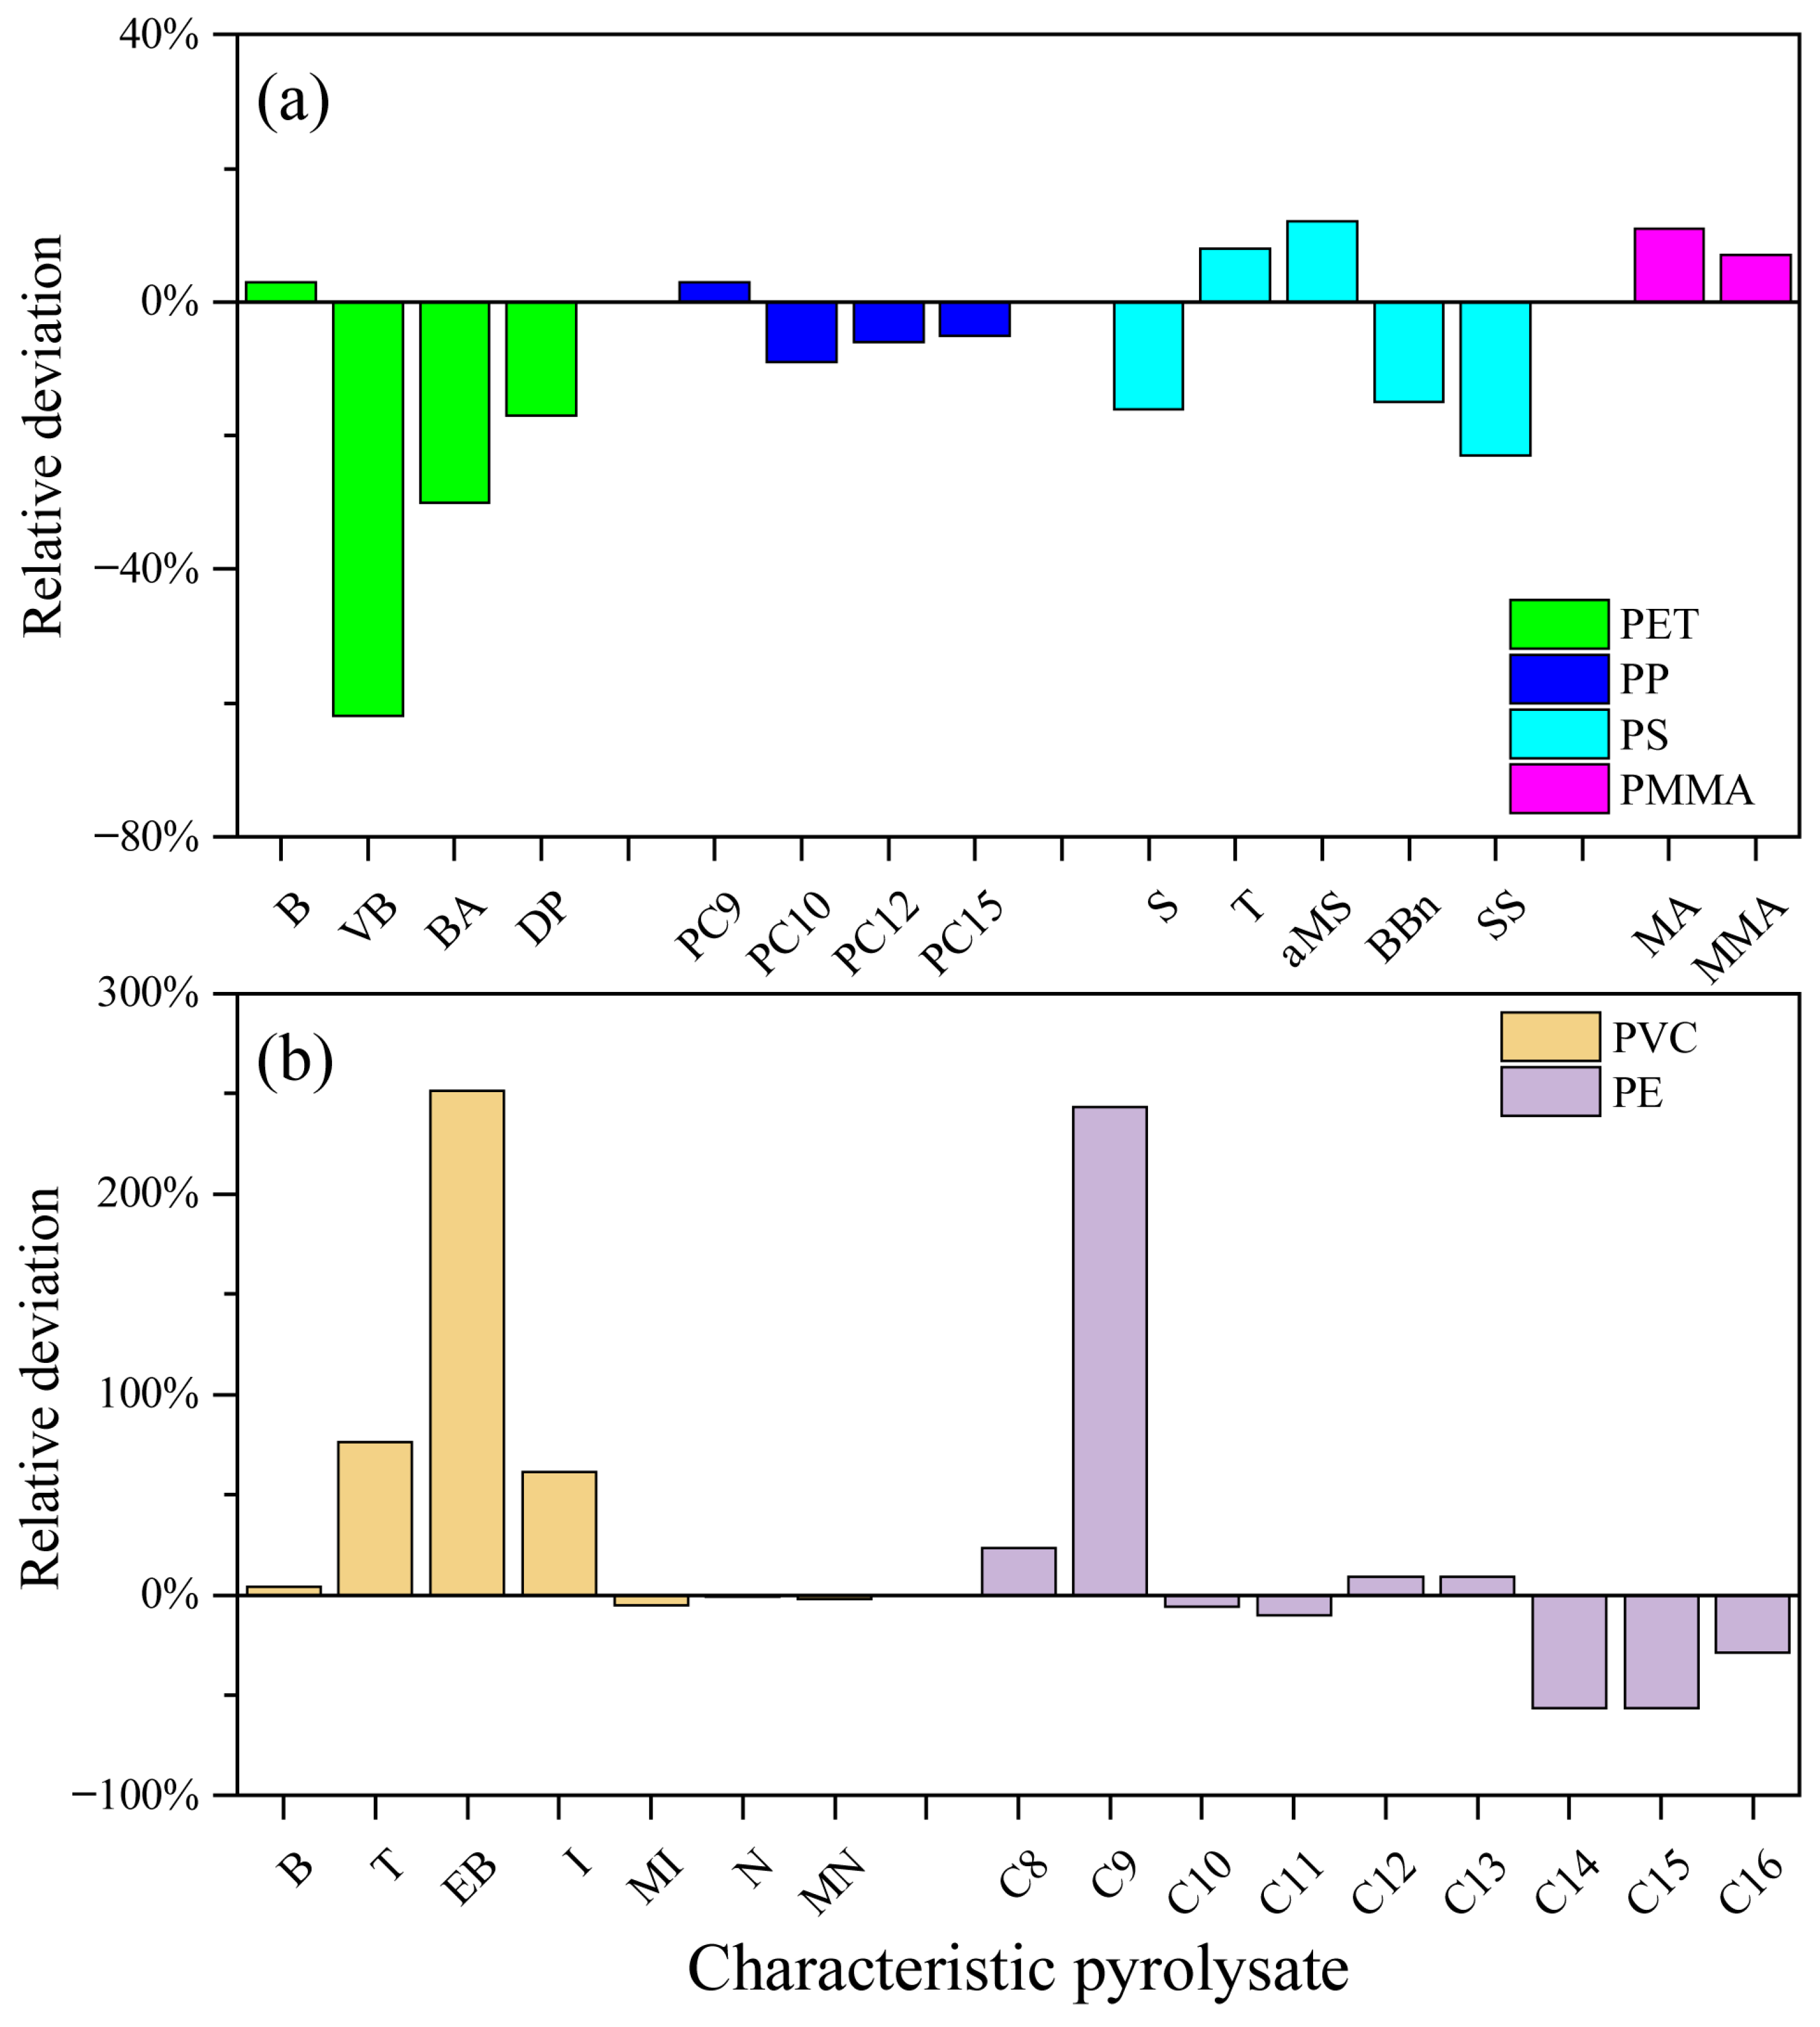
3.4. Identification of Quantitative References

Most samples from atmospheric particles and natural waters consist of mixtures of multiple microplastics [3,7]. However, there are interactions between different polymers during co-pyrolysis [39,42]. This study investigated experimental deviations from the co-pyrolysis of equal-proportion mixtures of six common microplastics. For each characteristic compound, the deviation between the measured value and the injected mass is illustrated in Figure 5. Among the four PET characteristic pyrolysates evaluated, only benzene did not show a reduction in yield. Compared with the system error expressed by the standard deviation of three replicate experiments (Table S1), these findings suggest a delayed degradation process for PET. The yield of benzene was a bit higher than expected, possibly because benzene is also an important pyrolysis product of PVC. Consequently, diphenyl is considered the most suitable quantitative indicator for PET. There is no significant difference in the interactions among the main pyrolysis products of PP, so the most abundant 2,4-dimethyl-1-heptene is identified as the quantitative indicator for PP. Lou et al. [41] reported that the uncertainty of PP content reached 130% when quantified by 2,4-dimethyl-1-heptene, which was not observed in this study. The yields of styrene, bibenzyl, and styrene dimer were significantly reduced during co-pyrolysis compared to individual pyrolysis of PS, consistent with previous findings [41]. When PS is blended with PE and PVC, new unsaturated hydrocarbon groups are generated, while certain methylene groups characteristic of PS pyrolysis are diminished [39]. Toluene is excluded from the quantitative indicator due to the higher contribution from PVC. Considering their yields, both styrene and the styrene dimer are suitable for quantifying PS. A positive deviation of less than 10% was observed for MMA, considerably lower than the deviation reported by Lou et al. [41], indicating that the most abundant MMA is a suitable indicator for PMMA. With a deviation of 250%, ethylbenzene was the least satisfactory marker for PVC. In contrast, indene, naphthalene, and 1-methylnaphthalene are less affected by polymer mixtures. Considering that indene and naphthalene extensively exist in ambient particles, 1-methylnaphthalene is considered the best PVC indicator. Among the nine PE pyrolysates, 1-nonene exhibited the largest positive deviation, while 1-tetradecane, 1-pentadecene, and 1-cetene showed significant negative deviations. In contrast, the uncertainties of 1-octene, 1-nonene, 1-decene, 1-undecene, 1-dodecene, and 1-tridecene remained within acceptable ranges. Given its atmospheric rarity and reliable performance, 1-octene is considered the quantitative reference of PE, consistent with Lou et al. [41], who noted that both natural organic matter and fossil fuel combustion emissions had no impacts on the detection of 1-octene.

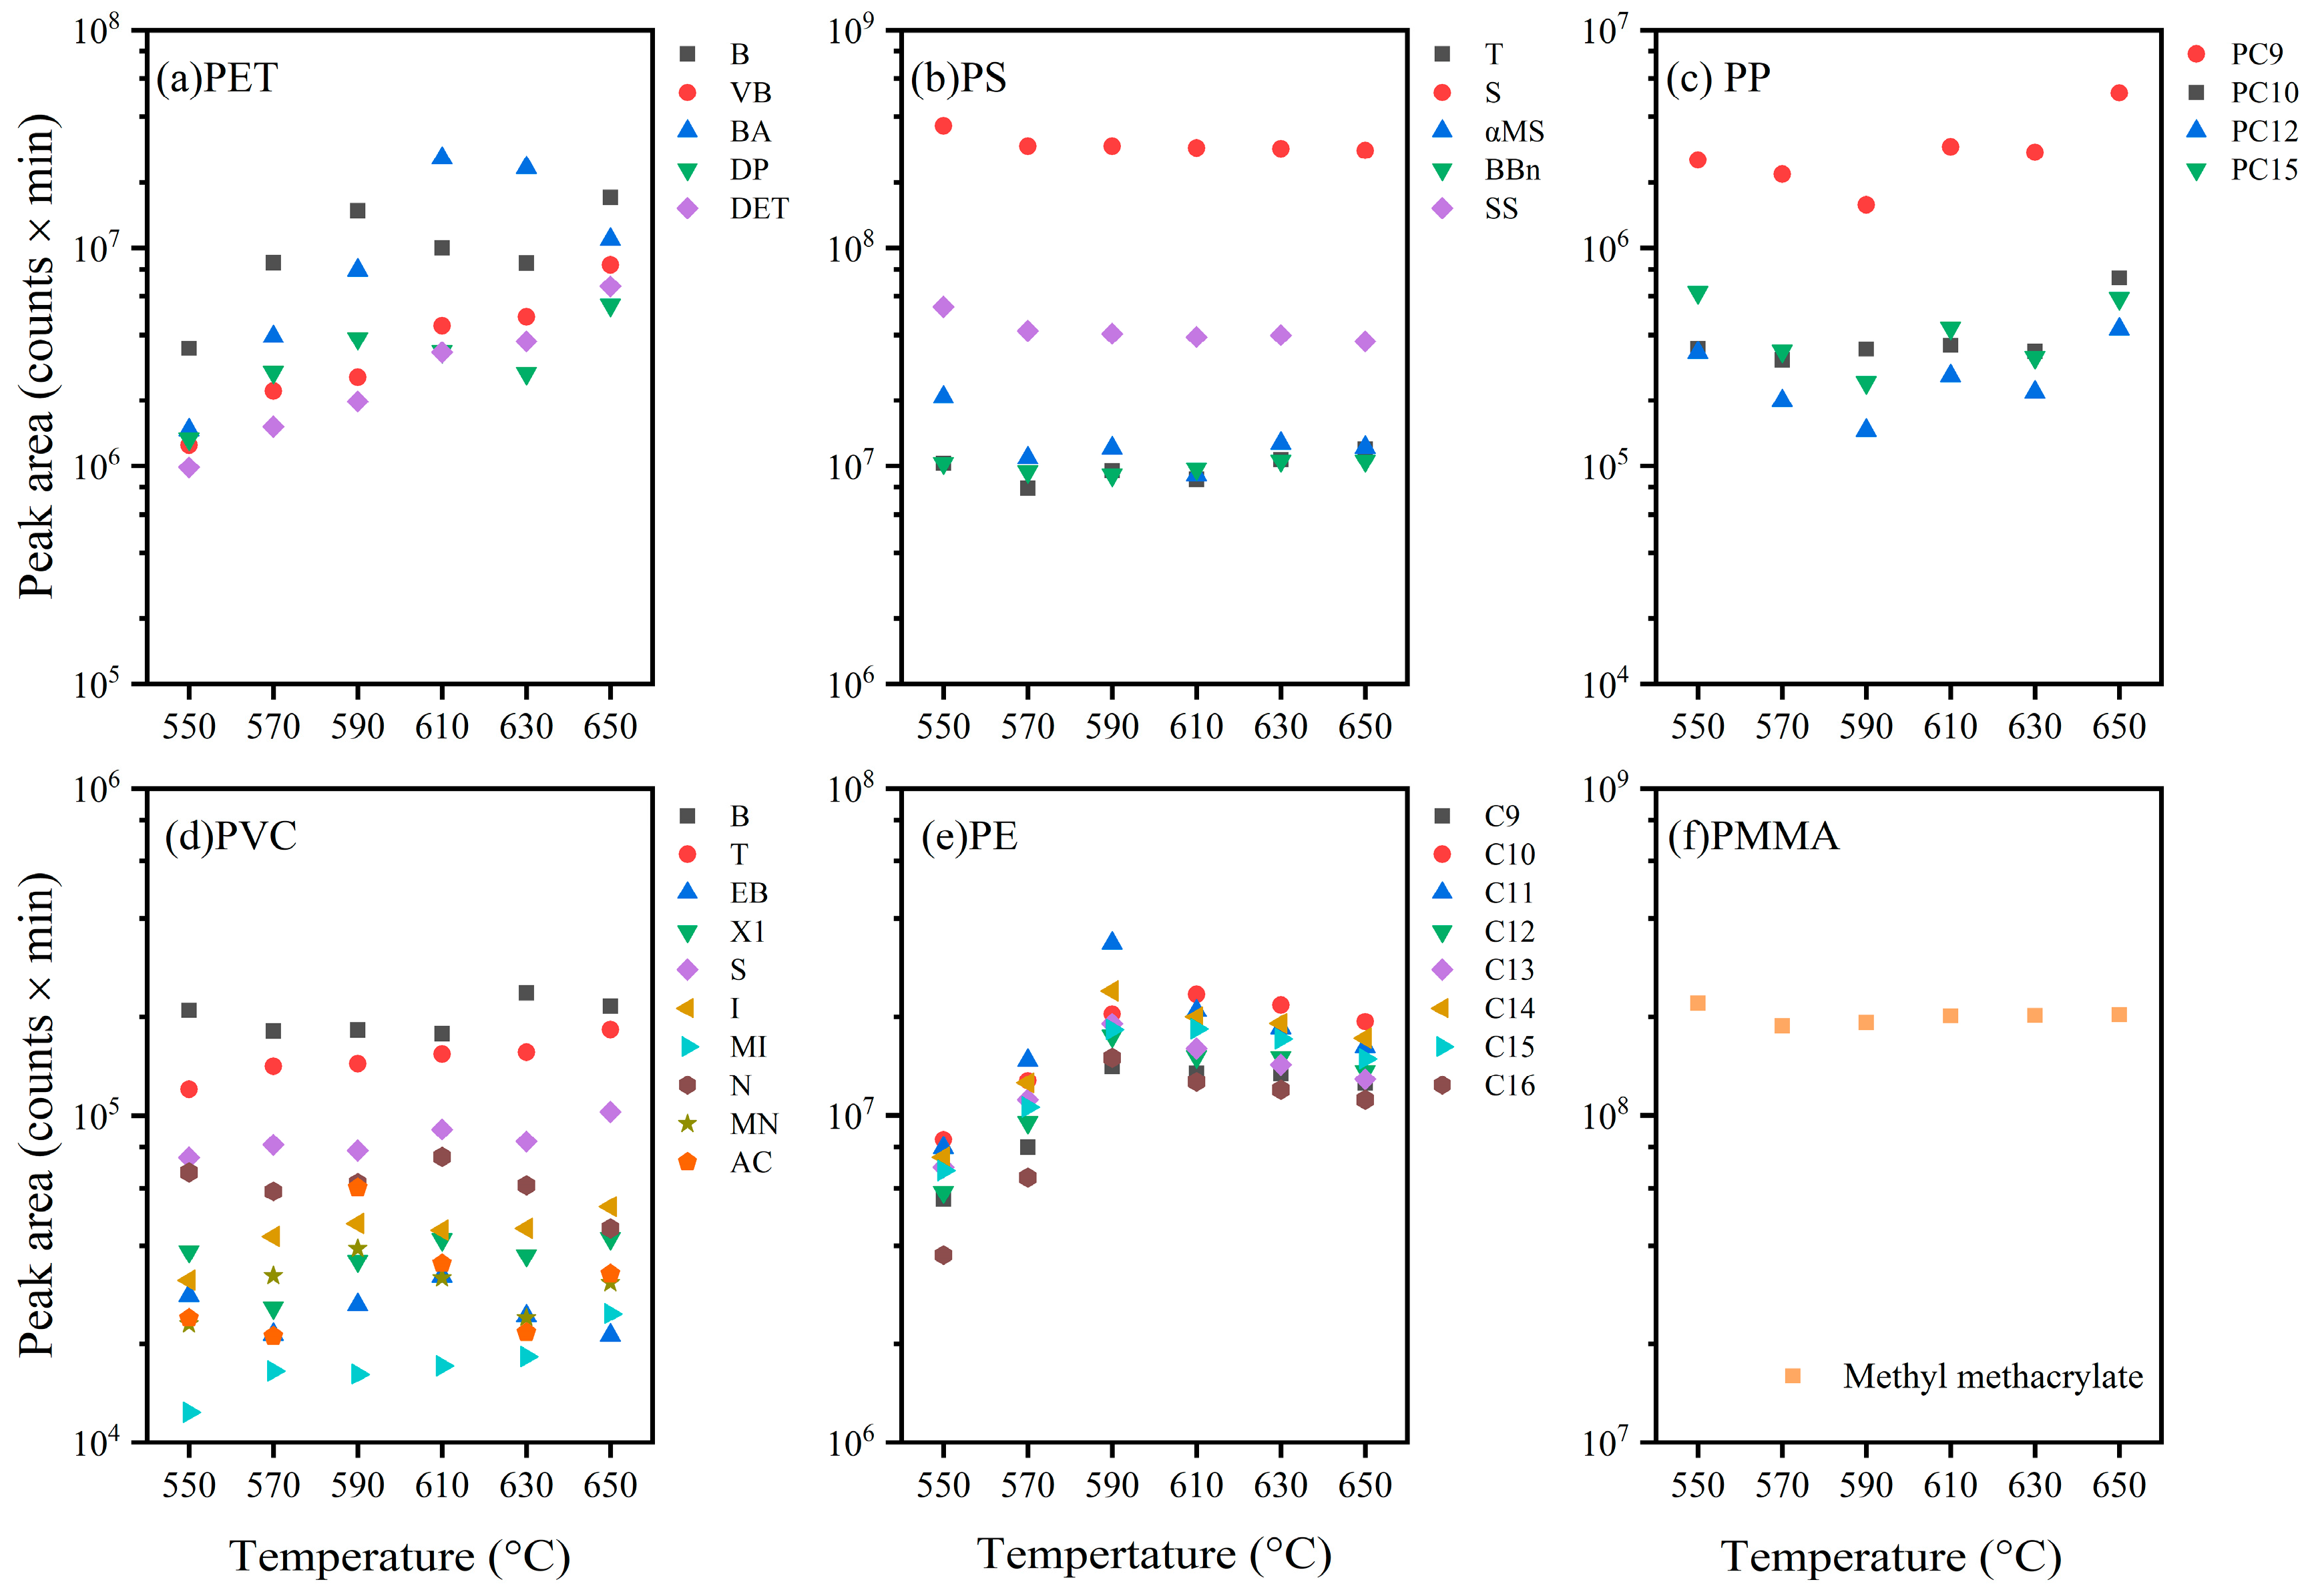
3.5. Response Intensities Depending on Pyrolysis Temperature

Temperature is key to controlling the molecular distribution of pyrolysis products. As shown in Figure 2, the microplastic pyrolysis may be incomplete at temperatures below 550 °C. The documented pyrolysis temperatures are 550 °C [3], 590 °C [32,43,44], 600 °C [30], and 650 °C [34,41,45]. In contrast, Hermabessiere et al. [46] argued that the optimal pyrolysis temperature should be 700 °C based on the pyrolysis of coarse PE particles (204 to 214 μm). Figure 6 illustrates the pyrolysis compounds at 550–650 °C for the six common microplastics. It can be seen that the peak areas of characteristic pyrolysates were insensitive to the temperature change for PS, PVC, and PMMA within the experimental temperature range. In contrast, the peak intensities of characteristic pyrolysates increased significantly when the temperature increased from 550 to 590 °C, followed by a gradual decline between 590 and 650 °C for PC and PE. The pyrolysis inflection point of PE microparticles in this study was significantly lower than that of PE coarse particles reported previously [46], which can be attributable to the size-dependent thermal cracking behavior. Similar findings were reported previously. In contrast to (NH4)2SO4 crystals decomposing to NH4HSO4 above 250 °C, HSO4 in PM2.5 began to decrease at temperatures as low as 170 °C [47]. However, the temperature effect was more complex for PET and PP. The intensities of vinyl benzoate and diethylene terephthalate continued to increase within 550–650 °C, while no significant trend was observed for benzene and benzoic acid. Overall, it is recommended to perform pyrolysis at 590–650 °C due to the stronger and more stable response intensities within this temperature range. Considering that the pyrolysis process may be postponed in the polymer mixtures [39], this study selected 650 °C as the optimal pyrolysis temperature.

3.6. Optimizations of Py-GC/MS Procedure

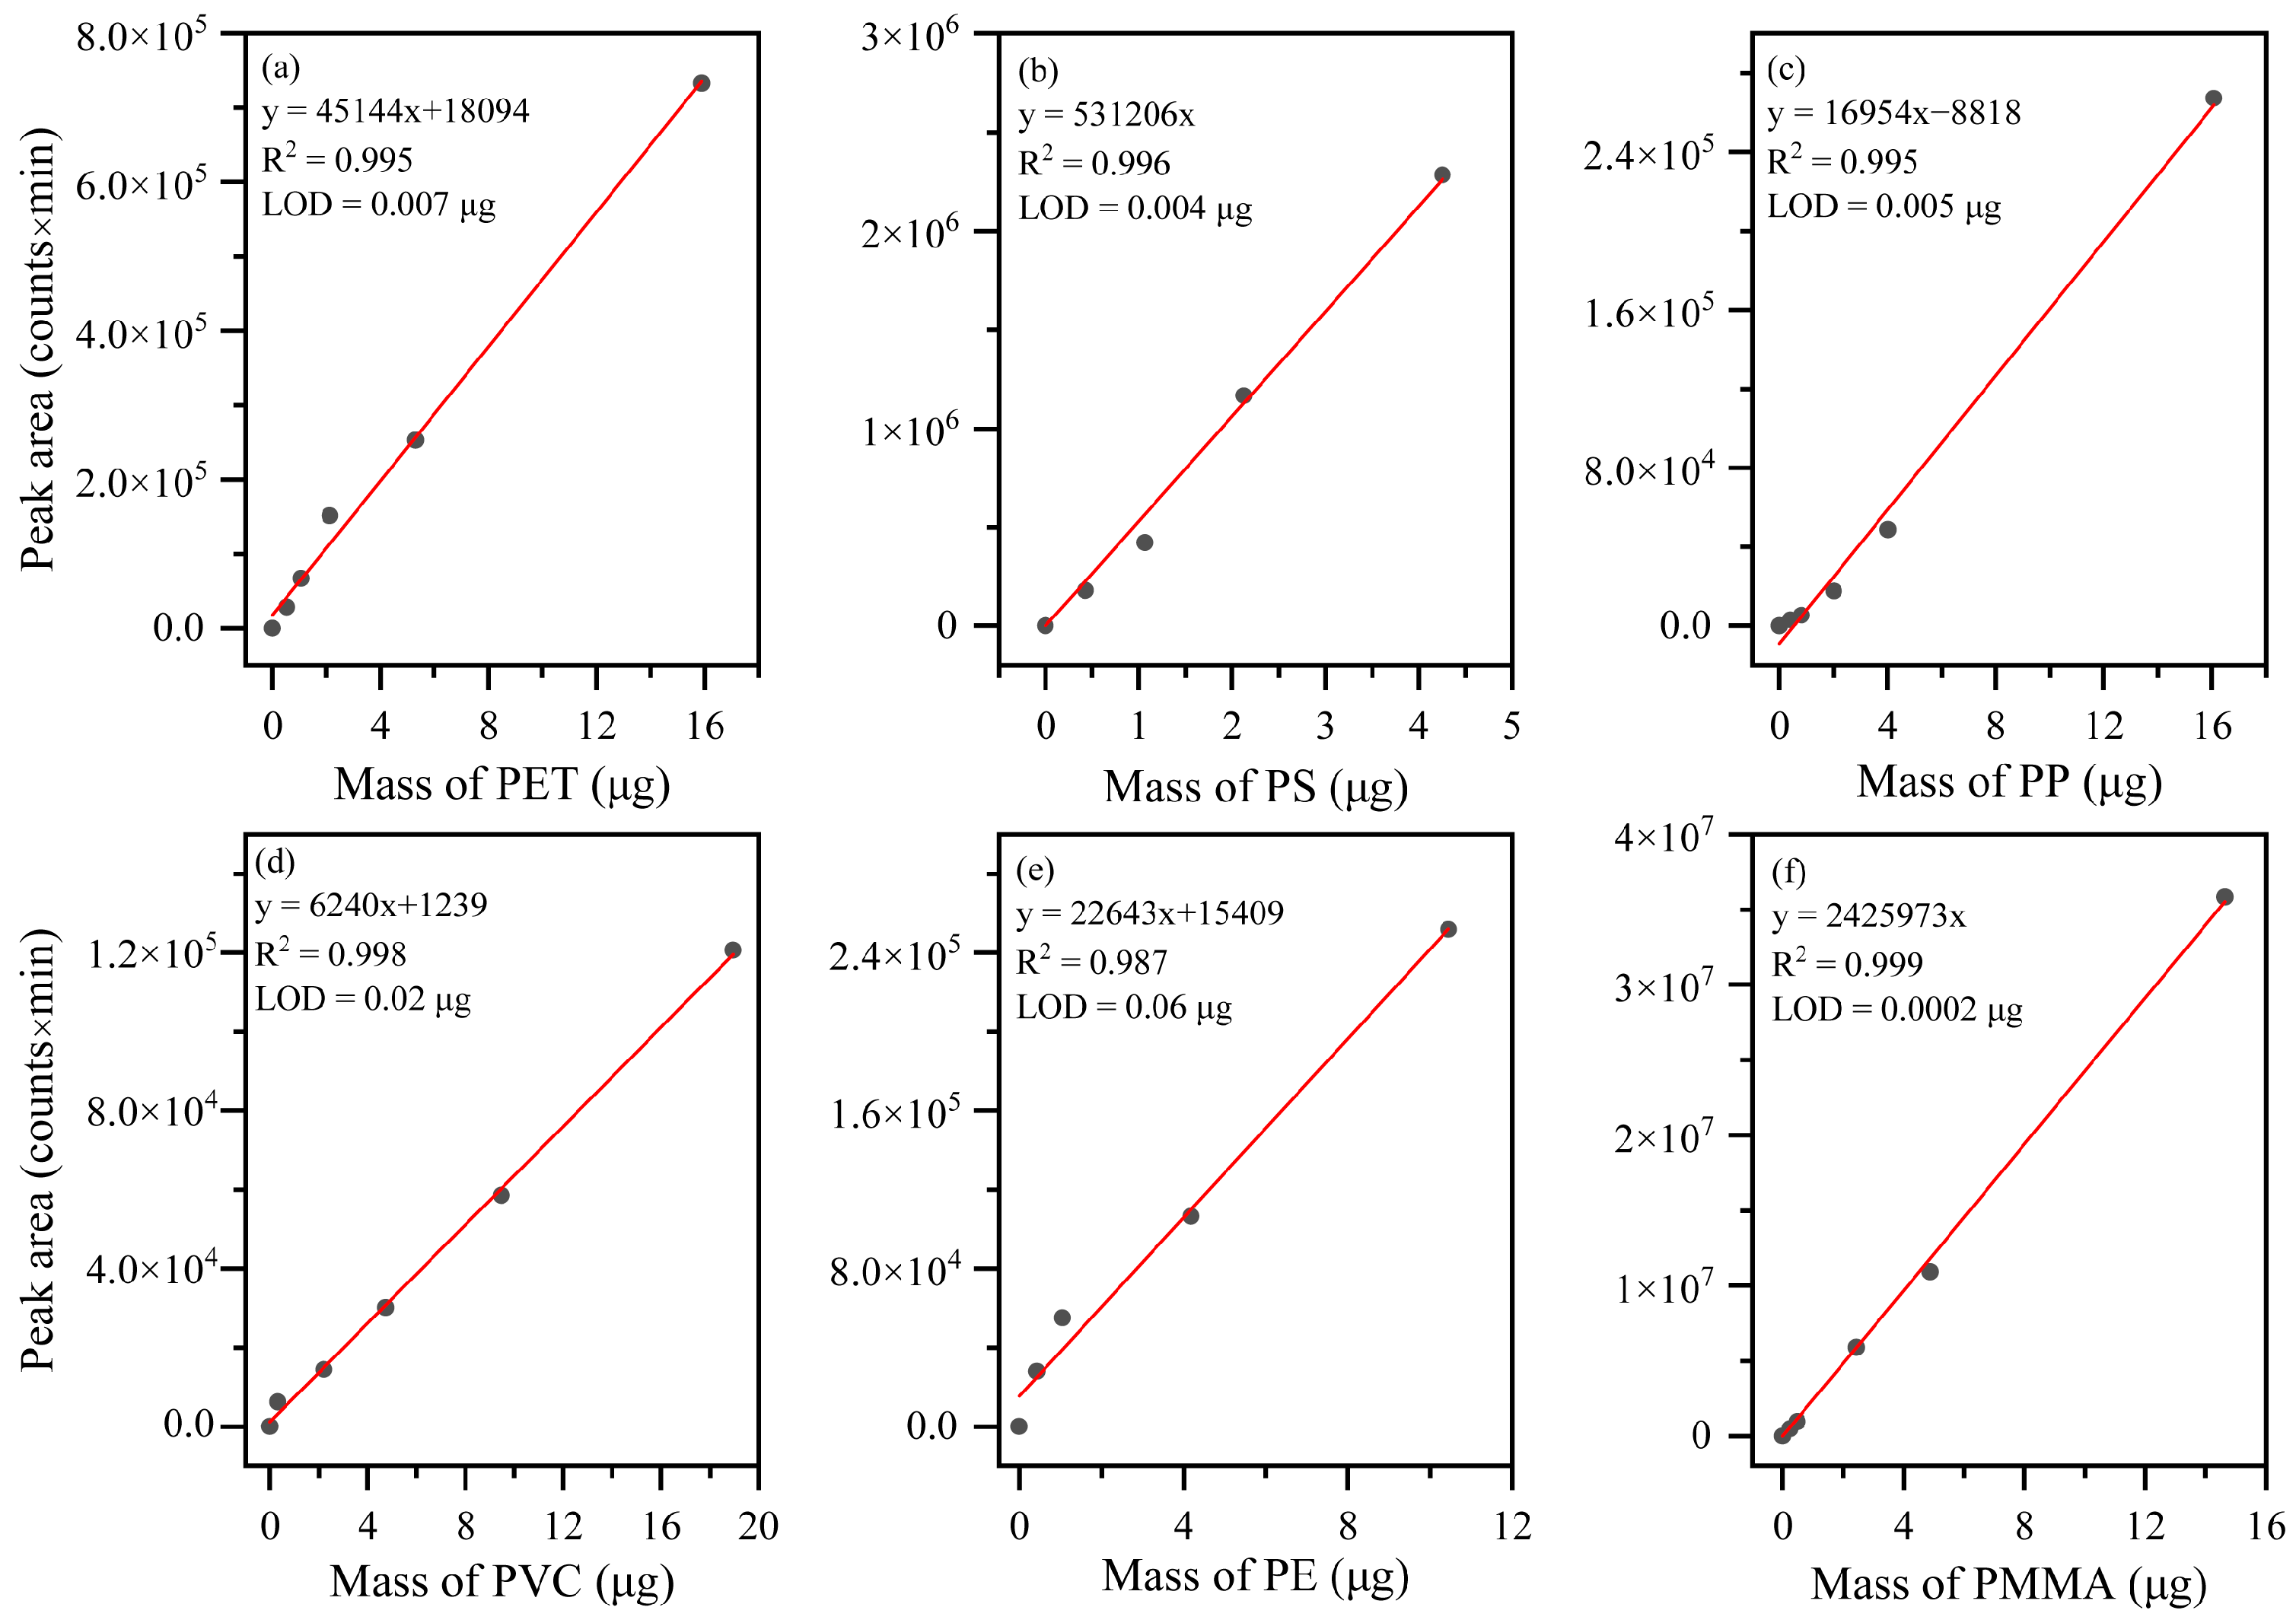
3.6.1. Calibration Curves

Figure 7 displays the calibration curves for the six common microplastics. Previous studies showed that the atmospheric concentrations of PE and PVC were significantly higher than those of PS and PMMA. Considering that the PM mass loading varies greatly in the atmosphere, the upper limits of the calibration curves were set between 4 and 19 μg. With the measured range, the correlation coefficients (r2) of all calibration curves exceeded 0.99 except for PE, demonstrating the excellent performance of this Py-GC/MS system. Microplastics are insoluble in water and common organic solvents such as methanol and ethanol, leading to a huge challenge in preparing standard solutions for various microplastics. To meet the demand for qualifying the low mixing ratios of microplastics in the real atmosphere, some microplastic standards were prepared by externally mixing microplastics with SiO2 nanoparticles rather than dissolving microplastics in organic solvents. Luo et al. (2023) [20] developed an innovative microplastic standard by dispersing non-polar PP nanoparticles in absolute ethanol. In the present study, a stable microplastic–water dispersion system was achieved by ultrasonically dispersing microplastics in water because they have similar densities. The results show that this approach is a simple and reliable method for preparing microplastic standards. The method LODs were determined using three times the background noise measured from blank chromatograms. The resulting LODs of microplastics in this study ranged from 0.2 to 600 ng, with the highest for PE and the lowest for PMMA.

3.6.2. Method Repeatability

The repeatability of this Py-GC/MS method was evaluated by determining a PMMA standard (1 μg) consecutively 6 times in 15 days (Table 3). MS chromatograms were determined on the 1st, 3rd, 4th, 7th, 8th, and 15th days, respectively. The relative standard deviation (RSD) values of the MS and TIC peak areas over 8 and 15 days were used to evaluate the method’s repeatability. The RSDs of the MS peak areas and TIC peak areas over 8 days were 9.76% and 9.08%, respectively, while they exceeded 18.0% after 15 days, suggesting that internal standards should be introduced or calibration curves should be re-established in case the Py-GC/MS has been in continuous operation for more than 10 days.

3.6.3. Validations of the Domestic Py-GC/MS Performance

To validate the performance of the Henxi PY-1S Py-GC/MS, six samples were analyzed using the Frontier PY-3030D Py-GC/MS in another laboratory within the Department of Environmental Science and Engineering. Figure 8 compares the results obtained from both the PY-1S and PY-3030D systems. It should be noted that a filter blank in SIM mode was confirmed before determining atmospheric samples. The PY-3030D Py-GC/MS failed to detect PET in any of the samples, whereas the PY-1S Py-GC/MS detected PET in two samples. PVC and PE were the most abundant microplastics determined in this study, with concentrations at least an order of magnitude higher than other microplastics. The average mass loadings of PS and PMMA determined by the PY-3030D system were 50% lower than those measured by the PY-1S system, while the PY-1S system reported higher mass of PP than the Frontier system. Overall, the average mass loading of PE determined by the two systems was comparable. However, there was no significant difference in the measured values between the two systems (Table S2). Surprisingly, the PY-3030D system reported a significantly higher PVC mass than the PY-1S. We noted that the PY-3030D Py-GC/MS did not detect PVC in one sample while the PY-1S Py-GC/MS recorded a high value. Similar findings were observed for PS and PMMA. To explore these discrepancies, three samples from each of two quartz filters (A and B) were analyzed in parallel using the PY-1S system (Table S3). The determined total polymer mass varied greatly from 0.67 to 1.22 μg for sample A and from 0.73 to 1.47 μg for sample B. For an individual polymer, the PE analysis showed good repeatability, but the RSD of PVC reached 68%. In addition, three replicate measurements of the same mixed polymer standards were performed, demonstrating that the RSD was typically below 5%. These findings suggest that the limited microplastic particles were unevenly distributed across the sampling filters, partially accounting for the differences between the two systems. Furthermore, the two systems employed different quantitative references. For example, 1-methylnaphthalene and 1-octene were used as quantitative references for PVC and PE in our calculations, while 1-chloroindan and 1-tetradecene were used in the Frontier system. Therefore, the observed deviations between the two systems are acceptable except for PVC. Overall, the results strongly support the reliable performance of the Henxi PY-1S pyrolyzer.

4. Conclusions

This study comprehensively investigates the optimal Py-GC/MS procedures using a domestic HenxiTM PY-1S pyrolyzer-based Py-GC/MS system. Six common microplastic standards were evaluated, including PE, PP, PVC, PET, PS, and PMMA. The key parameters such as He purging time, pyrolysis temperature, characteristic indicator, quantitative reference, and mixed effect were thoroughly examined. To minimize interference from injected air and semi-volatile organics present in the particles, sufficient He purging at elevated temperatures is essential. Microplastic pollution may be underestimated when thermal desorption temperatures prior to flash pyrolysis exceed 250 °C. Based on the experimental findings, the recommended pyrolysis temperature is 650 °C. Significant interactions between mixed microplastics were observed during co-pyrolysis, highlighting that the optimization of quantitative references should combine the characteristic indicators and interference from co-pyrolysis. The domestic PY-1S pyrolyzer-based Py-GC/MS demonstrated excellent performance.
Microplastics in PM2.5 determined by the domestic pyrolyzer-based Py-GC/MS were comparable to those measured using a widely adopted commercial Py-GC/MS system, confirming the reliability of the domestic instrument for ambient microplastic analysis. However, strong interference was observed during co-pyrolysis, primarily due to interactions among different polymer types. Additionally, significant variation in microplastic concentrations was found among sub-samples taken from the same quartz filters, highlighting the uneven distribution of microplastics within the filters. These findings indicate that the direct analysis of airborne microplastics collected on quartz filters using Py-GC/MS is subject to certain uncertainties.

Supplementary Materials

The following supporting information can be downloaded at: https://www.mdpi.com/article/10.3390/atmos16040476/s1, Figure S1: Peak intensities for 3 replicate experiments of mixed microplastic standards; Figure S2: Statistical significance of measurement differences between the Frontier and Henxi Py-GC/MS systems based on t-Test; Figure S3: Microplastics determined on six injections from the sample A and B.

Author Contributions

Methodology, J.C.; formal analysis, B.F.; writing—original draft, Y.Z.; writing—review and editing, X.Y. All authors have read and agreed to the published version of the manuscript.

Funding

This work was funded by the National Natural Science Foundation of China (22336001, 22176039, and 21976033).

Institutional Review Board Statement

Not applicable.

Informed Consent Statement

Not applicable.

Data Availability Statement

The original contributions presented in this study are included in the article/Supplementary Materials. Further inquiries can be directed to the corresponding author.

Acknowledgments

This work was supported by the National Natural Science Foundation of China (22336001, 22176039, and 21976033).

Conflicts of Interest

Author Jinshui Che was employed by the company ThermoFisher Scientific China. The remaining authors declare that the research was conducted in the absence of any commercial or financial relationships that could be construed as a potential conflict of interest.

References

  1. Lebreton, L.; Andrady, A. Future scenarios of global plastic waste generation and disposal. Palgrave Commun. 2019, 5, 11. [Google Scholar] [CrossRef]
  2. Allen, S.; Allen, D.; Phoenix, V.R.; Le Roux, G.; Jiménez, P.D.; Simonneau, A.; Binet, S.; Galop, D. Atmospheric transport and deposition of microplastics in a remote mountain catchment. Nat. Geosci. 2019, 12, 339–344. [Google Scholar] [CrossRef]
  3. Hendrickson, E.; Minor, E.C.; Schreiner, K. Microplastic Abundance and Composition in Western Lake Superior As Determined via Microscopy, Pyr-GC/MS, and FTIR. Environ. Sci. Technol. 2018, 52, 1787–1796. [Google Scholar] [CrossRef] [PubMed]
  4. Ding, J.F.; Jiang, F.H.; Li, J.X.; Wang, Z.X.; Sun, C.J.; Wang, Z.Y.; Fu, L.; Ding, N.X.; He, C.F. Microplastics in the Coral Reef Systems from Xisha Islands of South China Sea. Environ. Sci. Technol. 2019, 53, 8036–8046. [Google Scholar] [CrossRef]
  5. Fan, W.; Salmond, J.A.; Dirks, K.N.; Cabedo Sanz, P.; Miskelly, G.M.; Rindelaub, J.D. Evidence and Mass Quantification of Atmospheric Microplastics in a Coastal New Zealand City. Environ. Sci. Technol. 2022, 56, 17556–17568. [Google Scholar] [CrossRef]
  6. Liu, K.; Wang, X.; Fang, T.; Xu, P.; Zhu, L.; Li, D. Source and potential risk assessment of suspended atmospheric microplastics in Shanghai. Sci. Total Environ. 2019, 675, 462–471. [Google Scholar] [CrossRef]
  7. Chen, Y.Q.; Jing, S.Y.; Wang, Y.T.; Song, Z.; Xie, L.F.; Shang, X.A.; Fu, H.B.; Yang, X.D.; Wang, H.M.; Wu, M.H.; et al. Quantification and Characterization of Fine Plastic Particles as Considerable Components in Atmospheric Fine Particles. Environ. Sci. Technol. 2024, 58, 4691–4703. [Google Scholar] [CrossRef]
  8. Zhang, D.; Liu, X.; Huang, W.; Li, J.; Wang, C.; Zhang, D.; Zhang, C. Microplastic pollution in deep-sea sediments and organisms of the Western Pacific Ocean. Environ. Pollut. 2020, 259, 113948. [Google Scholar] [CrossRef]
  9. Botterell, Z.L.R.; Bergmann, M.; Hildebrandt, N.; Krumpen, T.; Steinke, M.; Thompson, R.C.; Lindeque, P.K. Microplastic ingestion in zooplankton from the Fram Strait in the Arctic. Sci. Total Environ. 2022, 831, 154886. [Google Scholar] [CrossRef]
  10. Cox, K.D.; Covernton, G.A.; Davies, H.L.; Dower, J.F.; Juanes, F.; Dudas, S.E. Correction to Human Consumption of Microplastics. Environ. Sci. Technol. 2020, 54, 10974. [Google Scholar] [CrossRef]
  11. Zha, H.; Xia, J.F.; Li, S.J.; Lv, J.W.; Zhuge, A.X.; Tang, R.Q.; Wang, S.T.; Wang, K.C.; Chang, K.V.; Li, L.J. Airborne polystyrene microplastics and nanoplastics induce nasal and lung microbial dysbiosis in mice. Chemosphere 2023, 310, 136764. [Google Scholar] [CrossRef] [PubMed]
  12. Kang, H.W.; Huang, D.Y.; Zhang, W.; Wang, J.Y.; Liu, Z.Y.; Wang, Z.Y.; Jiang, G.Y.; Gao, A. Inhaled polystyrene microplastics impaired lung function through pulmonary flora/TLR4-mediated iron homeostasis imbalance. Sci. Total Environ. 2024, 946, 174300. [Google Scholar] [CrossRef] [PubMed]
  13. Jin, W.H.; Zhang, W.B.; Tang, H.J.; Wang, P.J.; Zhang, Y.; Liu, S.Y.; Qiu, J.; Chen, H.; Wang, L.J.; Wang, R.; et al. Microplastics exposure causes the senescence of human lung epithelial cells and mouse lungs by inducing ROS signaling. Environ. Int. 2024, 185, 108489. [Google Scholar] [CrossRef] [PubMed]
  14. Liao, Z.; Ji, X.; Ma, Y.; Lv, B.; Huang, W.; Zhu, X.; Fang, M.; Wang, Q.; Wang, X.; Dahlgren, R.; et al. Airborne microplastics in indoor and outdoor environments of a coastal city in Eastern China. J. Hazard. Mater. 2021, 417, 126007. [Google Scholar] [CrossRef]
  15. Dris, R.; Gasperi, J.; Mirande, C.; Mandin, C.; Guerrouache, M.; Langlois, V.; Tassin, B. A first overview of textile fibers, including microplastics, in indoor and outdoor environments. Environ. Pollut. 2017, 221, 453–458. [Google Scholar] [CrossRef]
  16. Zhu, X.; Huang, W.; Fang, M.; Liao, Z.; Wang, Y.; Xu, L.; Mu, Q.; Shi, C.; Lu, C.; Deng, H.; et al. Airborne Microplastic Concentrations in Five Megacities of Northern and Southeast China. Environ. Sci. Technol. 2021, 55, 12871–12881. [Google Scholar] [CrossRef]
  17. Amato-Lourenço, L.F.; Carvalho-Oliveira, R.; Ribeiro, G.; Galvao, L.D.; Ando, R.A.; Mauad, T. Presence of airborne microplastics in human lung tissue. J. Hazard. Mater. 2021, 416, 126124. [Google Scholar] [CrossRef]
  18. Jenner, L.C.; Rotchell, J.M.; Bennett, R.T.; Cowen, M.; Tentzeris, V.; Sadofsky, L.R. Detection of microplastics in human lung tissue using μFTIR spectroscopy. Sci. Total Environ. 2022, 831, 154907. [Google Scholar] [CrossRef]
  19. Tokunaga, Y.; Okochi, H.; Tani, Y.; Niida, Y.; Tachibana, T.; Saigawa, K.; Katayama, K.; Moriguchi, S.; Kato, T.; Hayama, S. Airborne microplastics detected in the lungs of wild birds in Japan. Chemosphere 2023, 321, 138032. [Google Scholar] [CrossRef]
  20. Luo, P.; Bai, M.; He, Q.; Peng, Z.; Wang, L.; Dong, C.; Qi, Z.; Zhang, W.; Zhang, Y.; Cai, Z. A Novel Strategy to Directly Quantify Polyethylene Microplastics in PM2.5 Based on Pyrolysis-Gas Chromatography–Tandem Mass Spectrometry. Anal. Chem. 2023, 95, 3556–3562. [Google Scholar] [CrossRef]
  21. Trainic, M.; Flores, J.M.; Pinkas, I.; Pedrotti, M.L.; Lombard, F.; Bourdin, G.; Gorsky, G.; Boss, E.; Rudich, Y.; Vardi, A.; et al. Airborne microplastic particles detected in the remote marine atmosphere. Commun. Earth Environ. 2020, 1, 64. [Google Scholar] [CrossRef]
  22. Sobhani, Z.; Zhang, X.; Gibson, C.; Naidu, R.; Megharaj, M.; Fang, C. Identification and visualisation of microplastics/nanoplastics by Raman imaging (i): Down to 100 nm. Water Res. 2020, 174, 115658. [Google Scholar] [CrossRef]
  23. Abbasi, S.; Keshavarzi, B.; Moore, F.; Turner, A.; Kelly, F.J.; Dominguez, A.O.; Jaafarzadeh, N. Distribution and potential health impacts of microplastics and microrubbers in air and street dusts from Asaluyeh County, Iran. Environ. Pollut. 2019, 244, 153–164. [Google Scholar] [CrossRef]
  24. Picó, Y.; Barceló, D. Pyrolysis gas chromatography-mass spectrometry in environmental analysis: Focus on organic matter and microplastics. Trac-Trends Anal. Chem. 2020, 130, 12. [Google Scholar] [CrossRef]
  25. Albignac, M.; Ghiglione, J.F.; Labrune, C.; ter Halle, A. Determination of the microplastic content in Mediterranean benthic macrofauna by pyrolysis-gas chromatography-tandem mass spectrometry. Mar. Pollut. Bull. 2022, 181, 113882. [Google Scholar] [CrossRef]
  26. Gomiero, A.; Oysæd, K.B.; Agustsson, T.; van Hoytema, N.; van Thiel, T.; Grati, F. First record of characterization, concentration and distribution of microplastics in coastal sediments of an urban fjord in south west Norway using a thermal degradation method. Chemosphere 2019, 227, 705–714. [Google Scholar] [CrossRef] [PubMed]
  27. Kirstein, I.V.; Hensel, F.; Gomiero, A.; Iordachescu, L.; Vianello, A.; Wittgren, H.B.; Vollertsen, J. Drinking plastics?—Quantification and qualification of microplastics in drinking water distribution systems by μFTIR and Py-GCMS. Water Res. 2021, 188, 116519. [Google Scholar] [CrossRef]
  28. Sheng, X.Y.; Lai, Y.J.; Yu, S.J.; Li, Q.C.; Zhou, Q.X.; Liu, J.F. Quantitation of Atmospheric Suspended Polystyrene Nanoplastics by Active Sampling Prior to Pyrolysis-Gas Chromatography-Mass Spectrometry. Environ. Sci. Technol. 2023, 57, 10754–10762. [Google Scholar] [CrossRef]
  29. Seeley, M.E.; Lynch, J.M. Previous successes and untapped potential of pyrolysis-GC/MS for the analysis of plastic pollution. Anal. Bioanal. Chem. 2023, 415, 2873–2890. [Google Scholar] [CrossRef]
  30. Santos, L.; Insa, S.; Arxé, M.; Buttiglieri, G.; Rodríguez-Mozaz, S.; Barceló, D. Analysis of microplastics in the environment: Identification and quantification of trace levels of common types of plastic polymers using pyrolysis-GC/MS. Methodsx 2023, 10, 9. [Google Scholar] [CrossRef]
  31. Mizuguchi, H.; Takeda, H.; Kinoshita, K.; Takeuchi, M.; Takayanagi, T.; Teramae, N.; Pipkin, W.; Matsui, K.; Watanabe, A.; Watanabe, C. Direct analysis of airborne microplastics collected on quartz filters by pyrolysis-gas chromatography/mass spectrometry. J. Anal. Appl. Pyrolysis 2023, 171, 105946. [Google Scholar] [CrossRef]
  32. Goßmann, I.; Herzke, D.; Held, A.; Schulz, J.; Nikiforov, V.; Georgi, C.; Evangeliou, N.; Eckhardt, S.; Gerdts, G.; Wurl, O.; et al. Occurrence and backtracking of microplastic mass loads including tire wear particles in northern Atlantic air. Nat. Commun. 2023, 14, 3707. [Google Scholar] [CrossRef] [PubMed]
  33. Xu, Y.H.; Ou, Q.; Jiao, M.; Liu, G.; van der Hoek, J.P. Identification and Quantification of Nanoplastics in Surface Waterand Groundwater by Pyrolysis Gas Chromatography-MassSpectrometry. Environ. Sci. Technol. 2022, 56, 4988–4997. [Google Scholar] [CrossRef] [PubMed]
  34. O’Brien, S.; Okoffo, E.D.; O’Brien, J.W.; Ribeiro, F.; Wang, X.; Wright, S.L.; Samanipour, S.; Rauert, C.; Toapanta, T.Y.A.; Albarracin, R.; et al. Airborne emissions of microplastic fibres from domestic laundry dryers. Sci. Total Environ. 2020, 747, 141175. [Google Scholar] [CrossRef]
  35. Hasager, F.; Björgvinsdóttir, Þ.N.; Vinther, S.F.; Christofili, A.; Kjærgaard, E.R.; Petters, S.S.; Bilde, M.; Glasius, M. Development and validation of an analytical pyrolysis method for detection of airborne polystyrene nanoparticles. J. Chromatogr. A 2024, 1717, 464622. [Google Scholar] [CrossRef]
  36. Gregoris, E.; Gallo, G.; Rosso, B.; Piazza, R.; Corami, F.; Gambaro, A. Microplastics analysis: Can we carry out a polymeric characterisation of atmospheric aerosol using direct inlet Py-GC/MS? J. Anal. Appl. Pyrolysis 2023, 170, 105903. [Google Scholar] [CrossRef]
  37. Tsuge, S.; Ohtani, H.; Watanabe, C. Pyrolysis-GC/MS Data Book of Synthetic Polymers: Pyrograms, Thermograms and MS of Pyrolyzates, 1st ed.; Elsevier B.V.: Amsterdam, The Netherlands, 2011. [Google Scholar]
  38. Dibke, C.; Fischer, M.; Scholz-Böttcher, B.M. Microplastic Mass Concentrations and Distribution in German Bight Waters by Pyrolysis-Gas Chromatography-Mass Spectrometry/Thermochemolysis Reveal Potential Impact of Marine Coatings: Do Ships Leave Skid Marks? Environ. Sci. Technol. 2021, 55, 2285–2295. [Google Scholar] [CrossRef]
  39. Wu, J.; Chen, T.; Luo, X.; Han, D.; Wang, Z.; Wu, J. TG/FTIR analysis on co-pyrolysis behavior of PE, PVC and PS. Waste Manag. 2014, 34, 676–682. [Google Scholar] [CrossRef]
  40. Okoffo, E.D.; Ribeiro, F.; O’Brien, J.W.; O’Brien, S.; Tscharke, B.J.; Gallen, M.; Samanipour, S.; Mueller, J.F.; Thomas, K.V. Identification and quantification of selected plastics in biosolids by pressurized liquid extraction combined with double-shot pyrolysis gas chromatography-mass spectrometry. Sci. Total Environ. 2020, 715, 136924. [Google Scholar] [CrossRef]
  41. Lou, F.; Wang, J.; Sun, C.; Song, J.; Wang, W.; Pan, Y.; Huang, Q.; Yan, J. Influence of interaction on accuracy of quantification of mixed microplastics using Py-GC/MS. J. Environ. Chem. Eng. 2022, 10, 108012. [Google Scholar] [CrossRef]
  42. Singh, R.K.; Ruj, B.; Sadhukhan, A.K.; Gupta, P. A TG-FTIR investigation on the co-pyrolysis of the waste HDPE, PP, PS and PET under high heating conditions. J. Energy Inst. 2020, 93, 1020–1035. [Google Scholar] [CrossRef]
  43. Li, Q.C.; Lai, Y.J.; Yu, S.J.; Li, P.; Zhou, X.X.; Dong, L.J.; Liu, X.; Yao, Z.W.; Liu, J.F. Sequential Isolation of Microplastics and Nanoplastics in Environmental Waters by Membrane Filtration, Followed by Cloud-Point Extraction. Anal. Chem. 2021, 93, 4559–4566. [Google Scholar] [CrossRef] [PubMed]
  44. Zhou, X.X.; He, S.; Gao, Y.; Chi, H.Y.; Wang, D.J.; Li, Z.C.; Yan, B. Quantitative Analysis of Polystyrene and Poly(methyl methacrylate) Nanoplastics in Tissues of Aquatic Animals. Environ. Sci. Technol. 2021, 55, 3032–3040. [Google Scholar] [CrossRef] [PubMed]
  45. O’Brien, S.; Okoffo, E.D.; Rauert, C.; O’Brien, J.W.; Ribeiro, F.; Burrows, S.D.; Toapanta, T.; Wang, X.; Thomas, K.V. Quantification of selected microplastics in Australian urban road dust. J. Hazard. Mater. 2021, 416, 125811. [Google Scholar] [CrossRef]
  46. Hermabessiere, L.; Himber, C.; Boricaud, B.; Kazour, M.; Amara, R.; Cassone, A.-L.; Laurentie, M.; Paul-Pont, I.; Soudant, P.; Dehaut, A.J.A. Optimization, performance, and application of a pyrolysis-GC/MS method for the identification of microplastics. Anal. Bioanal. Chem. 2018, 410, 6663–6676. [Google Scholar] [CrossRef]
  47. Zhai, J.; Wang, X.; Li, J.; Xu, T.; Chen, H.; Yang, X.; Chen, J. Thermal desorption single particle mass spectrometry of ambient aerosol in Shanghai. Atmos. Environ. 2015, 123, 407–414. [Google Scholar] [CrossRef]
Figure 1. The Py-GC/MS system equipped with a Henxi PY-1S Pyrolyzer and a Thermo Scientific ISQ 7610 GC/MS.
Atmosphere 16 00476 g001
Figure 2. TGA profiles of (a) PET, (b) PS, (c) PP, (d) PVC, (e) PE, and (f) PMMA microparticles.
Atmosphere 16 00476 g002
Figure 3. Py-GC/MS TIC chromatograms of injection blanks. (a) Instrumental blank; (b) injection blank without He purging; (c) injection blank with He purging for 30 s; (d) injection blank with He purging for 5 min; (e) injection blank with He purging for 10 min.
Atmosphere 16 00476 g003
Figure 4. Py-GC/MS TIC chromatograms of the 6 common microplastic standards. C7: 1-heptene; C8: 1-octene; C9: 1-nonene; C10: 1-decene; C11: 1-undecene; C12: 1-dodecene; C13: 1-tridecene; C14: 1-tetradecene; C15: 1-pentadecene; C16:1-cetene; C17: 1-heptadecene; C18:1-octadecene; C19: 1-nonadecene; C20: 1-eicosene.
Atmosphere 16 00476 g004
Figure 5. Quantitative uncertainty expressed by different characteristic pyrolysates for mixed microplastics. (a) Interference of co-pyrolysis on PET, PP, PS, and PMMA; (b) Interference of co-pyrolysis on PVC and PE. B: benzene; VB: vinyl benzoate; BA: benzoic acid; DP: diphenyl; PC9: 2,4-dimethyl-1-heptene; PC10: 2,4,6-trimethyl-1-heptene; PC12: 4,6,8-trimethyl-1-nonene; PC15: 2, 4, 6, 8-tetramethyl-1-undecene; S: styrene; T: toluene; αMS: α-methyl styrene; BBz: bibenzyl; SS: styrene dimer; MA: methyl acrylate; MMA: methyl methacrylate; EB: ethylbenzene; I: indene; MI: 1-methylindene; N: naphthalene; MN: 1-methyl naphthalene; C8: 1-octene; C9: 1-nonene; C10: 1-decene; C11: 1-undecene; C12: 1-dodecene; C13: 1-tridecene; C14: 1-tetradecene; C15: 1-pentadecene; C16: 1-cetene.
Atmosphere 16 00476 g005
Figure 6. Abundance of characteristic pyrolysates against pyrolysis temperatures for the 6 common microplastics. B: benzene; VB: vinyl benzoate; BA: benzoic acid; DP: diphenyl; DET: divinyl terephthalate; S: styrene; T: toluene; αMS: α-methyl styrene; BBn: bibenzyl; SS: styrene dimer; PC9: 2,4-dimethyl-1-heptene; PC10: 2,4,6-trimethyl-1-heptene; PC12: 4,6,8-trimethyl-1-nonene; PC15: 2, 4, 6, 8-tetramethyl-1-undecene; E: ethylbenzene; X1: xylene; I: indene; MI: 1-methylindene; N: naphthalene; MN: 1-methyl naphthalene; AC: acenaphthene; C9: 1-nonene; C10: 1-decene; C11: 1-undecene; C12: 1-dodecene; C13: 1-tridecene; C14: 1-tetradecene; C15: 1-pentadecene; C16: 1-cetene.
Atmosphere 16 00476 g006
Figure 7. Calibration curves for the 6 common microplastics. (a) PET, (b) PS; (c) PP; (d) PVC; (e) PE; (f) PMMA.
Atmosphere 16 00476 g007
Figure 8. Distribution of microplastics in ambient samples determined by two Py-GC/MS systems. The average mass of a certain microplastic in black font is determined by the Frontier PY-3030D and in blue font is determined by the Henxi PY-S1. (a) PVC, PE, PP, and PET: (b) PS and PMMA.
Atmosphere 16 00476 g008
Table 1. Analytical conditions for Py-GC/MS.
ApparatusParametersSettings
PyrolyzerPyrolysis temperature650 °C
Interface temperature320 °C
Pyrolysis time5 s
Gas ChromatographCarrier gasHelium
Injection modeSplit
Split ratio50:1
Injection temperature300 °C
ColumnTG-5SILMS (30 m, 0.25 mm I.D., 0.25 μm film thickness)
Column flow1 mL min−1
Temperature program 40   ° C   ( 2 min ) 10   ° C min 1 300   ° C   ( 3 min )
Transfer line temperature280 °C
Mass SpectrometerIonization energy70 eV
Ion source temperature280 °C
Scan rate0.2 s
Scan range39 to 650 m/z
Table 2. Characteristic pyrolysate, indicator ion, and retention time for the six common microplastics.
PlasticCharacteristic CompoundAbbreviationIndicator Ion
(m/z)
Retention Time (min)
PETbenzeneB30, 52, 74, 78, 2.44
vinyl benzoateVB51, 77, 105, 148 9.99
benzoic acidBA77, 105, 12210.51
diphenylDP76, 131, 154 13.53
diethylene terephthalateDET163, 194 15.71
ethylene glycol dibenzoateEGD77, 105, 227 21.86
PP2-methyl-1-pentenePC656, 69, 84 2.01
2,4-dimethyl-1-heptenePC970, 83, 1264.95
2,4,6-trimethyl-1-heptenePC1070, 83, 111, 1265.84
4,6,8-trimethyl-1-nonenePC1297, 112, 12512.29
2, 4, 6, 8-tetramethyl-1-undecenePC1583, 111, 125 13.51
PStolueneT51, 65, 89, 91 3.76
styreneS98, 1045.88
α-methylstyreneαMS78, 103, 1187.46
bibenzylBBz65, 91, 18215.27
styrene dimerSS91, 130, 193, 20817.54
Styrene trimerSSS91, 117, 194, 207, 31224.21
PMMAmethyl acrylateMA55, 852.06
methyl methacrylateMMA69, 89, 1002.93
PVCbenzeneB39, 52, 74, 782.44
tolueneT51, 65, 89, 913.76
ethylbenzeneEB77, 91, 1065.34
xyleneX177, 91, 1065.60
styreneS78, 1045.88
indeneI116, 1198.54
1-methylindeneMI51, 64, 77, 91, 115, 130, 13210.23
naphthaleneN77, 102, 116, 128, 14610.81
1-methylnaphthaleneMN91, 115, 129, 142, 15812.63
acenaphtheneAC76, 102, 128, 143, 154 13.96
PE1-hepteneC770, 83, 982.76
1-octeneC870, 83, 1124.12
1-noneneC983, 97, 1115.83
1-deceneC1083, 97, 111, 1407.56
1-undeceneC1183, 97, 111, 126, 1529.22
1-dodeceneC1283, 97, 111, 12510.74
1-trideceneC1383, 97, 111, 12512.16
1-tetradeceneC1483, 97, 55, 69, 111, 125, 14013.51
1-pentadeceneC1555, 69, 83, 97, 11114.76
1-ceteneC1655, 69, 8315.96
1-heptadeceneC1755, 69, 8317.09
1-octadeceneC1883, 97, 111, 24618.15
1-nonadeceneC1983, 97, 111, 24619.18
1-eicoseneC2083, 97, 111, 20720.13
Table 3. Peak area of methyl methacrylate pyrolyzed from PMMA in 15 days.
DateMS Peak Area (Counts × min)TIC Peak Area (Counts × min)
1st1,395,2007,406,631
3rd1,267,0586,744,248
4th1,093,7115,886,701
7th1,117,2026,028,831
8th1,112,8765,994,636
15th1,704,1819,236,345
RSD (%)
(8 Days)
9.769.08
RSD (%)
(15 Days)
18.5518.77
Disclaimer/Publisher’s Note: The statements, opinions and data contained in all publications are solely those of the individual author(s) and contributor(s) and not of MDPI and/or the editor(s). MDPI and/or the editor(s) disclaim responsibility for any injury to people or property resulting from any ideas, methods, instructions or products referred to in the content.

