Article

Synergistic Effects of Multiple Monsoon Systems on Autumn Precipitation in West China

1
College of Ocean and Meteorology, Guangdong Ocean University, Zhanjiang 524088, China
2
Shenzhen Institute of Guangdong Ocean University, Shenzhen 518120, China
*
Author to whom correspondence should be addressed.
Atmosphere 2025, 16(4), 481; https://doi.org/10.3390/atmos16040481
Submission received: 8 March 2025 / Revised: 15 April 2025 / Accepted: 18 April 2025 / Published: 20 April 2025
(This article belongs to the Section Climatology)

Abstract

:
Multiple monsoon systems impact autumn precipitation in West China; however, their synergistic influence is unknown. Here, we employed statistical analysis of Global Precipitation Climatology Project Version 3.2 precipitation data, European Center for Medium-Range Weather Forecasts ERA5 reanalysis data, and Coupled Model Intercomparison Project model data, and calculated four monsoon indices to analyze the features of the East Asian Monsoon, South Asian Monsoon, Asia Zonal Circulation, and Tibetan Plateau Monsoon, as well as their synergistic impacts on autumn precipitation in West China. The East Asian Monsoon negatively influences autumn precipitation in West China through closed high pressure over Northeast China. The South Asian Monsoon encloses West China between two areas of closed high pressure; strong high pressure to the north guides the abnormal transport of cold air in Northwest China, whereas strong western Pacific subtropical high pressure guides the transport of warm and wet air to West China, which is conducive to the formation of autumn precipitation in West China. During years of strong Asia Zonal Circulation, West China is controlled by an anomalous sinking airflow, which is not conducive to the occurrence of autumn rain. During strong Tibetan Plateau Monsoon, western and southwestern China are affected by plateau subsidence flow, resulting in less precipitation. Based on the CMIP6 model data, the study found that under the SSP5-8.5 emission scenario, the future trends of the four monsoon systems will show significant differences, and the amplitude of autumn and interannual precipitation oscillations in west China will increase.

1. Introduction

Owing to its location on the western side of the Pacific Ocean and complex topography, China is influenced by several monsoon systems, such as the East Asian Monsoon (EASM), South Asian Monsoon (SASM), Asian Zonal Circulation (AZC), and Tibetan Plateau Monsoon (QTPM). As a result, China exhibits six major rainy seasons: the spring rainy season south of the Yangtze River, the pre-summer season in South China, the Meiyu in the Yangtze and Huaihe valleys, the rainy season in North and Northeast China, the second or post-flooding season in South China, and the autumn rainy season in areas of West China [1].
West China autumn precipitation (WCAP) refers to the sub-maximum precipitation that occurs after the summer flood season in Southwest China. According to the meteorological industry standard “China Rainy Season Monitoring Indicators—West China Autumn Precipitation” (QX/T 496-2019) [2,3,4,5], WCAP begins every year on 21 August, when the AZC appears over West China and the western Pacific subtropical high (WPSH) weakens substantially. With the westerly trough to the south and the southward withdrawal of the subtropical high, the influence of the EASM is greatly weakened and cold air movement is initiated. The Somali cross-equatorial current is divided into two branches: the northern branch, which meets easterly current south of the West Pacific subtropical high in West China, and the southern branch, which meets trans-equatorial airflow in the South China Sea. Subsequently, warm and humid air from the West Pacific and the Bay of Bengal converges in West China, leading to persistent rainfall in West China. WCAP ends when the southern branch of westerly circulation stabilizes over Asia and the Indian monsoon retreats completely. Although WCAP exhibits high interannual variability, the frequency of droughts, floods, and extreme precipitation events is increasing with global warming.
The EASM and SASM are closely linked and have an important influence on precipitation in China [6,7,8]; however, these systems exhibit notable differences. Water vapor transport in the SASM is inversely correlated with that of the EASM, with strong (weak) water vapor transport in East Asia corresponding to high (low) summer precipitation in India [9]. The main EASM and SASM systems that affect precipitation in China are the WPSH, Somali equatorial current, Indo-Burma trough, and Baikal trough. Changes in the location and strength of the WPSH affect the distribution of rainbands, and the transport of warm and humid moisture from the Pacific Ocean along the south side of the WPSH affects precipitation in West China [10]. When the WPSH occurs to the west and north of China, WCAP increases; when the WPSH retreats to the east and south, WCAP decreases. Additionally, changes in the position of the westerly jet stream (WAJ) have a direct effect on WCAP, with northward movement of the WAJ enhancing WCAP [11,12]. When the 200 hPa WAJ maintains a stable position at 40° N, West China is located directly to the east of the upper-air jet; thus, updrafts help to release unstable energies, whereas southward movement of the WAJ may lead to a decrease in WCAP [13]. Interaction between the WAJ and WPSH also affects WCAP. Enhancement of the WPSH may strengthen the WAJ, which may increase WCAP. When the center of the WAJ moves westward and the central band of strong wind speeds narrows, upward motion in Northwest China is strengthened, leading to relatively more autumn rain in the region [14,15]. The intensity of the Tibetan Plateau summer monsoon (TPSM) is inversely correlated with the probability of extreme precipitation in the southwest region [16], i.e., when the TPSM is strongest, easterly winds prevail over the southwest region, anomalous subsidence of the middle layer creates unfavorable conditions for generating precipitation, and the probability of extreme precipitation is small. Conversely, when the TPSM is weakest, westerly winds prevail over the southwest region, uplifting motion is enhanced in the middle layer, and a large-scale water vapor convergence zone develops in the central part of the southwest region, which leads to an increase in precipitation and a high probability of extreme precipitation.
Previous research has examined the individual influences of each monsoon system on WCAP, with few studies investigating the synergistic influence of the EASM, SASM, AZC, and QTPM [10,17,18,19,20]. Therefore, in this study, we explore the synergistic effects of multiple monsoon systems on WCAP from the perspectives of dynamics and thermodynamics by dividing the relevant monsoons into two categories: (a) the EASM and SASM and (b) the AZC and QTPM. Section 2 introduces the research data and methodology; Section 3 contains the research findings: Section 3.1 reveals the correlation between each monsoon index and WCAP; Section 3.2 analyzes the circulation fields and physical quantity fields in anomalous monsoon years; and Section 3.3 predicts the future trend of WCAP under different emission scenarios simulated using Coupled Model Intercomparison Project Phase 6 (CMIP6) data.

2. Materials and Methods

2.1. Data

This study covered a temporal range from 1983 to 2022 (September, October, and November) and a spatial range from 25 to 36° N and 100 to 111° E (West China). The maps used in this study were based on an unmodified base map of China, review number GS (2020) 4619, downloaded from the website of the Standard Map Service of the Ministry of Natural Resources of the People’s Republic of China.
Precipitation information was obtained from the Global Precipitation Climatology Project (GPCPV3.2) monthly precipitation datasets spanning the period 1983–2022, with a horizontal spatial resolution of 0.5° × 0.5°. Atmospheric information was derived from the reanalyzed monthly value dataset provided by the European Center for Medium Range Weather Forecasts ERA5, spanning 1948–2022, with a horizontal resolution of 2.5° × 2.5° and 12 layers of vertical velocities, including the u, v wind field, vertical velocities, specific humidity, geopotential heights, surface temperature, etc. We also used the Hadley Center Global Sea Ice and Sea Surface Temperature monthly data profile, spanning 1870–2022, with a spatial resolution of 1° × 1°. Month-by-month data provided by the MIROC6 model in CMIP6 were used to simulate future monsoon indices and precipitation for each monsoon system.

2.2. Methods

Four monsoon indices were used in this study: the EASM, SASM, AZC, and QTPM indices (EASMI, SASMI, AZCI, and QTPMI, respectively). To better reflect the relationship between monsoon indices and WCAP, these four indices were chosen to favor the correlation between the monsoon and precipitation and were calculated from September to November each year.

2.2.1. EASMI

Sun et al. [21] used the difference between land temperature within the EASM region (27–35° N, 105° E; TEC) and sea surface temperature in the subtropical Northwest Pacific Ocean (15–30° N, 120–150° E; TSST NWP) to express the east–west thermal difference, then used the difference between land temperature in South China (south of 27° N, east of 105° E in the mainland; TSC) and sea temperature in the South China Sea (5–18° N, 105–120° E; TSCS) to represent the north–south sea–land thermal difference, thereby defining the EASMI as follows:
E A S M I = 4 / 5 T E C T S S T   N W P + 1 / 5 ( T S C T S C S )

2.2.2. SASMI

Zhang et al. [22] defined the SASMI using the area-averaged 850 hPa latitudinal winds at 85–100° E and 10–18° N minus the latitudinal winds at 83–95° E and 23–27° N as follows:
S A S M I = V | 85 ° 100 ° E ,   10 ° 18 ° N V | 83 ° 95 ° E ,   23 ° 27 ° N

2.2.3. AZCI

Rossby defined a westerly wind index reflecting the strength of latitudinal circulation, which reflects the anomaly of the mean latitudinal circulation. It is difficult to characterize local circulation anomalies in the region near East Asia; therefore, Chen et al. [23] defined an East Asian westerly wind index that expresses the local fall circulation anomaly for the East Asia region:
A Z C I = 1 / 5 [ λ = 1 5 H λ 40 ° N λ = 1 5 H λ 70 ° N ]
where H is the autumn-averaged 500 hPa geopotential height field, λ is the number of degrees of longitude taken along the circle of latitude, and λ= 1, 5 represents 80° E and 120° E, respectively.

2.2.4. QTPMI

According to the scattering field [24,25], the central area of the most apparent negative winter and summer scattering reversal on the 600 hPa plateau main body averaged over a long period of time (30–35° N, 80–100° E) was selected as the central area of the plateau main body. Then, the scattering average in this area was used to define a new scattering plateau monsoon index as follows:
Q T P M I = d i v | ( 30 ° 35 ° N , 80 ° 100 ° E )

2.2.5. Monsoon Anomaly Years

The four standardized monsoon indices (Figure 1) were used to express the strength of interannual monsoon variations, determine interannual anomalies, and screen out strong monsoon years with a standard deviation greater than 0.5, as well as weak years with a standard deviation less than −0.5. More than 10 combinations of the four monsoon systems were analyzed. After comprehensively considering the atmospheric circulation field and the response of WCAP, we screened out the combinations with evident differences, that is, the EASM and SASM combination and the AZC and QTPM combination. The subsequent mechanism analysis of each combination was categorized and discussed according to years where both monsoons were strong, both monsoons were weak, and one was strong but one was weak.

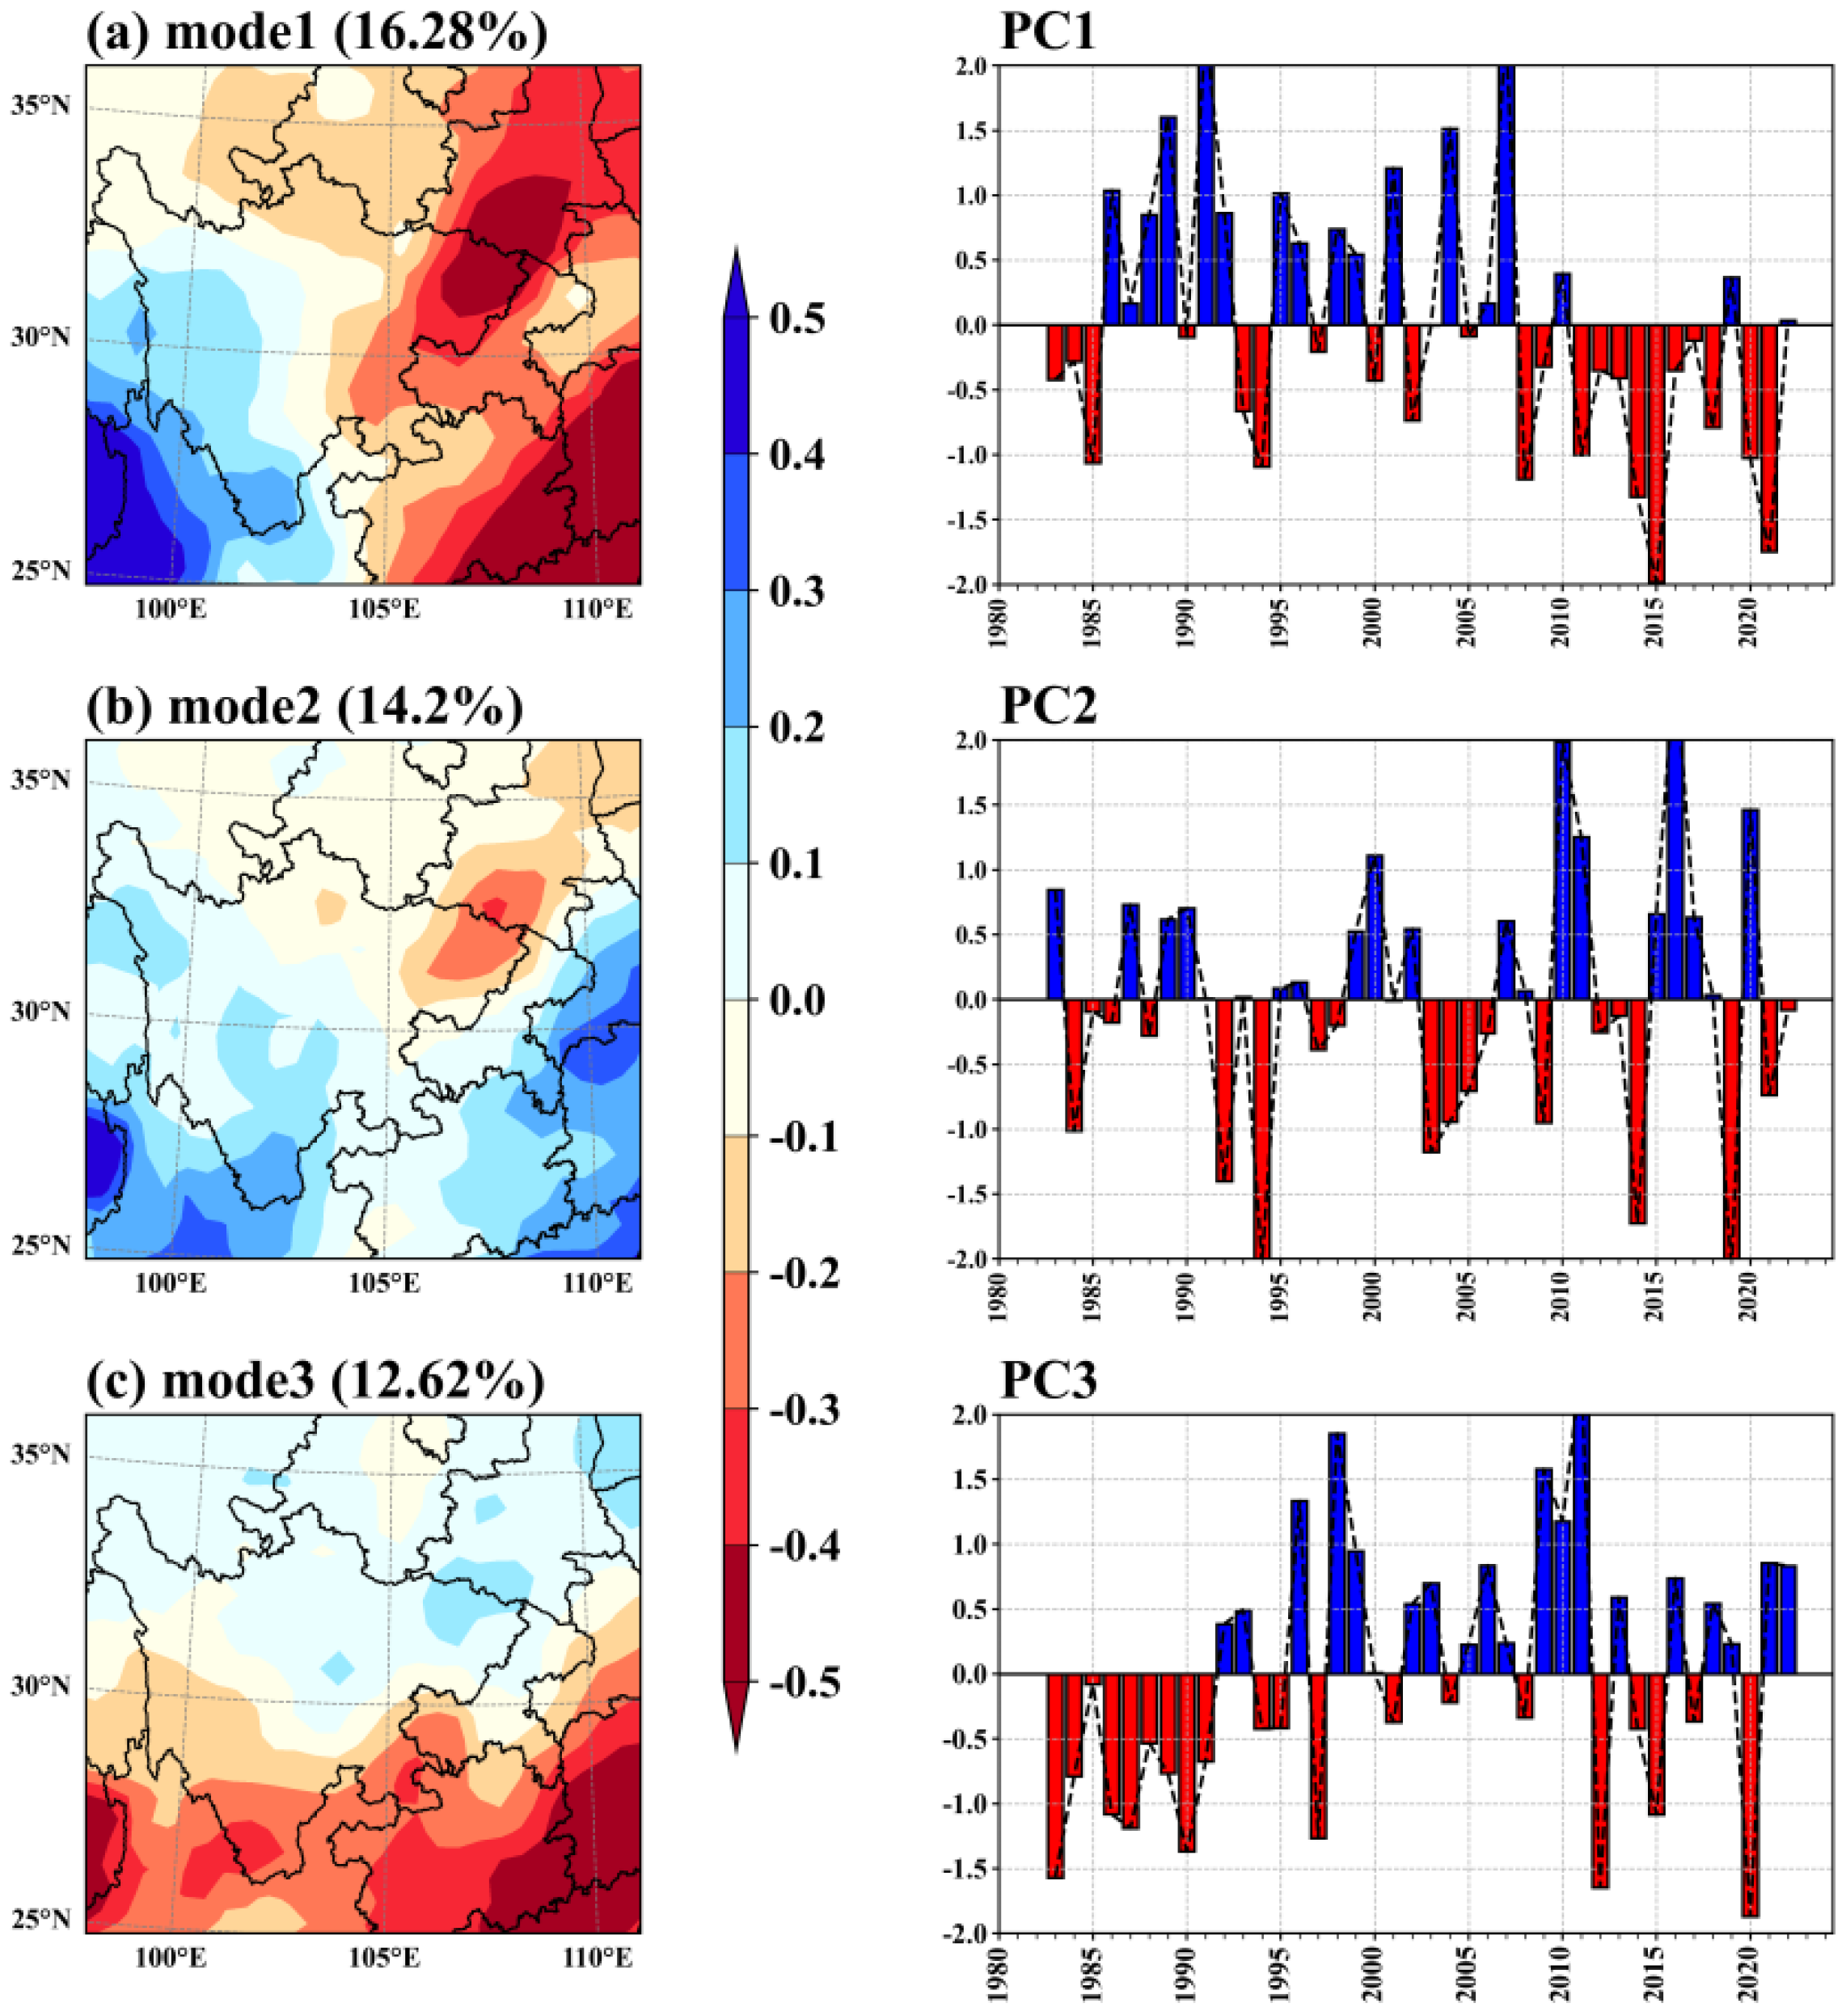
2.2.6. Empirical Orthogonal Function (EOF)

The most commonly used statistical method for studying the spatiotemporal variation characteristics of precipitation is the Empirical Orthogonal Decomposition (EOF) method [26,27,28,29,30]. This method has the advantage of fast convergence in decomposition, with the resulting eigenvectors being orthogonal to each other. The spatial modes obtained can reflect the spatial distribution characteristics of the field to a certain extent, while the corresponding time coefficients can represent the weights of each spatial mode. Therefore, it is widely used to reveal the spatiotemporal variation characteristics of meteorological fields. To investigate the spatiotemporal evolution characteristics of WCAP precipitation, this study uses monthly precipitation data from GPCPV3.2 for the period 1983–2022, applies EOF decomposition to obtain the spatial patterns and corresponding time coefficients of the main modes of WCAP, and performs correlation analysis between WCAP and four monsoon indices.
A certain meteorological element field is represented by a matrix Xm×n. Calculate the cross product of X and its transpose matrix XT to obtain a square matrix as follows:
    F m × m = 1 n X × X T
The eigenvalues (λ1, …, λm) and eigenvectors Vm×m of the square matrix F satisfy the following:
F m × m × V m × m = V m × m × E m × m
E = λ 1 0 0 0 λ 2 0   0 0     λ m
Generally speaking, λ 1 > λ 2 > > λ m . Each column of non-zero eigenvalues corresponds to the spatial mode of each eigenvector. Then, project the spatial modes onto the original data matrix Xm×n to obtain the corresponding time coefficients (PC):
P C m × n = V m × m T × X m × n
The explanation rate of the k-th mode for the total variance is as follows:
λ k i = 1 m λ i × 100 %

3. Results

3.1. Correlation Between Monsoon Indices and WCAP

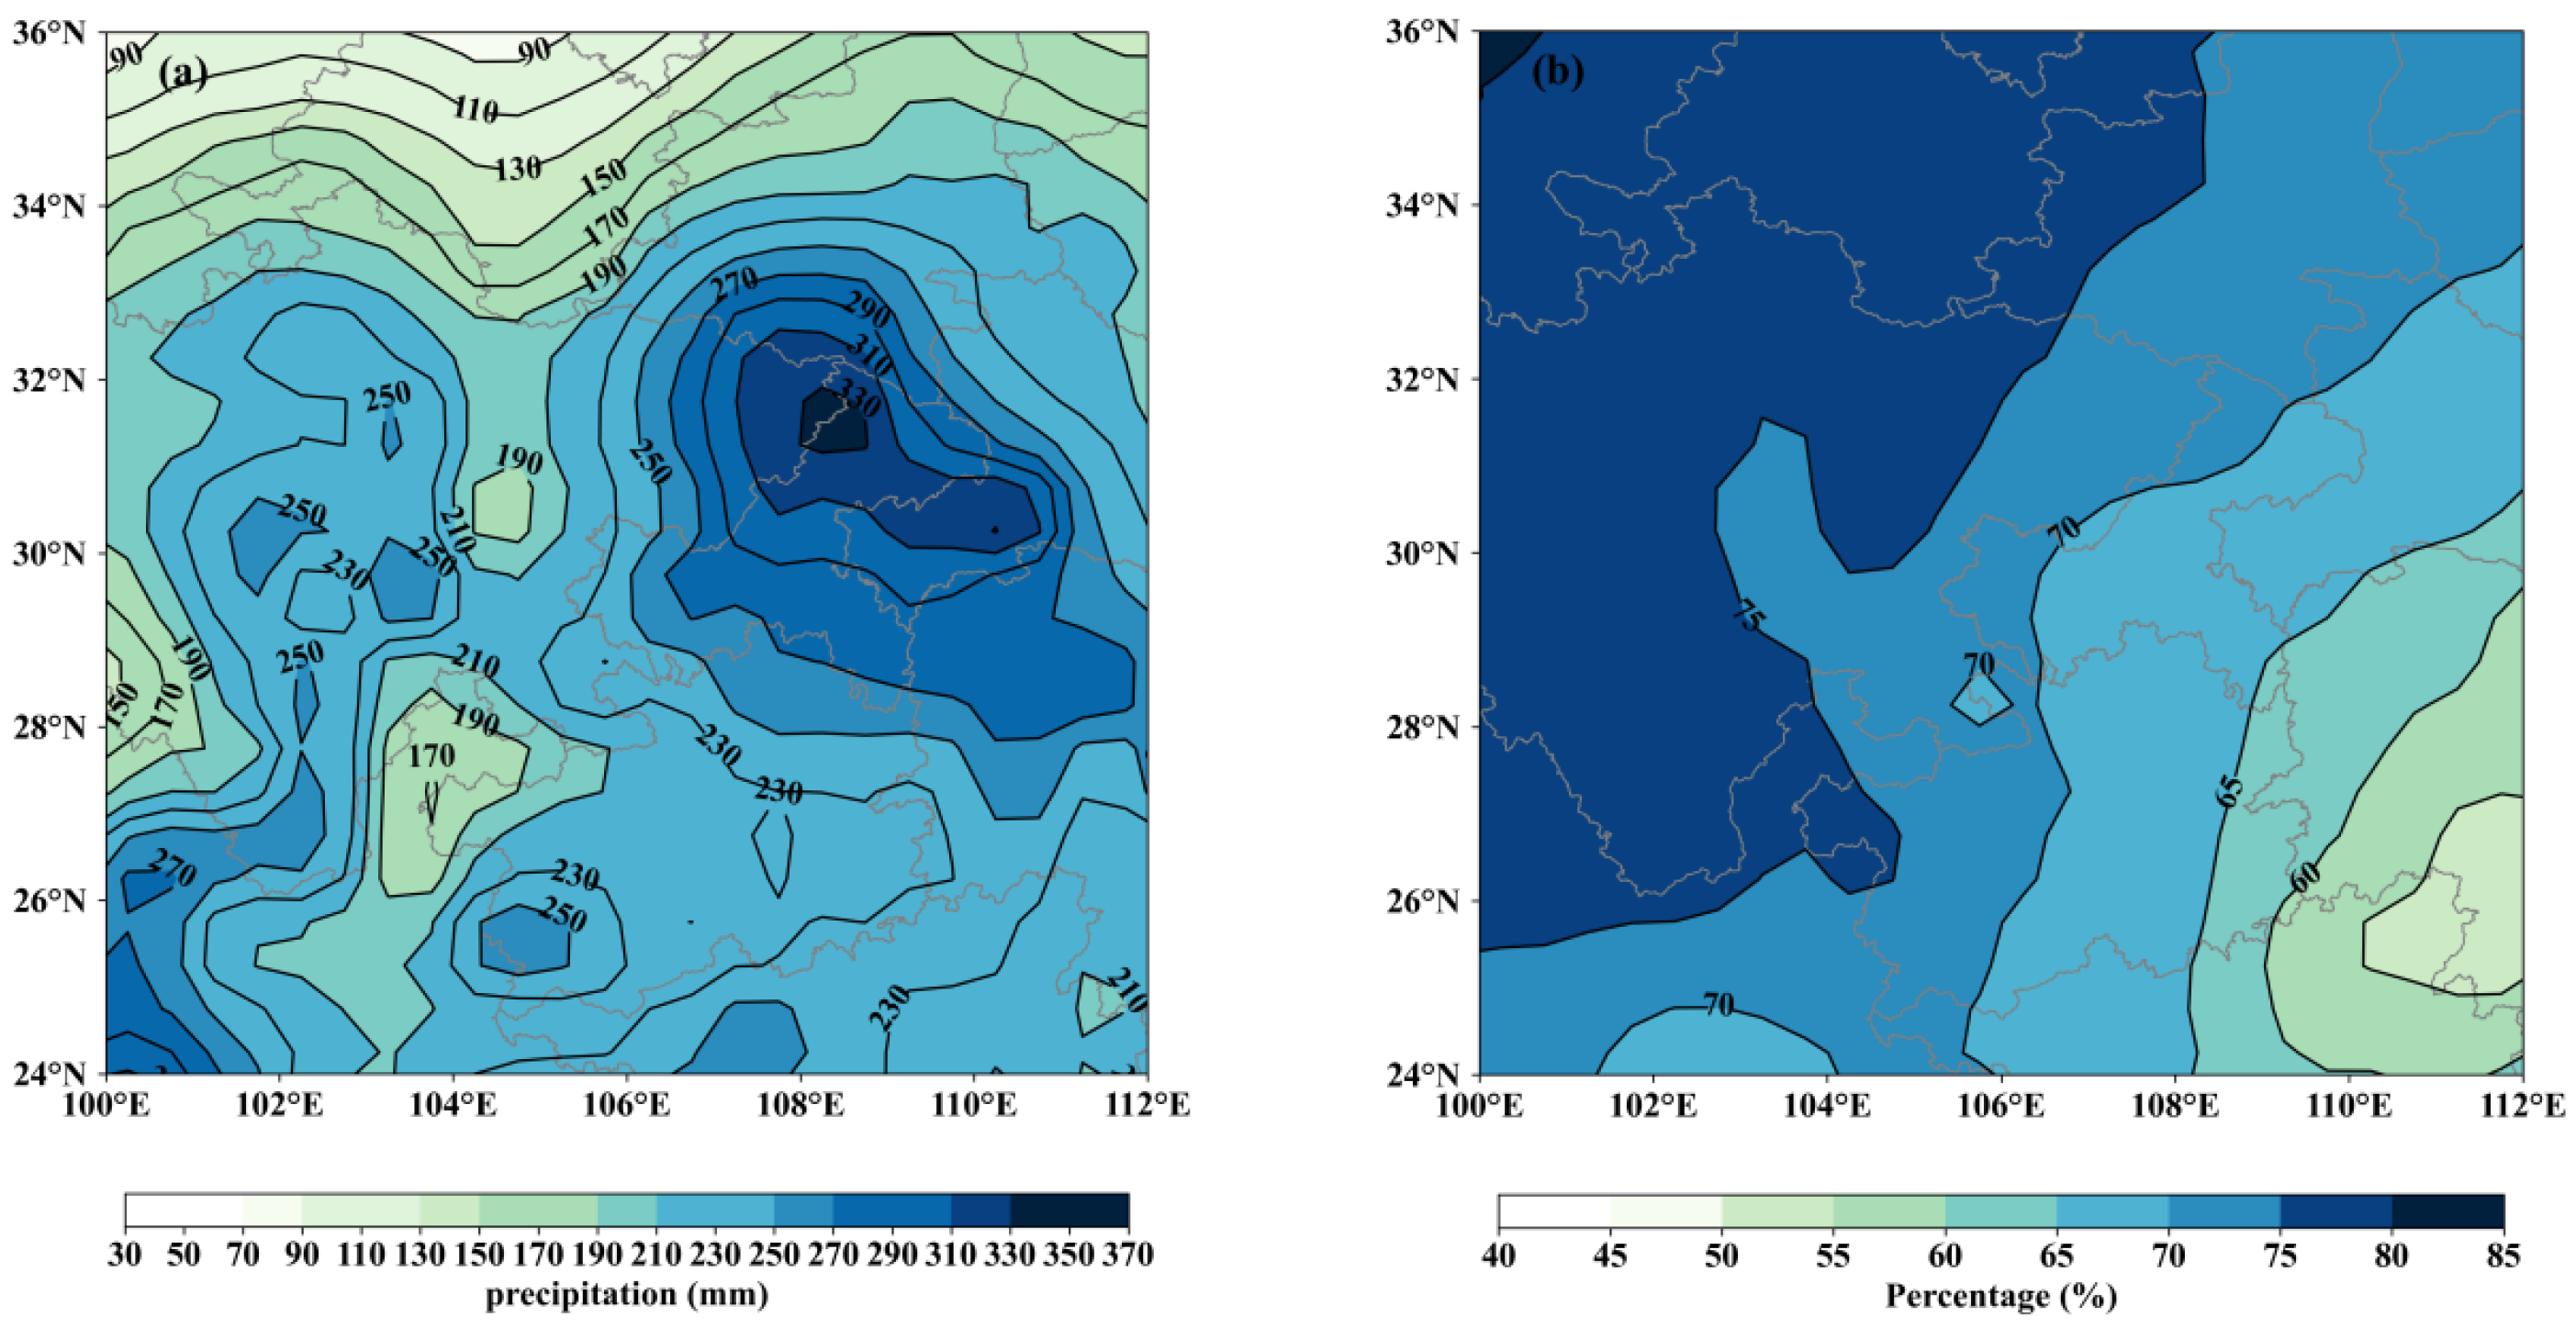
3.1.1. Basic Characteristics of WCAP

The spatial distribution of WCAP averaged from 1983 to 2022 (Figure 2a) is extremely heterogeneous because of the influence of topography and circulation systems. Precipitation ranges from 80 to 400 mm, with more precipitation falling in the eastern and southwestern parts of West China and less precipitation falling in the central and northern parts of the region. Several centers of high precipitation exist, with the largest precipitation center located in the border area of Chongqing, Sichuan, and Shaanxi Provinces, and two smaller precipitation centers located in western Sichuan and western Yunnan, respectively. Further analysis of the spatial distribution of precipitation in each month of autumn in West Chinashows that high-precipitation centers gradually retreat to the southeast and decrease in magnitude over time. The distribution of high-precipitation centers in September is approximately equivalent to that for the entire autumn period. Indeed, September precipitation represents the largest contribution to autumn precipitation at 60–200 mm, followed by October then November. As shown in Figure 2b, September and October precipitation accounts for 81.6% of the maximum and 51.1% of the total autumn precipitation, representing the main contributor to WCAP. Thus, to clarify the role of monsoon indices on precipitation, the following correlation analysis and circulation field results are discussed for September and October only.
Following further empirical orthogonal function analysis of the WCAP from 1983 to 2022, the spatial distribution characteristics of the first three empirical orthogonal function modes are shown in Figure 3a–c, and their explained variances are 16.28%, 14.2%, and 12.62%, respectively, with a cumulative variance contribution of approximately 43%. The spatial distribution type of the first mode mainly exhibits the characteristics of a precipitation inverse phase change in the northeast–southwest direction. When the time coefficient anomaly of the first mode is positive (negative), the northeast has low (high) precipitation. Moreover, precipitation shows a spatial distribution reversal trend in 2008, which changes from more southwest–northeast to less southwest–northeast precipitation, and precipitation at 106–109° E and 31–34° N exhibits a sharp transition between drought and flood. The second mode has the Yangtze River at 30° N as the boundary; precipitation in the north and south changes inversely, the center of drought and flooding is the same as that in the first mode, and the interannual amplitude is intensified after 2010. The third mode shows the opposite spatial distribution to the second mode. The above findings are consistent with previous research on WCAP [31,32].

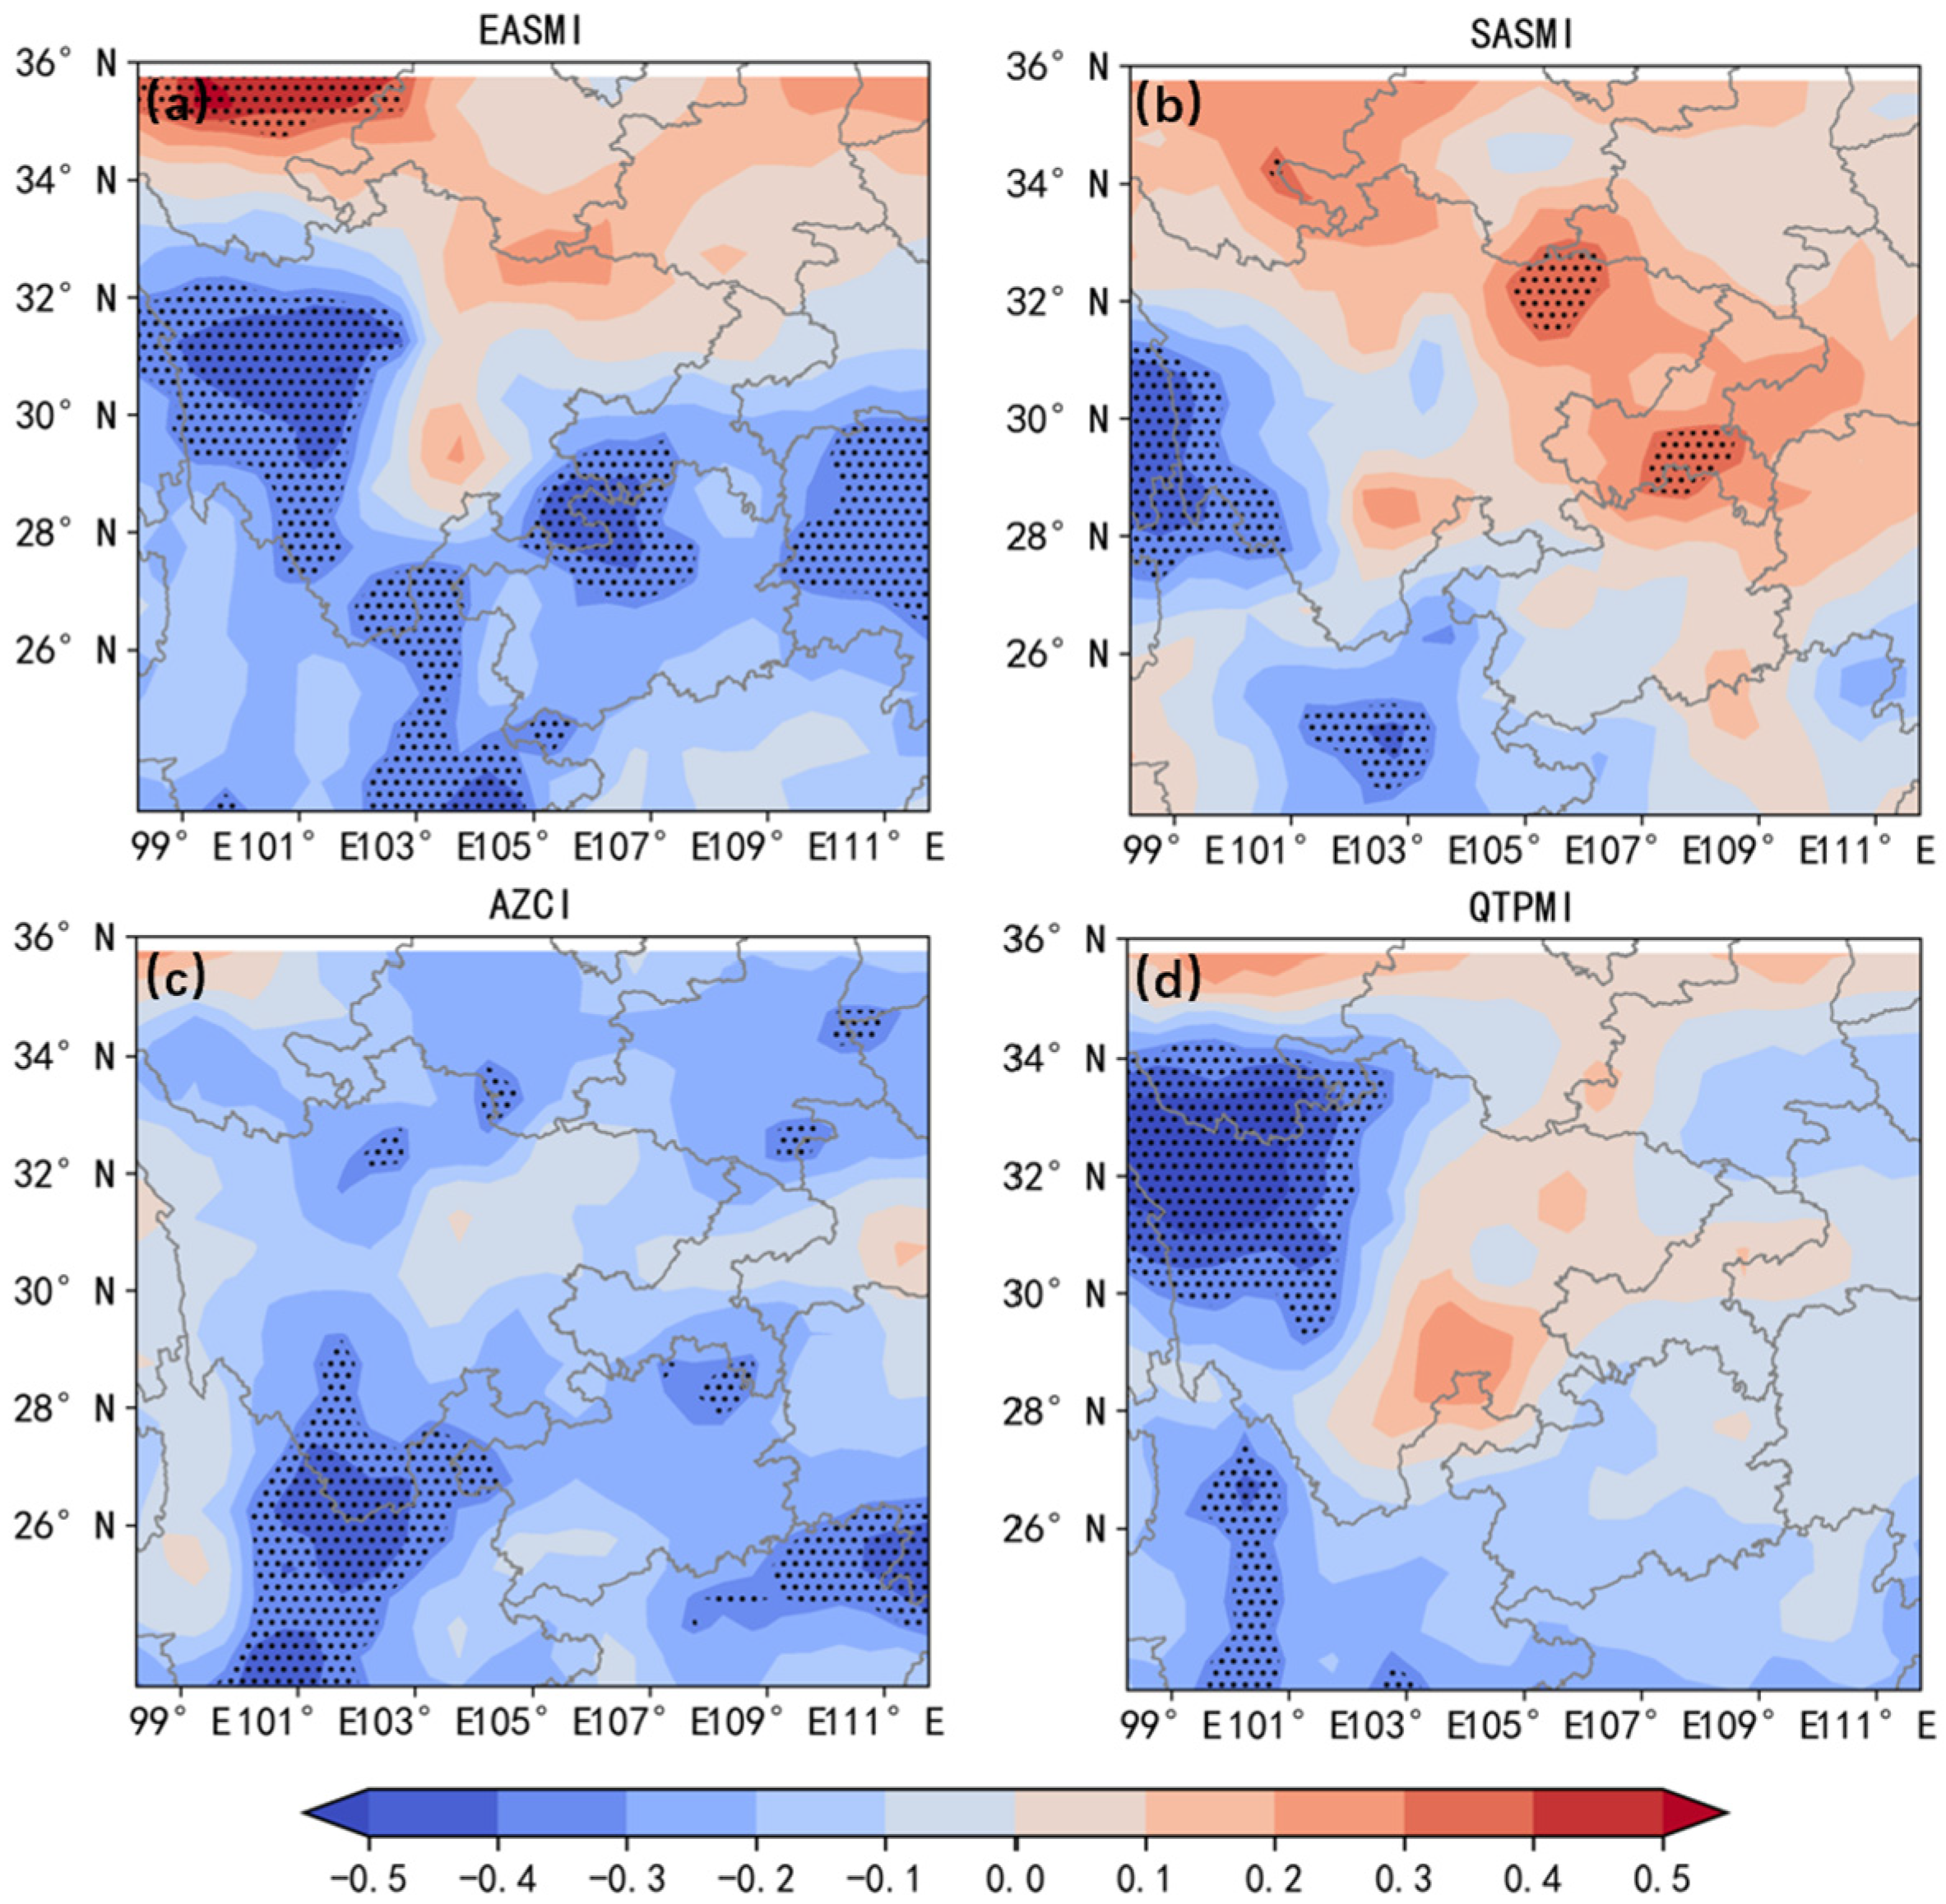
3.1.2. Correlation Analysis of Monsoon Indices and WCAP

To explore the influence of each monsoon system on WCAP, we calculated the correlation coefficients between each of the four indices and WCAP during the same period. According to Figure 4a, EASMI is predominantly negatively correlated with WCAP but positively correlated in northern China; four regions (90–112° E, 24–36° N) exhibit a significant negative correlation (passing the 95% significance test), but a significant positive correlation is observed at 98–103° E, 34–36° N. The SASMI and WCAP correlation results (Figure 4b) indicate a positive correlation region at 105–110° E, 28–33° N, and a significant negative correlation region in the southwestern part of West China. The AZCI and WCAP correlation results (Figure 4c) show an overall negative correlation, with significant negative correlation centers at 100–105° E, 24–29° N and 108–112° E, 25–26° N (passing the 95% significance test). The QTPMI and WCAP correlation results (Figure 4d) show a significant negative correlation at 98–103° E, 29–35° N (passing the 95% significance test).
Under the influence of the EASM, strong high pressure over Northeast China guides the southward movement of warm and humid air from the western Pacific (30–45° N) to the northern part of West China (Figure 5a), whereas cyclonic circulation exists south of 30° N in the western Pacific, with northerly winds at its edge in the southern part of West China. Weak high pressure exists in the Tibetan Plateau region, guiding cold air southward from the northwest. The northern part of West China exhibits convergence of warm and cold air, whereas the southern part is only affected by northerly winds. The influence of the SASM on WCAP is reflected in the pressure gradient (Figure 5b). West China is under the control of a closed low-pressure system situated between two high-pressure systems (70–110° E, 30–45° N and (90–120° E, 10–25° N), forming a north–south “+/+” pressure gradient field, guiding the transport of cold air from the northwest to the south. Water vapor transport from the Bay of Bengal was not clearly observed. The influence of the AZC is strong in the northern part of the Asian continent (Figure 5c) through strong cyclonic circulation (70–160° E, 50–80° N), with the whole of China under the control of high pressure (70–160° E, 20–50° N). This subsidence is not conducive to WCAP generation and overall northeasterly winds in West China. Under the influence of the QTPM, strong blocking high pressure occurs at 70–110° E, 45–70° N in the Ural Mountains (Figure 5d), which guides cold air southward, placing the whole of West China under the control of northerly winds.

3.2. Effects of Different Monsoon Configurations on WCAP

Thus, the correlations between WCAP and the EASM, SASM, AZC, and QTPM differ in scope, nature, and intensity, indicating that the WCAP anomaly is closely related to the influence of all four monsoon systems and results from the joint action of four major monsoon systems. Therefore, we comprehensively analyze their synergistic effects in this section.

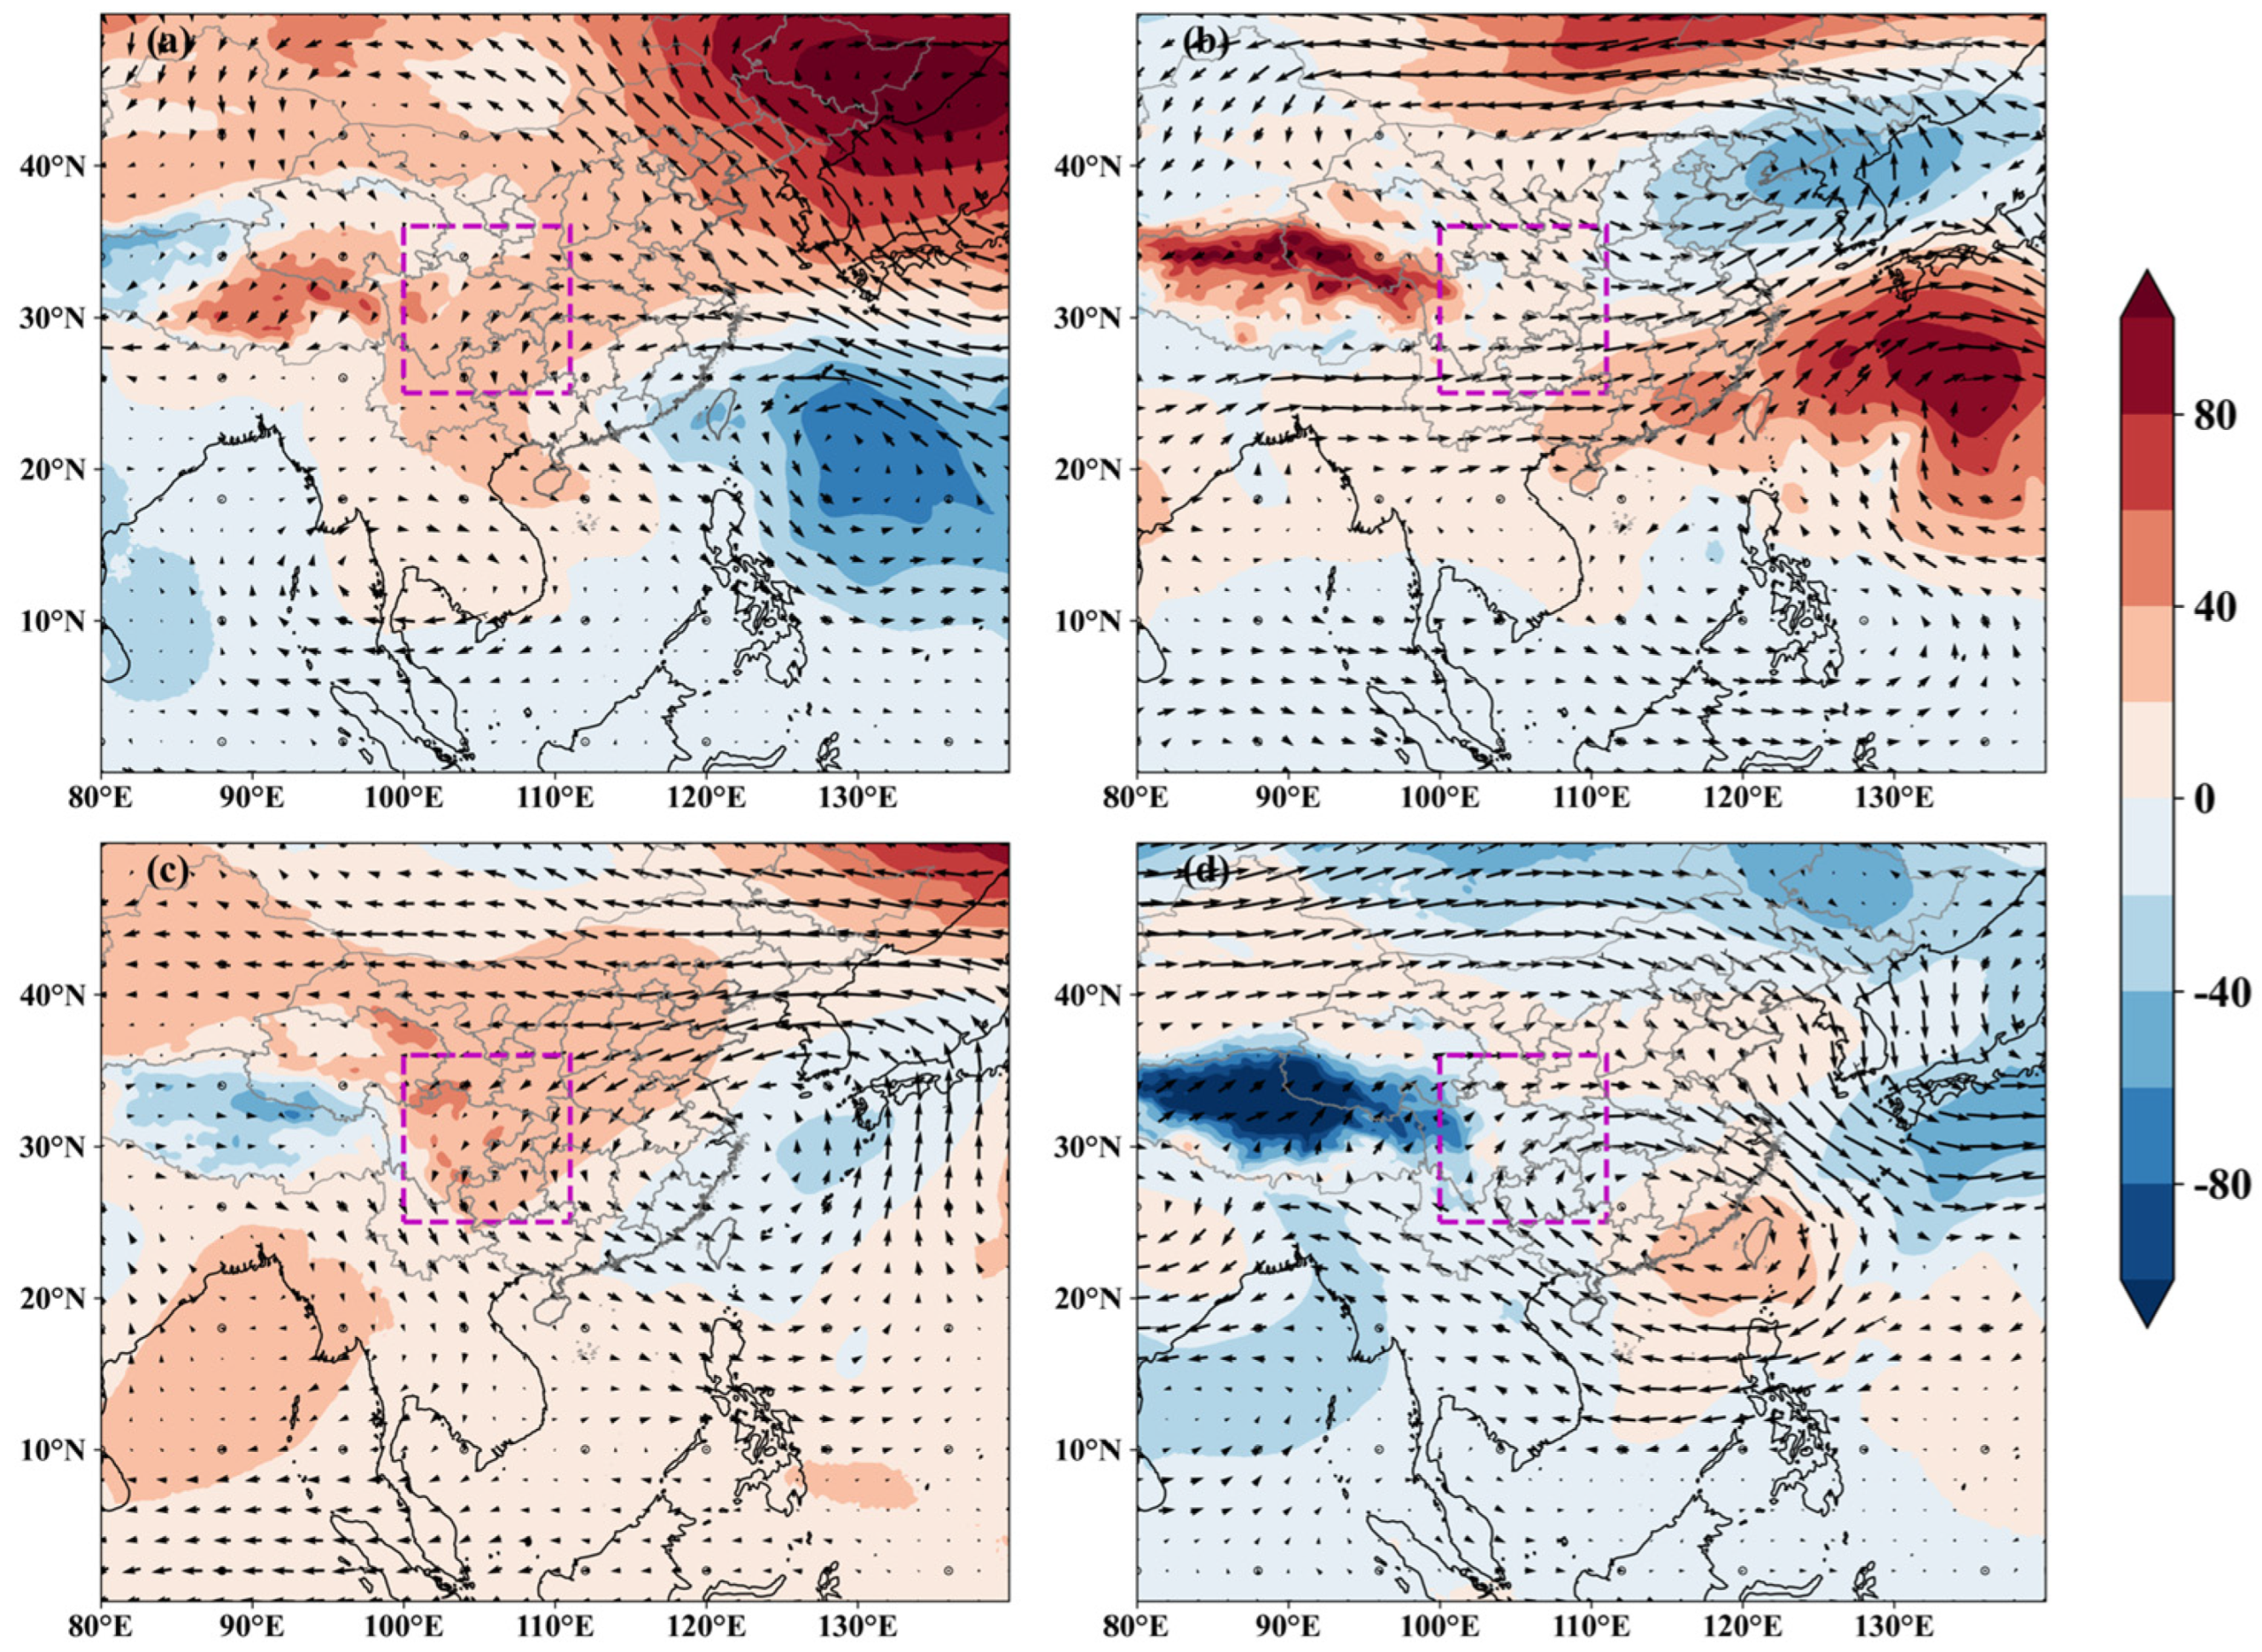
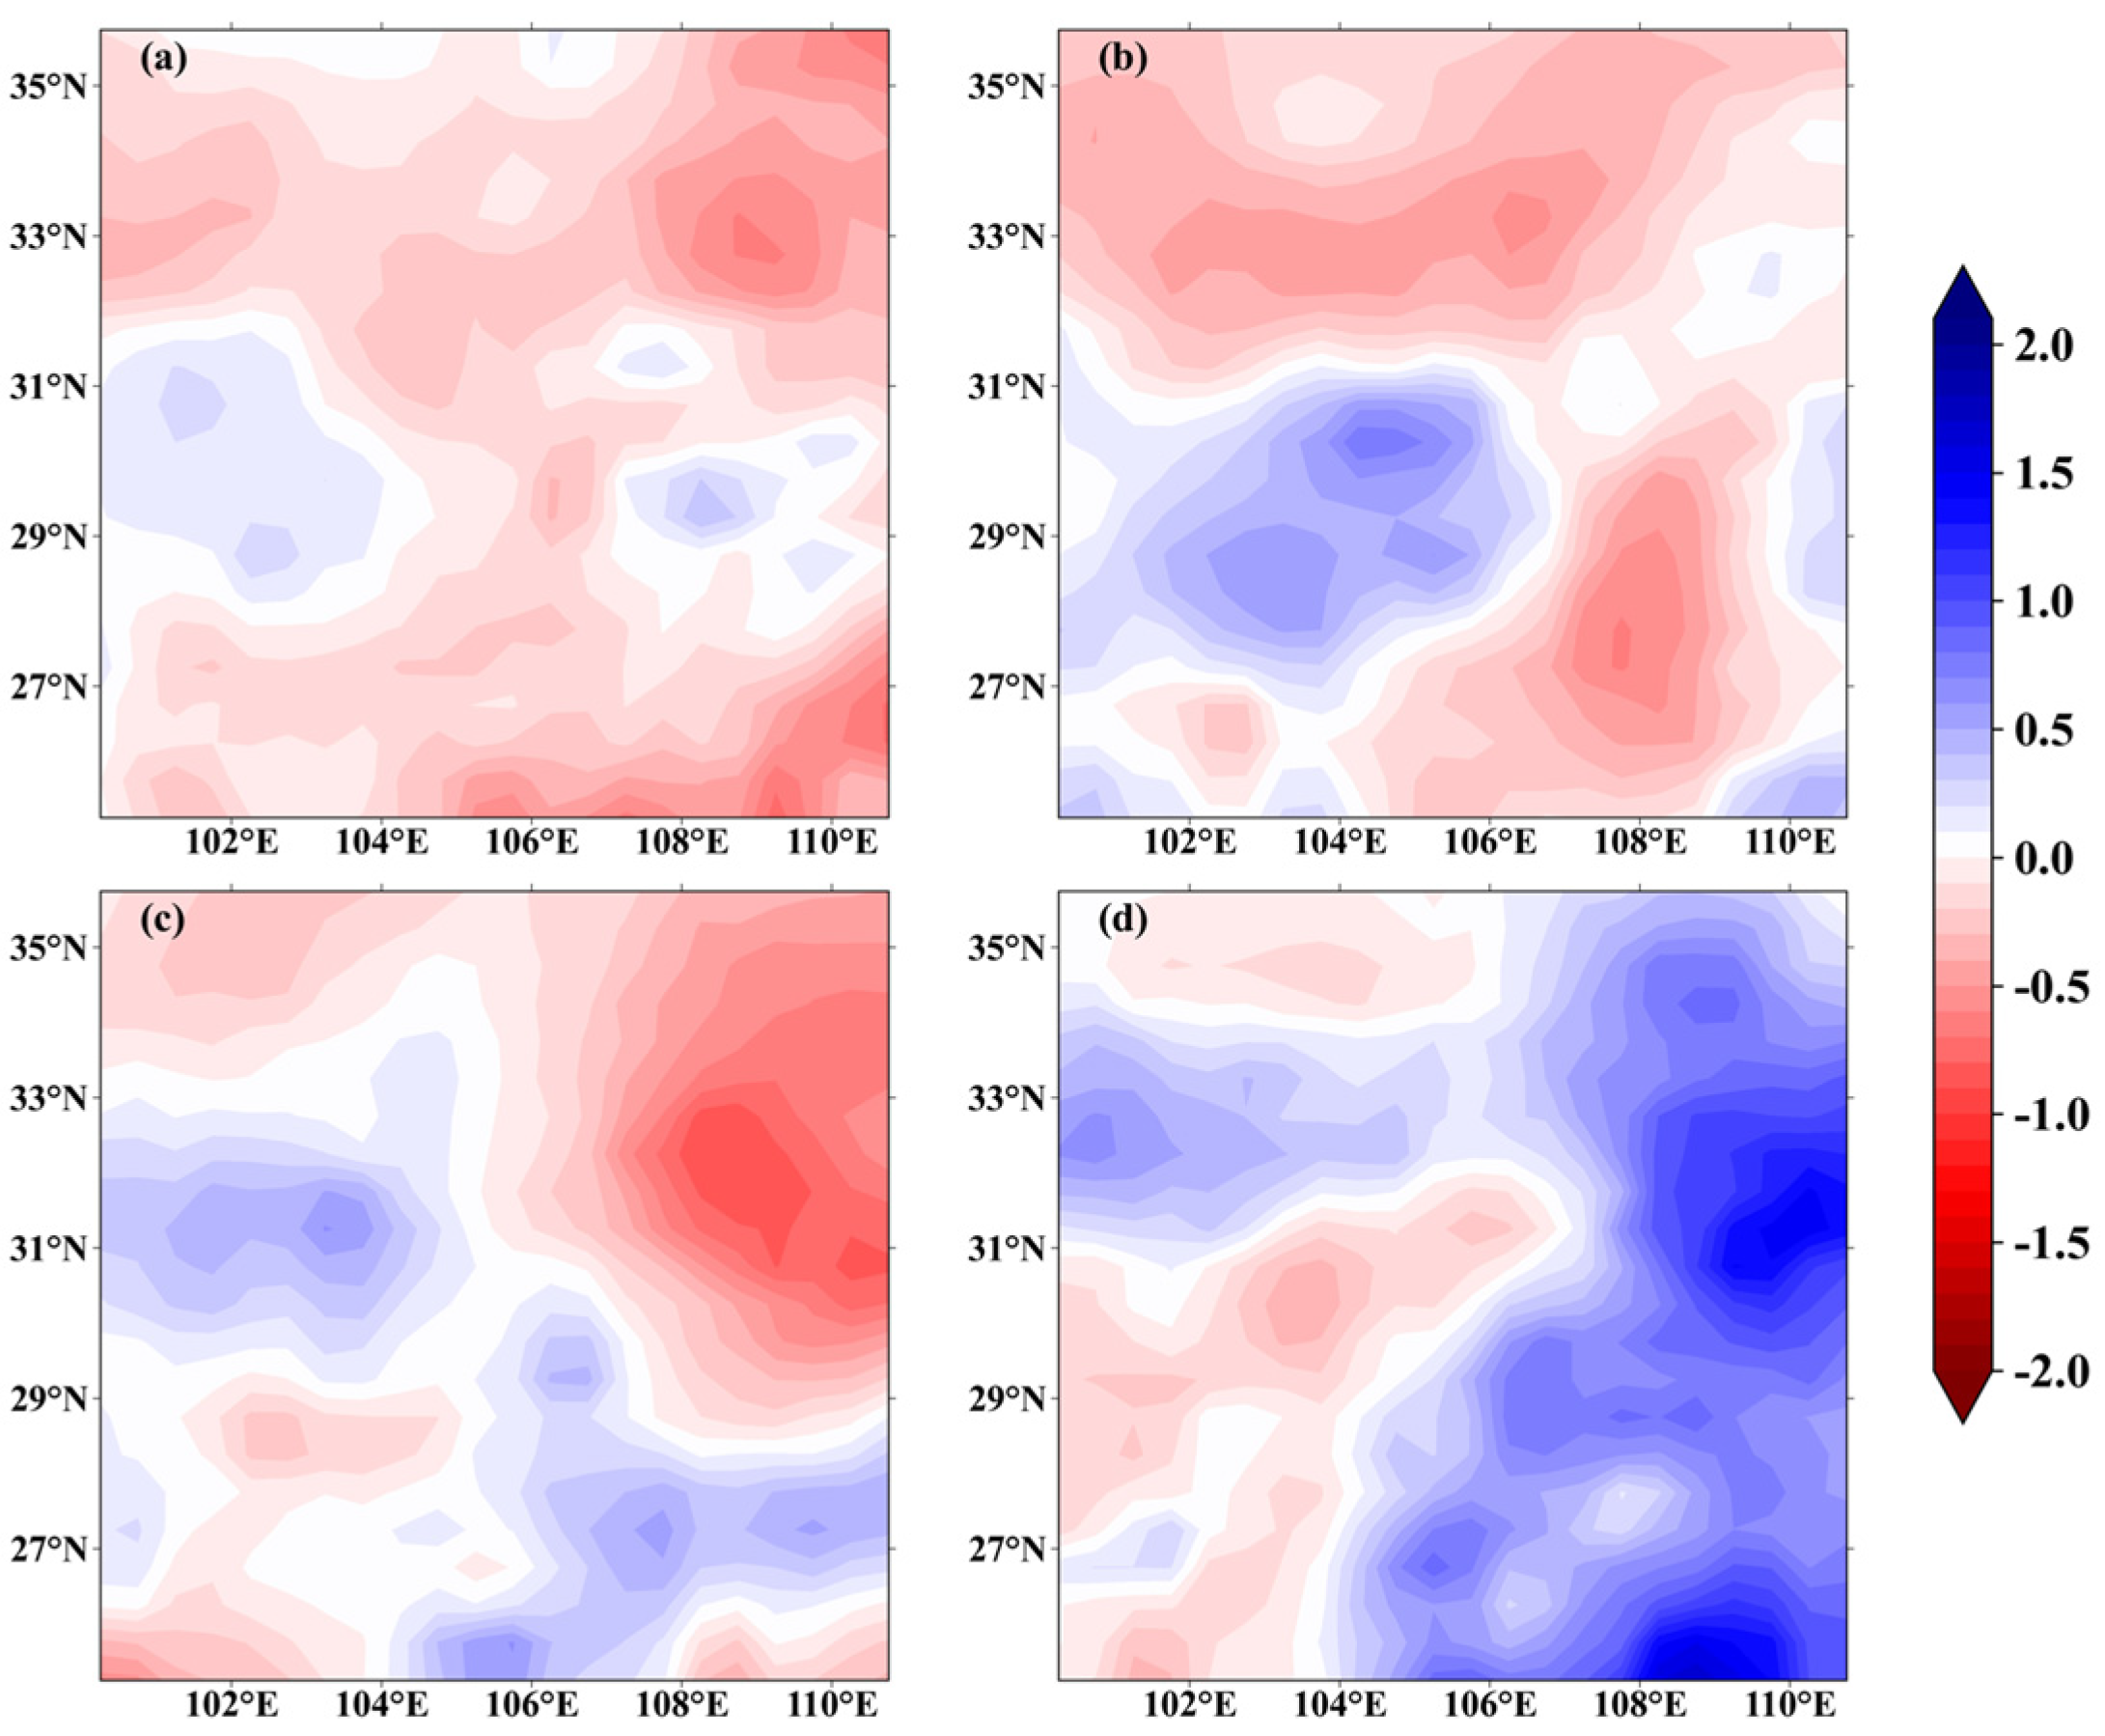
3.2.1. Characterization of Physical Quantity Fields and Precipitation Under Different Configurations of EASM and SASM

During years with a strong EASM and strong SASM (1992, 2004, 2010, 2013), according to the distance level field in Figure 6a, there is a significant positive anomaly in 850 hPa height centered over the Sea of Okhotsk. Above this, the 500 hPa level shows a strengthened anticyclonic positive anomaly, indicating that the Sea of Okhotsk high is stronger than in normal years. Conversely, there is a negative anomaly in the WPSH, with a cyclonic anomaly at 500 hPa, which enhances the negative anomaly and indicates a weaker WPSH compared to normal years. Figure 7a shows that the western China region is generally controlled by anomalous subsiding airflow, while Figure 8a reveals strong cyclonic convergence at 850 hPa over the Bay of Bengal, with no convergence in the wind field over western China, which is unfavorable for precipitation. Therefore, in years with a strong EASM and SASM, the WCAP is overall negatively anomalous, as shown in Figure 9a.
During years with a weak EASM and weak SASM (1985, 1986, 2012), the circulation configuration in Figure 6b is approximately the inverse of that in years with a strong EASM and strong SASM. Although the 850 hPa field in West China is controlled by positive anomalies, it is affected by strong cyclonic anomalies at 500 hPa in Northeast China, and the positive differentials in West China are small, as shown by the vertical level profile in Figure 7b in the range of 105–110° E. Upwelling anomalies are controlled from 850 hPa to 700 hPa. Figure 8b shows convergence of the northerly airflow and southeastern warm and humid airflow in the southwestern region of West China at 700 hPa, which corresponds to the positive level of precipitation shown in Figure 9b.
During years with a strong EASM and weak SASM (1988, 1990, 1993, 1994, 1998, 2019) (Figure 6c), except for the negative difference over the south Sea of Japan and Tibetan Plateau region, the rest of the region is covered by a positive difference. Figure 7c shows updraft anomalies at 105° E west of 700–500 hPa, and Figure 8c shows the transport of warm and moist air from the Yellow Sea and Bohai Sea in the region north of 30° N, as well as from the Bay of Bengal in the region south of 30° N in the Southwest Bay of Bengal. This transport is combined with strong dynamic ascent conditions, resulting in positive precipitation levels in the southwest and negative precipitation levels in the northeast (Figure 9c).
During years with a weak EASM and strong SASM (1996, 2015, 2017, 2020) (Figure 6d), the 850 hPa geopotential height field in West China shows an overall negative difference, and 500 hPa cyclonic anomalies lead to a WPSH bias, guiding southward warm and humid air toward West China. West China as a whole exhibits ascending anomalies (Figure 7d), and the main water vapor transport corridor at 850 hPa includes the Bay of Bengal, the South China Sea, and West China (Figure 8d). Northerly airflow convergence with warm and humid airflow and a positive precipitation level is observed east of 104° E.

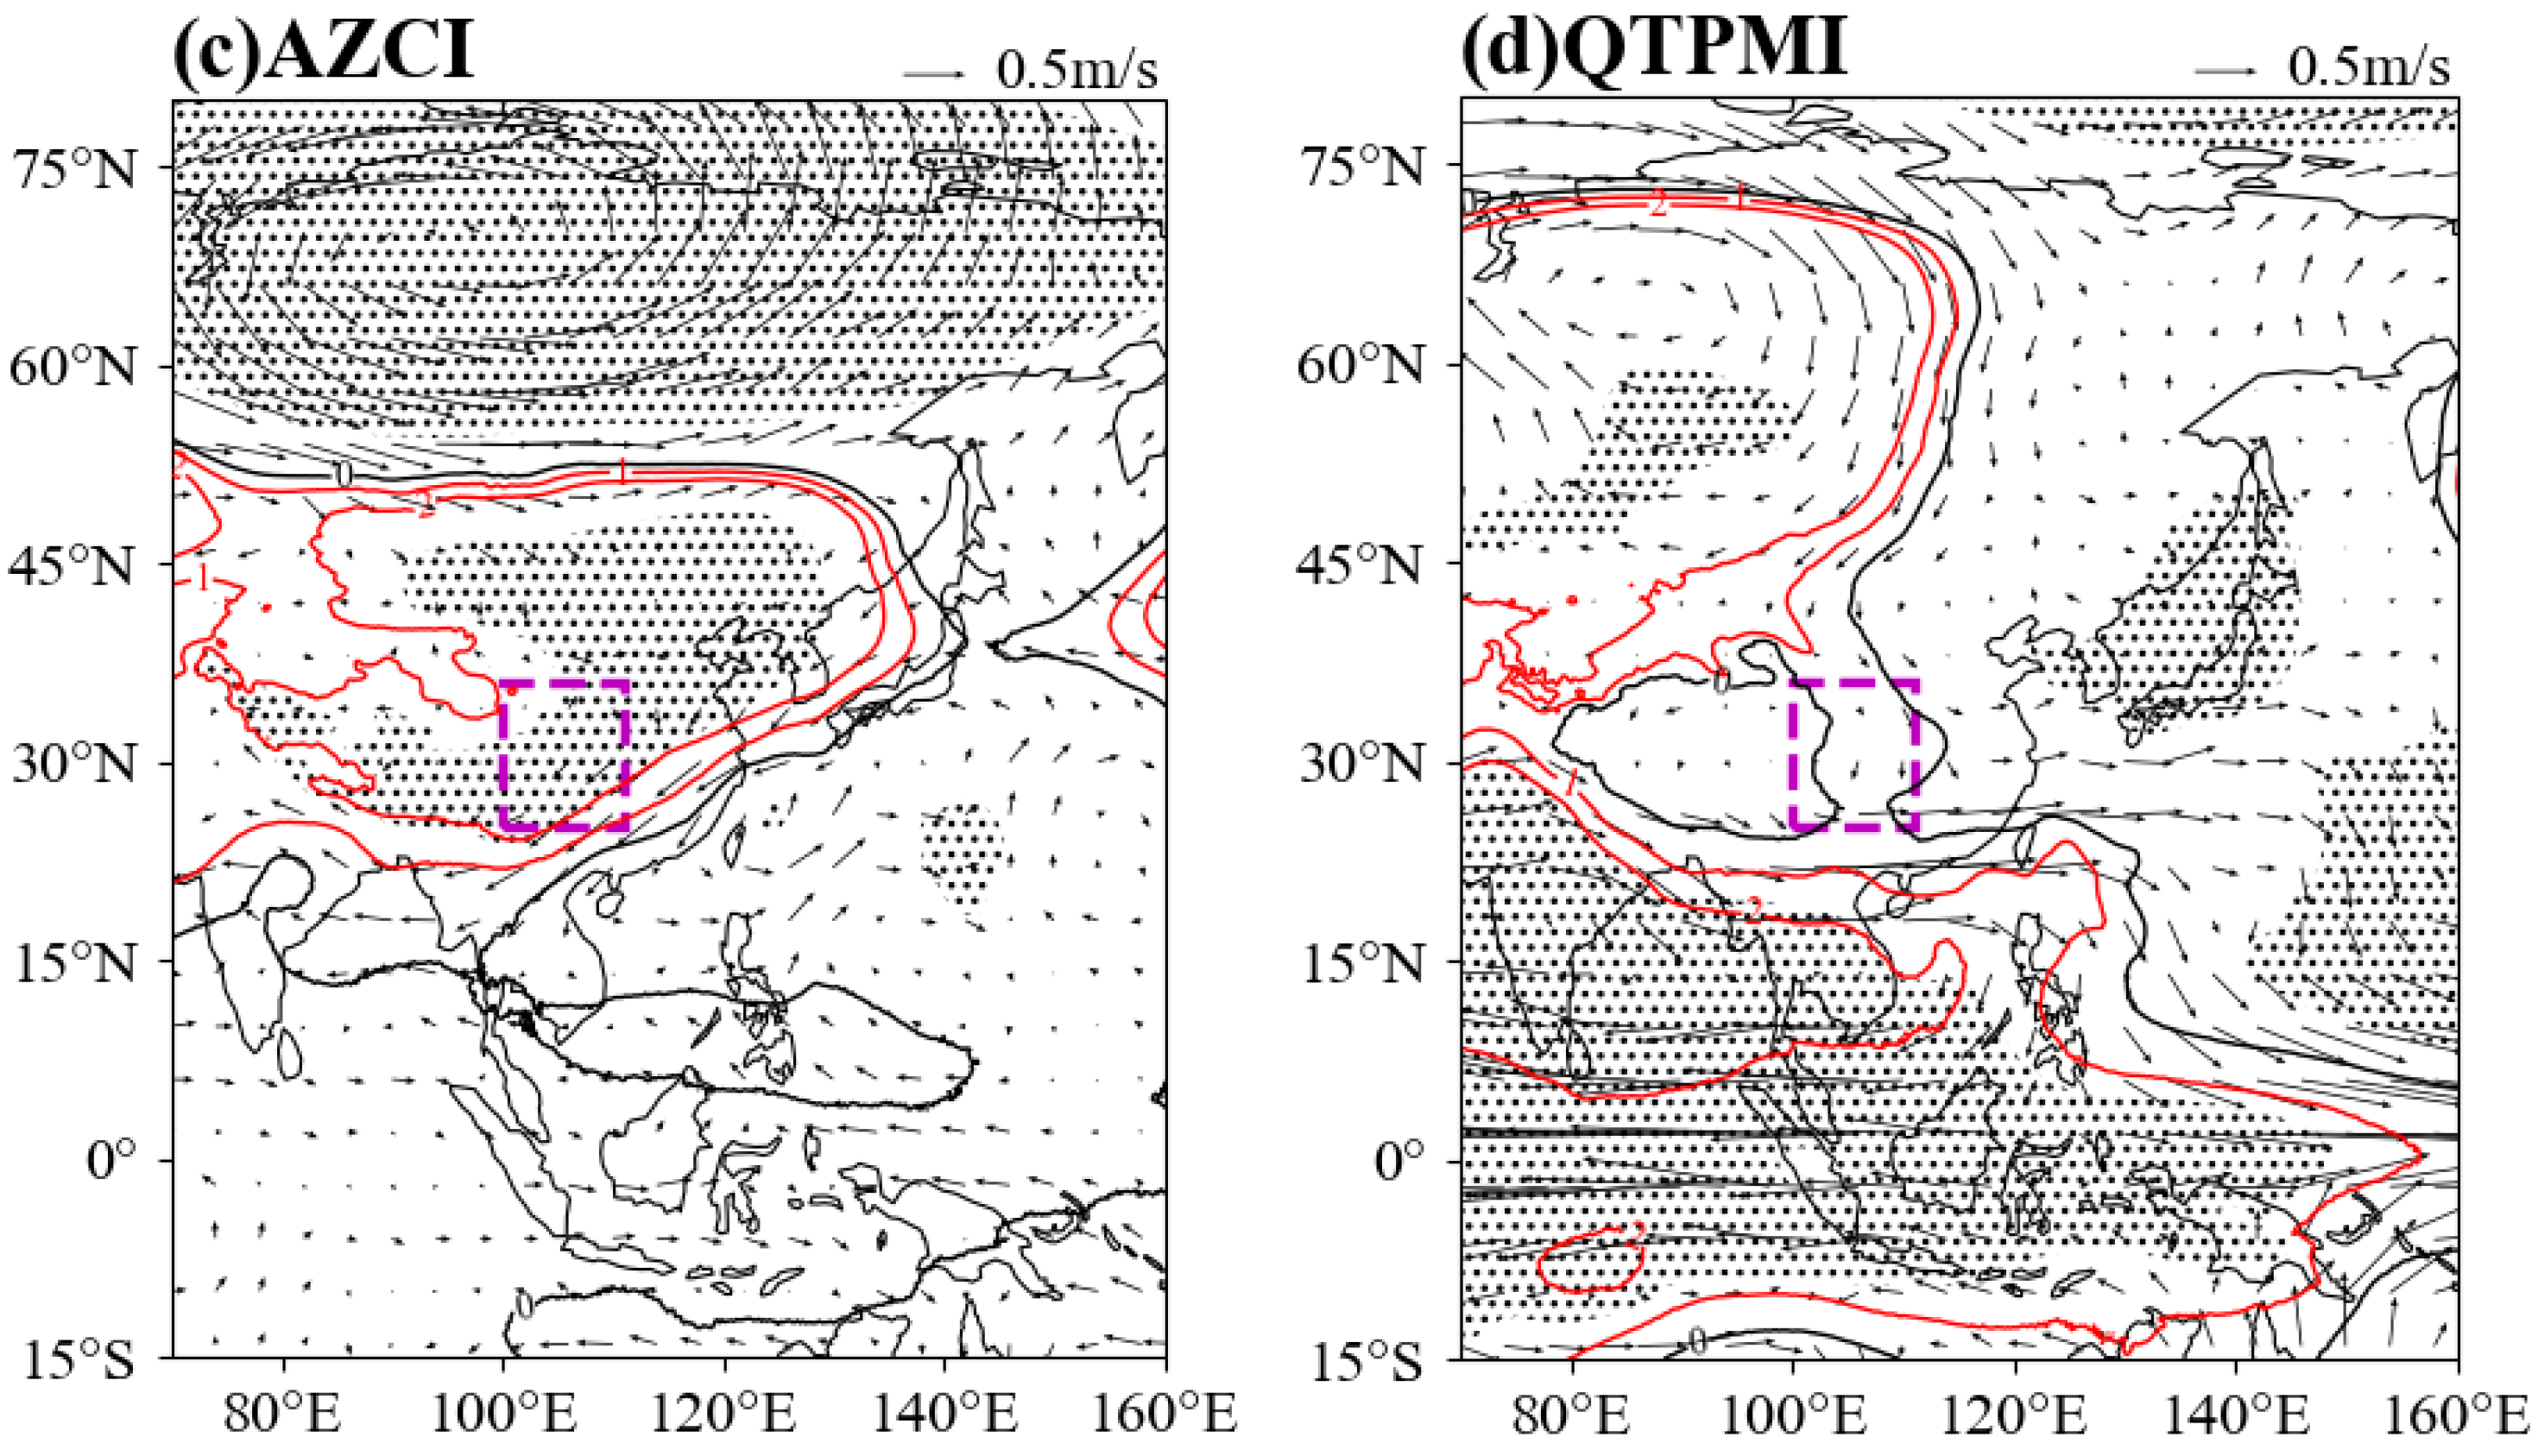
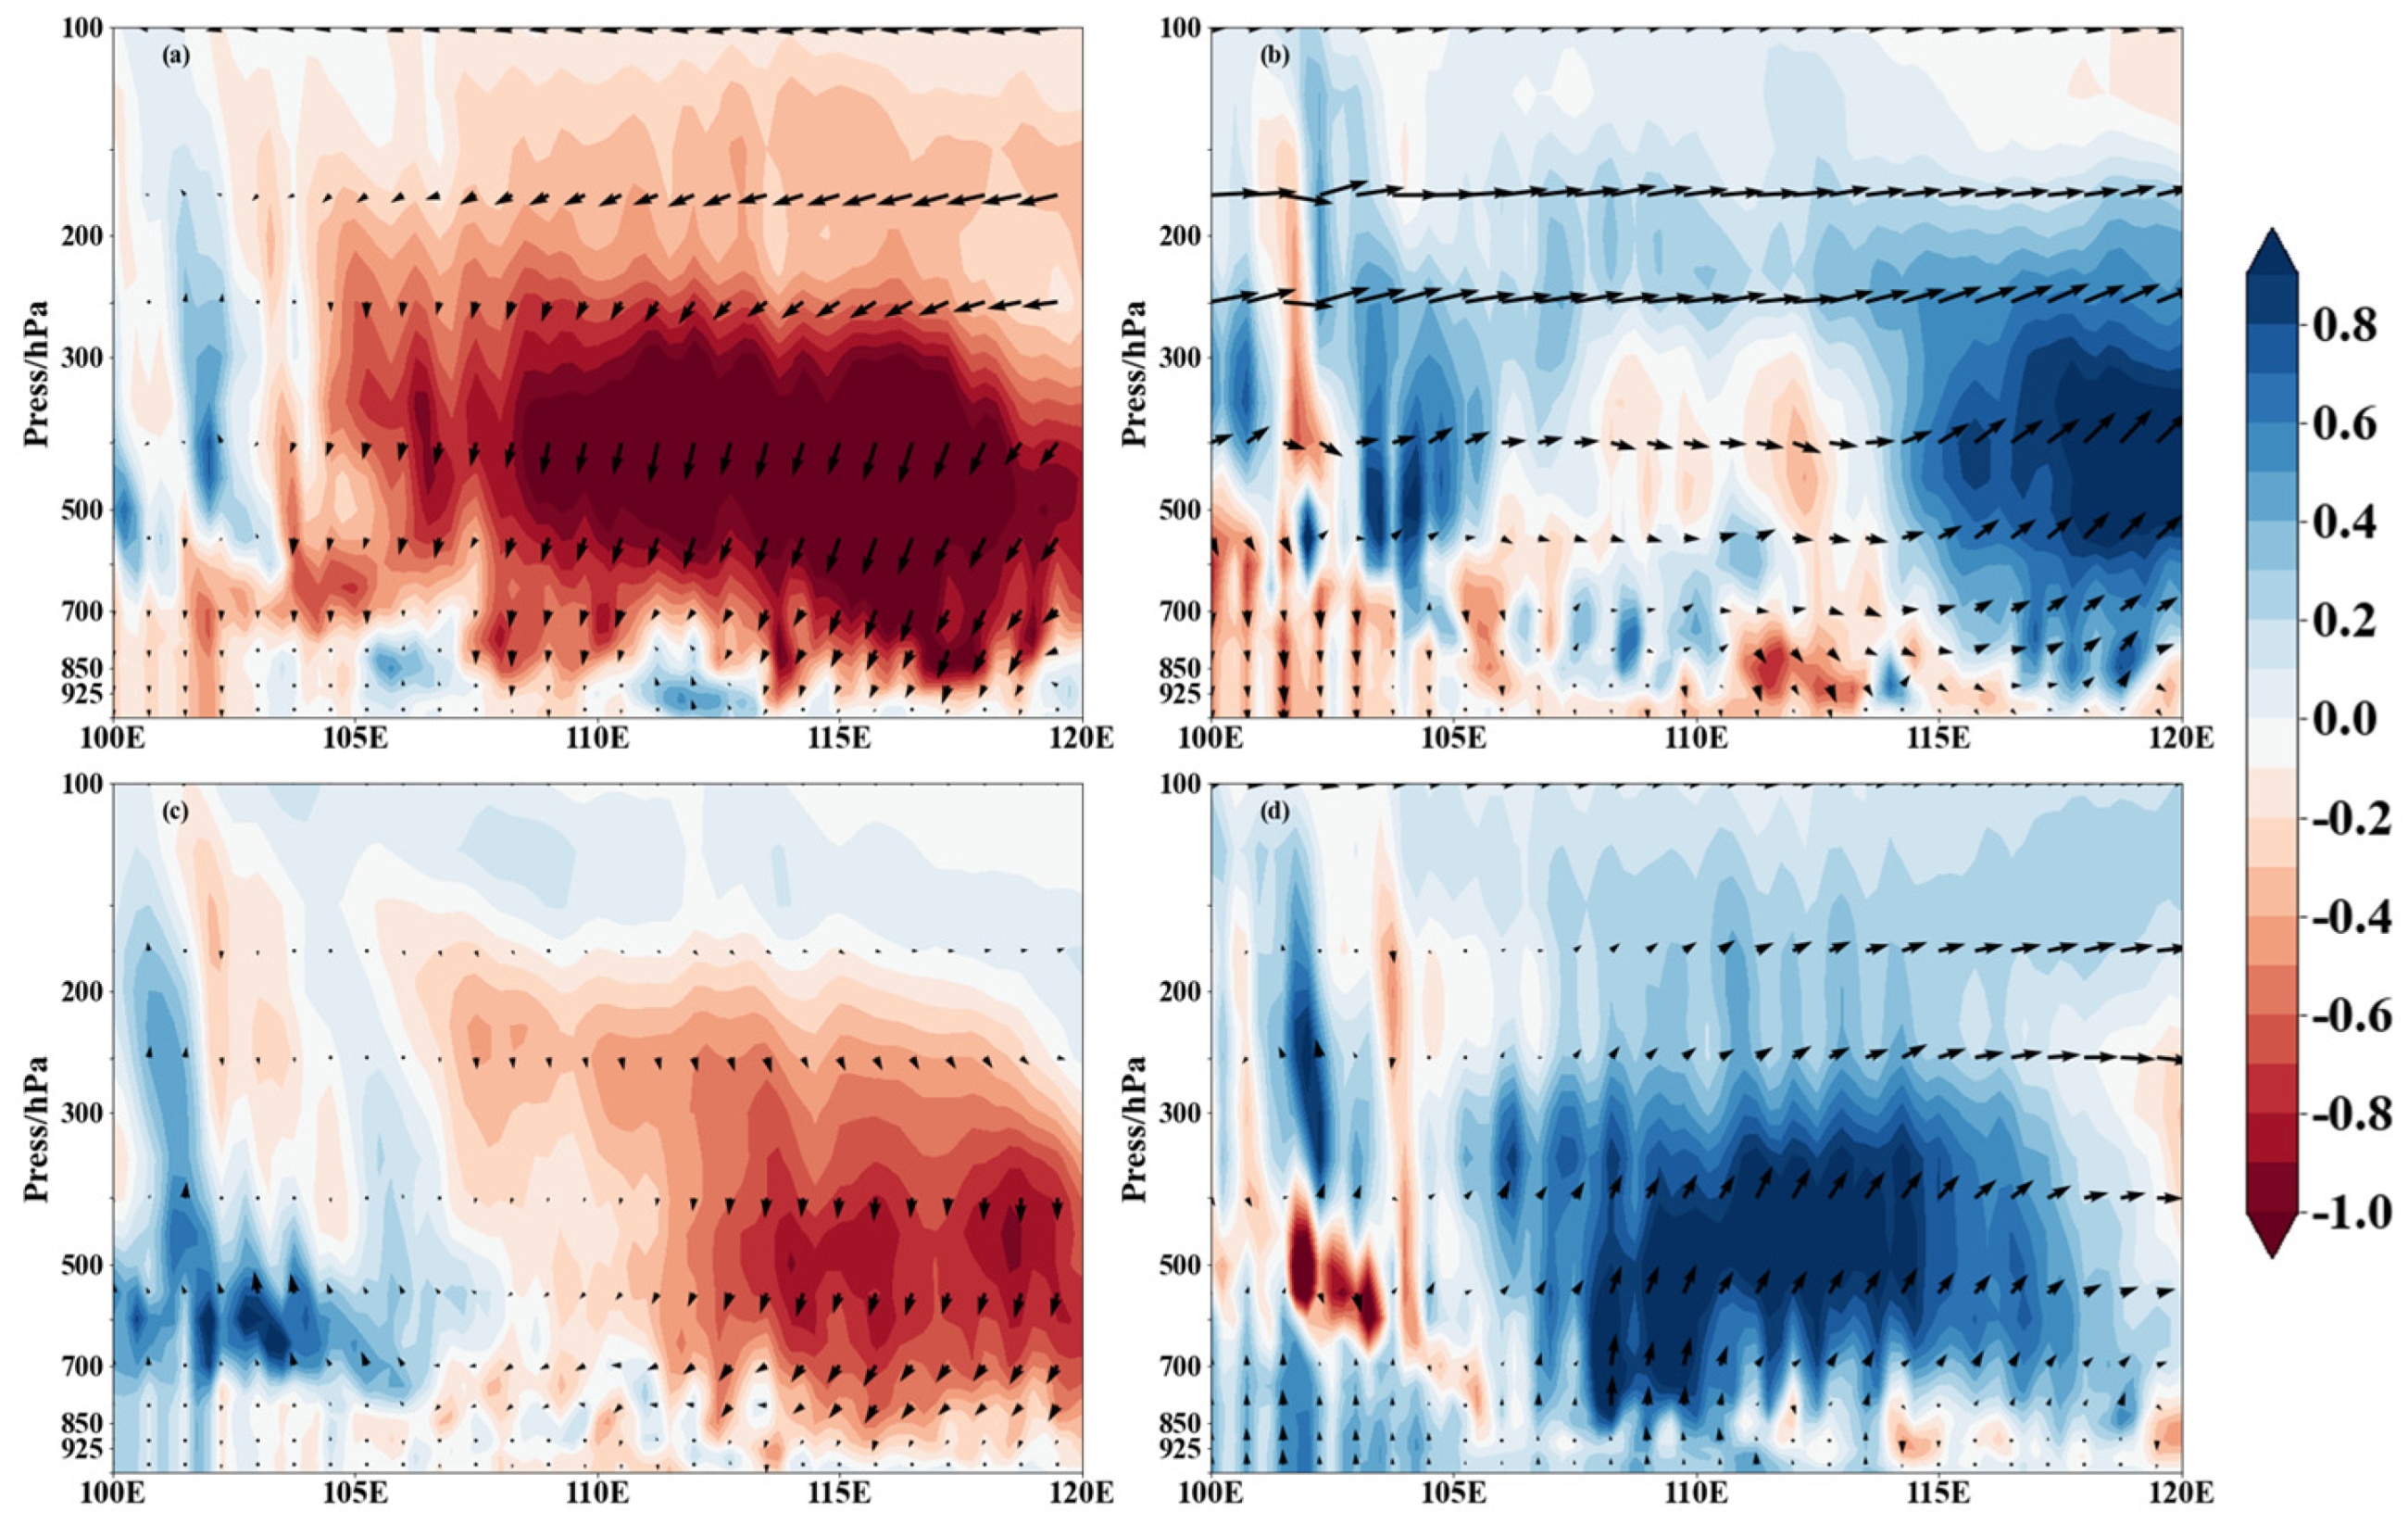
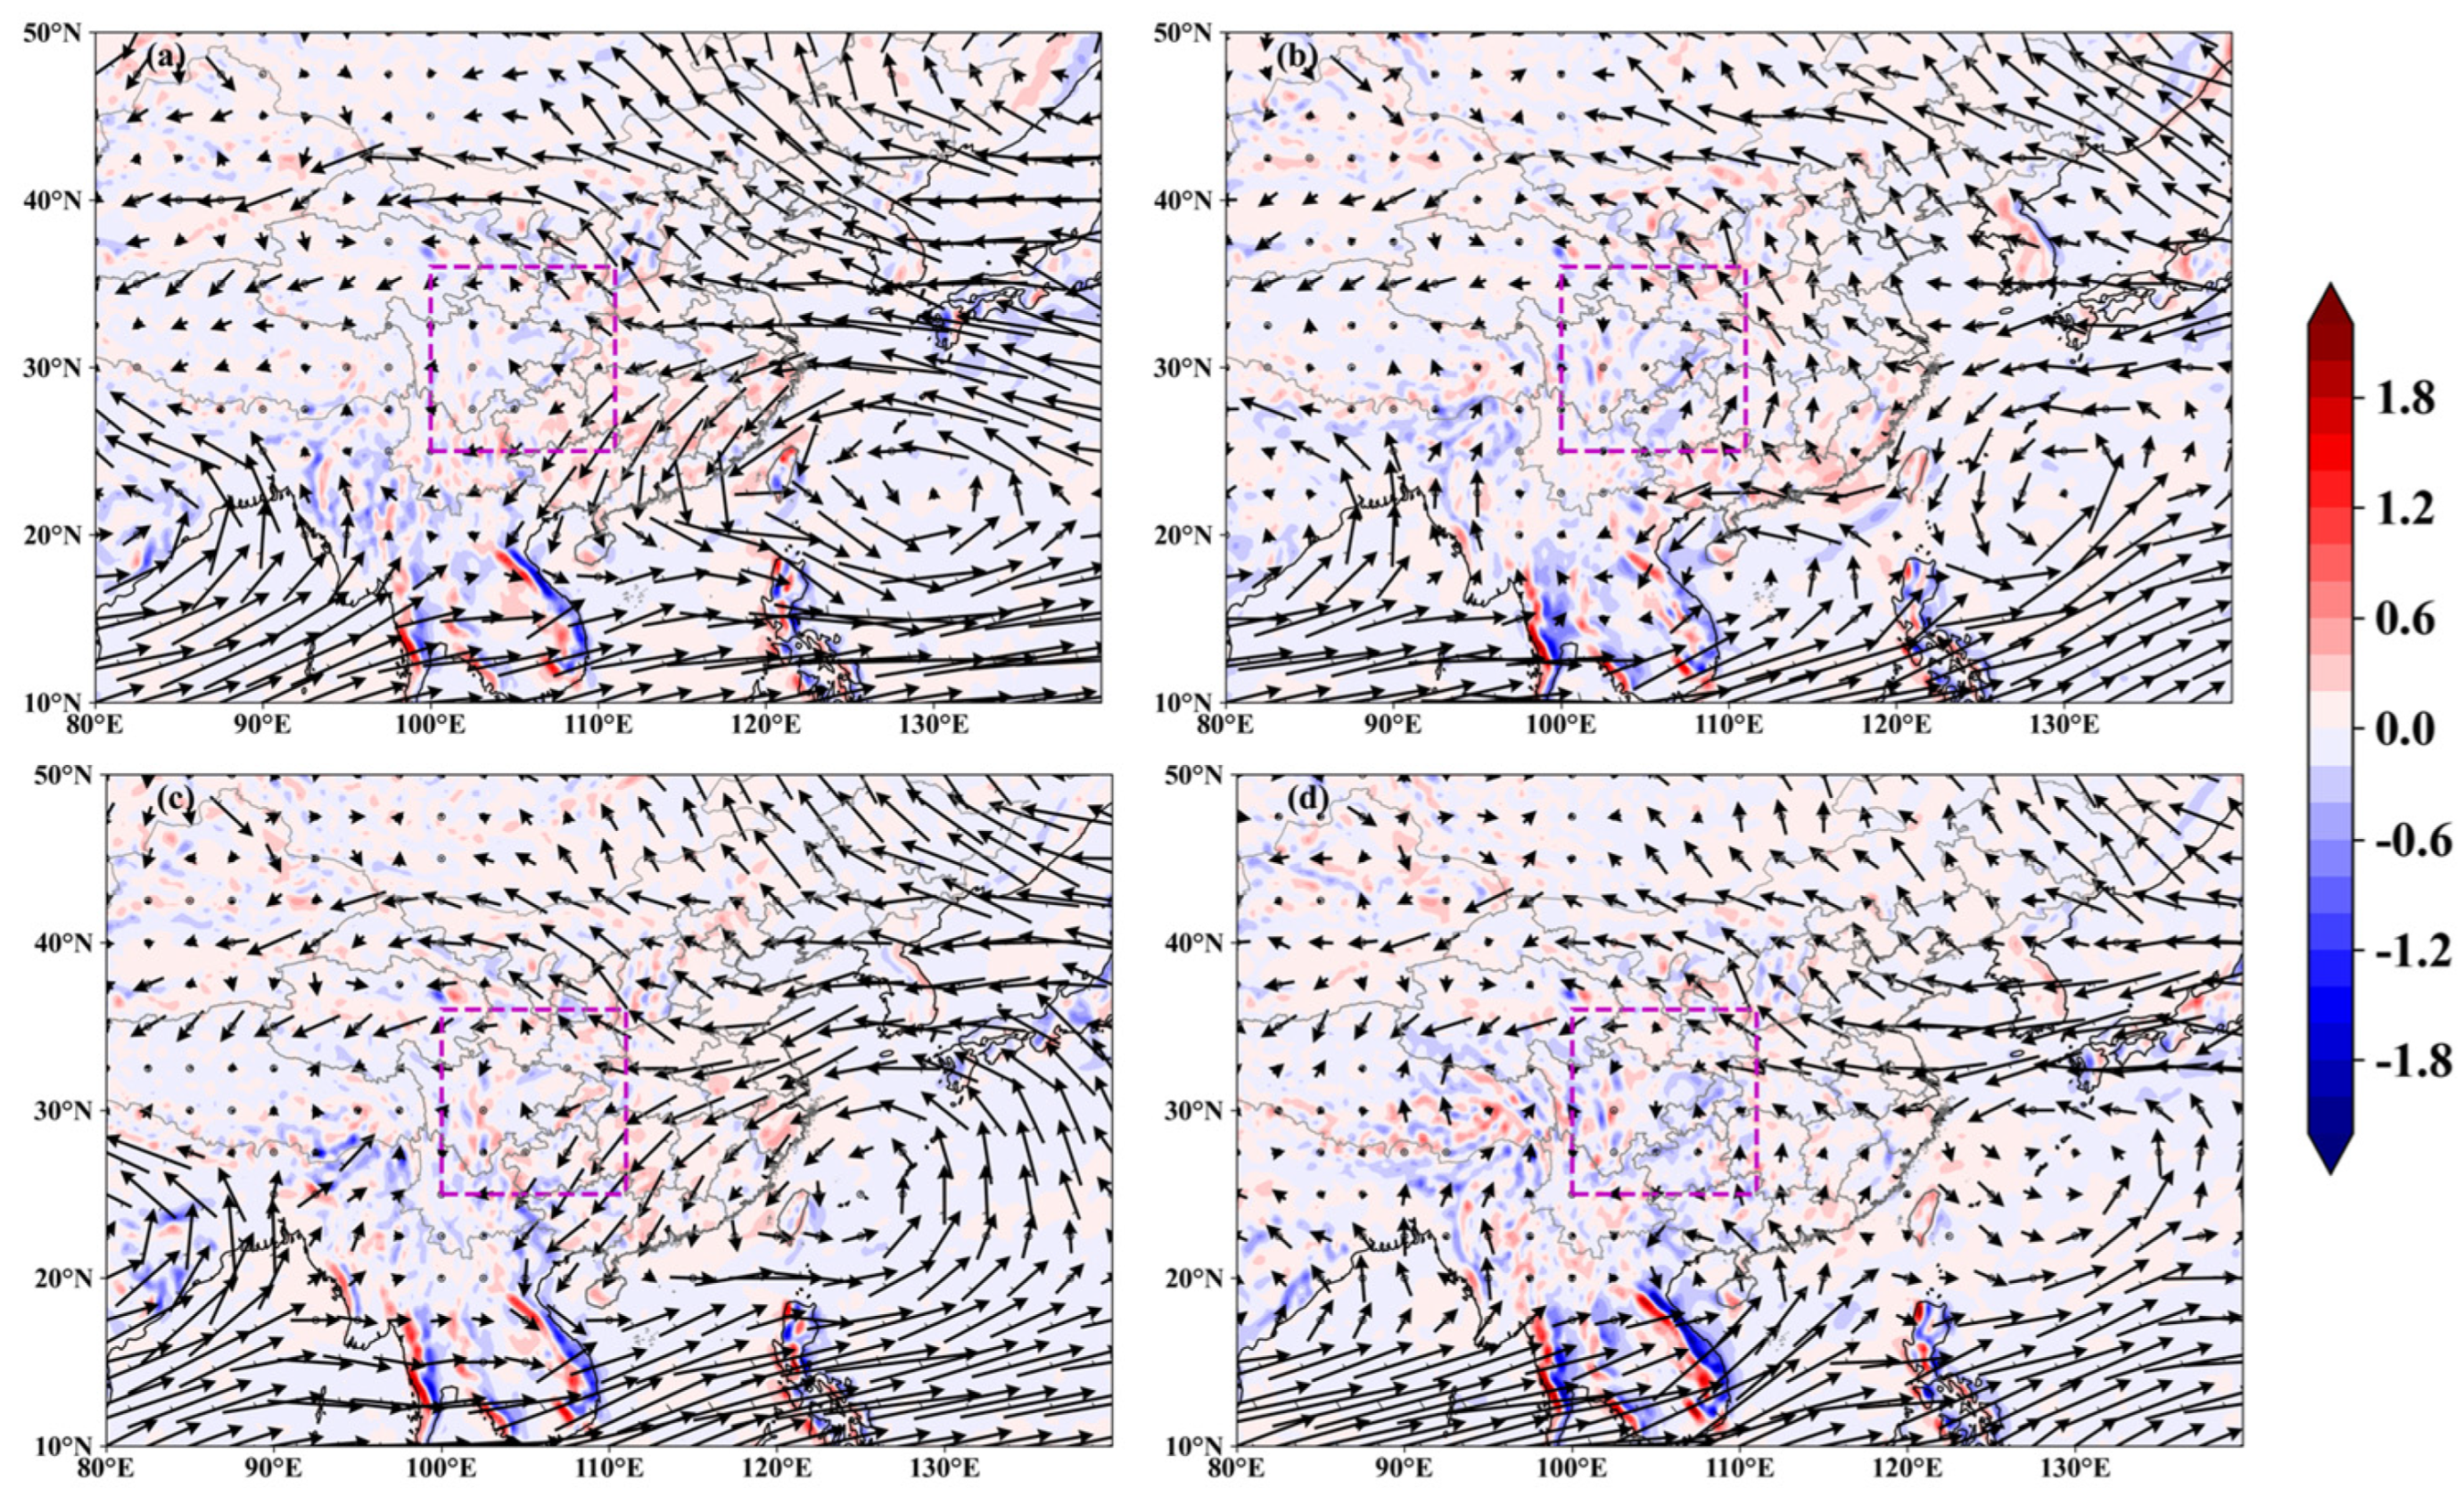
3.2.2. Characterization of Physical Quantity Fields and Precipitation Under Different Configurations of AZC and QTPM

Similarly, we characterized the physical quantity fields and precipitation under different configurations of AZC and QTPM. During years with a strong QTPM and strong AZC (1980, 1998, 1999, 2002, 2006, 2014), the 850 hPa geopotential heights are negative in most areas of West China and positive in Central Asia and the western Pacific. Moreover, cyclonic anomalies are observed at 500 hPa, which enhance these positive differences. Despite southeasterly warm and humid air transport from the western Pacific, most areas of West China are controlled by subsidence anomalies from 850 hPa to 700 hPa, exhibiting insufficient dynamic conditions and negative precipitation anomaly.
During years with a weak QTPM and weak AZC (1981, 1991, 1992, 1993, 2020), the difference in potential heights from west to east in the mid-latitude region of 850 hPa (25–35° N) forms a “−/+/−” distribution, with most of West China controlled by upwelling anomalies and the northeast wind anomaly dominating at 850 hPa. Conversely, the southwesterly wind anomaly from the Bay of Bengal is weaker and WCAP is negative. The differential distribution is positive in the south and negative in the north.
During years with a strong QTPM and weak AZC (1979, 1985, 2000, 2004, 2012, 2021), West China shows a negative difference in the 850 hPa geopotential height and the majority of the region shows updraft anomalies below 700 hPa. Anomalies of warm and humid air dominate in the south, with less precipitation in the north and more precipitation in the south.
During years with a weak QTPM and strong AZC (2015), the southwest warm and humid airflow anomaly from the Bay of Bengal and South China Sea is stronger. Apart from a sinking airflow anomaly to the west of 103° E, most of West China shows updraft anomalies and precipitation levels that are positive in the east and negative in the west.

3.3. CMIP6 Model Predictions of Future Monsoons and WCAP

Here, CMIP6 model simulation data were used to predict future trends of WCAP under global warming. After screening the CMIP6 model for its ability to simulate precipitation in Southwest China [33,34,35,36], the MIROC6 model was deemed the most effective for simulating precipitation in West China, especially under the SPP2-4.5 and SSP5-8.5 emission scenarios. Moreover, the monthly precipitation set showed better simulation performance than the daily and annual precipitation sets.
Under the SSP2-4.5 scenario (Figure 10a), WCAP shows no apparent change and is dominated by interannual oscillations. The SSP5-8.5 scenario (Figure 10b) predicts an increasing WCAP trend (passing the 95% confidence test) and an increasing amplitude of interannual oscillations. EASM strength is predicted to increase under both emission scenarios (Figure 11a), with a larger interannual amplitude under the SSP2-4.5 emission scenario, whereas QTPM strength is predicted to decrease (Figure 11d). The predicted SASM trend does not show a significant change but has a larger amplitude under the SSP2-4.5 emission scenario. Finally, the AZC is significantly weaker under the SSP5-8.5 emission scenario (passing the 95% confidence test).

4. Discussion and Conclusions

In this study, we used GPCPV3.2 precipitation data, ERA5 reanalysis data, and CMIP6 model data to explore the synergistic effect of four monsoon indices (EASMI, SASMI, AZCI, and QTPMI) on WCAP. The following conclusions were drawn:
(1)
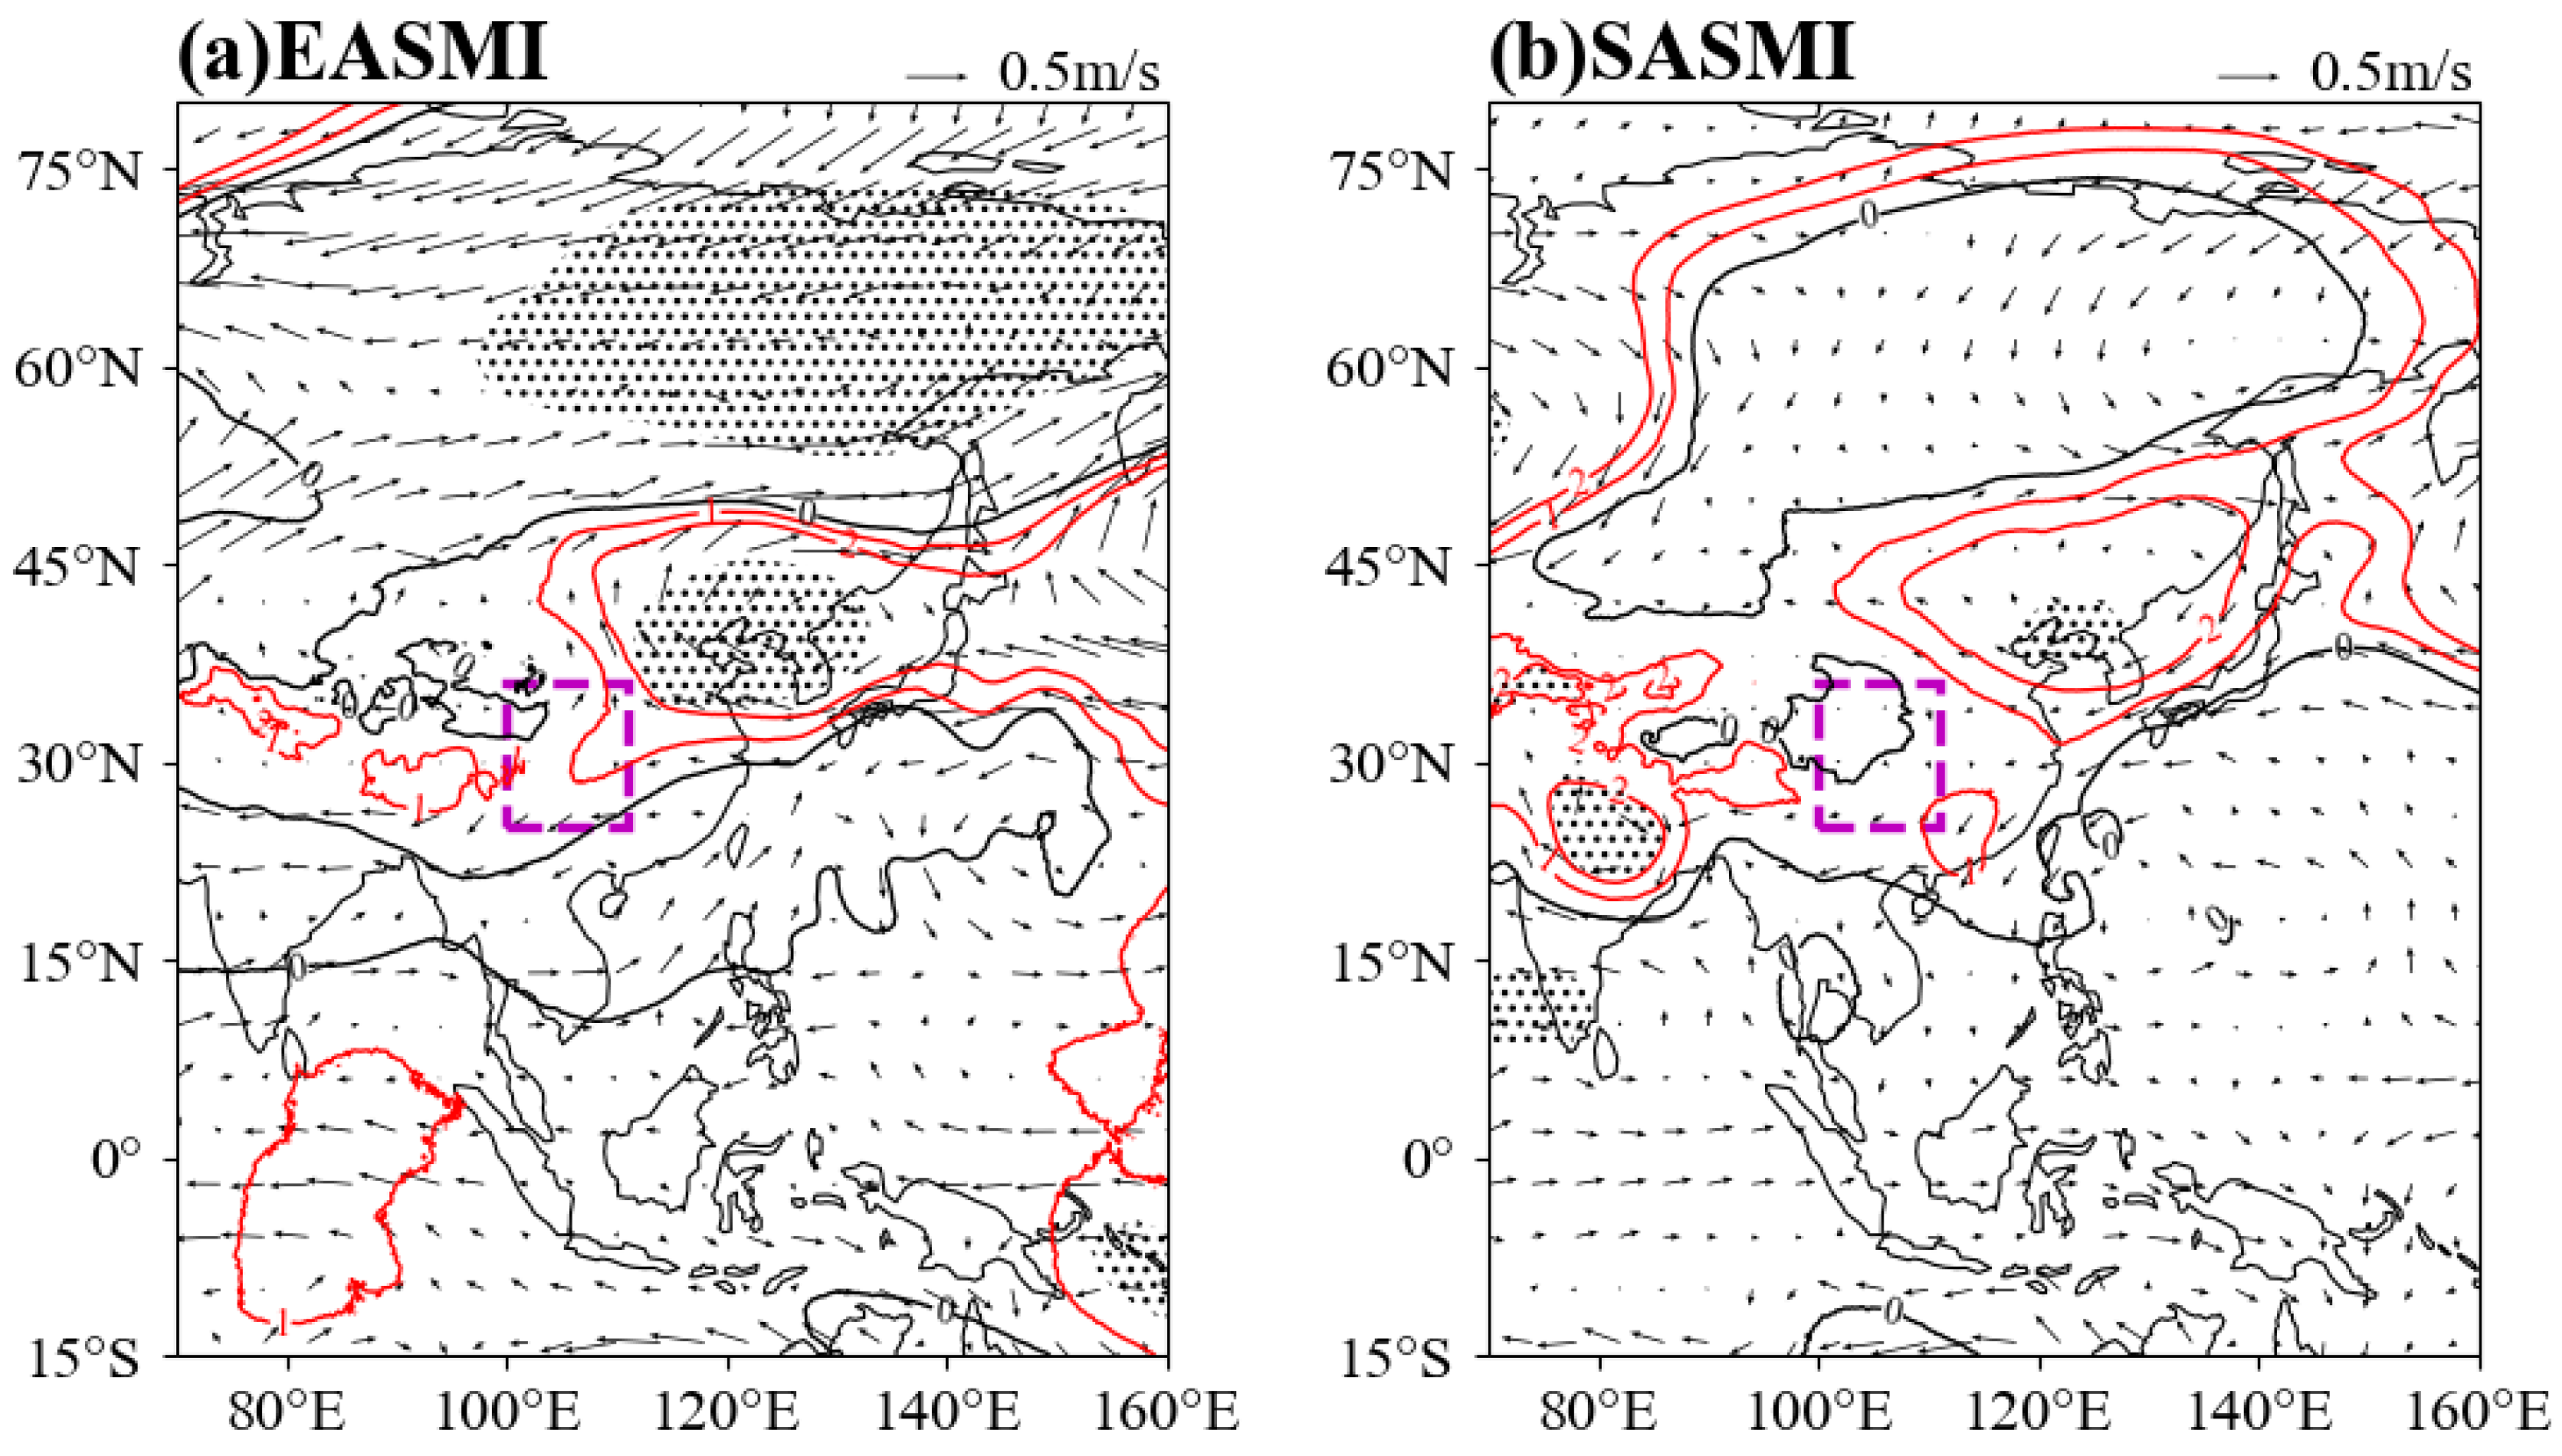
Each monsoon system exhibits different effects on WCAP. The EASM affects WCAP through a closed high-pressure system over Northeast China, resulting in a negative correlation. The influence of the SASM on WCAP is reflected in a pressure gradient that forms over West China, which is located between two closed high-pressure systems; the north side of the strong high-pressure area guides anomalous northwestern transport of cold air, whereas the strong WPSH is guided by the transport of warm and humid air to West China. The resulting convergence of cold and warm air is conducive to the formation of precipitation. During strong AZC years, West China is under the control of a sinking airflow anomaly, which is not conducive to the generation of WCAP. During strong QTPM years, the western and southern parts of West China are affected by sinking airflow from the plateau, resulting in low precipitation.
(2)
Owing to the different circulation conditions, water vapor transport, and strong uplift in years with different monsoon configurations, years with a weak EASM and weak SASM or with a weak EASM and strong SASM are more conducive to the generation of WCAP. The wider range of the positive precipitation level may be predominantly related to the negative correlation between the EASM and the majority of WCAP regions. Furthermore, the QTPM is negatively correlated with WCAP in the south and west, whereas the AZC predominantly affects WCAP through dynamic conditions.
(3)
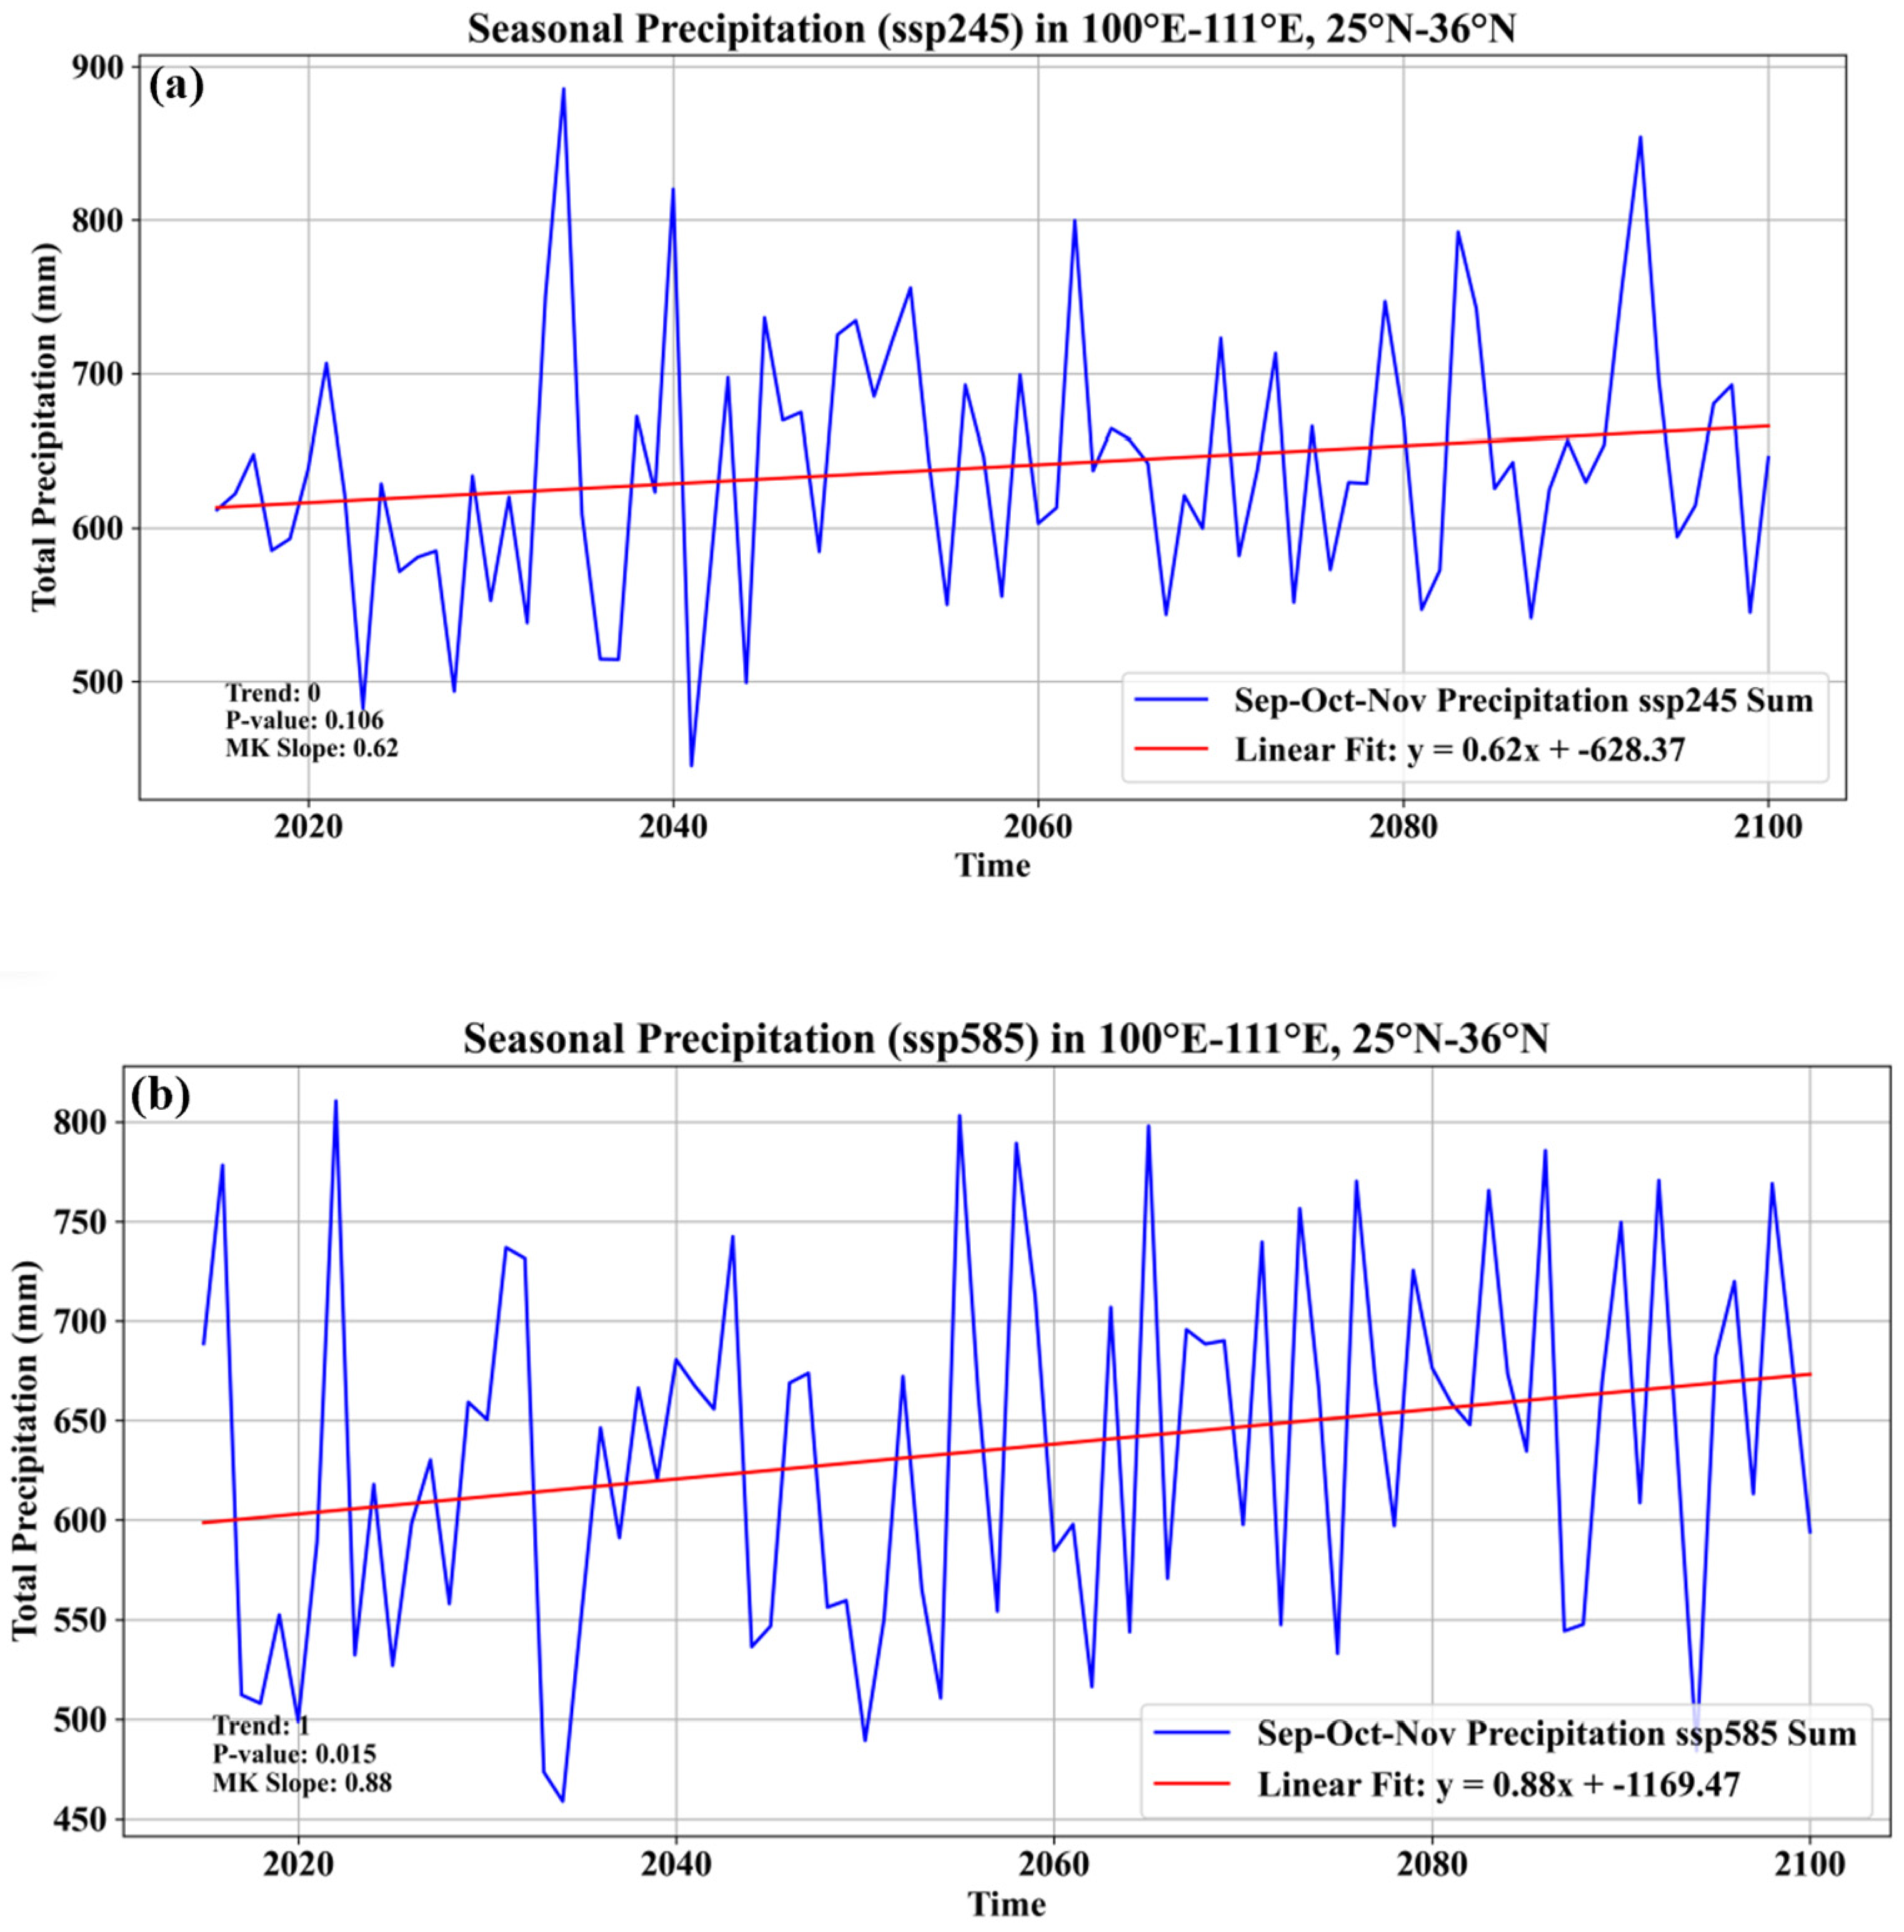
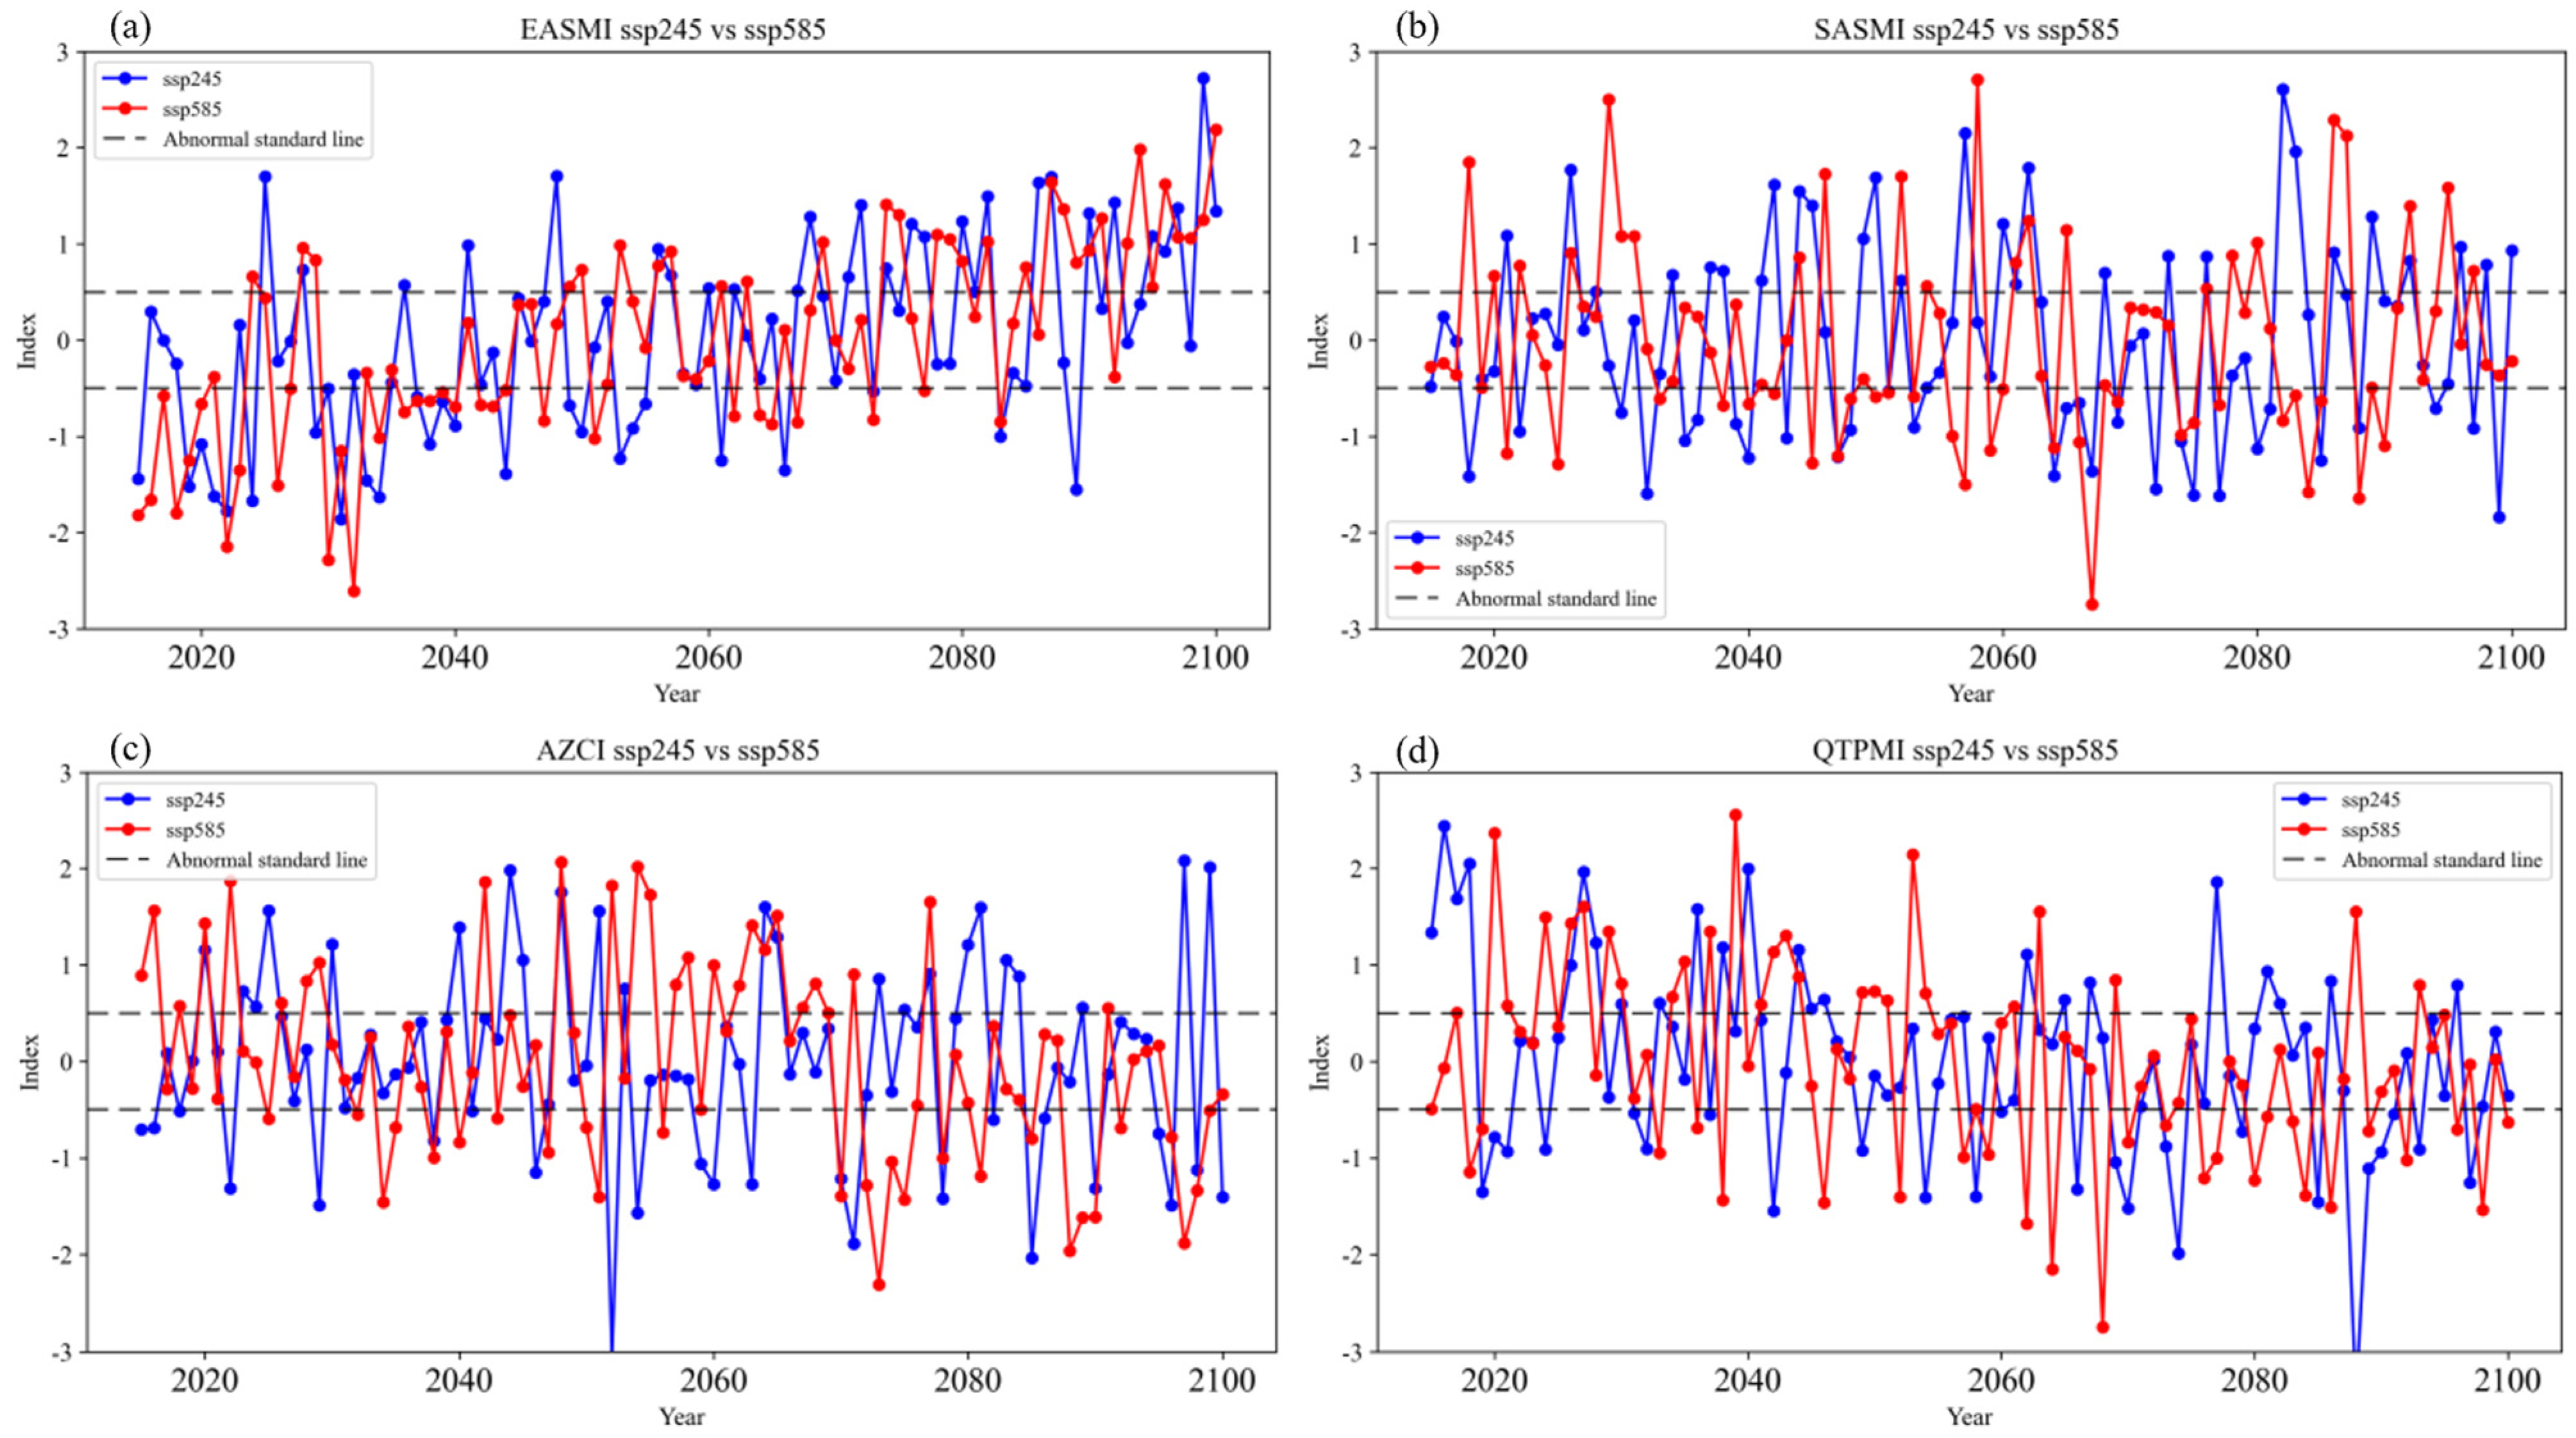
According to simulations of future monsoon indices and precipitation using the CMIP6 model, both WCAP and the amplitude of interannual precipitation oscillations will increase under the SSP5-8.5 scenario, along with clear changes in the trends of the EASM, SASM, AZC, and QTPM.
The findings of this study are limited by the fact that we only discussed the synergistic effects of two major monsoon combinations on WCAP from 1983 to 2022 and the sample size was limited. Nevertheless, we classify and analyze the interrelationships between these two types of monsoon systems and WCAP anomalies, providing meaningful new insights. Future research should determine the physical processes governing the synergistic effects of these four monsoon factors on WCAP.

Author Contributions

Conceptualization, L.S. and L.F.; Data curation, L.S. and J.L.; Formal analysis, L.S. and C.L.; Funding acquisition, L.F. and J.X.; Investigation, L.S. and J.L.; Methodology, L.S.; Project administration, L.F. and J.X.; Resources, L.S., C.L., J.L. and J.X.; Software, L.S., J.L. and C.L.; Supervision, L.F. and J.X.; Validation, L.S. and L.F.; Visualization, L.S.; Writing—original draft, L.S.; Writing—review and editing, L.S. and L.F. All authors have read and agreed to the published version of the manuscript.

Funding

This work was supported by the Major Program of the National Natural Science Foundation of China (grant number 72293604) and the Innovation Team Project of General University in Guangdong Province of China (No.2024KCXTD042). The Ideological and Political Demonstration Course for Postgraduates in Guangdong Ocean University (No. 040515032202).

Institutional Review Board Statement

Not applicable.

Informed Consent Statement

Not applicable.

Data Availability Statement

We acknowledge the European Centre for Medium-Range Weather Forecasts (ECMWF) ERA5 for producing monthly atmospheric reanalysis data (https://cds.climate.copernicus.eu/cdsapp#!/dataset/reanalysis-era5-pressure-levels-monthly-means?tab=form, accessed on 10 October 2024). We acknowledge the Global Precipitation Climatology Project (GPCPV3.2) for producing monthly precipitation reanalysis data (https://disc.gsfc.nasa.gov/datasets/GPCPMON3.2/summary, accessed on 1 October 2024). We acknowledge the Hadley Center for producing Global Sea Temperature monthly data. We acknowledge the MIROC6 model in CMIP6 for producing monthly atmospheric and sea data (https://esgf-index1.ceda.ac.uk/search/cmip6-ceda/, accessed on 24 October 2024).

Acknowledgments

We acknowledge the World Climate Research Programme’s Working Group on Coupled Modelling, which is responsible for CMIP, and we thank the climate modeling groups (https://esgf-index1.ceda.ac.uk/search/cmip6-ceda/, accessed on 24 October 2024) for producing and making available their model output.

Conflicts of Interest

The authors declare no conflicts of interest.

Abbreviations

The following abbreviations are used in this manuscript:
EASMEast Asian Monsoon
SASMSouth Asian Monsoon
EASMAsia Zonal Circulation
QTPMTibetan Plateau Monsoon
WCAPautumn precipitation in West China
WPSHwestern Pacific subtropical high
WAJwesterly jet stream
TPSMTibetan Plateau summer monsoon

References

  1. Du, Y.; Wang, Z. A study of rainy seasons in China. Meteorol. Atmos. Phys. 2008, 100, 121–138. (In Chinese) [Google Scholar] [CrossRef]
  2. Bai, H.Z.; Dong, W.J. Climatic characteristics and causes of autumn rains in western China. Highl. Meteorol. 2004, 6, 884–889. (In Chinese) [Google Scholar]
  3. Yuan, X. Temporal and Spatial Characteristics of Fall Rains and Their Interannual Variations in Western China. Master’s Thesis, Nanjing University of Information Engineering, Nanjing, China, 2013. (In Chinese). [Google Scholar]
  4. Sun, Z.X.; Yang, X.B.; Ma, Z.F. Monitoring Index and Causes of Autumn Rains over Southwest China in Recent 50 years. Meteorol. Sci. Technol. 2013, 41, 883–888. [Google Scholar]
  5. Li, Y.N. Evolution Characteristics of Autumn Rain in Western China and Its Synergistic Mechanism of Upper and Lower Atmospheric Circulation. Master’s Thesis, Chinese Academy of Meteorological Sciences, Beijing, China, 2024. (In Chinese). [Google Scholar]
  6. Huang, R.H.; Zhang, Z.Z.; Huang, G. Characteristics of the water vapor transport in East Asian monsoon region and its difference from that in South Asian monsoon region in summer. Sci. Atmos. Sin. 1998, 22, 460–469. (In Chinese) [Google Scholar]
  7. Hao, L.S.; Ding, Y.H.; Min, J.Z. Relationship between summer monsoon changes in East Asia and abnormal summer rainfall in North China. Plateau Meteor. 2016, 35, 1280–1289. [Google Scholar]
  8. Huan, Y.; Li, Y.Q. The synergy between the East Asian summer monsoon and the South Asian summer monsoon and its relations with anomalous rainfall in Southern China. Plateau Meteor. 2018, 37, 1563–1577. [Google Scholar]
  9. Liu, Y.Y. Remote Correlation of the Asia-Pacific Summer Winds and Its Effect on Summer Precipitation in China. Ph.D. Thesis, Chinese Academy of Meteorological Sciences, Beijing, China, 2009. (In Chinese). [Google Scholar]
  10. Wang, Y.S.; Xiao, T.G.; Dong, X.F.; Li, Y.; Zhao, P. Influence of East Asian monsoon and South Asian monsoon synergy on summer precipitation in Southwest China. Acta Meteorol. Sin. 2021, 79, 541–557. (In Chinese) [Google Scholar]
  11. Feng, L.L.; Hua, W. Effects of westerly monsoon synergism on late spring-May precipitation in Yunnan. Highl. Mt. Meteorol. Res. 2022, 42, 42–48. (In Chinese) [Google Scholar]
  12. Yan, H.S.; Hu, J.; Fan, K. Relationship between the change of summer westerly wind index and summer precipitation in China over the past 50 years. Atmos. Sci. 2007, 4, 717–726. (In Chinese) [Google Scholar]
  13. Deng, H.; Hua, W.; Ming, J.; Zhang, Y.; Fan, G.Z. Reversal of decadal trend in West China autumn rainfall in the late 1990s and possible causes. Atmos. Res. 2023, 294, 106984. [Google Scholar] [CrossRef]
  14. Luo, X.; Li, D.L.; Wang, H. New features of the evolution of fall rains in western China and their response to atmospheric circulation. Plateau Meteorol. 2013, 32, 1019–1031. (In Chinese) [Google Scholar]
  15. Qiao, Y.T.; Chen, L.T.; Zhang, Q.Y. Definition of the East Asian Monsoon Index and its relation to the climate of China. Atmos. Sci. 2002, 26, 69–82. (In Chinese) [Google Scholar]
  16. Ma, M.M. Influence of the BSISO and Tibetan Plateau Summer Monsoon on Precipitation in Southwest China. Master’s Thesis, The Lanzhou University, Lanzhou, China, 2022. (In Chinese). [Google Scholar]
  17. Liu, F.; He, J.H.; Jiang, A.J. Relationship between the Asian summer westerly wind index and summer precipitation in China. J. Nanjing Meteorol. Inst. 2006, 4, 517–525. (In Chinese) [Google Scholar]
  18. Xu, M.L.; Zhou, B.T.; Cheng, Z.G. A preliminary study on the causes of the inter-decadal increase of fall precipitation in West China since 2010. J. Atmos. Sci. 2020, 43, 568–576. (In Chinese) [Google Scholar]
  19. Zhou, B.T.; Qian, J.; Hu, Y.P.; Li, H.; Han, T.T.; Sun, B. Interdecadal change in the linkage of early summer sea ice in the Barents Sea to the variability of West China Autumn Rain. Atmospheric 2023, 287, 106717. [Google Scholar] [CrossRef]
  20. Zhang, H.; Fan, K. Intraseasonal northward evolution of the extreme autumn rainfall event in West China in 2021. Atmospheric 2024, 304, 107394. [Google Scholar] [CrossRef]
  21. Sun, X.R.; Chen, L.X.; He, J.H. Sea-land thermal difference index in East Asia and its relationship with interannual variability of circulation and precipitation. J. Meteorol. 2002, 2, 164–172. (In Chinese) [Google Scholar]
  22. Zhang, T.; Jiang, X.; Yang, S. A predictable prospect of the South Asian summer monsoon. Nat. Commun. 2022, 13, 7080. [Google Scholar] [CrossRef]
  23. Chen, H.S.; Sun, Z.B. An index reflecting winter temperature anomalies in China-East Asian regional westerly wind index. J. Nanjing Meteorol. Inst. 2001, 4, 458–466. (In Chinese) [Google Scholar]
  24. Qi, D.M. Analysis of the Relationship Between High Pressure Activities in South Asia and the Evolution of the Plateau Monsoon. Master’s Thesis, Chinese Academy of Meteorological Sciences, Beijing, China, 2008. (In Chinese). [Google Scholar]
  25. Zhou, Y.; Fan, G.Z.; Hua, W. Distribution characteristics of the plateau monsoon and comparative analysis of its indices. Plateau Meteorol. 2015, 34, 1517–1530. (In Chinese) [Google Scholar]
  26. Huang, Y.X.; Li, D.L.; Wang, B.J.; He, J.M. Analyese on Temporal-Spatial Features of Annual Precipitation in Northwest China in 1961–2000. Plateau Meteorol. 2004, 12, 245–252. (In Chinese) [Google Scholar]
  27. Huang, R.H.; Chen, J.L.; Huang, G.; Zhang, Q.L. Quasi-Biennial Oscillation of Summer Monsoon Rainfall in China and Its Cause. Chin. J. Atmos. Sci. 2006, 4, 545–560. (In Chinese) [Google Scholar]
  28. Xia, Z.M.; Liao, K.T.; Guo, L.P.; Chen, X.L. Spatiotemporal Distribution Pattern of Precipitation in Ganjiang River Basin Based on EOF and MK trend Analysis. Res. Soil Water Conserv. 2023, 30, 223–233+249. [Google Scholar]
  29. Wang, J.K.; Yu, J.Y.; Johnson, K.R. Pacific and Atlantic controls of the relationship between Mainland Southeast Asia and East China interannual precipitation variability. Clim. Dyn. 2020, 54, 4279–4292. [Google Scholar] [CrossRef]
  30. Chen, X.; Wang, S.; Hu, Z.; Zhou, Q.; Hu, Q. Spatiotemporal characteristics of seasonal precipitation and their relationships with ENSO in Central Asia during 1901–2013. J. Geogr. Sci. 2018, 28, 1341–1368. [Google Scholar] [CrossRef]
  31. Liang, J.H. Temporal and spatial distribution of fall rains in western China. Geoscience 1989, 1, 51–59+96. (In Chinese) [Google Scholar]
  32. Xu, J.X.; Guo, H.Y.; Wang, Q. Spatial typing and its characterization of autumn rain in West China. Highl. Mt. Weather. Res. 2019, 39, 26–33. (In Chinese) [Google Scholar]
  33. Tian, J.; Zhang, Z.; Ahmed, Z. Projections of precipitation over China based on CMIP6 models. Stoch. Environ. Res. Risk Assess. 2021, 35, 831–848. [Google Scholar] [CrossRef]
  34. Yang, X.; Zhou, B.; Xu, Y. CMIP6 Evaluation and Projection of Temperature and Precipitation over China. Adv. Atmos. Sci. 2021, 38, 817–830. [Google Scholar] [CrossRef]
  35. Lu, K.; Arshad, M.; Ma, X.; Ullah, I.; Wang, J.; Shao, W. Evaluating observed and future spatiotemporal changes in precipitation and temperature across China based on CMIP6-GCMs. Int. J. Climatol. 2022, 42, 7703–7729. [Google Scholar] [CrossRef]
  36. Chen, M.F.; Han, Y.G.; Sun, M.D. Prediction and analysis of future precipitation changes in the Sichuan section of the Yangtze River Basin based on the CMIP6 climate model. Res. Soil Water Conserv. 2024, 31, 288–294. (In Chinese) [Google Scholar]
Figure 1. Normalized time series for each monsoon index. EASMI: (a) East Asian Monsoon index; (b) SESMI: South Asian Monsoon index; (c) AZCI: Asia Zonal Circulation index; (d) QTPMI: Tibetan Plateau Monsoon index.
Atmosphere 16 00481 g001
Figure 2. (a) Cumulative autumn precipitation in West China (September–November) and (b) September–October precipitation as a percentage of total autumn precipitation.
Atmosphere 16 00481 g002
Figure 3. WCAP empirical orthogonal function analysis for 1983–2023. (a) First mode of rainfall and its corresponding time coefficient; (b) second mode of rainfall and its corresponding time coefficient; (c) third mode of rainfall and its corresponding time coefficient.
Atmosphere 16 00481 g003
Figure 4. Correlation coefficients of each index with WCAP (black dots indicate that the significance test was passed with a 95% confidence level): (a) EASMI and WCAP; (b) SASMI and WCAP; (c) AZCI and WCAP; (d) QTPMI and WCAP.
Atmosphere 16 00481 g004
Figure 5. Regressions of 700 hPa geopotential height and winds onto standardized monsoon indices: (a) EASMI; (b) SASMI; (c) AZCI; (d) QTPMI. The vector is the horizontal wind field (m/s), the thick black contour indicates the zero-regression coefficient of potential height, the red thick contour line indicates the positive regression coefficient for the potential height, the purple dashed box shows the West China region, and the black dots indicate that the significance test was passed with a 95% confidence level.
Atmosphere 16 00481 g005aAtmosphere 16 00481 g005b
Figure 6. The 850 hPa potential height and 500 hPa wind field distance level (each monsoon combination minus the multi-year average) vectors for the horizontal wind field (in m/s) for different configurations of EASM and SASM in different years: (a) strong EASM and strong SASM; (b) weak EASM and weak SASM; (c) strong EASM and weak SASM; (d) weak EASM and strong SASM. Filled-in part indicates the difference in potential height (m2/s2). The dashed box represents the WCAP area.
Atmosphere 16 00481 g006
Figure 7. Vertical velocity (shaded, Pa/s) and latitudinal circulation (arrows) distance level (m/s) profiles (for each monsoon combination minus the multi-year average) averaged over 25−36° N for different configurations of EASM and SASM in different years: (a) strong EASM and strong SASM; (b) weak EASM and weak SASM; (c) strong EASM and weak SASM; (d) weak EASM and strong SASM.
Atmosphere 16 00481 g007
Figure 8. The 850 hPa water vapor flux dispersion (kg/m·hPa·s) and the wind field distance level (m/s) (for each monsoon combination minus the multi-year average) for different configurations of EASM and SASM in different years: (a) strong EASM and strong SASM; (b) weak EASM and weak SASM; (c) strong EASM and weak SASM; (d) weak EASM and strong SASM. The dashed box represents the WCAP area.
Atmosphere 16 00481 g008
Figure 9. Distance level of precipitation distribution (filled colors, mm/day) (for each monsoon combination minus the multi-year average) for different configurations of EASM and SASM in different years: (a) strong EASM and strong SASM; (b) weak EASM and weak SASM; (c) strong EASM and weak SASM; (d) weak EASM and strong SASM.
Atmosphere 16 00481 g009
Figure 10. Future WCAP trends (2015–2100) simulated by the MIROC6 model under different scenarios: (a) SSP2–4.5 scenario; (b) SSP5–8.5 scenario. The red line represents the trend line derived from the M-K test.
Atmosphere 16 00481 g010
Figure 11. Predicted monsoon indices under different future scenarios (2015–2100) simulated by the MIROC6 model: (a) EASMI; (b) SASMI; (c) AZCI; (d) QTPMI.
Atmosphere 16 00481 g011
Disclaimer/Publisher’s Note: The statements, opinions and data contained in all publications are solely those of the individual author(s) and contributor(s) and not of MDPI and/or the editor(s). MDPI and/or the editor(s) disclaim responsibility for any injury to people or property resulting from any ideas, methods, instructions or products referred to in the content.

