
Cover Crop Effects on Greenhouse Gas Emissions and Global Warming Potential in Furrow-Irrigated Corn in the Lower Mississippi River Valley

 , , ,
, , ,
Abstract
1. Introduction
2. Material and Methods
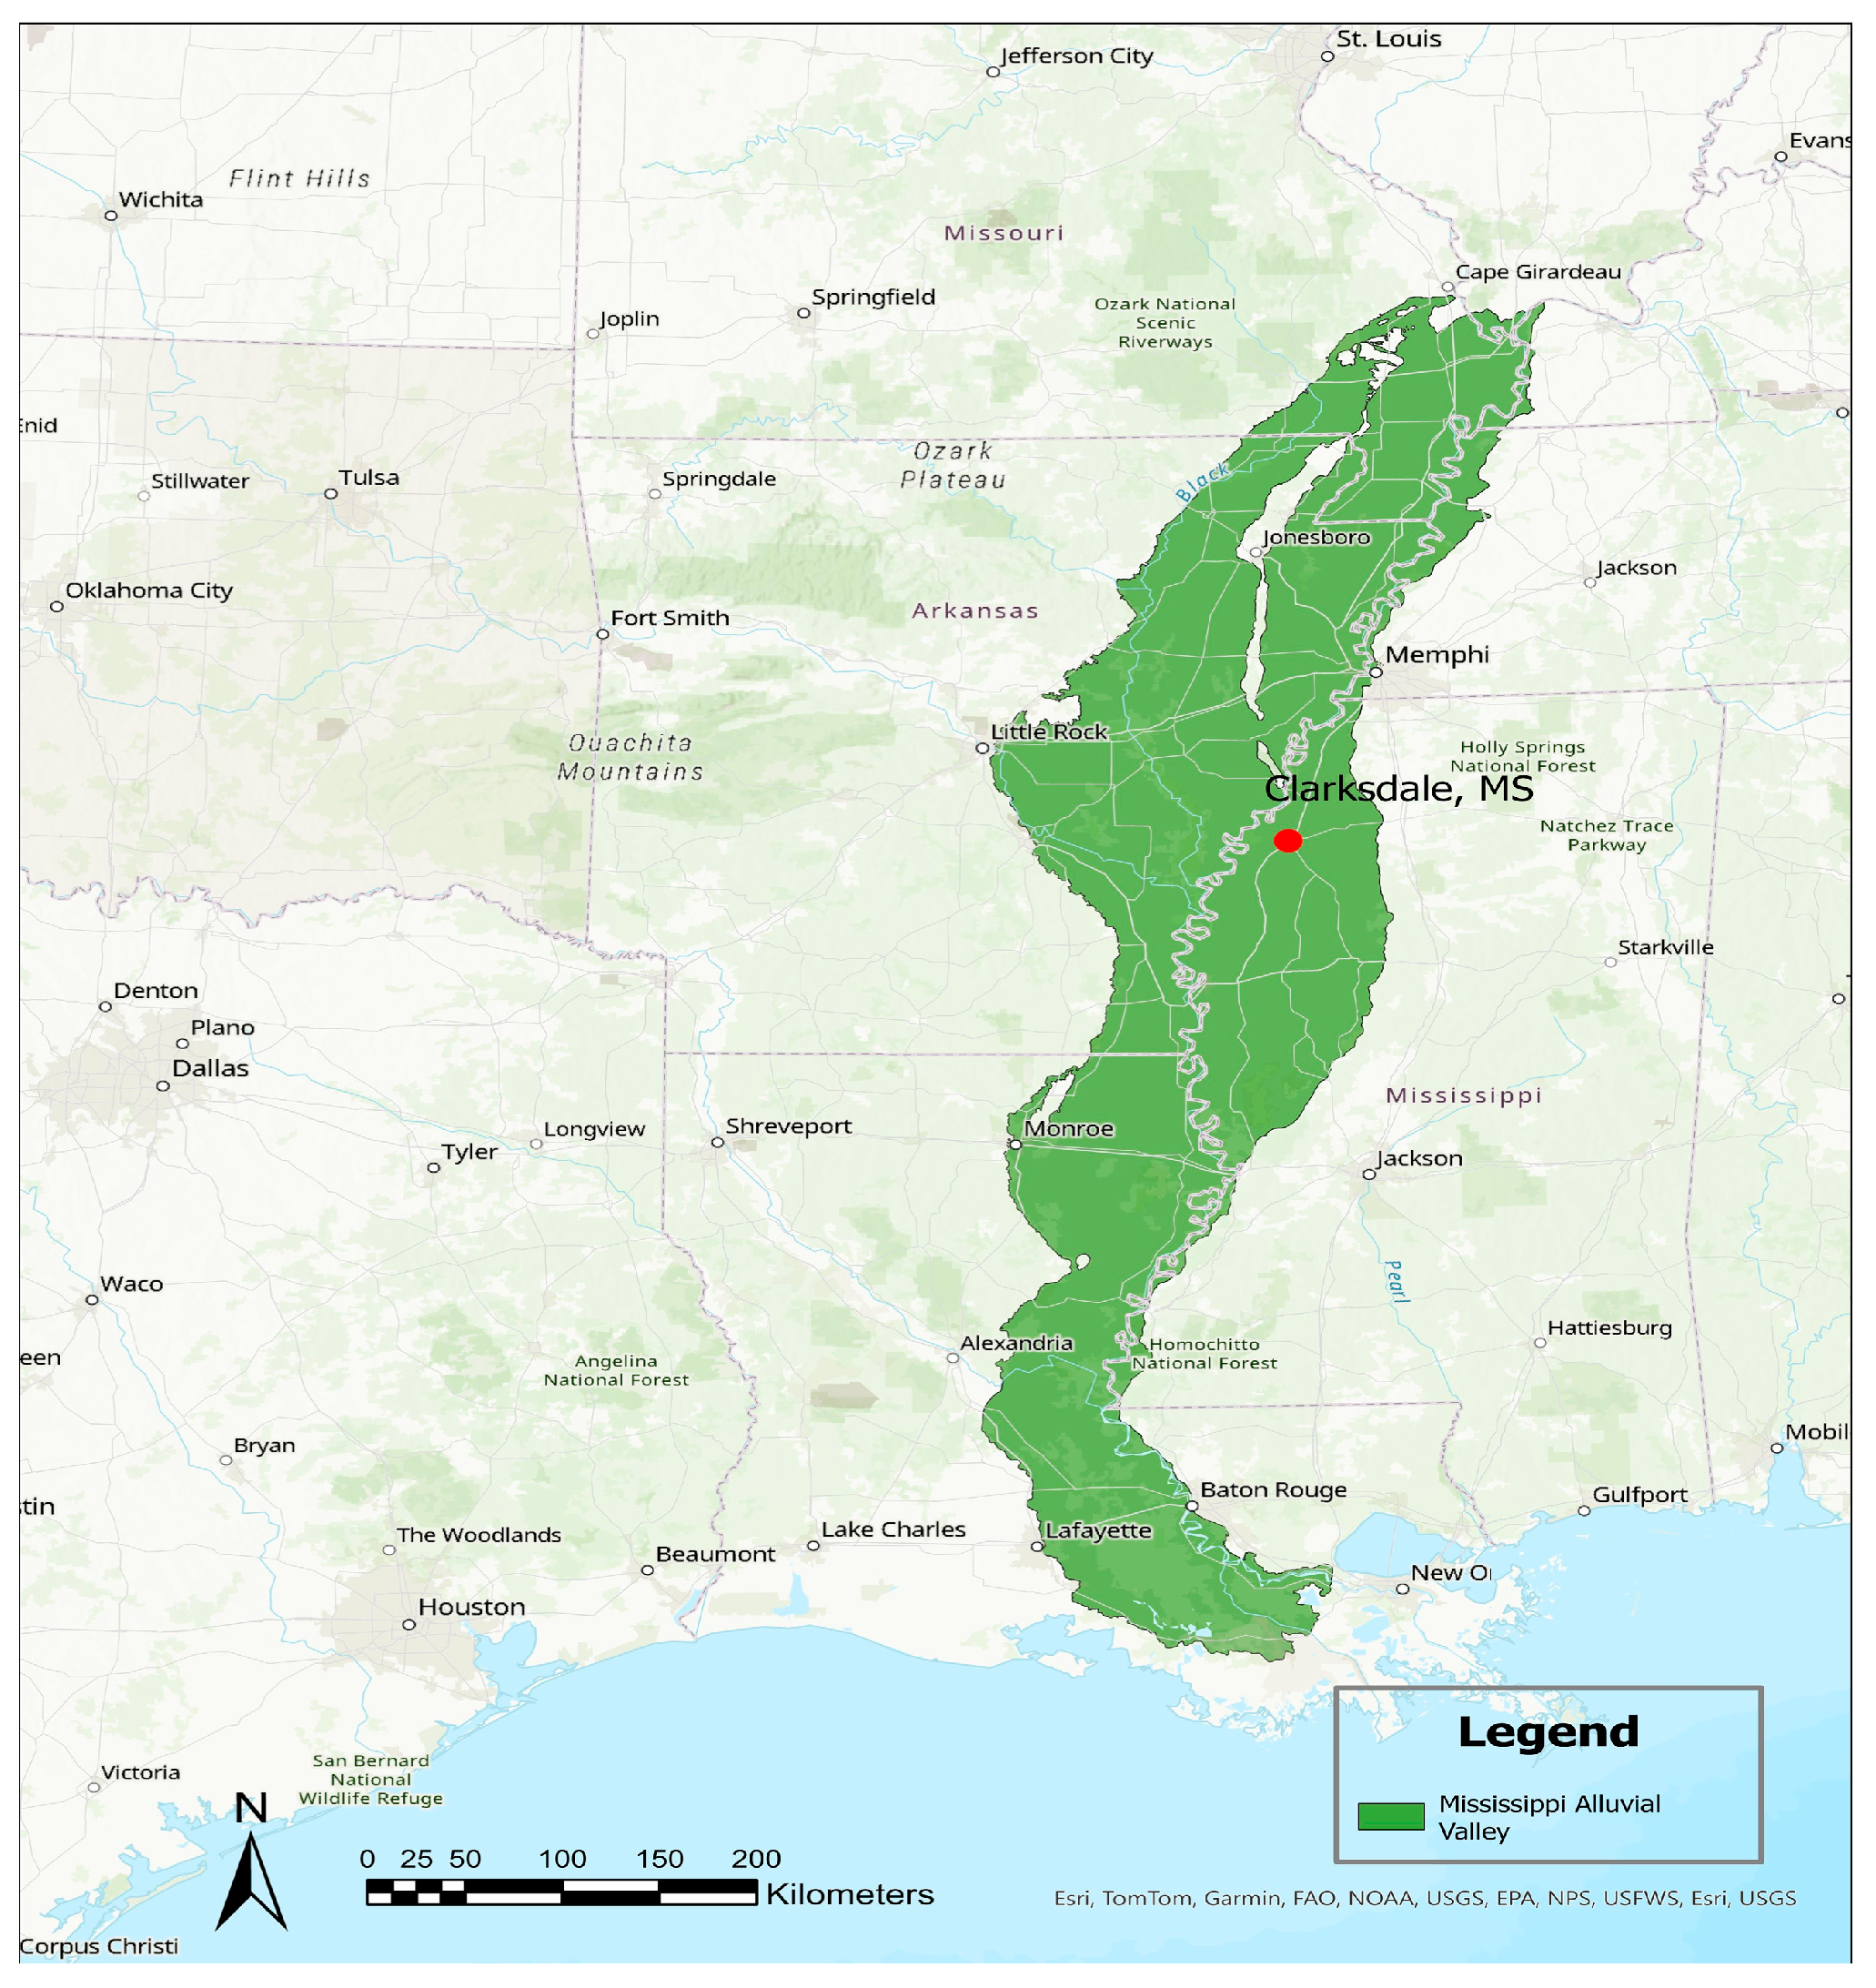
2.1. Site Description
2.2. Field Management
2.3. Soil Sampling and Analyses
2.4. Gas Sampling and Analyses
2.5. Yield Estimation
2.6. Statistical Analyses
3. Results
3.1. Initial Soil Properties
3.2. Growing-Season Weather Characteristics
3.3. Greenhouse Gas Fluxes
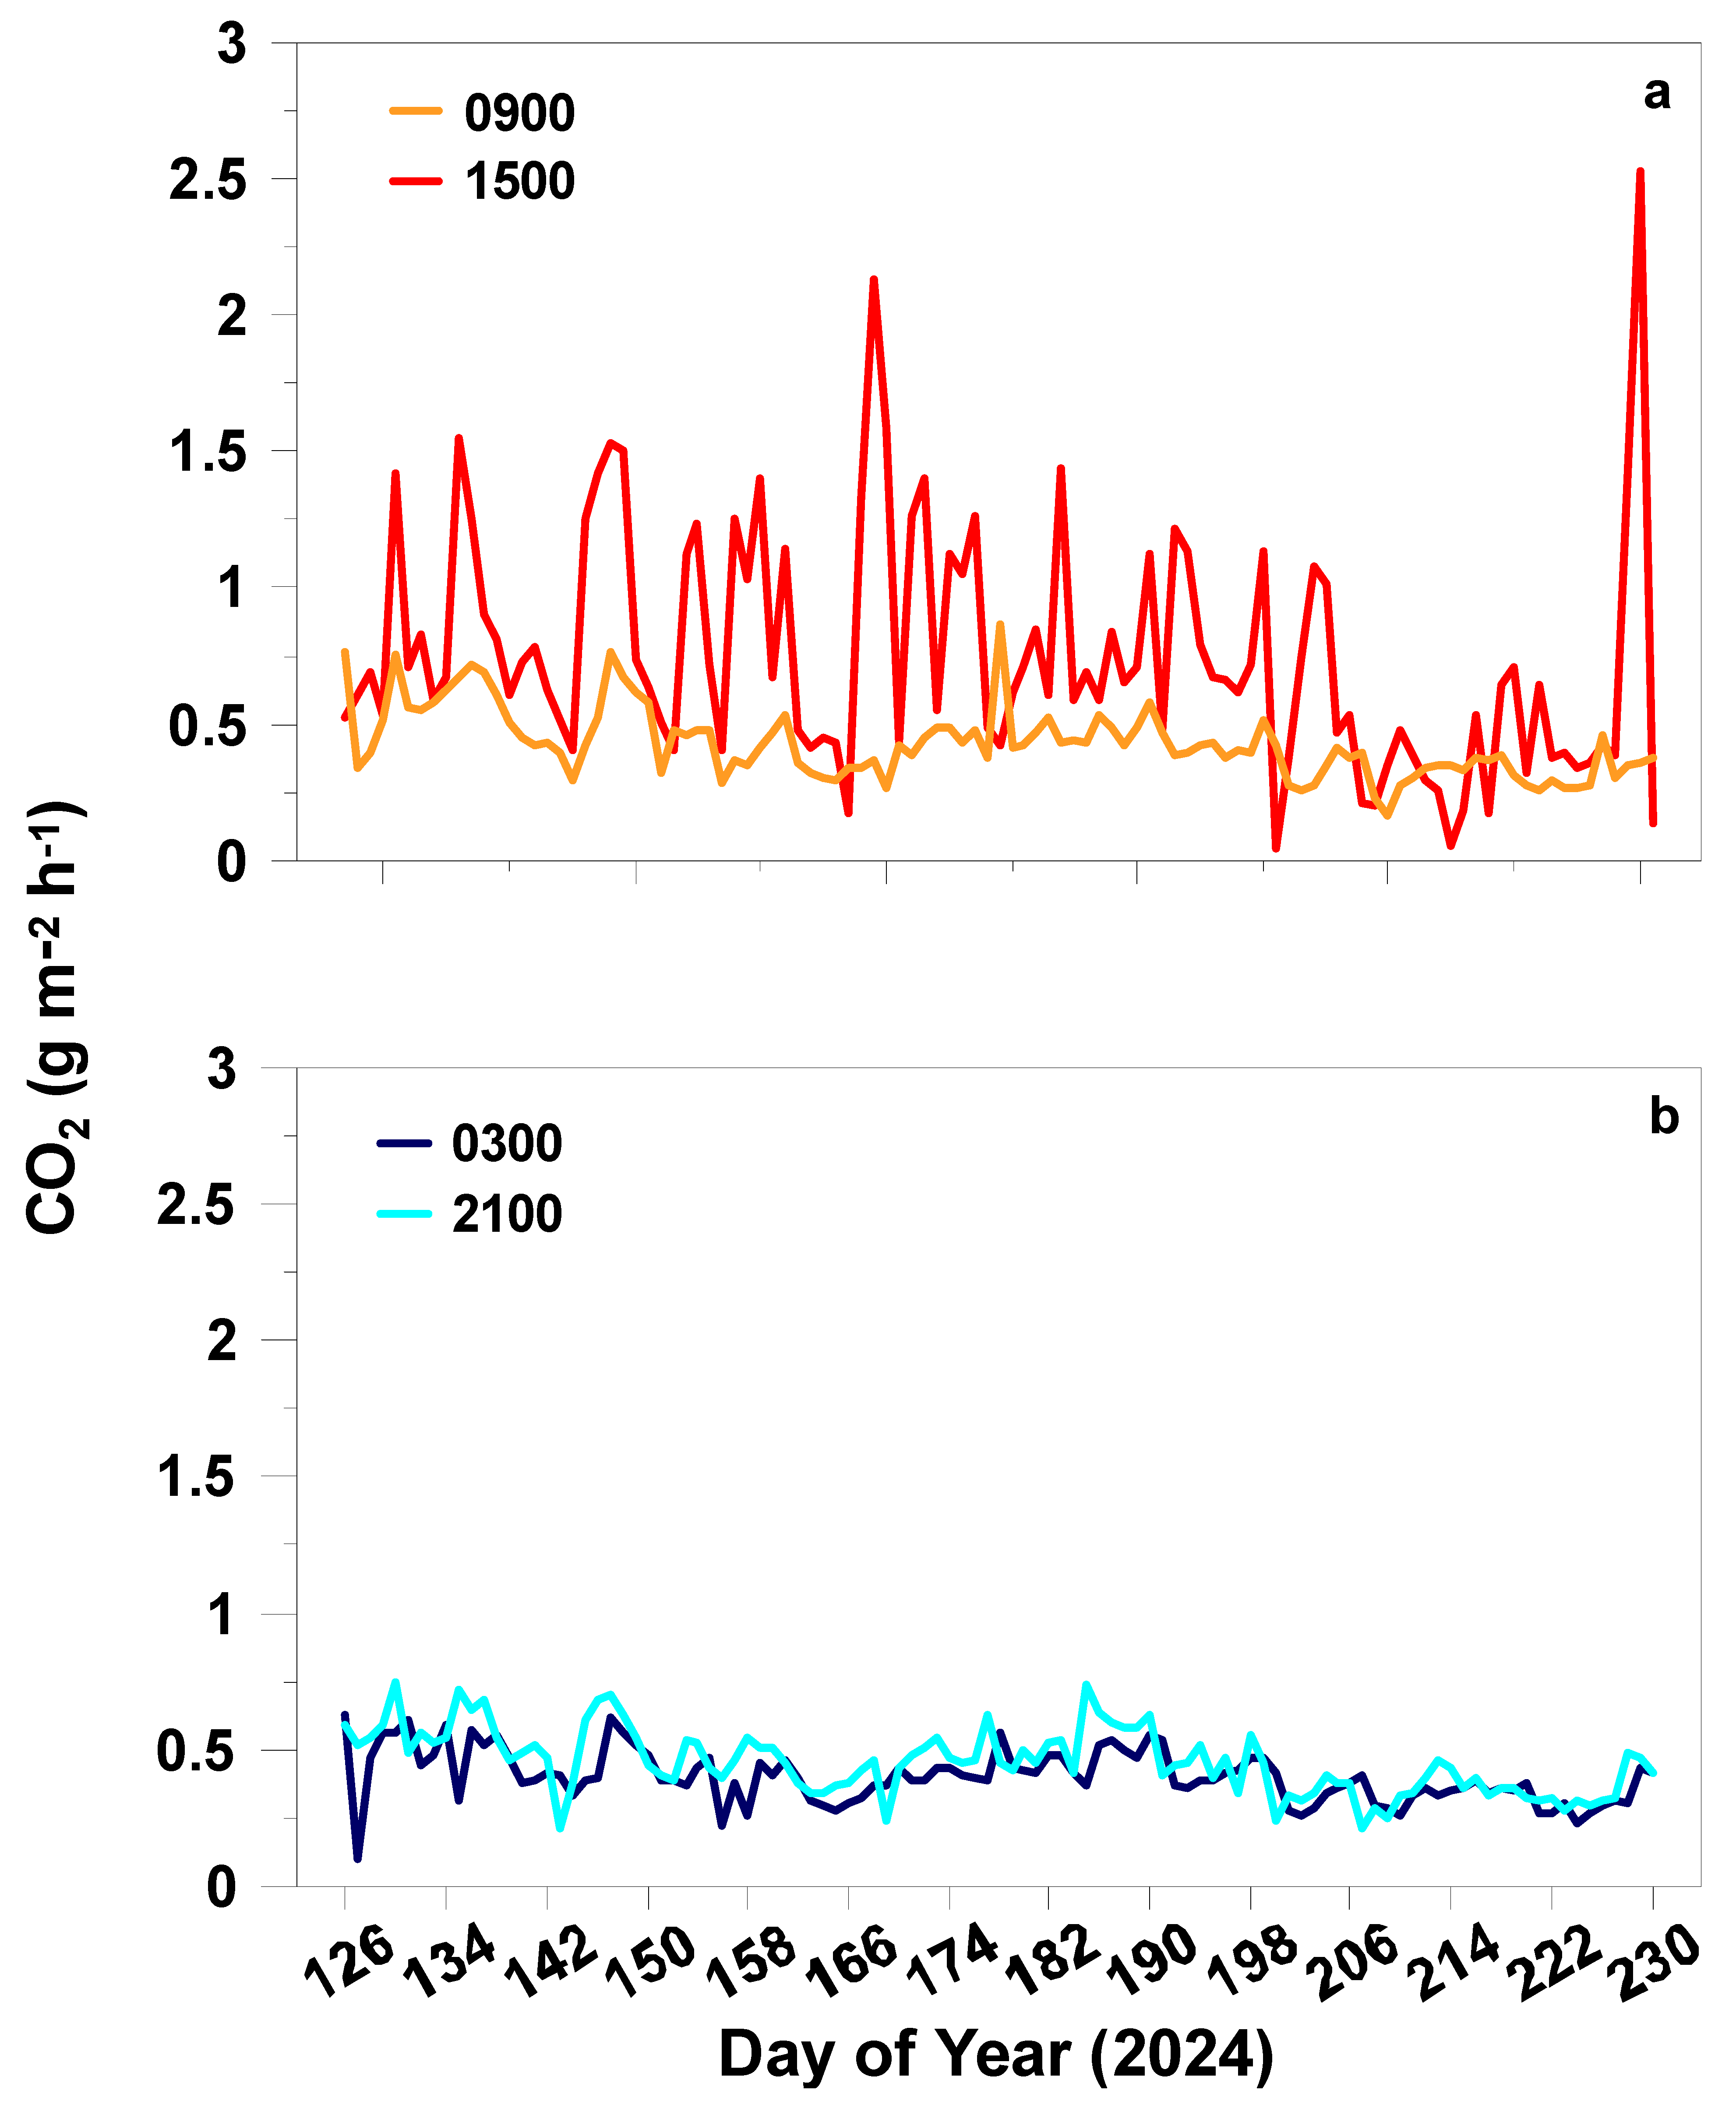
3.3.1. CO2
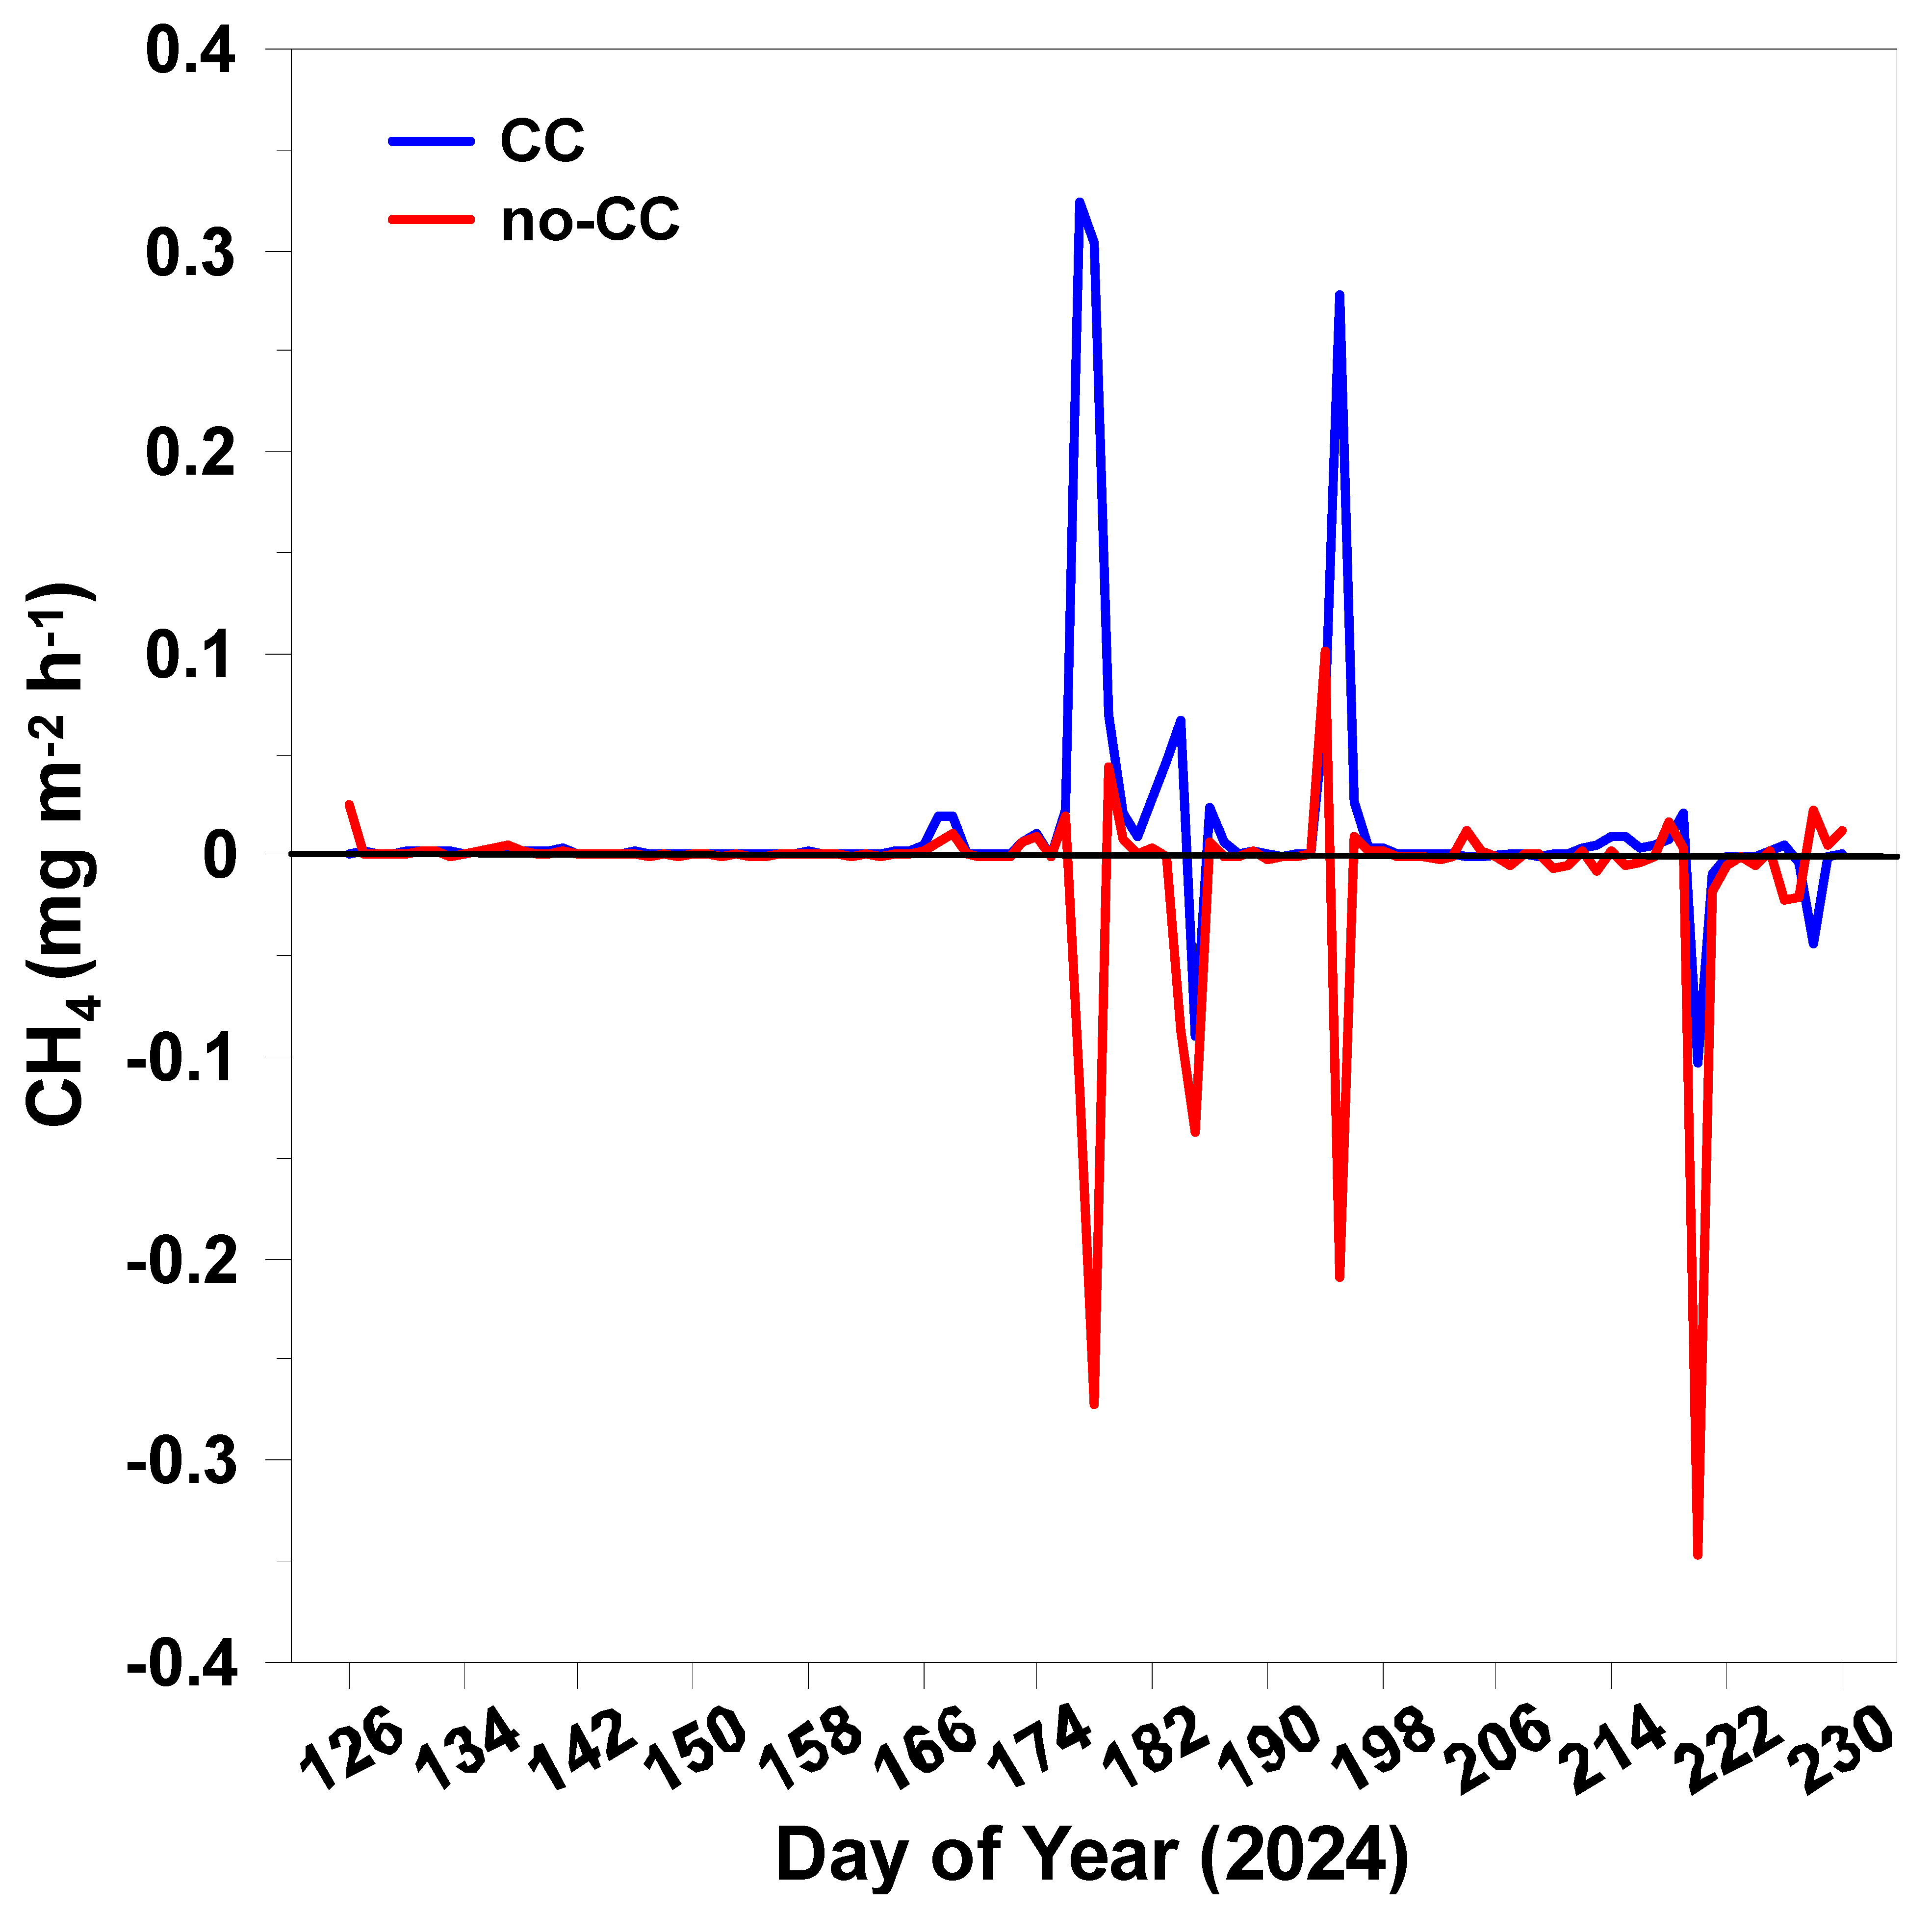
3.3.2. CH4
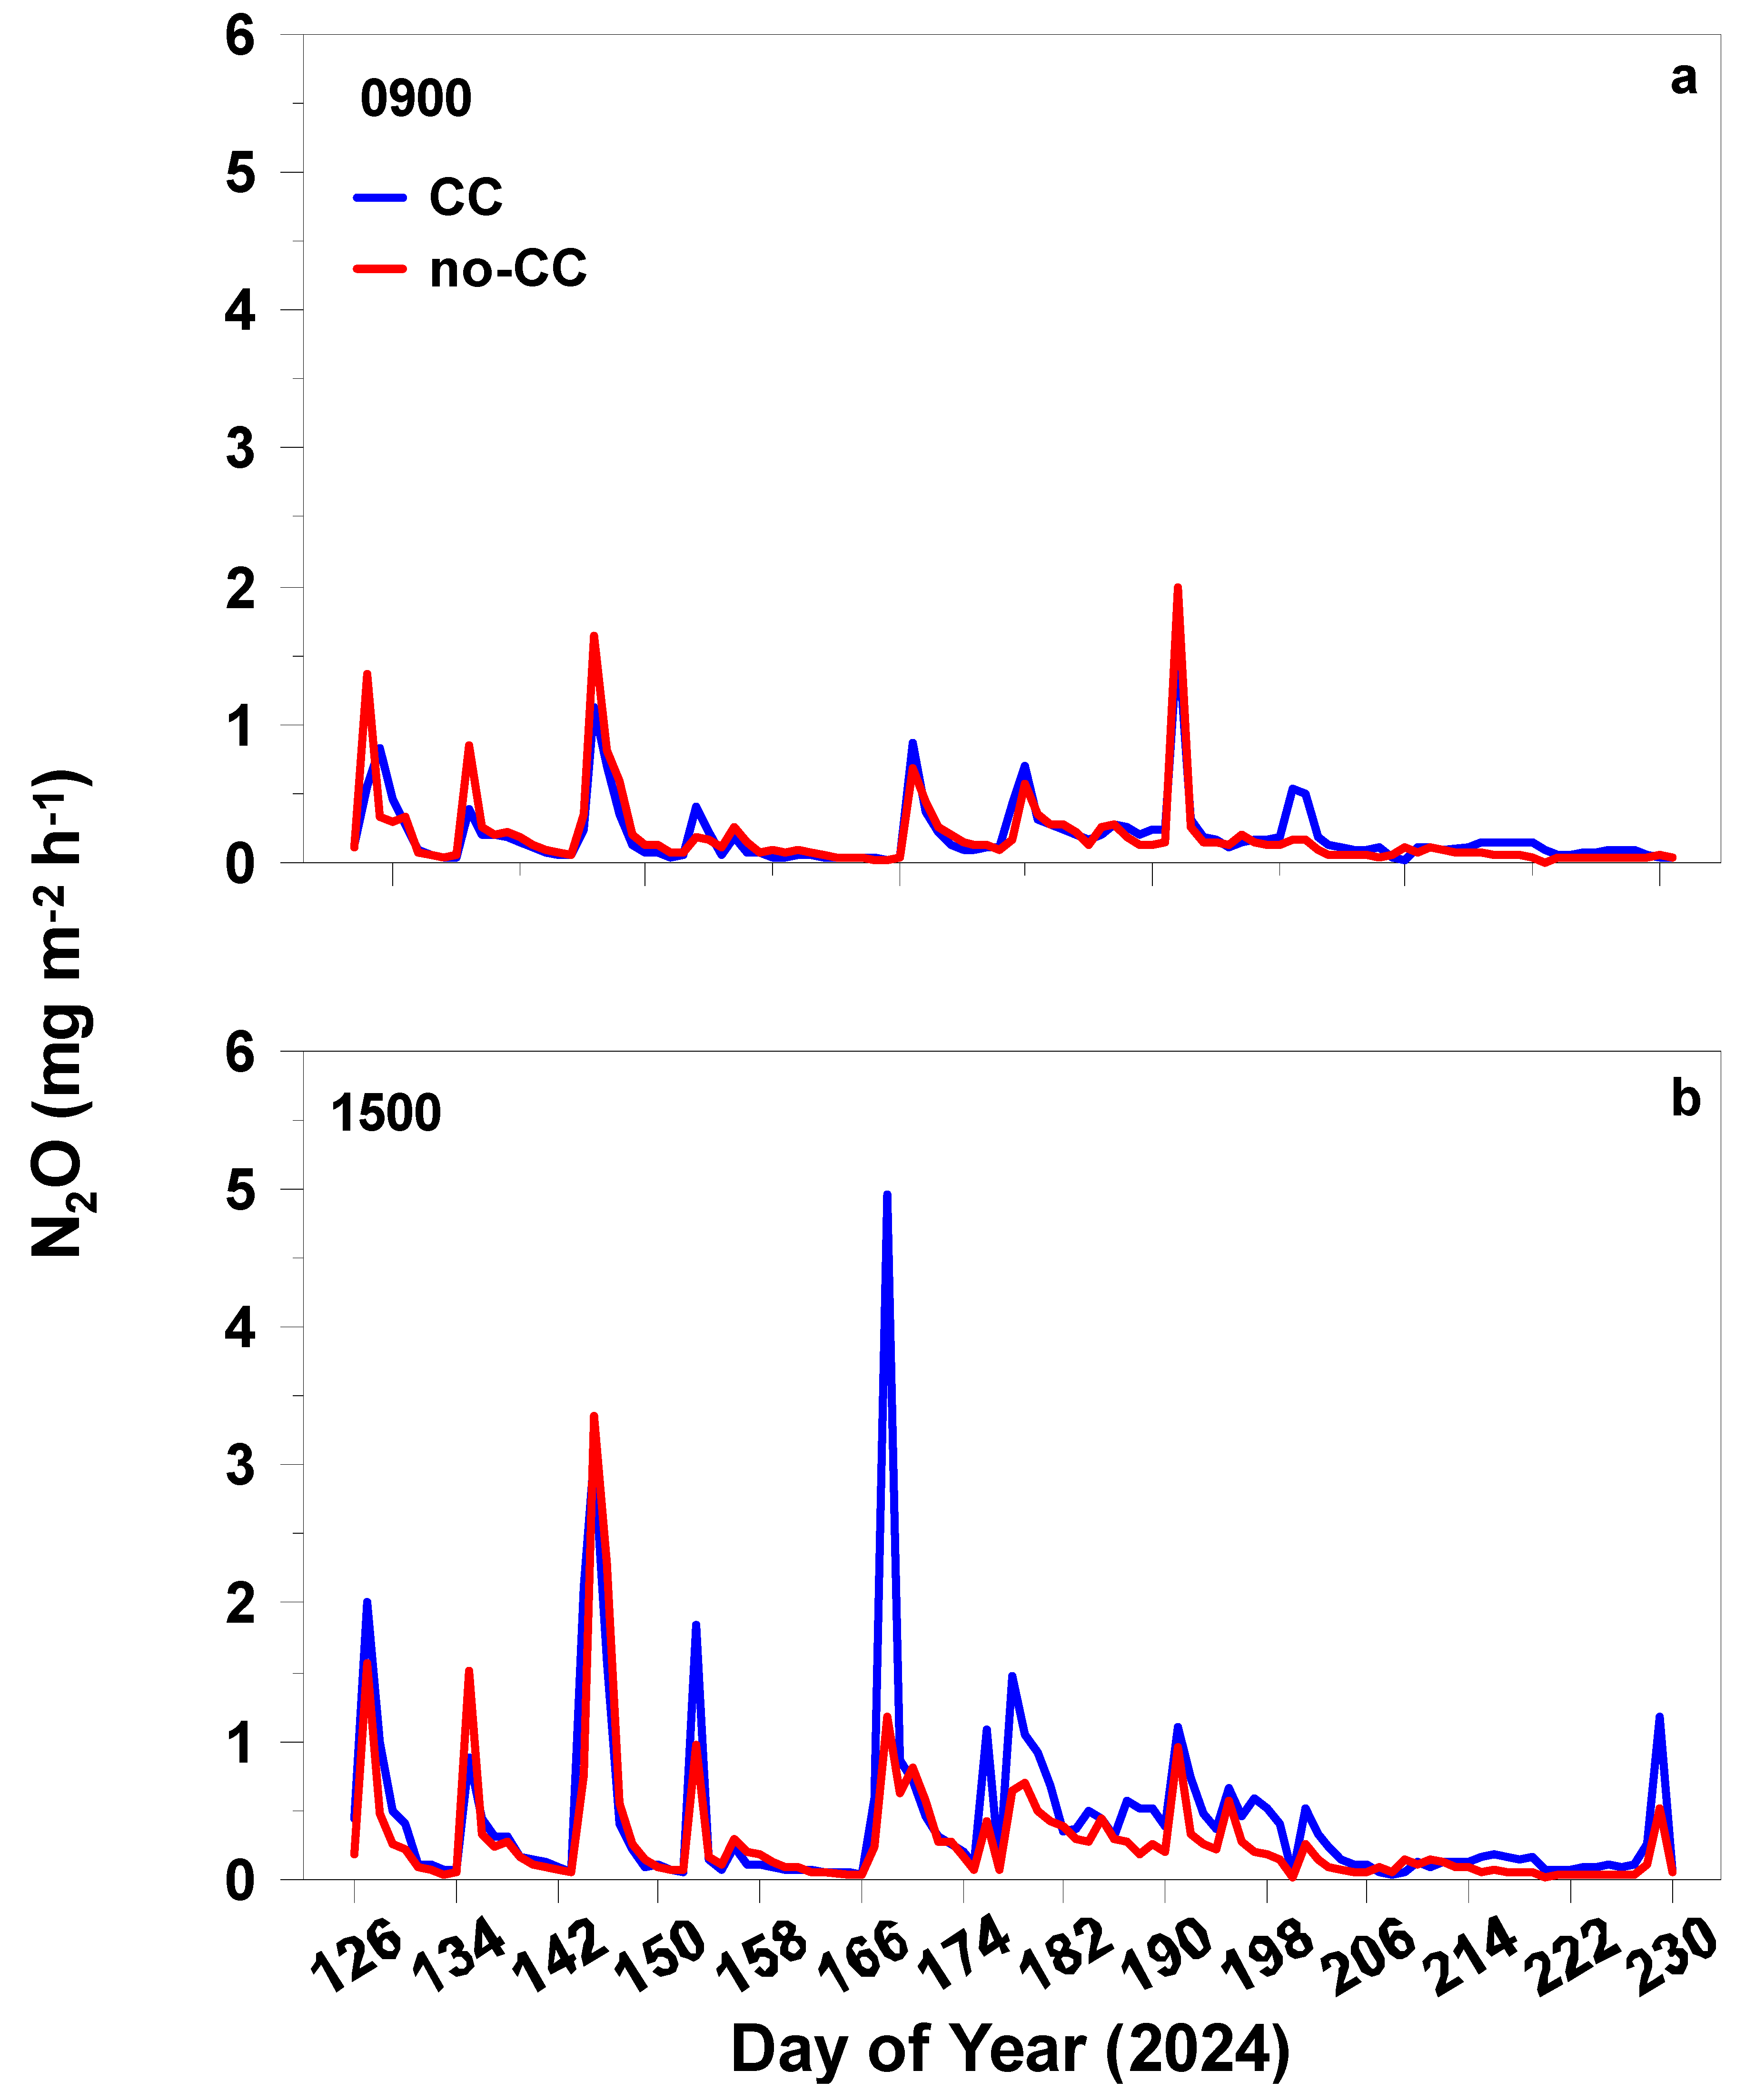
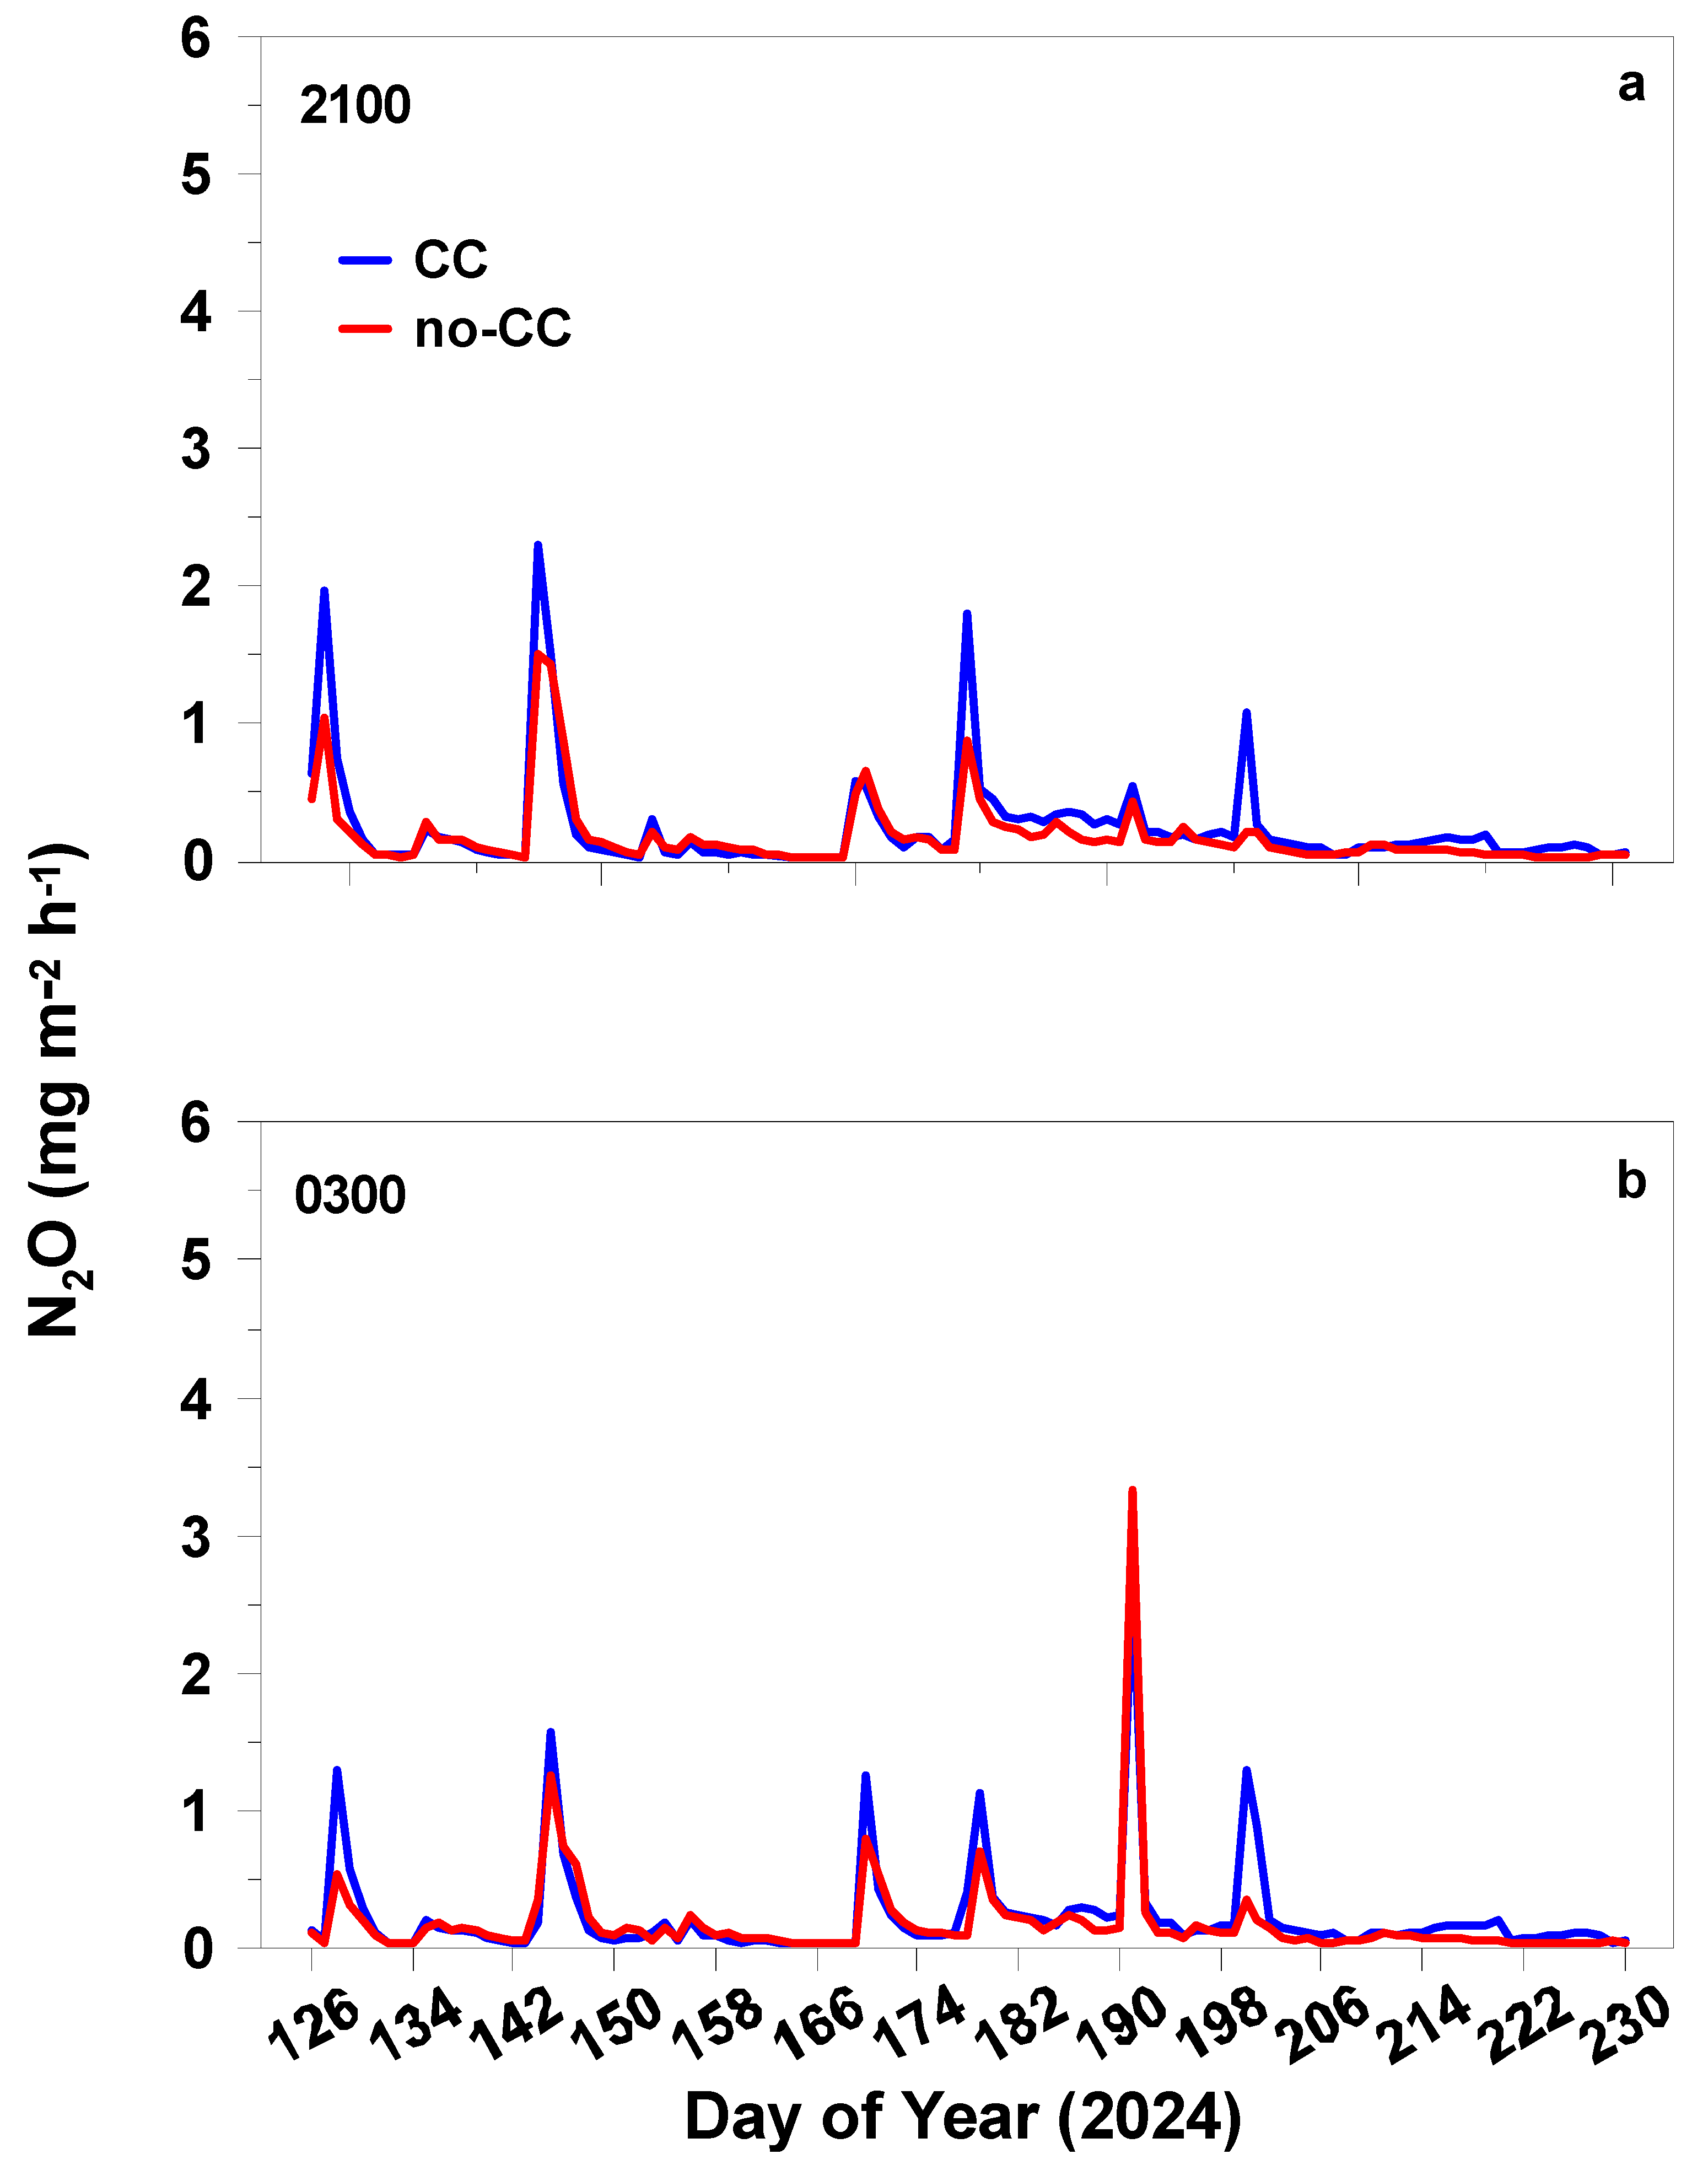
3.3.3. N2O
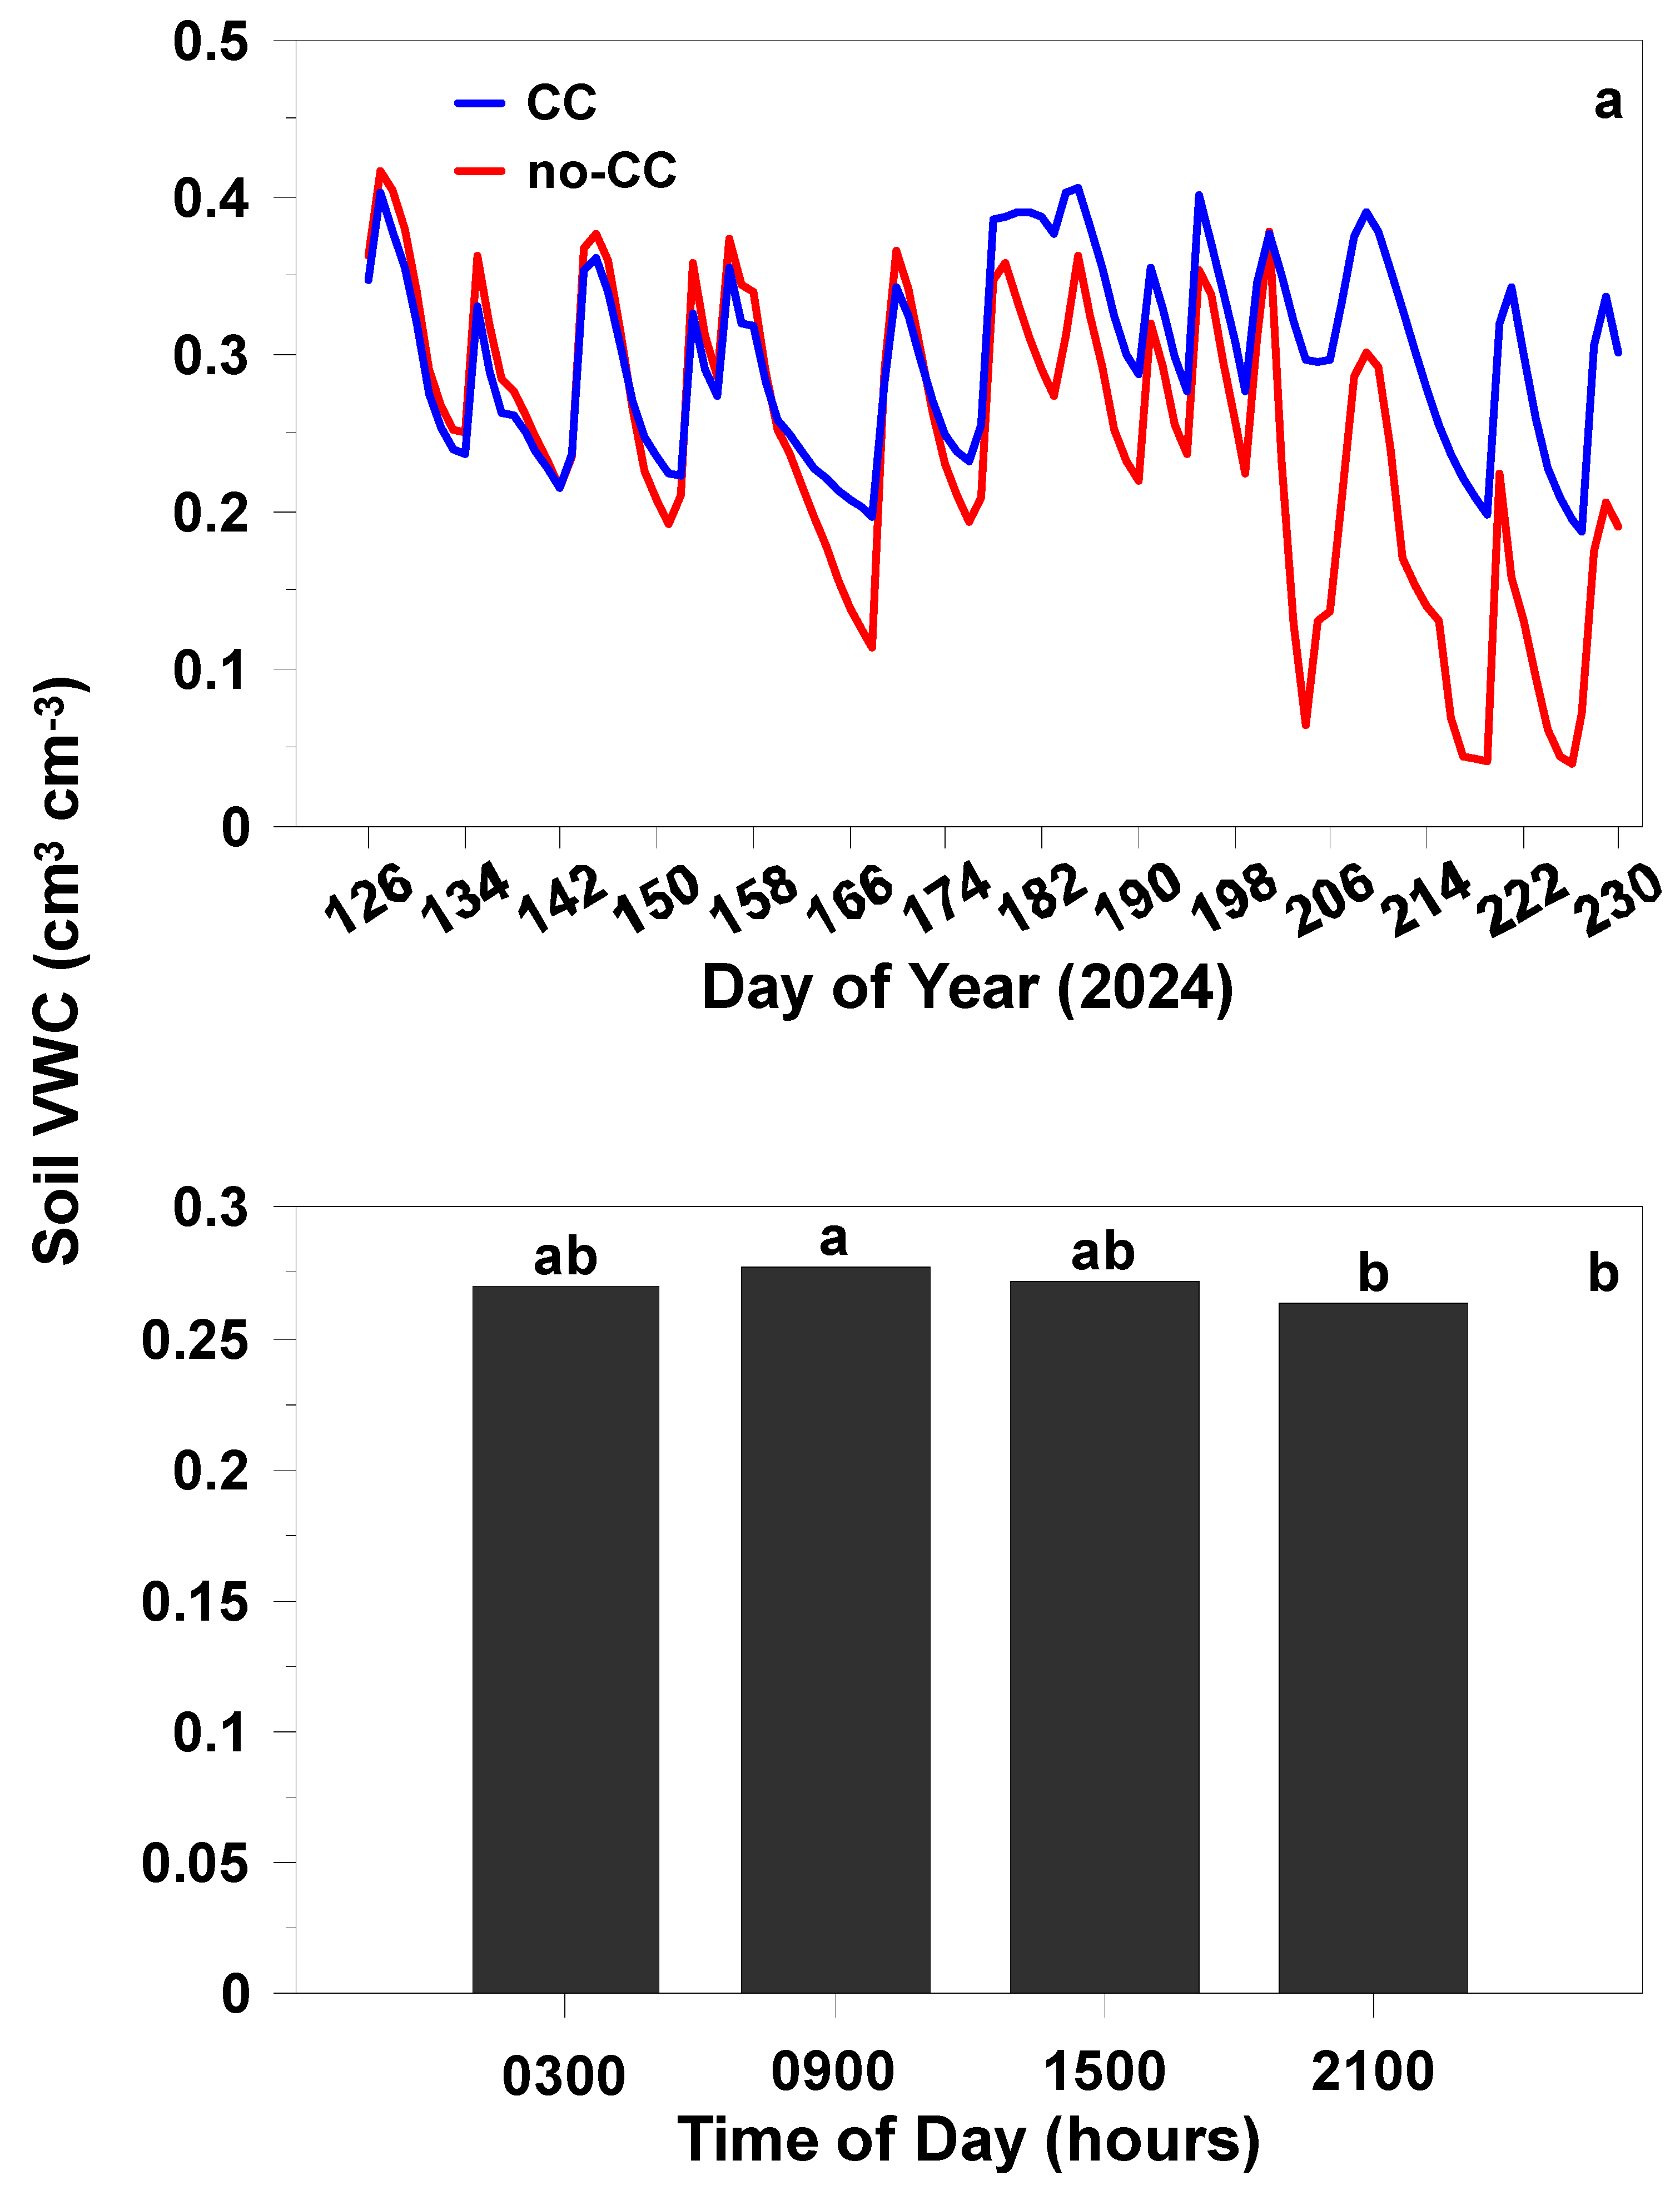
3.3.4. Soil Volumetric Water Content and Soil Temperature
3.4. Multiple Regression Analyses

3.5. Season-Long Emissions, Emissions Intensity, and GWPs
4. Discussion
4.1. CO2 Fluxes
4.2. CH4 Fluxes
4.3. N2O Fluxes
4.4. Soil Volumetric Water Content and Soil Temperature
4.5. Multiple Regression
4.6. Season-Long Emissions, Emissions Intensity, and GWPs
5. Conclusions
Author Contributions
Funding
Institutional Review Board Statement
Informed Consent Statement
Data Availability Statement
Acknowledgments
Conflicts of Interest
Abbreviations
| C | carbon |
| CC | cover crop |
| EMC | electromagnetic |
| GHG | greenhouse gases |
| GWP | global warming potential |
| LMRV | Lower Mississippi River Valley |
| N | nitrogen |
| no-CC | no cover crop |
| OM | organic matter |
| SOC | soil organic carbon |
| SOM | soil organic matter |
| TC | total carbon |
| TN | total nitrogen |
References
- Tiwari, P.; Poudel, K.P.; Yang, J.; Silva, B.; Yang, Y.; McConnell, M. Marginal agricultural land and identification in the Lower Mississippi Alluvial Valley based on remote sensing and machine learning model. Int. J. Appl. Earth Obs. Geoinf. 2023, 125, 103568. [Google Scholar] [CrossRef]
- Daniels, M.B.; Fryer, M.; Slaton, N.A.; Sharpley, A.N.; Webb, P.; Riley, L.; Fernandez, S.; Burke, J.; Berry, L.G.; Roberts, T.; et al. Potassium Losses in Runoff from Cotton Production Fields. Agron. J. 2023, 115, 1666–1677. [Google Scholar] [CrossRef]
- Bai, X.; Huang, Y.; Ren, W.; Coyne, M.; Jacinthe, P.; Tao, B.; Hiu, D.; Yang, J.; Matocha, C. Responses of soil carbon sequestration to climate-smart agriculture practies: A meta-analysis. Glob. Change Biol. 2019, 25, 2591–2606. [Google Scholar] [CrossRef] [PubMed]
- Wade, T.; Roger, C.; Wallander, S. Conservation-Practice Adoption Rates Vary Widely by Crop and Region; EIB-147; U.S. Department of Agriculture, Economic Research Service: Washington, DC, USA, 2015.
- Branca, G.; Mccarthy, N.; Lipper, L.; Jolejole, M.C. Climate Smart Agriculture: A synthesis of Empirical Evidence of Food Security and Mitigation Benefits from Improved Cropland Management; Mitigation of Climate Change in Agriculture Programme, Food and Agriculture Organization: Rome, Italy, 2011. [Google Scholar]
- Food and Agriculture Organization (FAO). “Climate-Smart” Agriculture. Policies, Practices and Financing for Food Security, Adaptation and Mitigation. 2010. Available online: https://www.fao.org/4/i1881e/i1881e00.htm (accessed on 10 January 2025).
- Tilman, D.; Cassman, K.G.; Matson, P.A.; Naylor, R.; Polasky, S. Agricultural sustainability and intensive production practices. Nature 2002, 418, 671–677. [Google Scholar] [CrossRef]
- Environmental Protection Agency (EPA). Inventory of U.S. Greenhouse Gas Emissions and Sinks: 1990–2022. U.S. Environmental Protection Agency 2024, EPA 430-R-24-004. Available online: https://www.epa.gov/ghgemissions/inventory-us-greenhouse-gas-emissions-and-sinks-1990-2022 (accessed on 10 January 2025).
- Liebig, M.A.; Tanaka, D.L.; Gross, J.R. Fallow effects on soil carbon and greenhouse gas flux in central North Dakota. Soil. Sci. Soc. Am. J. 2010, 74, 358–365. [Google Scholar] [CrossRef]
- Bavin, T.K.; Griffis, T.J.; Baker, J.M.; Venterea, R.T. Impact of reduced tillage and cover cropping on the greenhouse gas budget of a maize/soybean rotation ecosystem. Agric. Ecosyst. Environ. 2009, 134, 234–242. [Google Scholar] [CrossRef]
- Venterea, R.T.; Burger, M.; Spokas, K.A. Nitrogen oxide and methane emissions under varying tillage and fertilizer management. J. Environ. Qual. 2005, 34, 1467–1477. [Google Scholar] [CrossRef]
- Robertson, G.P.; Paul, E.A.; Hardwood, R.R. Greenhouse gases in intensive agriculture: Contributions of individual gases to the radiative forcing of the atmosphere. Science 2000, 289, 1922–1925. [Google Scholar] [CrossRef]
- Drury, C.F.; Reynolds, W.D.; Tan, C.S.; Welacky, T.W.; Calder, W.; McLaughlin, N.B. Emissions of nitrous oxide and carbon dioxide: Influence of tillage type and nitrogen placement depth. Soil Sci. Soc. Am. J. 2006, 70, 570–581. [Google Scholar] [CrossRef]
- Muhammad, I.; Sainju, U.M.; Zhao, F.; Khan, A.; Ghimire, R.; Fu, X.; Wang, J. Regulation of soil CO2 and N2O emissions by cover crops: A meta-analysis. Soil. Till Res. 2019, 192, 105–112. [Google Scholar] [CrossRef]
- Akhtar, K.; Wang, W.; Ren, G.; Khan, A.; Feng, Y.; Yang, G. Changes in soil enzymes, soil properties, and maize crop productivity under wheat straw mulching in Guanzhong, China. Soil. Till. Res. 2018, 182, 94–102. [Google Scholar] [CrossRef]
- Khan, A.; Ali, N.; Haider, S.L. Maize productivity and soil carbon storage as influenced by wheat residue management. J. Plant Nutr. 2018, 41, 1868–1878. [Google Scholar] [CrossRef]
- Moore, E.B.; Wiedenhoeft, M.H.; Kaspar, T.C.; Cambardella, C.A. Rye cover crop effects on soil quality in no-till corn silage-soybean cropping systems. Soil. Sci. Soc. Am. J. 2014, 78, 968–975. [Google Scholar] [CrossRef]
- Aguillera, E.; Lassaletta, L.; Sanz-Cobena, A.; Garnier, J.; Vallejo, A. The potential of organic fertilizers and water management to reduce N2O emissions in Mediterranean climate cropping systems. A review. Agric. Ecosyst. Environ. 2013, 164, 32–52. [Google Scholar] [CrossRef]
- Young-Son, C.; Mineta, T.; Hidaka, K. Nitrogen fixation and utilization for green manure of common wild legume narrowleaf vetch (Vícia angustifolia L.). Jarq-Jpn. Agr. Res. Q. 2003, 37, 125–133. [Google Scholar]
- Singh, S.; Singh, J.S.; Kashyap, A.K. Methane flux from irrigated rice fields in relation to crop growth and N-fertilization. Soil. Biol. Biochem. 1999, 31, 1219–1228. [Google Scholar] [CrossRef]
- Kladivko, E.J.; Kaspar, T.C.; Jaynes, D.B.; Malone, R.W.; Singer, J.; Morin, X.K.; Searchinger, T. Cover crops in the upper midwestern United States: Potential adoption of reduction of nitrate leaching in the Mississippi River Basin. J. Soil. Water Conserv. 2014, 69, 279–291. [Google Scholar] [CrossRef]
- Wang, Y.; Saikawa, E.; Avramov, A.; Hill, N.S. Agricultural Greenhouse Gas Fluxes Under Different Cover Crop Systems. Front. Clim. 2022, 3, 742320. [Google Scholar] [CrossRef]
- Sanz-Cobena, A.; García-Marco, S.; Quemada, M.; Gabriel, J.; Almendros, P.; Vallejo, A. Do cover crops enhance N2O, CO2 or CH4 emissions from soil in Mediterranean arable systems? Sci. Total Environ. 2014, 466, 164–174. [Google Scholar] [CrossRef]
- Chirinda, N.; Olesen, J.E.; Porter, J.R.; Schjønning, P. Soil properties, crop production and greenhouse gas emissions from organic and inorganic fertilizer-based arable cropping systems. Agric. Ecosyst. Environ. 2010, 139, 584–594. [Google Scholar] [CrossRef]
- Snyder, C.S.; Bruulsema, T.W.; Jensen, T.L.; Fixen, P.E. Review of greenhouse gas emissions from crop production systems and fertilizer management effects. Agric. Ecosyst. Environ. 2009, 133, 247–266. [Google Scholar] [CrossRef]
- Gentile, R.; Valauwe, B.; Chivenge, P.; Six, J. Interactive effects from combining fertilizer and organic residue inputs on nitrogen transformations. Soil. Biol. Biochem. 2008, 40, 2375–2384. [Google Scholar] [CrossRef]
- Abera, G.; Wolde-Meskel, E.; Bakken, L.R. Unexpected high decomposition of legume residues in dry season soils from tropical coffee plantations and crop lands. Agron. Sustain. Dev. 2014, 34, 667–676. [Google Scholar] [CrossRef]
- Gao, J.; Xie, Y.; Jin, H.; Liu, Y.; Bai, X.; Ma, D.; Zhu, Y.; Wang, C.; Guo, T. Nitrous oxide emissions and denitrifier abundance in two agricultural soils amended with crop residues and urea in the North China Plain. PLoS ONE 2016, 11, e0154773. [Google Scholar] [CrossRef]
- Bashe, A.D.; Miguez, F.E.; Kaspar, T.C.; Castellano, M.J. Do cover crops increase or decrease nitrous oxide emissions? A meta-analysis. J. Soil. Water Conserv. 2014, 69, 471–482. [Google Scholar] [CrossRef]
- Unger, P.W.; Vigil, M.F. Cover crop effects on soil water relationships. J. Soil. Water Conserv. 1990, 53, 200–207. [Google Scholar]
- Blum, M.D.; Roberts, H. The Mississippi Delta region: Past, present, and future. Annu. Rev. Earth Planet. Sci. 2012, 40, 655–683. [Google Scholar] [CrossRef]
- United States Department of Agriculture (USDA); Natural Resources Conservation Service (NRCS). Web Soil Survey. 2019. Available online: https://www.nrcs.usda.gov/sites/default/files/2022-10/Cover_Crop_Species_Selection_for_Crop_Production_SD-FS-55.pdf (accessed on 10 January 2025).
- National Oceanic and Atmospheric Administration (NOAA); National Centers for Environmental Information (NCEI). Data Tools: 1981–2010 Climate Normals. 2010. Available online: https://www.ncei.noaa.gov/products/land-based-station/us-climate-normals (accessed on 10 January 2025).
- United States Department of Agriculture (USDA); Natural Resources Conservation Service (NRCS). Cover Crop Species Selection for Crop Production. 2009. Available online: https://websoilsurvey.nrcs.usda.gov/app/ (accessed on 10 January 2025).
- Oldham, L.; Jones, K. Best management practices for plant nutrient management. Miss. State Univ. Ext. Serv. 2021, 1622. [Google Scholar]
- Gee, G.W.; Or, D. Particle-size analysis. In Method of Soil Analysis. Part 4: Physical Methods, 1st ed.; Dane, J.H., Topp, G.C., Eds.; Soil Science Society of America: Madison, WI, USA, 2002; pp. 255–293. [Google Scholar]
- Zhang, H.; Hardy, D.H.; Mylavarapu, R.; Wang, J.J. Mehlich-3. In Soil Test Methods from the Southeastern US. Southern Cooperative Series Bulletin 419; Sikora, F.J., Moore, K.P., Eds.; University of Georgia: Athens, GA, USA, 2014; pp. 101–110. [Google Scholar]
- Intergovernmental Panel on Climate Change (IPCC). Global Carbon and other Biogeochemical Cycles and Feedbacks. In Climate Change 2021: The Physical Science Basis. Contribution of Working Group I to the Sixth Assessment Report of the Intergovernmental Panel on Climate Change; Canadell, J.G., Monteiro, P.M.S., Costa, M.H., Cotrim da Cunha, L., Cox, P.M., Eliseev, A.V., Henson, S., Ishii, M., Jaccard, S., Koven, C., et al., Eds.; Cambridge University Press: New York, NY, USA, 2021; pp. 673–816. [Google Scholar]
- Rector, C.; Brye, K.R.; Humphreys, J.; Norman, R.J.; Gbur, E.E.; Hardke, J.T.; Willett, C.; Evans-White, M.A. N2O emissions and global warming potential as affected by water management and rice cultivar on an Alfisol in Arkansas, USA. Geoderma Reg. 2018, 14, e00170. [Google Scholar] [CrossRef]
- Bengtsson, G.; Bengtson, P.; Månsson, K.F. Gross nitrogen mineralization-, immobilization-, and nitrification rates as a function of soil C/N ratio and microbial activity. Soil. Biol. Biochem. 2003, 35, 143–154. [Google Scholar] [CrossRef]
- Zeglin, L.H.; Bottomley, P.J.; Jumpponen, A.; Rice, C.W.; Arango, M.; Lindsley, A.; McGowan, A.; Mfombep, P.; Myrold, D.D. Altered precipitation regie affects the function and composition of soil microbial communities on multiple time scales. Ecology 2013, 94, 2334–2345. [Google Scholar] [CrossRef] [PubMed]
- United States Department of Agriculture (USDA); National Agricultural Statistical Service (NASS). Mississippi Crop Production. 2021. Available online: https://www.nass.usda.gov/Quick_Stats/Ag_Overview/stateOverview.php?state=MISSISSIPPI (accessed on 10 January 2025).
- Parkin, T.B.; Kaspar, T.C. Temperature controls on diurnal carbon dioxide flux: Implications for estimating soil carbon loss. Soil. Sci. Soc. Am. J. 2003, 67, 1763–1772. [Google Scholar] [CrossRef]
- Liu, Y.; Li, S.Q.; Yang, S.J.; Hu, W.; Chen, X.P. Diurnal and seasonal soil CO2 flux pattern in spring maize fields on the Loess Plateau, China. Soil. Plant Sci. 2010, 60, 245–255. [Google Scholar]
- Jarvis, P.; Rey, A.; Petsikos, C.; Wingate, L.; Rayment, M.; Pereira, J.; Banza, J.; David, J.; Miglietta, F.; Borghetti, M.; et al. Drying and wetting of Mediterranean soils stimulates decomposition and carbon dioxide emission: The “Birch effect”. Three Physiol. 2007, 27, 929–940. [Google Scholar] [CrossRef] [PubMed]
- Parkin, T.B.; Venterea, R.T. Chamber-based Trace Gas Flux Measurements. In Sampling Protocols; Follett, R.F., Ed.; United States Department of Agriculture, Agricultural research Service: Washington, DC, USA, 2010; pp. 3–39. [Google Scholar]
- Roth, T.; Waite, J. Early Spring Carbon to Nitrogen Ratios of Cereal Rye Varieties; United States Department of Agriculture, Kansas Plant Materials Center: Manhattan, KS, USA, 2021.
- Abassi, M.K.; Khaliq, A. Nitrogen mineralization of a loam soil supplemented with organic-inorganic amendments under laboratory incubation. Front. Plant Sci. 2016, 7, 1038. [Google Scholar] [CrossRef]
- Murungu, F.S.; Chiduza, C.; Muchaonyerwa, P.; Mnkeni, P.N.S. Decomposition, nitrogen and phosphorus mineralization from winter-grown cover crop residues and suitability for a smallholder farming system in South Africa. Nutr. Cycl. Agroecosyst. 2011, 89, 115–123. [Google Scholar] [CrossRef]
- Blanco-Canqui, H.; Ruis, S.J. Cover crop impacts on soil physical properties: A review. Soil. Sci. Soc. Am. J. 2020, 84, 1527–1576. [Google Scholar] [CrossRef]
- Blanco-Canqui, H.; Shaver, T.M.; Lindquist, J.L.; Shapiro, C.A.; Elmore, R.W.; Francis, C.A.; Hergert, G.W. Cover crops ecosystem services: Insights from studies in temperate soils. Agron. J. 2015, 107, 2449–2474. [Google Scholar] [CrossRef]
- Kabir, Z.; Koide, R.T. The effect of dandelion or a cover crop on mycorrhiza inoculum potential, soil aggregation and yield of maize. Agric. Ecosyst. Environ. 2000, 78, 167–174. [Google Scholar] [CrossRef]
- Hernandez-Ramirez, G.; Brouder, S.M.; Smith, D.R.; Van Scoyoc, G.E. Greenhouse gas fluxes in an eastern Corn Belt soil: Weather, nitrogen source, and rotation. J. Environ. Qual. 2009, 38, 841–854. [Google Scholar] [CrossRef]
- National Oceanic and Atmospheric Administration (NOAA); National Weather Service (NWS). Climate: Observed Weather. 2024. Available online: https://www.weather.gov/wrh/Climate?wfo=meg (accessed on 10 January 2025).
- Sherlock, R.R.; Sommer, S.G.; Khan, R.Z.; Wood, C.W.; Guertal, E.A.; Freney, J.R.; Dawson, C.O.; Cameron, K.C. Ammonia methane nitrous oxide emission from pig slurry applied to a pasture in New, Zealand. J. Environ. Qual. 2002, 31, 1491–1591. [Google Scholar] [CrossRef] [PubMed]
- Chadwick, D.R.; Pain, B.F. Methane fluxes following slurry applications to grassland soils: Laboratory experiments. Agric. Ecosyst. Environ. 1997, 63, 51–60. [Google Scholar] [CrossRef]
- Lim, J.; Wehmeyer, H.; Heffner, T.; Aeppli, M.; Gu, W.; Kim, P.J.; Horn, M.A.; Ho, A. Resilience of aerobic methanotrophs in soils; spotlight on the methane sink under agriculture. Miciobiol. Ecol. 2024, 100, fiae008. [Google Scholar] [CrossRef] [PubMed]
- Rabot, E.; Hénault, C.; Cousin, I. Effect of the soil water dynamics on nitrous oxide emissions. Geoderma 2016, 280, 38–46. [Google Scholar] [CrossRef]
- Groffman, P.M.; Tiedje, J.M. Denitrification Hysteresis During Wetting and Drying Cycles in Soil. Soil. Sci. Soc. Am. J. 1988, 52, 1626–1629. [Google Scholar] [CrossRef]
- Della Lunga, D.; Brye, R.K.; Slayden, J.M.; Henry, C.G.; Wood, L.S. Relationships among soil factors and greenhouse gas emissions from furrow-irrigated rice in the mid-southern USA. Geoderma Reg. 2021, 24, e00365. [Google Scholar] [CrossRef]
- Barker, J.B.; Franz, T.E.; Heeren, D.M.; Neale, C.M.U.; Luck, J.D. Soil water content monitoring for irrigation management: A geostatistical analysis. Agri. Water Manag. 2017, 188, 36–49. [Google Scholar] [CrossRef]
- Motschenbacher, J.M.; Brye, K.R.; Anders, M.M.; Gbur, E.E.; Slaton, N.A.; Evans-White, M.A. Daily soil surface CO2 flux during non-flooded periods in flood-irrigated rice rotations. Agron. Sustain. Dev. 2015, 35, 771–782. [Google Scholar] [CrossRef]
- Bateman, E.J.; Baggs, E.M. Contributions of nitrification and denitrification to N2O emissions from soils at different water-filled pore space. Biol. Fertil. Soils 2005, 41, 379–388. [Google Scholar] [CrossRef]
- Skidmore, S.T.; Thompson, B. Bias and precision of some classical ANOVA effect sizes when assumptions are violated. Behav. Res. Methods 2013, 45, 536–546. [Google Scholar] [CrossRef]
- Behnke, G.D.; Villamil, M.B. Cover crop rotation affect greenhouse gas emissions and crop production in Illinois, USA. Field Crop Res. 2019, 241, 107580. [Google Scholar] [CrossRef]
- Ussiri, D.A.N.; Lal, R. Long-term effects on soil carbon storage and carbon dioxide emissions in continuous corn cropping system from an alfisol in Ohio. Soil. Till. Res. 2009, 104, 39–47. [Google Scholar] [CrossRef]
- Fiorini, A.; Maris, S.C.; Abalos, D.; Amaducci, S.; Tabaglio, V. Combining no-till with rye (Secale cereale L.) cover crop mitigates nitrous oxide emissions without decreasing yield. Soil. Till Res. 2020, 196, 104442. [Google Scholar] [CrossRef]
- Sarkodie-Addo, J.; Lee, H.C.; Baggs, E.M. Nitrous oxide emissions after application of inorganic fertilizer and incorporation of green manure residues. Soil. Use Manag. 2003, 19, 331–339. [Google Scholar] [CrossRef]
- Han, Z.; Walter, M.T.; Drinkwater, L.E. N2O emissions from grain cropping systems: A meta-analysis of the impacts of fertilizer-based and ecologically-based nutrient management strategies. Nutr. Cycl. Agroecosyst. 2017, 107, 335–355. [Google Scholar] [CrossRef]
- Abdalla, M.; Osborne, B.; Lanigan, G.; Forristal, D.; Williams, M.; Smith, P.; Jones, M.B. Conservation tillage systems: A review of its consequences for greenhouse gas emissions. Soil. Use Manag. 2013, 29, 199–209. [Google Scholar] [CrossRef]
- Tariq, A.; Menheere, N.; Gao, Y.; Brown, S.; Van Eerd, L.L.; Lauzon, J.D.; Bruun, S.; Wagner-Riddle, C. Increased N2O emissions by cover crops in a diverse crop rotation can be mediated with dual nitrification and urease inhibitors. Agric. Ecosyst. Environ. 2024, 374, 109178. [Google Scholar] [CrossRef]
- Adviento-Borbe, M.A.A.; Haddix, M.L.; Binder, D.L.; Walters, D.T.; Doberman, A. Soil greenhouse gas fluxes and global warming potential in four high-yielding maize systems. Glob. Change Biol. 2007, 13, 1972–1988. [Google Scholar] [CrossRef]
- Doberman, A.; Walters, D.T.; Adviento-Borbe, M.A.A. Global warming potential of high-yielding continuous corn and corn-soybean systems. Better. Crops 2007, 3, 16–19. [Google Scholar]
- Ventura, A. Conceptual issue of the dynamic GWP indicator and solution. Int. J. Life Cycle Assess. 2023, 28, 788–799. [Google Scholar] [CrossRef]


| Soil Property | Mean (SE) |
|---|---|
| Sand (%) | 46.8 (0.20) |
| Silt (%) | 44.2 (0.56) |
| Clay (%) | 9.0 (0.71) |
| Bulk density (g cm−3) | 1.26 (0.10) |
| pH | 6.2 (0.04) |
| Electrical conductivity (dS m−1) | 0.192 (0.01) |
| Extractable nutrients (kg ha−1) | |
| P | 118.4 (11.7) |
| K | 367.1 (52.6) |
| Ca | 2650 (193) |
| Mg | 429.1 (40.1) |
| S | 23.78 (3.6) |
| Na | 16.34 (1.2) |
| Fe | 448.7 (49.6) |
| Mn | 101.1 (12.3) |
| Zn | 2.77 (0.28) |
| Total N (Mg ha−1) | 5.75 (0.13) |
| Total C (Mg ha−1) | 20.55 (0.48) |
| Soil organic matter (Mg ha−1) | 38.25 (0.23) |
| C:N ratio | 10.0 (0.1) |
| Month | 30-Year Mean | 2024 Local | ||||||
|---|---|---|---|---|---|---|---|---|
| Rainfall (cm) | Air Temperature (°C) | Rainfall (cm) | Air Temperature (°C) | |||||
| Min | Max | Mean | Min | Max | Mean | |||
| May | 14.0 | 16.2 | 27.3 | 21.7 | 4.7 | 13.9 | 33.3 | 24.5 |
| June | 10.1 | 20.3 | 31.3 | 25.8 | 6.2 | 15.0 | 36.7 | 27.4 |
| July | 9.5 | 21.9 | 32.6 | 27.2 | 13.1 | 18.9 | 37.2 | 27.9 |
| August | 6.9 | 21.3 | 29.6 | 26.9 | 6.1 | 17.2 | 38.3 | 26.6 |
| Season total | 40.5 | - | - | - | 30.1 | - | - | - |
| Source of Variation | CO2 | CH4 | N2O | VWC | Soil T |
|---|---|---|---|---|---|
| p | |||||
| TRT | <0.01 | 0.04 | 0.01 | <0.01 | 0.07 |
| Date | <0.01 | 0.96 | <0.01 | <0.01 | <0.01 |
| Time | <0.01 | 0.99 | <0.01 | <0.01 | <0.01 |
| TRT × Date | 0.34 | <0.01 | 0.99 | <0.01 | 0.09 |
| TRT × Time | 0.04 | 0.99 | <0.01 | 0.75 | 0.02 |
| Date × Time | <0.01 | 0.11 | <0.01 | 0.99 | <0.01 |
| TRT × Date × Time | 0.12 | 0.59 | <0.01 | 0.99 | 0.99 |
| Response Variable | Model Parameter | Model Parameter Coefficient (Standard Error) | Model Parameter Coefficient p-Value | % Explanation of the Total Sum of Squares | Overall Model p-Value | Overall Model R2 | Adj. R2 † | RMSE † |
|---|---|---|---|---|---|---|---|---|
| CO2 | VWC *** | 0.88 (0.07) | <0.001 | 6.4 | <0.01 | 0.27 | 0.27 | 0.28 |
| Soil T *** | 0.03 (<0.01) | <0.001 | 23.6 | |||||
| Intercept | −0.48 (0.04) | - | - | |||||
| CH4 | VWC | 0.07 (0.02) | 0.058 | 0.2 | 0.09 | 0.01 | 0.01 | 0.14 |
| Soil T | <0.01 (<0.01) | 0.054 | 0.1 | |||||
| Intercept | −0.04 (0.02) | - | - | |||||
| N2O | VWC *** | 1.54 (0.11) | <0.001 | 9.1 | <0.01 | 0.10 | 0.10 | 0.45 |
| Soil T *** | 0.01 (<0.01) | <0.001 | 2.0 | |||||
| Intercept | −0.49 (0.07) | - | - |
| Parameter | Cover Crop | No Cover Crop |
|---|---|---|
| CO2 (Mg ha−1 season−1) | 15.50 a † | 11.94 b |
| CH4 (kg ha−1 season−1) | 0.30 a | −0.22 a |
| N2O (kg ha−1 season−1) | 7.28 a | 5.53 a |
| GWP (kg CO2 eq. ha−1 season−1) | 15,053 a | 12,888 a |
| GWP* (kg CO2 eq. ha−1 season−1) | 1936 a | 1460 a |
| Yield (Mg ha−1 season−1) | 11.7 a | 10.5 a |
| EI-CO2 [kg (Mg yield−1)] | 1.29 a | 0.99 a |
| EI-CH4 [kg (Mg yield−1)] | 0.03 a | −0.02 a |
| EI-N2O kg (Mg yield−1)] | 0.68 a | 0.47 a |
| EI-GWP [kg CO2 eq. (Mg yield−1)] | 1473 a | 1113 a |
| EI-GWP* [kg CO2 eq. (Mg yield−1)] | 181.8 a | 124.7 b |
Disclaimer/Publisher’s Note: The statements, opinions and data contained in all publications are solely those of the individual author(s) and contributor(s) and not of MDPI and/or the editor(s). MDPI and/or the editor(s) disclaim responsibility for any injury to people or property resulting from any ideas, methods, instructions or products referred to in the content. |
© 2025 by the authors. Licensee MDPI, Basel, Switzerland. This article is an open access article distributed under the terms and conditions of the Creative Commons Attribution (CC BY) license (https://creativecommons.org/licenses/by/4.0/).
Share and Cite
Della Lunga, D.; Brye, K.R.; Mulvaney, M.J.; Daniels, M.; de Oliveira, T.; Baker, B.; Bradford, T., Jr.; Arel, C.M. Cover Crop Effects on Greenhouse Gas Emissions and Global Warming Potential in Furrow-Irrigated Corn in the Lower Mississippi River Valley. Atmosphere 2025, 16, 498. https://doi.org/10.3390/atmos16050498
Della Lunga D, Brye KR, Mulvaney MJ, Daniels M, de Oliveira T, Baker B, Bradford T Jr., Arel CM. Cover Crop Effects on Greenhouse Gas Emissions and Global Warming Potential in Furrow-Irrigated Corn in the Lower Mississippi River Valley. Atmosphere. 2025; 16(5):498. https://doi.org/10.3390/atmos16050498
Chicago/Turabian StyleDella Lunga, Diego, Kristofor R. Brye, Michael J. Mulvaney, Mike Daniels, Tabata de Oliveira, Beth Baker, Timothy Bradford, Jr., and Chandler M. Arel. 2025. "Cover Crop Effects on Greenhouse Gas Emissions and Global Warming Potential in Furrow-Irrigated Corn in the Lower Mississippi River Valley" Atmosphere 16, no. 5: 498. https://doi.org/10.3390/atmos16050498
APA StyleDella Lunga, D., Brye, K. R., Mulvaney, M. J., Daniels, M., de Oliveira, T., Baker, B., Bradford, T., Jr., & Arel, C. M. (2025). Cover Crop Effects on Greenhouse Gas Emissions and Global Warming Potential in Furrow-Irrigated Corn in the Lower Mississippi River Valley. Atmosphere, 16(5), 498. https://doi.org/10.3390/atmos16050498