Article

Sizing Accuracy of Low-Cost Optical Particle Sensors Under Controlled Laboratory Conditions

by
Prakash Gautam
1,
Andrew Ramirez
1,2,
Salix Bair
1,2,
William Patrick Arnott
2,
Judith C. Chow
1,2,
John G. Watson
1,2,
Hans Moosmüller
1,2 and
Xiaoliang Wang
1,2,*
1
Division of Atmospheric Sciences, Desert Research Institute, Reno, NV 89512, USA
2
Atmospheric Sciences Program, University of Nevada, Reno, NV 89557, USA
*
Author to whom correspondence should be addressed.
Atmosphere 2025, 16(5), 502; https://doi.org/10.3390/atmos16050502 (registering DOI)
Submission received: 26 March 2025 / Revised: 20 April 2025 / Accepted: 23 April 2025 / Published: 26 April 2025
(This article belongs to the Section Aerosols)

Abstract

:
Low-cost particulate matter sensors have seen increased use for monitoring at personal and local levels due to their affordability, ease of operation, and high time resolution. However, the quality of data reported by these sensors can be questionable, and a thorough evaluation of their performance is necessary. This study evaluated the particle sizing accuracy of several commonly used optical sensors, including the Alphasense optical particle counter (OPC), TSI DustTrak DRX aerosol monitor, Plantower PMS5003 sensor, and Sensirion SPS30 sensor, using laboratory-generated monodisperse particles. The OPC and DRX agreed partially with reference instruments and showed promise in detecting coarse-size particles. However, the PMS5003 and SPS30 did not correctly size fine and coarse particles. Furthermore, their reported mass distributions do not directly correspond to their number distribution. Despite these limitations, field measurements involving a dust storm period showed that the SPS30 correlated reasonably well with reference instruments for both PM2.5 and PM10, though the regression slopes differed significantly. These findings underscore the need for caution when interpreting data from low-cost optical sensors, particularly for coarse particles. Recommendations for improving the performance of these sensors are also provided.

1. Introduction

Airborne particulate matter (PM) is ubiquitous in the Earth’s atmosphere, significantly impacting the climate, air pollution, weather, visibility, and human health [1,2,3]. Particle size is an important parameter that is related to the source, transport, transformation, removal, and impacts of particles. The U.S. Environmental Protection Agency (U.S. EPA) regulates particles with an aerodynamic diameter ≤ 2.5 µm (PM2.5) and 10 µm (PM10) as criteria pollutants [4,5]. Other size fractions, such as ultrafine particles (≤0.1 µm) and coarse particles (PM2.5–10; 2.5–10 µm), are also of interest.
The regulatory monitoring of PM2.5 and PM10 uses integrated filter sampling (typically over 24 h) and gravimetric analyses, or continuous measurements by the beta-attenuation, tapered element oscillating microbalance, or light-scattering techniques [6,7]. These monitors, which use federal reference or equivalent methods (FRM/FEM), are costly and require shelters and line power [8]. Most samplers are located in population centers with limited spatial and temporal coverage.
Portable low-cost air quality sensors are changing the air pollution monitoring paradigm [9]. Many of these sensors can provide high-time-resolution data in near real time. Their low-cost, easy-to-operate, and small-footprint features allow air quality professionals and citizen scientists to enhance personal and community-based fine spatial resolution monitoring. However, the sensor data quality has become an increasing concern for deriving meaningful information, as many sensors have been deployed before their performances have been characterized or understood [7,10,11].
Most low-cost PM sensors are based on light scattering to infer PM concentrations, with two common types being nephelometers (also called aerosol photometers) and optical particle counters (OPCs) [12,13]. Nephelometers measure the total light scattering by an ensemble of particles in the sensing volume (i.e., the portion of aerosol flow illuminated by the laser beam). While they can cover a wide range of PM concentrations, they commonly do not resolve particles sizes. Furthermore, because the particle mass scattering efficiency is higher for particles with a geometric diameter (Dg) close to the wavelength (λ) of the light source, nephelometers are more sensitive to particle diameters close to λ. The scattering per unit PM mass drops sharply with differences between the Dg and λ. For the red (~650 nm) lasers used in most sensors, coarse particle (≳5 λ) concentrations are often underestimated [14]. OPCs measure the light scattered by individual particles and convert these signals to an optical-equivalent diameter (Dopt) based on predefined calibration curves. The measured optical size distributions are then converted to mass distributions by assuming that particles are spherical with a known density [15]. OPCs can measure optical diameters from ~0.1 µm to ~10 µm. However, OPCs suffer from coincidence errors at higher concentrations when multiple particles enter the sensing volume [16]. In addition to the optical diameter and density, a particle’s refractive index, shape, and hygroscopicity affect the mass accuracy. Despite the limitations of relating light scattering to mass, Grimm, Palas, Teledyne, and Ambilabs have achieved FEM status for regulatory monitoring [8,17].
After appropriate calibration and relative humidity corrections, the PM1 or PM2.5 concentrations by low-cost sensors often correlate with reference instruments [18], while the PM10 correlations are lower, as evidenced during dust storms [19,20,21]. Because low-cost sensors do not discriminate particle sizes accurately, Molina Reuda et al. [22] caution their use for estimating the PM2.5–10 and PM10 levels.
Several factors could have led to the poor sizing accuracy of low-cost PM sensors. Sensirion [23] states that, since only a small fraction (3–5%) of the aerosol flow is illuminated by the laser beam, the SPS30 (Sensirion AG, Stäfa, Switzerland) counting statistics for coarse particles are too low to obtain accurate results. Instead of using directly measured data, the SPS30 PM4 and PM10 outputs are estimated from the smaller sizes (i.e., PM0.5, PM1, and PM2.5), assuming a typical size distribution. Similarly, Ouimette et al. [24] found that 99% of 10 µm particles would miss the laser focal point and be sized smaller than 10 µm by the Plantower PMS5003 sensor. Gravitational settling and impaction losses also lower the number of coarse particles that reach the sensing volume.
Few studies have directly measured the sizing accuracy of low-cost PM sensors. He et al. [25] sampled monodisperse 0.1, 0.3, 0.5, and 0.7 µm particles with the Plantower PM5003 sensor, but this limited calibration size range did not address the larger particles. Kuula et al. [26] used monodisperse particles with diameters of 0.55–8.4 µm to challenge six low-cost sensors, finding that none of them adhered to the detection ranges specified by manufacturers. Kaur and Kelly [27] evaluated the sizing accuracy of the OPC-N3 (Alphasense, Essex, United Kingdom), PMS5003 (Plantower Technology, Beijing, China), and PMS6003 (Plantower Technology, Beijing, China) sensors for particle diameters in the 2–10 µm range, but they did not address the <2 µm sizes that are important for PM1 and PM2.5.
This study evaluated the sizing accuracy of the Alphasense OPC-N3, Plantower PMS5003, and Sensirion SPS30 sensors that are common in low-cost PM monitors. Their outputs were compared with research-grade instruments: a DustTrak DRX (DRX; Model 8534; TSI Inc., Shoreview, MN, USA), an optical particle sizer (OPS; Model 3330; TSI Inc., Shoreview, MN, USA), and an Aerodynamic Particle Sizer (APS; Model 3321; TSI Inc., Shoreview, MN, USA). The calibration aerosols consisted of laboratory-generated monodisperse dioctyl sebacate (DOS) particles in the size range of 0.4–7 μm. This study aimed to assess the data quality of commonly used optical sensors under laboratory conditions and provide recommendations for improving the performance of these sensors. Additionally, data from a short period of ambient measurement using the SPS30 were analyzed to offer insights into its data-processing algorithms.

2. Materials and Methods

2.1. Evaluated Low-Cost Sensors and Research-Grade Instruments

Table 1 compares the characteristics and costs of the tested sensors. The OPC-N3 has a higher size resolution (24 channels) than the other low-cost PM sensors (typically ≤ 6 channels), and it uses an elliptical mirror and a dual-element photodetector. Mie theory with a purely real part of the refractive index of 1.5 and a particle density of 1.65 g cm−3 was used to convert the measured scattering intensities into particle sizes, which were further summed to PM1.0, PM2.5, and PM10 mass concentrations [27].
While the detailed PMS5003 or SPS30 signal-processing algorithms (i.e., nephelometry or OPC) are not published, Ouimette et al. [24] found that the PMS5003 counts individual pulses and classifies them into six size bins: >0.3, 0.5, 1.0, 2.5, 5.0, and 10 μm, from which PM1.0, PM2.5, and PM10 are calculated. The PMS5003 is widely used in low-cost PM monitoring systems, including the PurpleAir Air Quality Sensor (PurpleAir, Inc., Draper, Utah, USA) [28,29,30]. The SPS30 classifies particle numbers into five size ranges, 0.3–0.5, 0.3–1.0, 0.3–2.5, 0.3–4.0, and 0.3–10 µm, from which PM1.0, PM2.5, and PM10 are calculated.
The DRX is a research-grade instrument that combines optical particle counting with nephelometry in one device [12]. Single-particle counting for larger particles better represents supermicron particles, while nephelometry enables the DRX to measure submicron particles at high concentrations (up to 400 mg m−3) that would otherwise have high coincidence errors. The DRX reports PM mass concentrations calibrated with Arizona road dust (ARD) and permits custom calibrations when particles have different optical properties or densities from ARD. This instrument has been widely used as a reference for evaluating low-cost PM sensors, including the factory calibration of the SPS30 [23,31,32].
The TSI OPS 3330 is claimed to be in compliance with ISO 21501-1 [33] by the manufacturer [34]. Vasilatou et al. [35] found that a well-maintained OPS 3330 has high counting efficiencies (>85%) over the size range of 0.3–10 µm with a size resolution better than 15% (sizing uncertainty related to the specified particle size).
The TSI APS 3321 measures aerodynamic diameters based on time-of-flight [36,37]. This high-size-resolution aerodynamic diameter measurement has led to its widespread use as a reference instrument in calibrating aerosol inlets, classifiers, and sizers, including the evaluation of low-cost PM sensors [7,24,26,38].

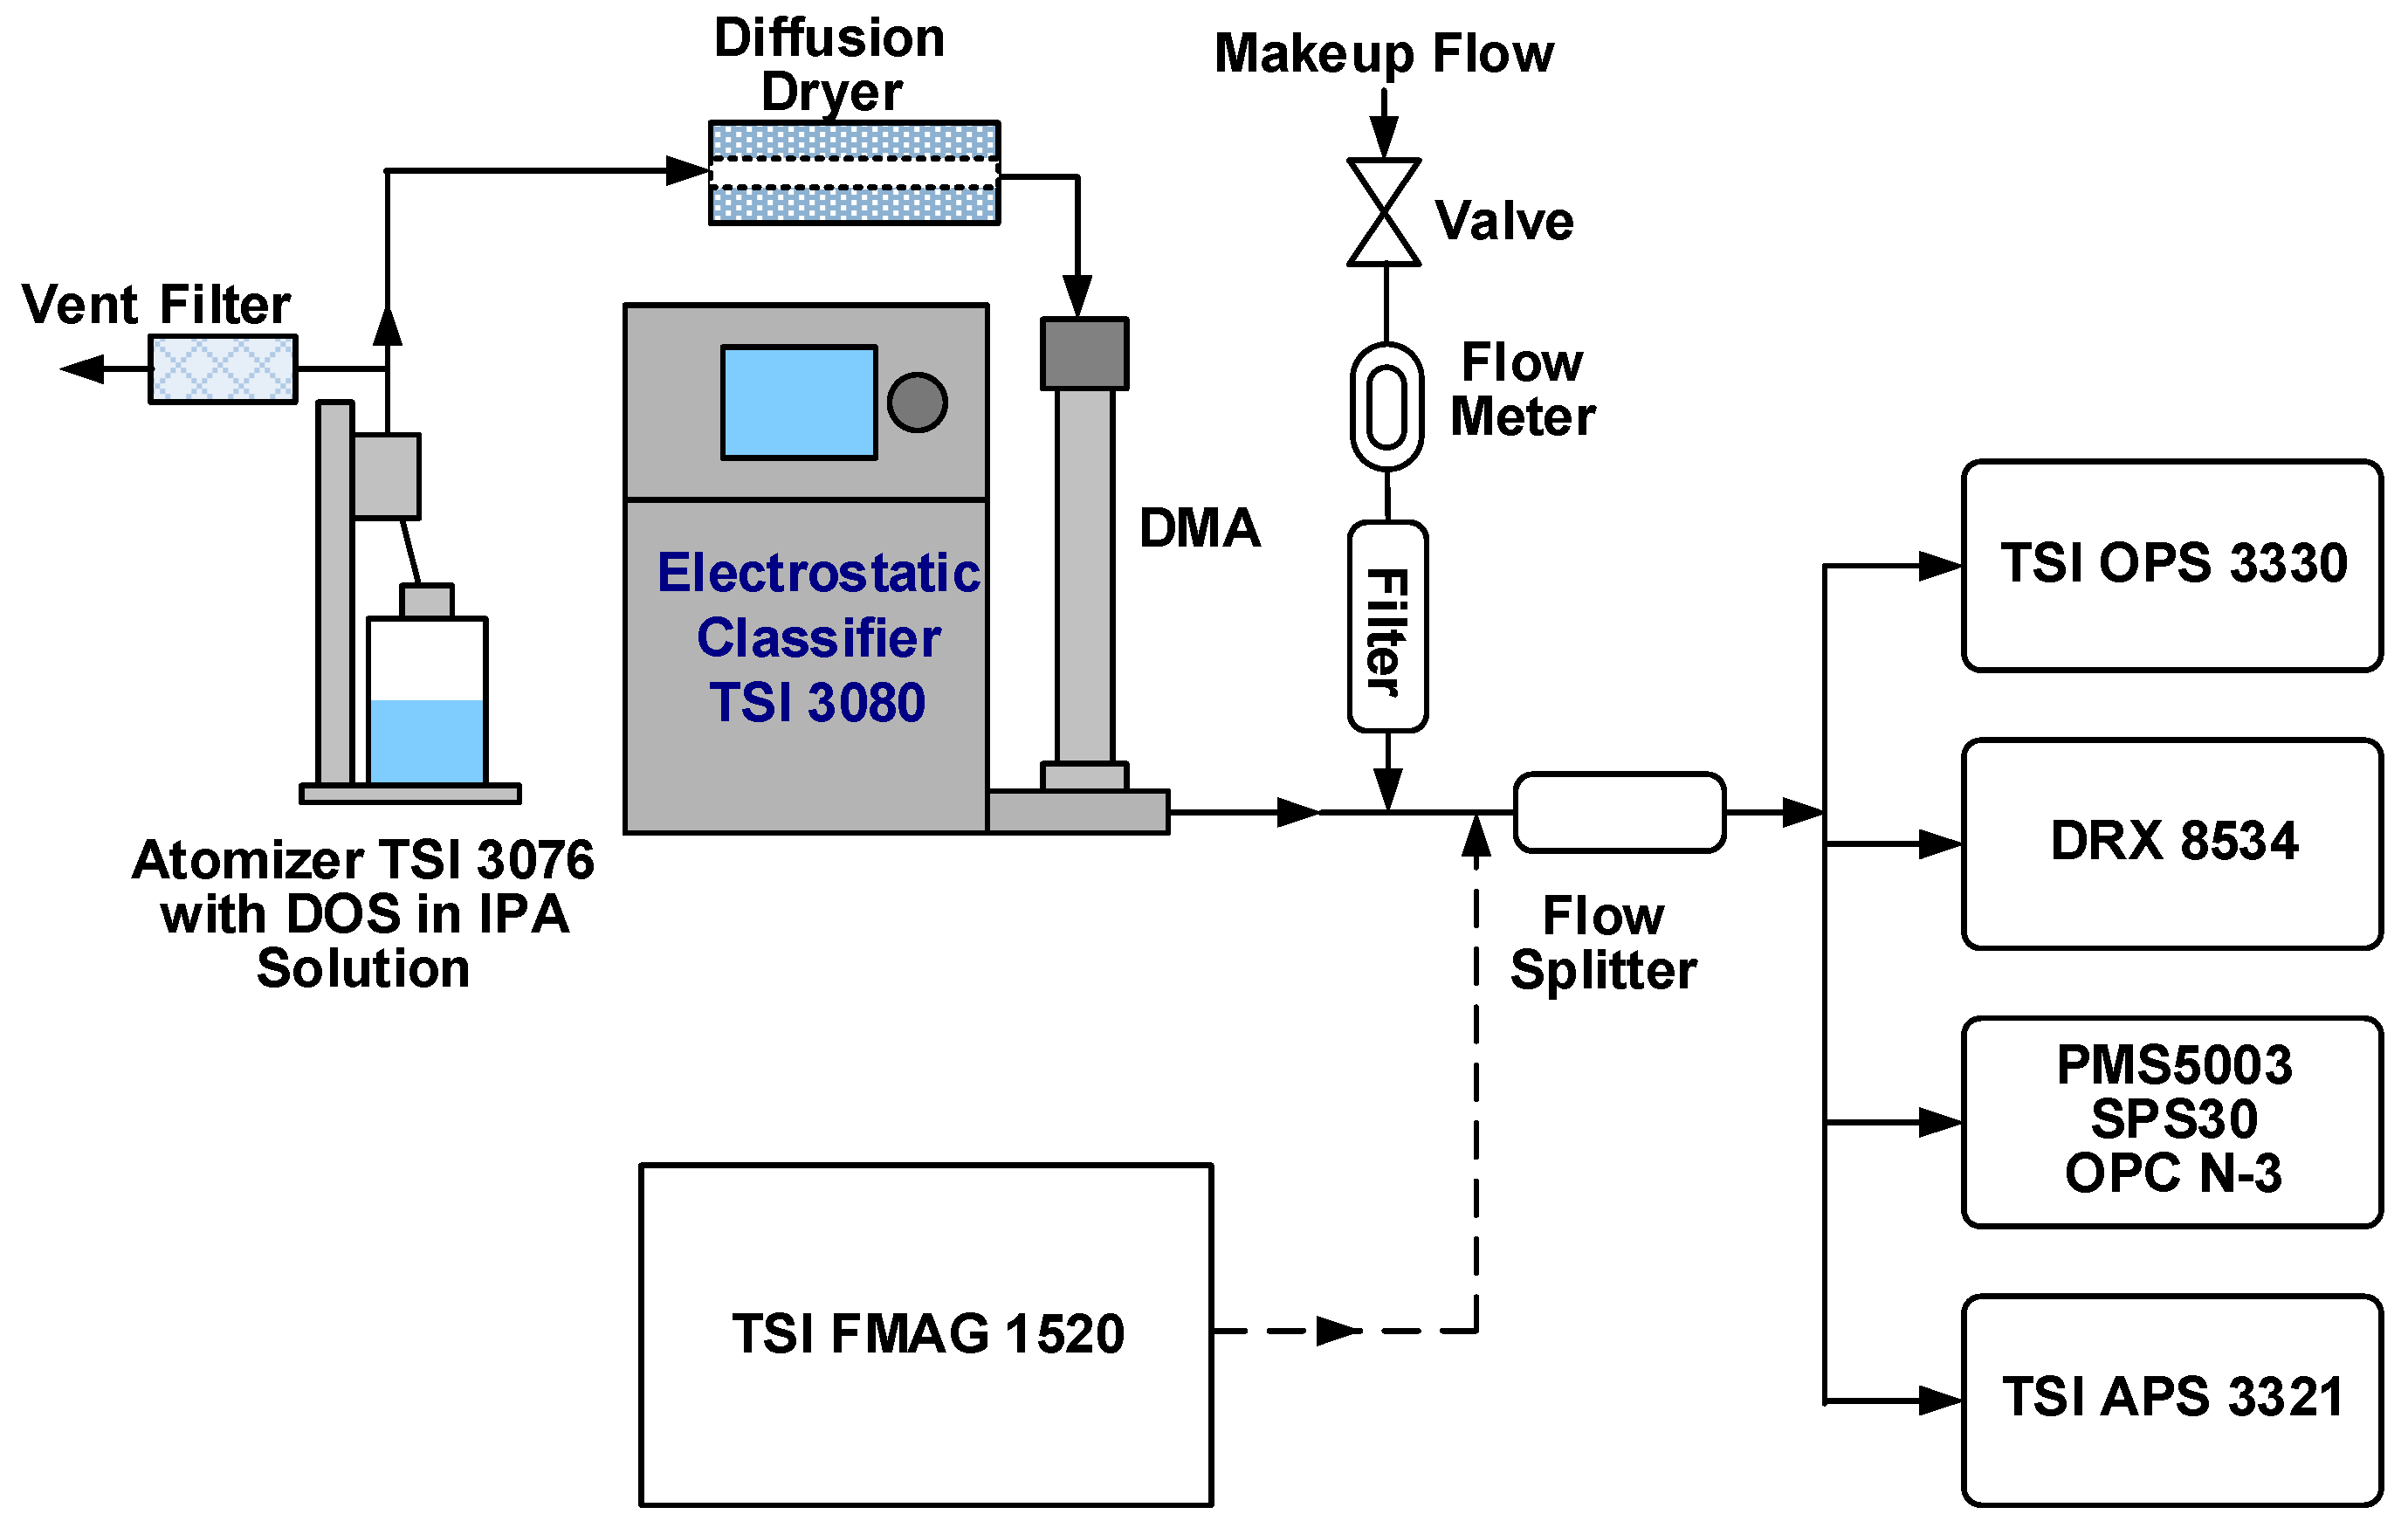
2.2. Experimental Setup

Figure 1 describes the experimental setup. DOS was selected as the test aerosol, as the particles are nearly spherical liquid droplets with a low evaporation rate for diameters > 0.2 µm [39,40]. DOS has a density of 0.91 g cm−3 at room temperature and a real refractive index of 1.45 at 589 nm. The DOS refractive index was input into the OPS data-processing software (TSI AIM Software v10.1) so that the geometric diameter (Dg), rather than the optical diameter (Dopt), was reported. Similarly, the aerodynamic diameter (Dae) reported by the APS was divided by 0.91 to convert to the Dg, assuming similar slip correction factors for the Dae and Dg [41]. Monodisperse test aerosols were generated by atomization followed by electrostatic classification for the 0.4–1 µm sizes. A flow-focusing monodisperse aerosol generator (FMAG 1520, TSI Inc., Shoreview, MN, USA) generated 1.5–7 μm size particles.
As shown in Figure 1, polydisperse DOS particles were generated with a constant output atomizer (Model 3076, TSI Inc.) using a 1% DOS solution (by volume, in isopropanol alcohol). The particles were dried with a diffusion dryer to remove isopropanol alcohol vapor. An electrostatic classifier (Model 3080, TSI Inc.) with a long differential mobility analyzer (DMA; Model 3081, TSI Inc.) selected the sizes of monodisperse particles for testing. The DMA voltage and sheath flow rate were adjusted to select the particle size, while the sheath-to-aerosol flow ratio was set to 10:1 to achieve a high DMA resolution [42]. Make-up flow was added downstream of the DMA monodisperse particle outlet to meet the flow requirement of the test instruments. It was recognized that some multiply charged particles with larger sizes co-exit the DMA. However, as the mode diameter of the polydisperse particles from the atomizer was <0.1 µm and all the selected monodisperse sizes were much larger than 0.1 µm, the contamination by multiply charged particles was low [43].
The FMAG can generate monodisperse aerosol particles [44]. The DOS solution (in isopropanol alcohol) passed through a 100 µm nozzle and formed a thin jet constrained by a focusing flow. A piezo-ceramic actuator applied a periodic mechanical perturbation to the liquid jet and broke the jet into monodisperse droplets. The droplets were then dried in an air-drying column and neutralized by an electrical neutralizer. Different sizes were generated by adjusting the DOS solution concentrations, liquid feed pressure and flow rate, and vibration frequency.
The low-cost sensors were enclosed inside an enclosure with slightly positive pressure caused by the feeding aerosol. A mixing fan homogenized the particles inside the chamber. Particle losses due to gravitational deposition and impaction, as well as non-uniform mixing, may cause differences in the concentrations measured by the test instruments. Therefore, this study focused on the particle sizing accuracy, while the accuracy of the concentration was not assessed.

3. Results

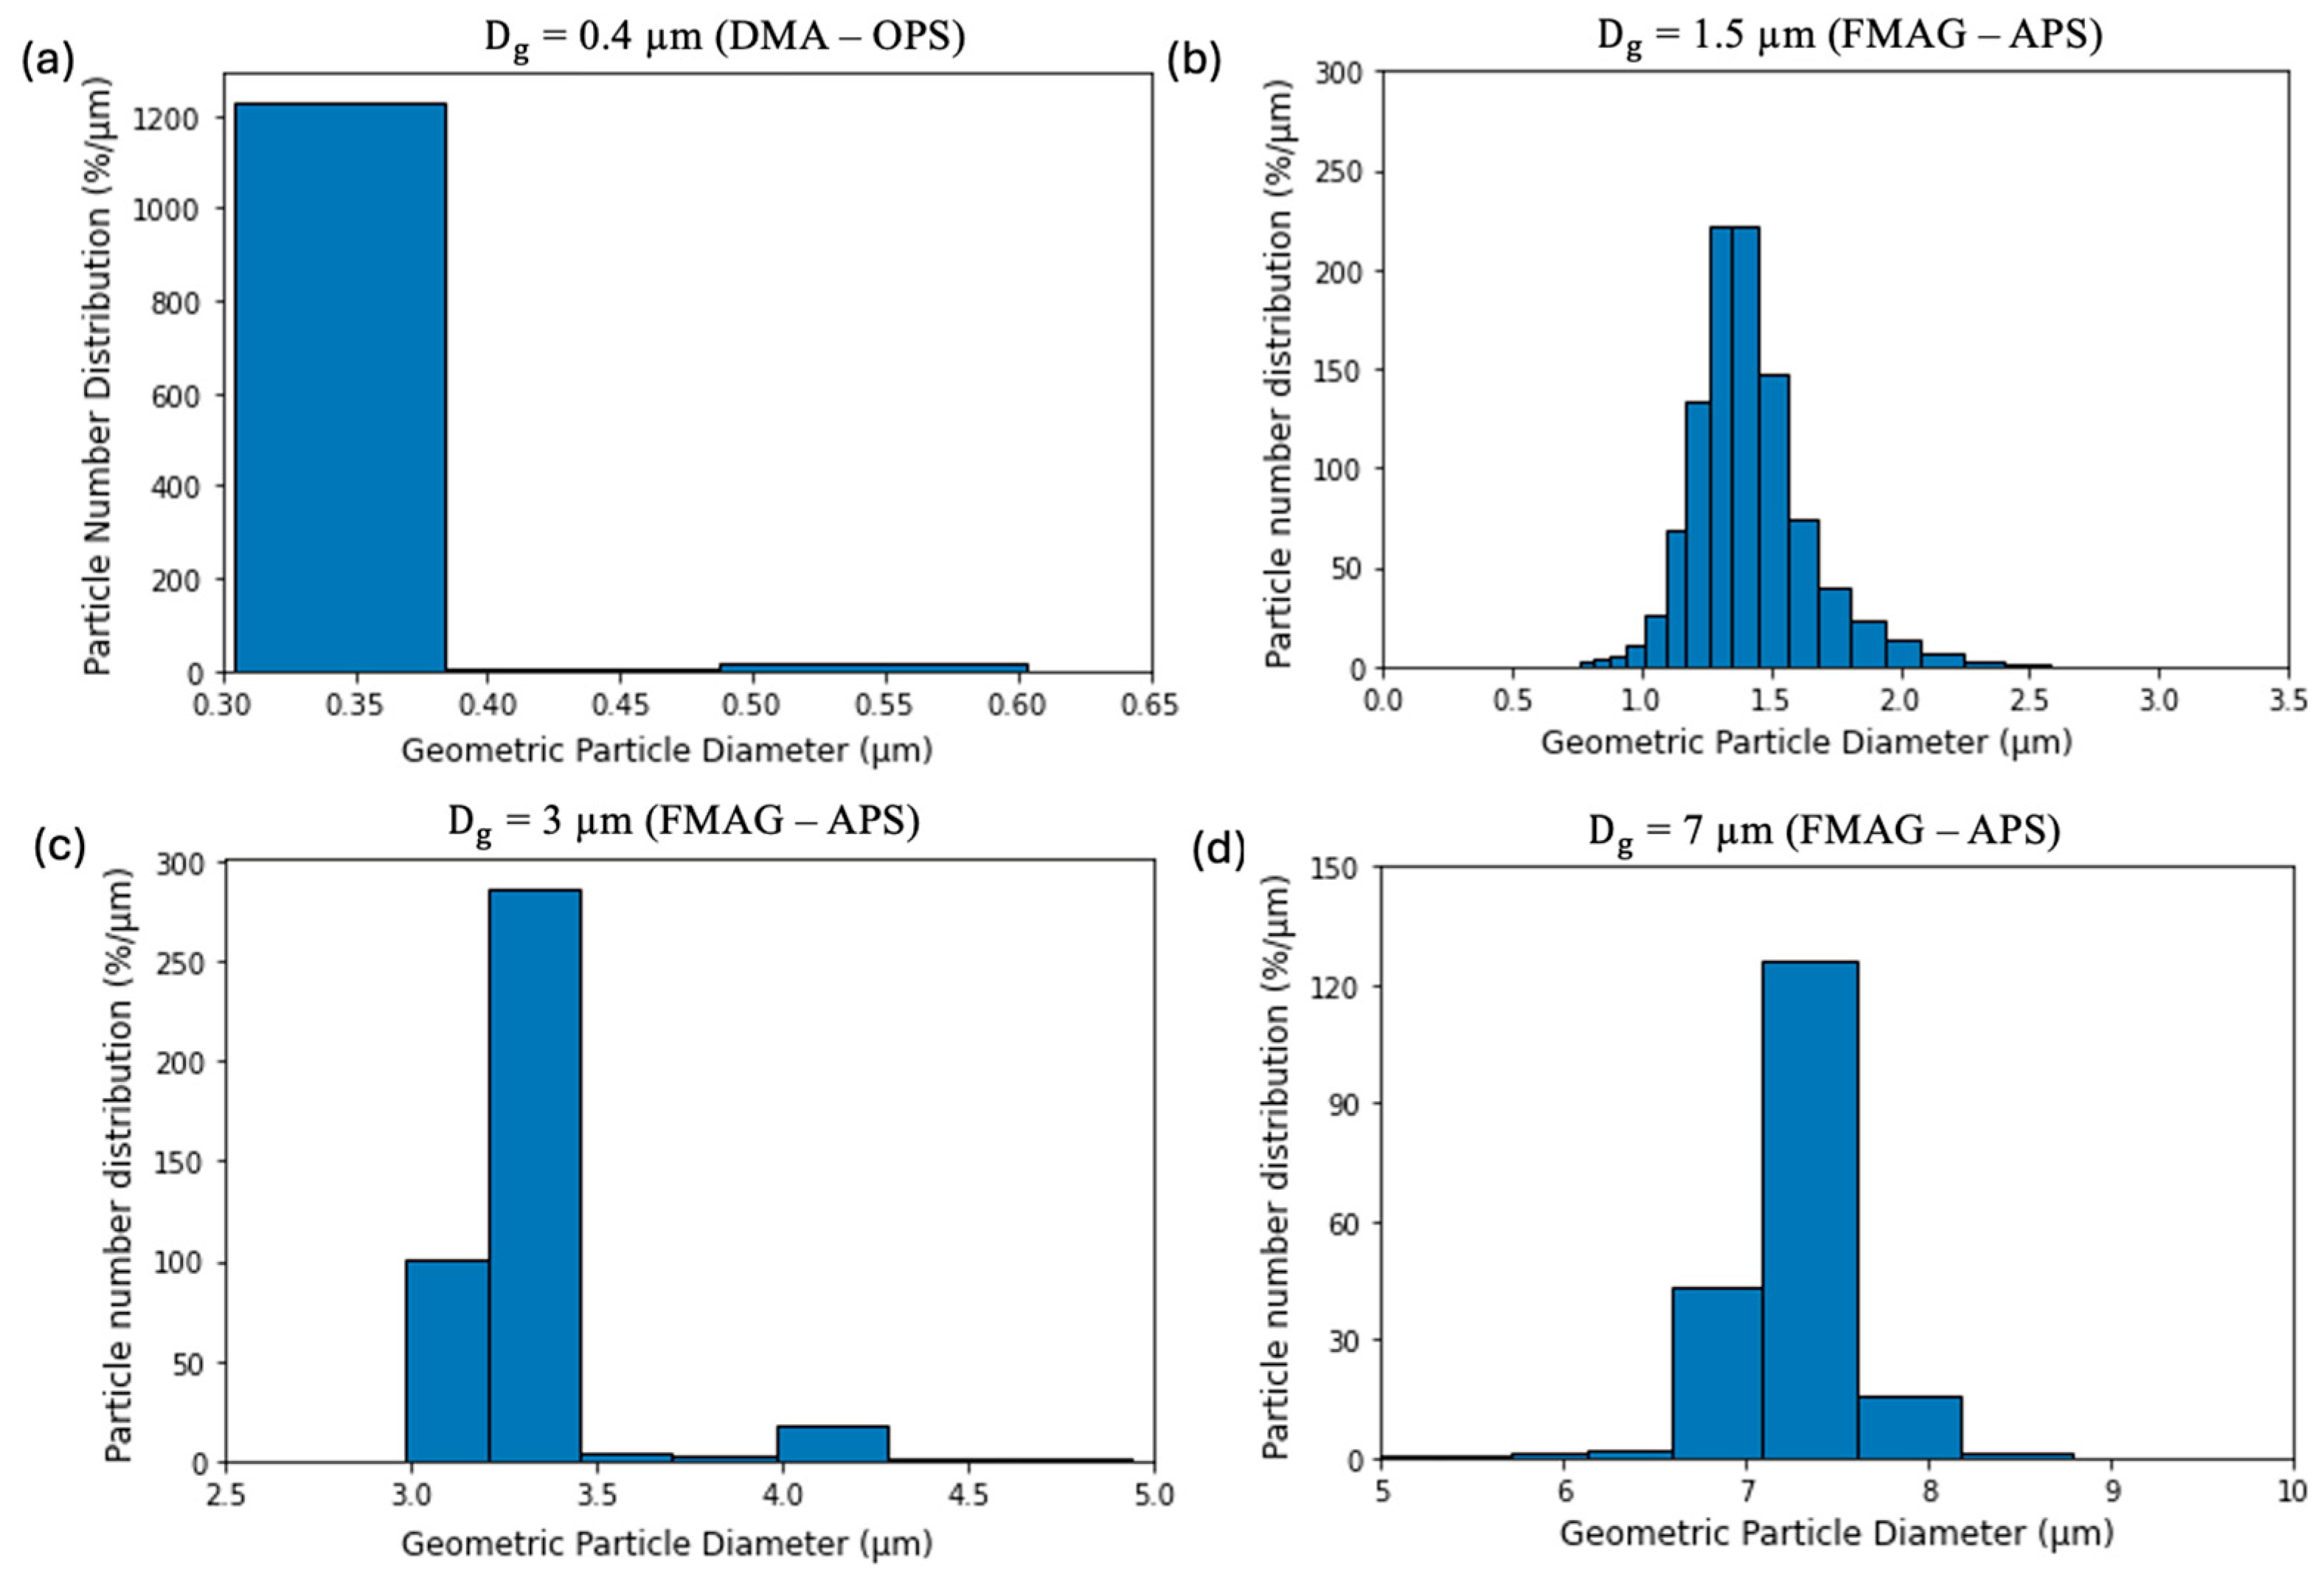
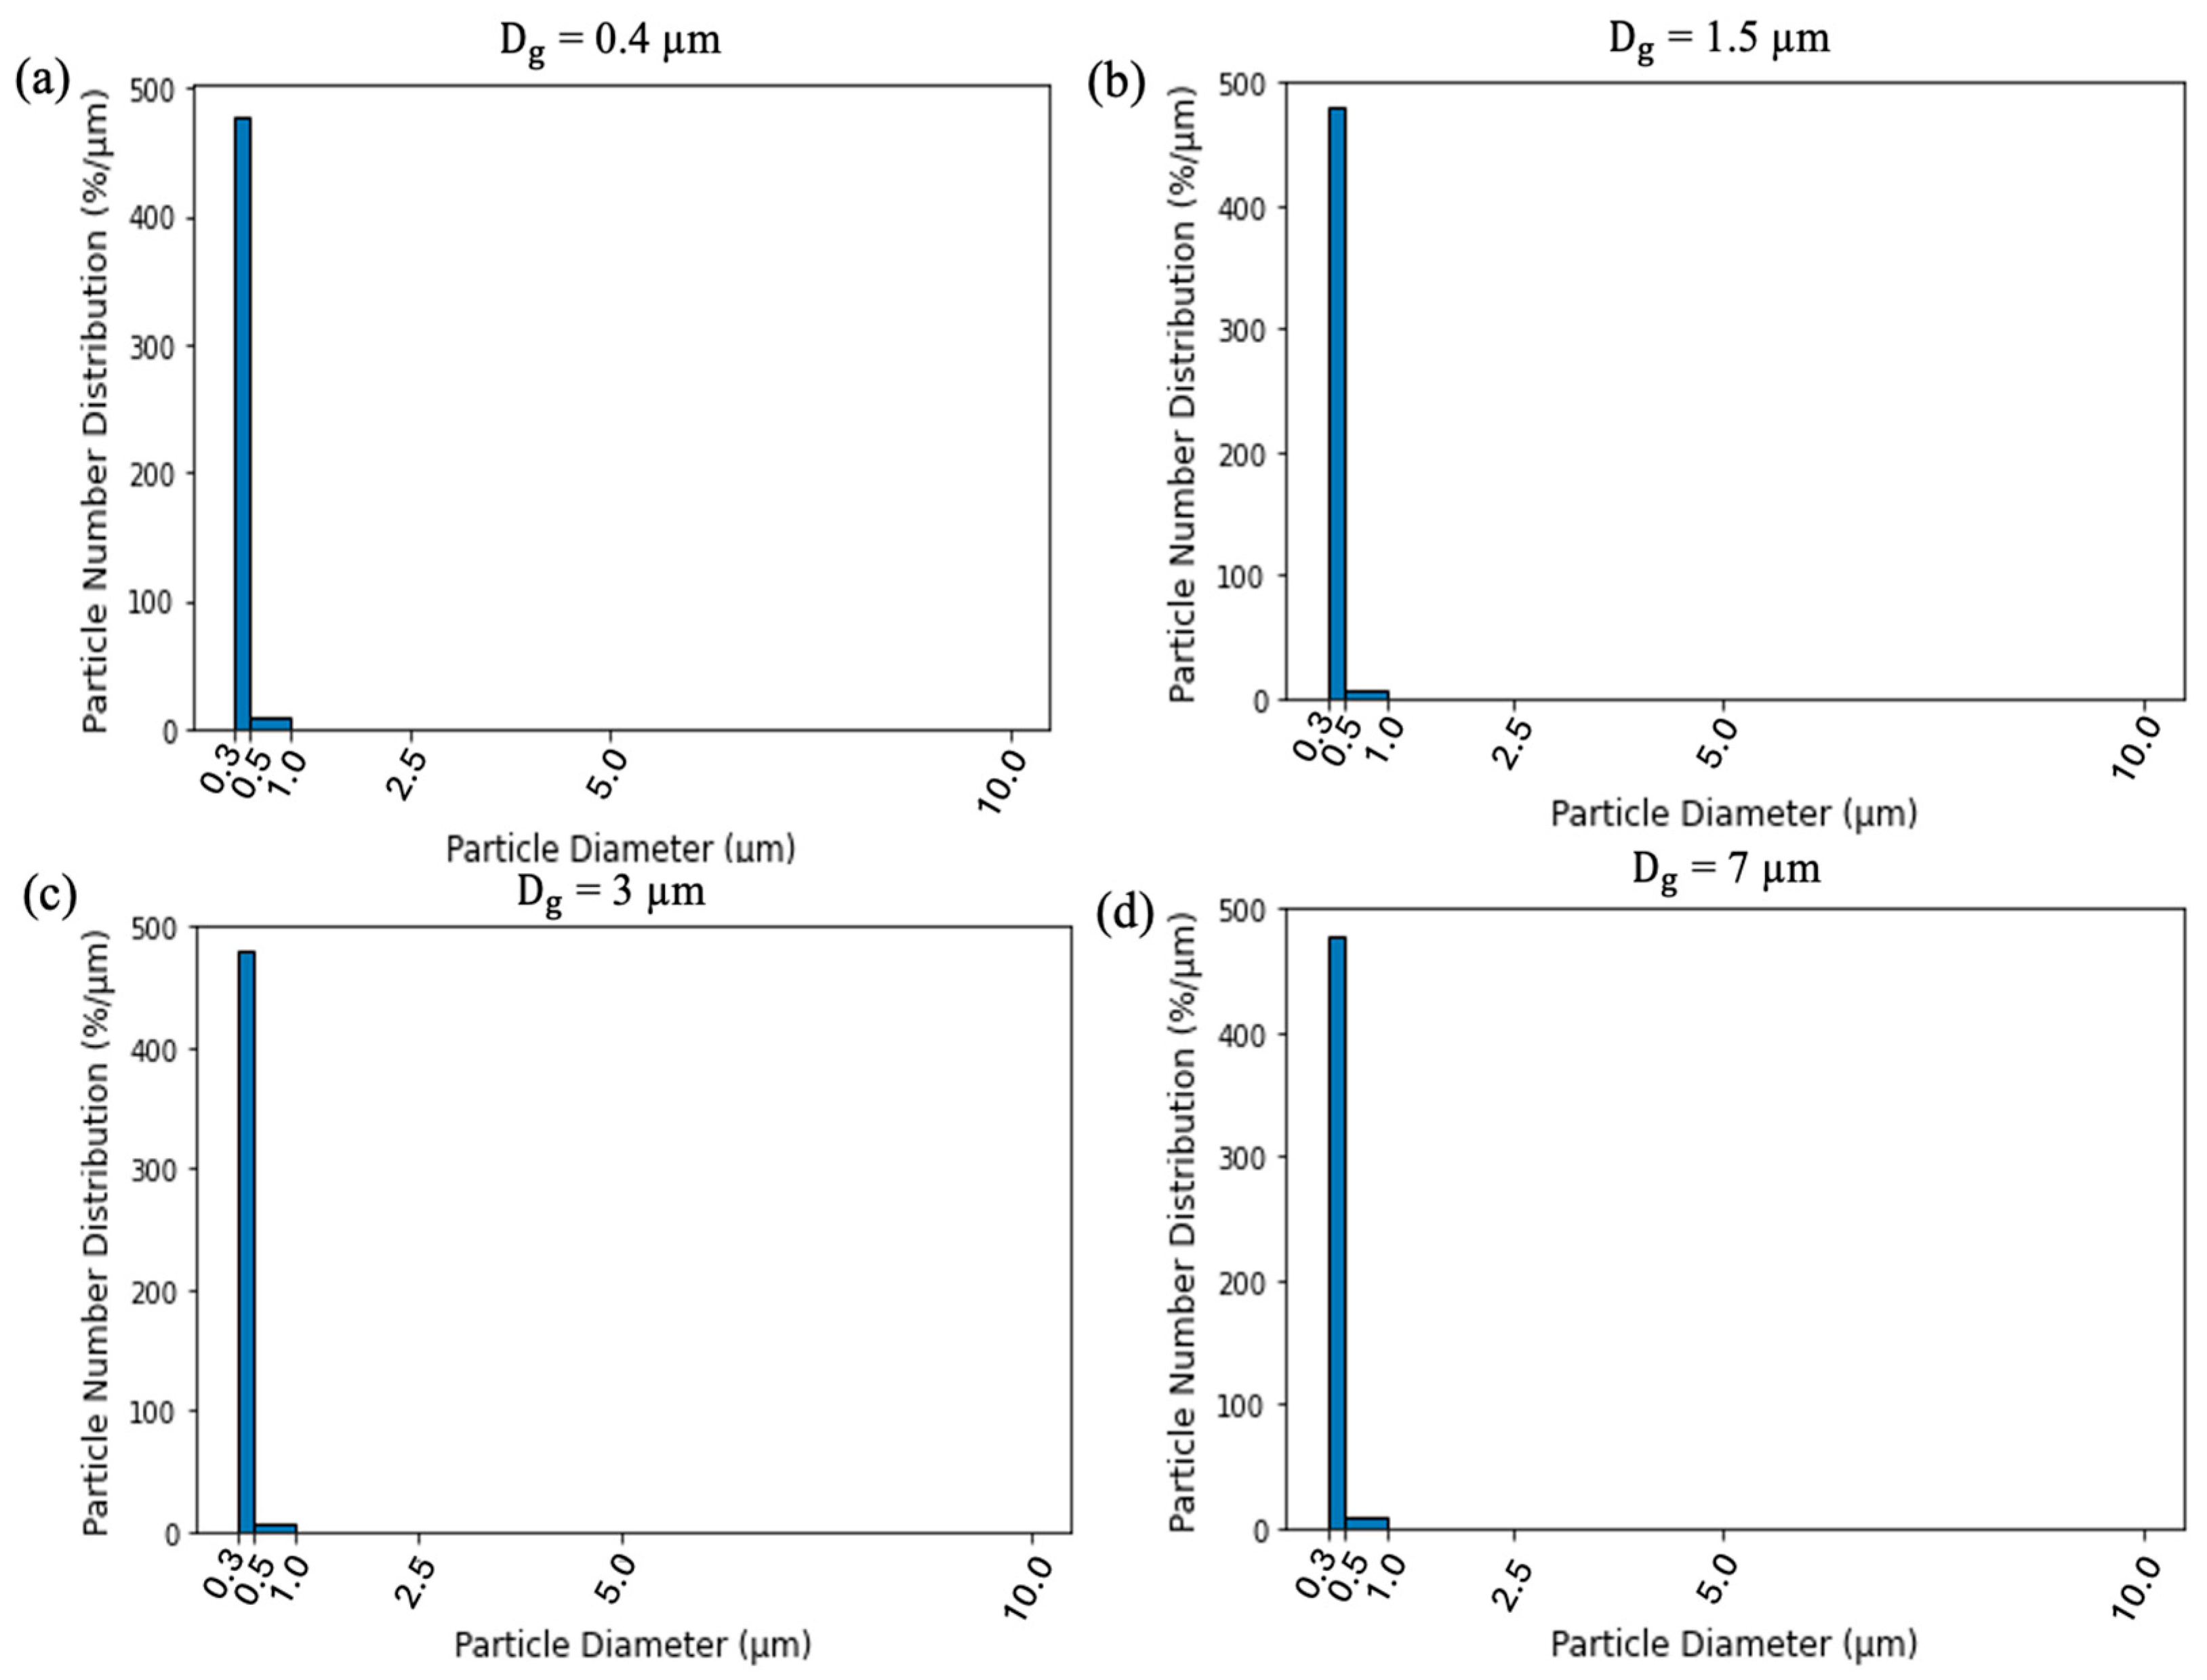
3.1. Monodisperse Particles Measured by Reference Instruments

The particle size and monodispersity were verified using OPS (Figure 2a) and APS (Figure 2b–d). The results are presented as the percentage of the total measured particle number or mass in each size bin, normalized by the width of the bin. The area of each histogram bar represents the percentage in that size bin. For 0.4 µm diameter particles, Figure 2a shows that most of the particles measured by the OPS were in the 0.305–0.384 µm size bin, with a geometric standard deviation (σg) of 1.16. For 1.5, 3, and 7 µm particles, Figure 2b–d show that the APS-measured mode diameters were close to the set diameters, with σg being 1.16, 1.27, and 1.24, respectively. Similar size accuracies were also observed for other results, as shown in Figure S1.

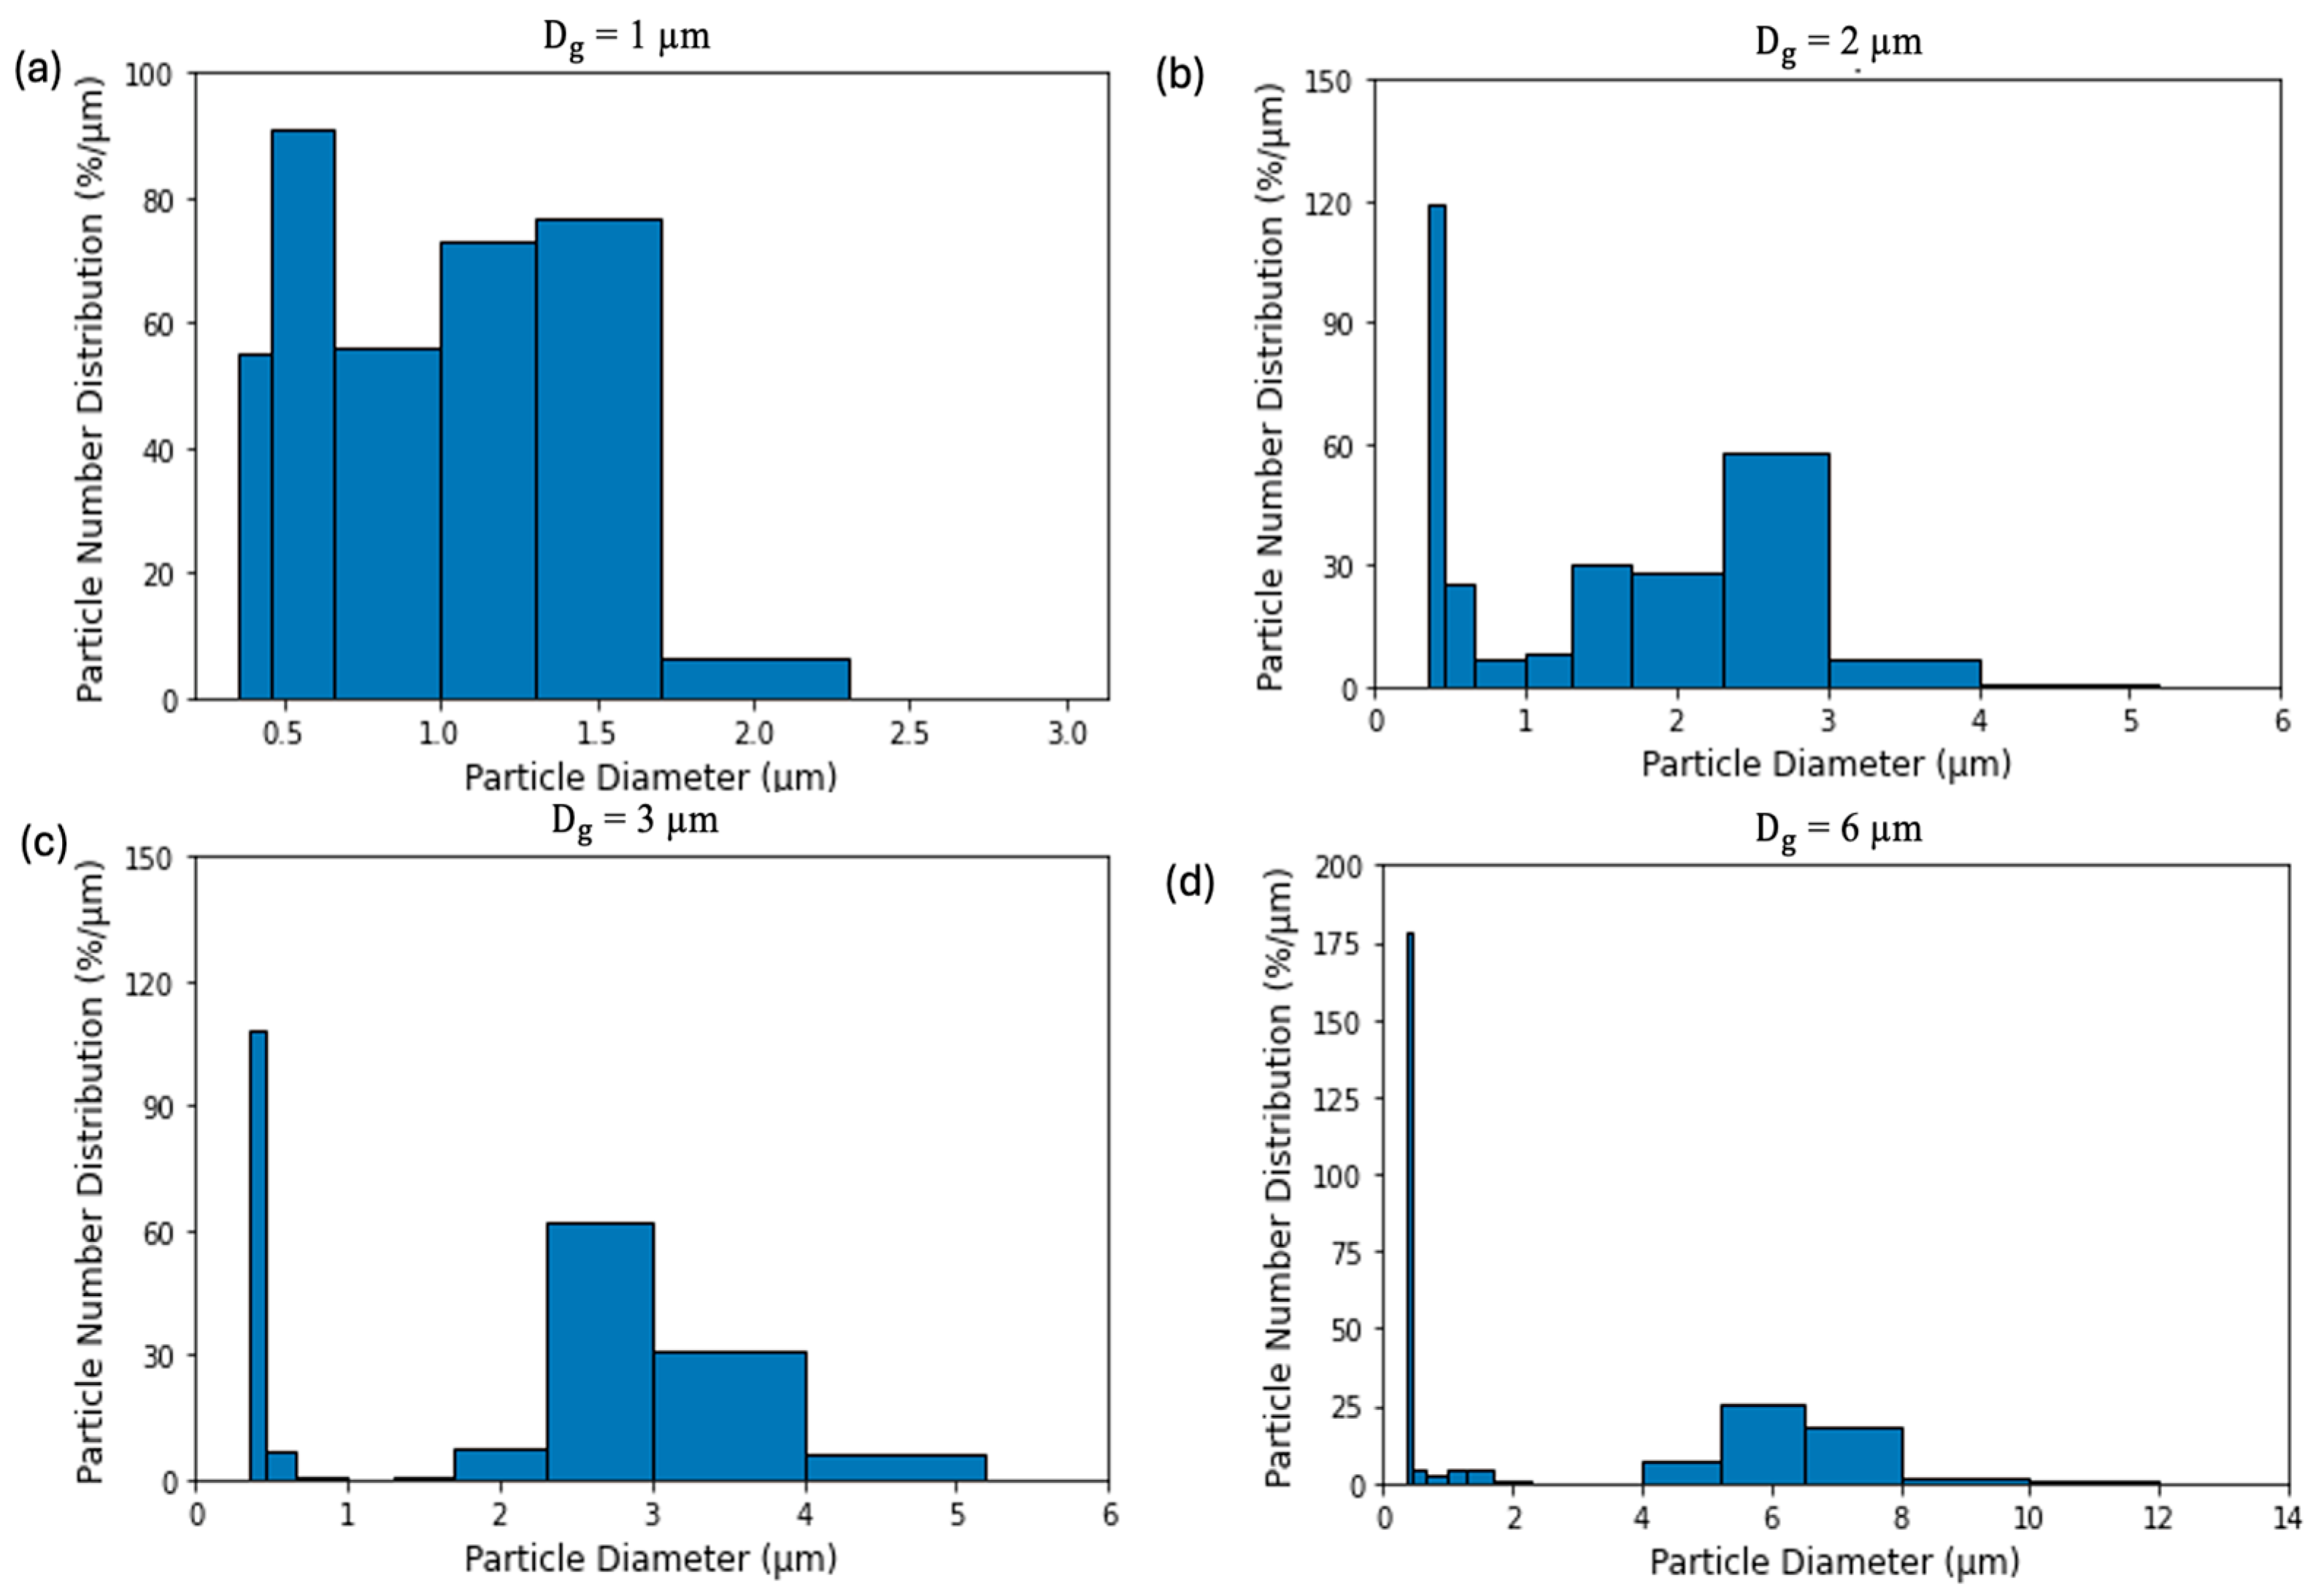
3.2. Sizing Accuracy of OPC-N3 and DRX

Figure 3 shows that the mode Dopt values measured by the OPC-N3 were close (differing by ≤ one size channel) to the set Dg values of 1, 2, 3, and 6 μm, indicating that the OPC-N3 can properly size particles, although the measured distributions were much wider than those quantified by the OPS or APS, as shown in Figure 2. The APS has a monotonic relationship between the aerodynamic diameter and time-of-flight, resulting in a finer size resolution. In contrast, the OPC-N3 scattering intensity vs. diameter response curve is not monotonic [13], resulting in lower size resolutions. Kaur and Kelly [27] also observed wider distributions for the OPC-N3 than for the APS. They showed that the OPC-N3 consistently reported a larger Dopt than the Dg by the APS, which was only observed for 1 and 2 µm particle diameters in this study. Some small particles were measured by the OPC-N3’s lower-size channels (~0.35–1 µm). These underestimated sizes were likely caused by particles not passing through the focused portion of the laser beam, generating smaller pulses, as the OPC-N3 does not have sheath air to confine particles to the laser focal point.
Figure 4 shows the mass distributions measured by the DRX for 0.4, 1.5, 3, and 7 μm DOS particles. The distributions for additional sizes are shown in Figure S2. Figure 4a shows that particles were detected predominantly in the <1 µm channel for Dg = 0.4 μm. For Dg = 1.5 µm, 94% of the particles were classified as <1 μm, with 6% in the 1–2.5 μm channel. Although the particle sizes reported by the DRX were smaller than those reported by the APS (Figure 2b), all the particles were within the <2.5 µm range. For Dg = 3 μm (Figure 4c), the DRX showed 61% mass concentration below 1 μm, with particles reported as large being in the 4–10 μm range. To enable very high-concentration (up to 400 mg/m3) measurements, the DRX estimated PM2.5 concentrations from nephelometry. Single particle counting was then used to calculate masses in the size bins of 1–2.5, 2.5–4, and 4–10 µm, which were subtracted from or added to the PM2.5 mass to obtain the PM1, PM4, and PM10 masses [12]. As particles larger than 2.5 µm would also contribute to the nephelometry signal, thereby generating a reading of PM2.5, an empirical algorithm was used to correct this artifact due to a compromise between high-concentration measurements and sizing accuracy. However, when this correction does not function perfectly, larger particles may cause readings in PM1 and/or PM2.5 channels. Additionally, 3 µm particles are close to the Mie oscillation size range of the DRX, leading to less accurate sizing [12]. For Dg = 7 μm, the highest mass concentration (75%) was correctly observed within the 4–10 μm size range. Again, 23% of the particle mass was reported as below 1 μm, due to an inaccurate correction of the contributions of 7 µm particles to the nephelometry signal.

3.3. Sizing Accuracy of PMS5003 and SPS30

Figure 5 and Figure 6 show the particle size distributions measured by the PMS5003 and SPS30 for Dg values of 0.4, 1.5, 3, and 7 μm. The distributions for additional sizes are shown in Figures S3 and S4. Figure 5 shows that the highest particle concentrations reported by the PMS5003 were always in the 0.3–0.5 µm channel, regardless of the test particle sizes. This was the case even for large particles (i.e., 3 and 7 μm), confirming that the PMS5003 does not correctly measure particle size. A similar performance was observed in laboratory evaluations [24,26,27,38] and field measurements [19,20,21,22]. Ouimette et al. [24] reasoned that most large particles would miss the laser focal point and be sized as smaller particles by the PMS5003 sensor. However, these low counting statistics cannot explain the fact that none of the 7 µm particles (Figure 5d) were sized correctly when monodisperse 7 µm particles were injected. It is likely that additional factors contribute to the inability of the PMS5003 sensor to correctly size particles. As the signal-processing and data-reporting algorithms are undisclosed [29], the exact cause could not be determined.
Sensirion [23] acknowledged that the SPS30 does not reasonably count coarse particles due to low counting statistics in the sensing volume, and therefore, the SPS30 estimates PM4 and PM10 from smaller sizes, assuming a typical size distribution. Figure 6 shows differences in the measured distributions for 0.4 and 1.5 µm particles; however, similar to the PMS5003, it assigned almost all 3 and 7 µm particles to the PM1 size range, with <1% particles between 1 and 2.5 µm.
These results show that the PMS5003 or SPS30 will generally underestimate coarse particle concentrations. Unless these sensors are calibrated with the aerosol to be measured and the aerosol properties (size distribution and density) are stable, the coarse particle concentration will not be measured accurately. Because coarse particles will be counted as smaller particles, the PM2.5 concentration will be overestimated. However, under typical ambient conditions, where fine particles are more numerous than coarse particles, this overestimation may be negligible, which allows these low-cost PM sensors to report PM2.5 concentrations that are reasonably correlated with reference instruments.

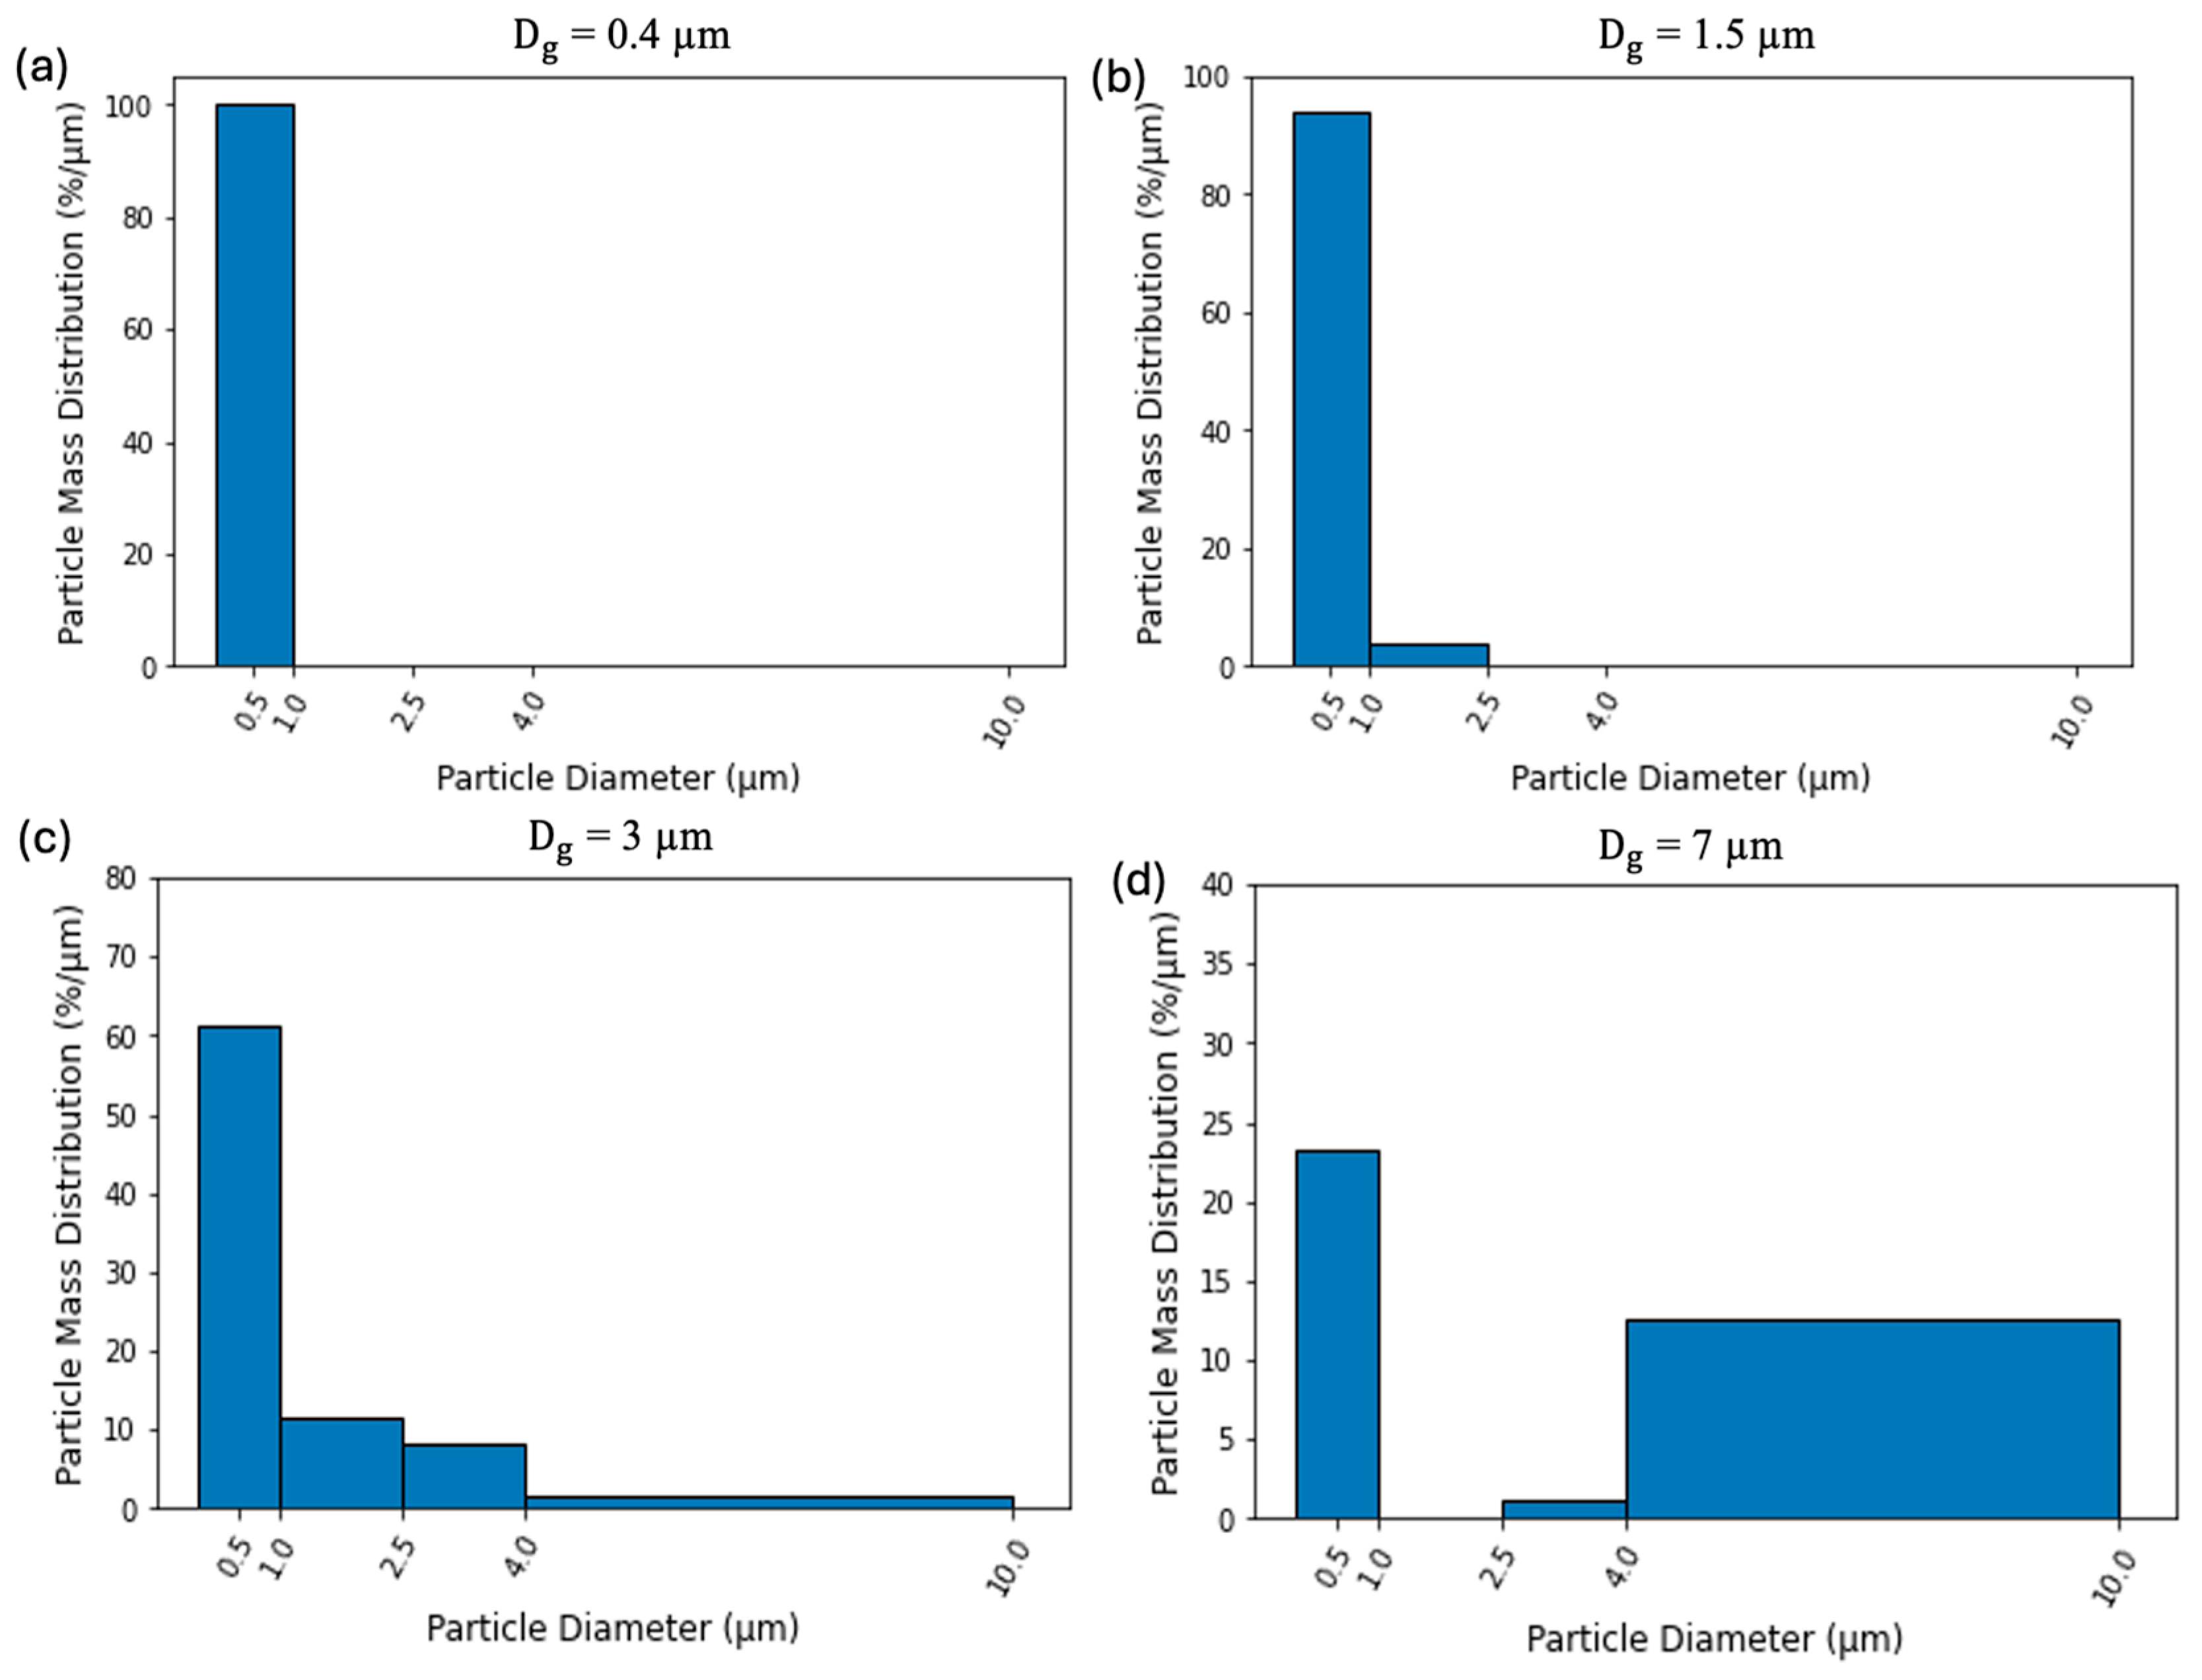
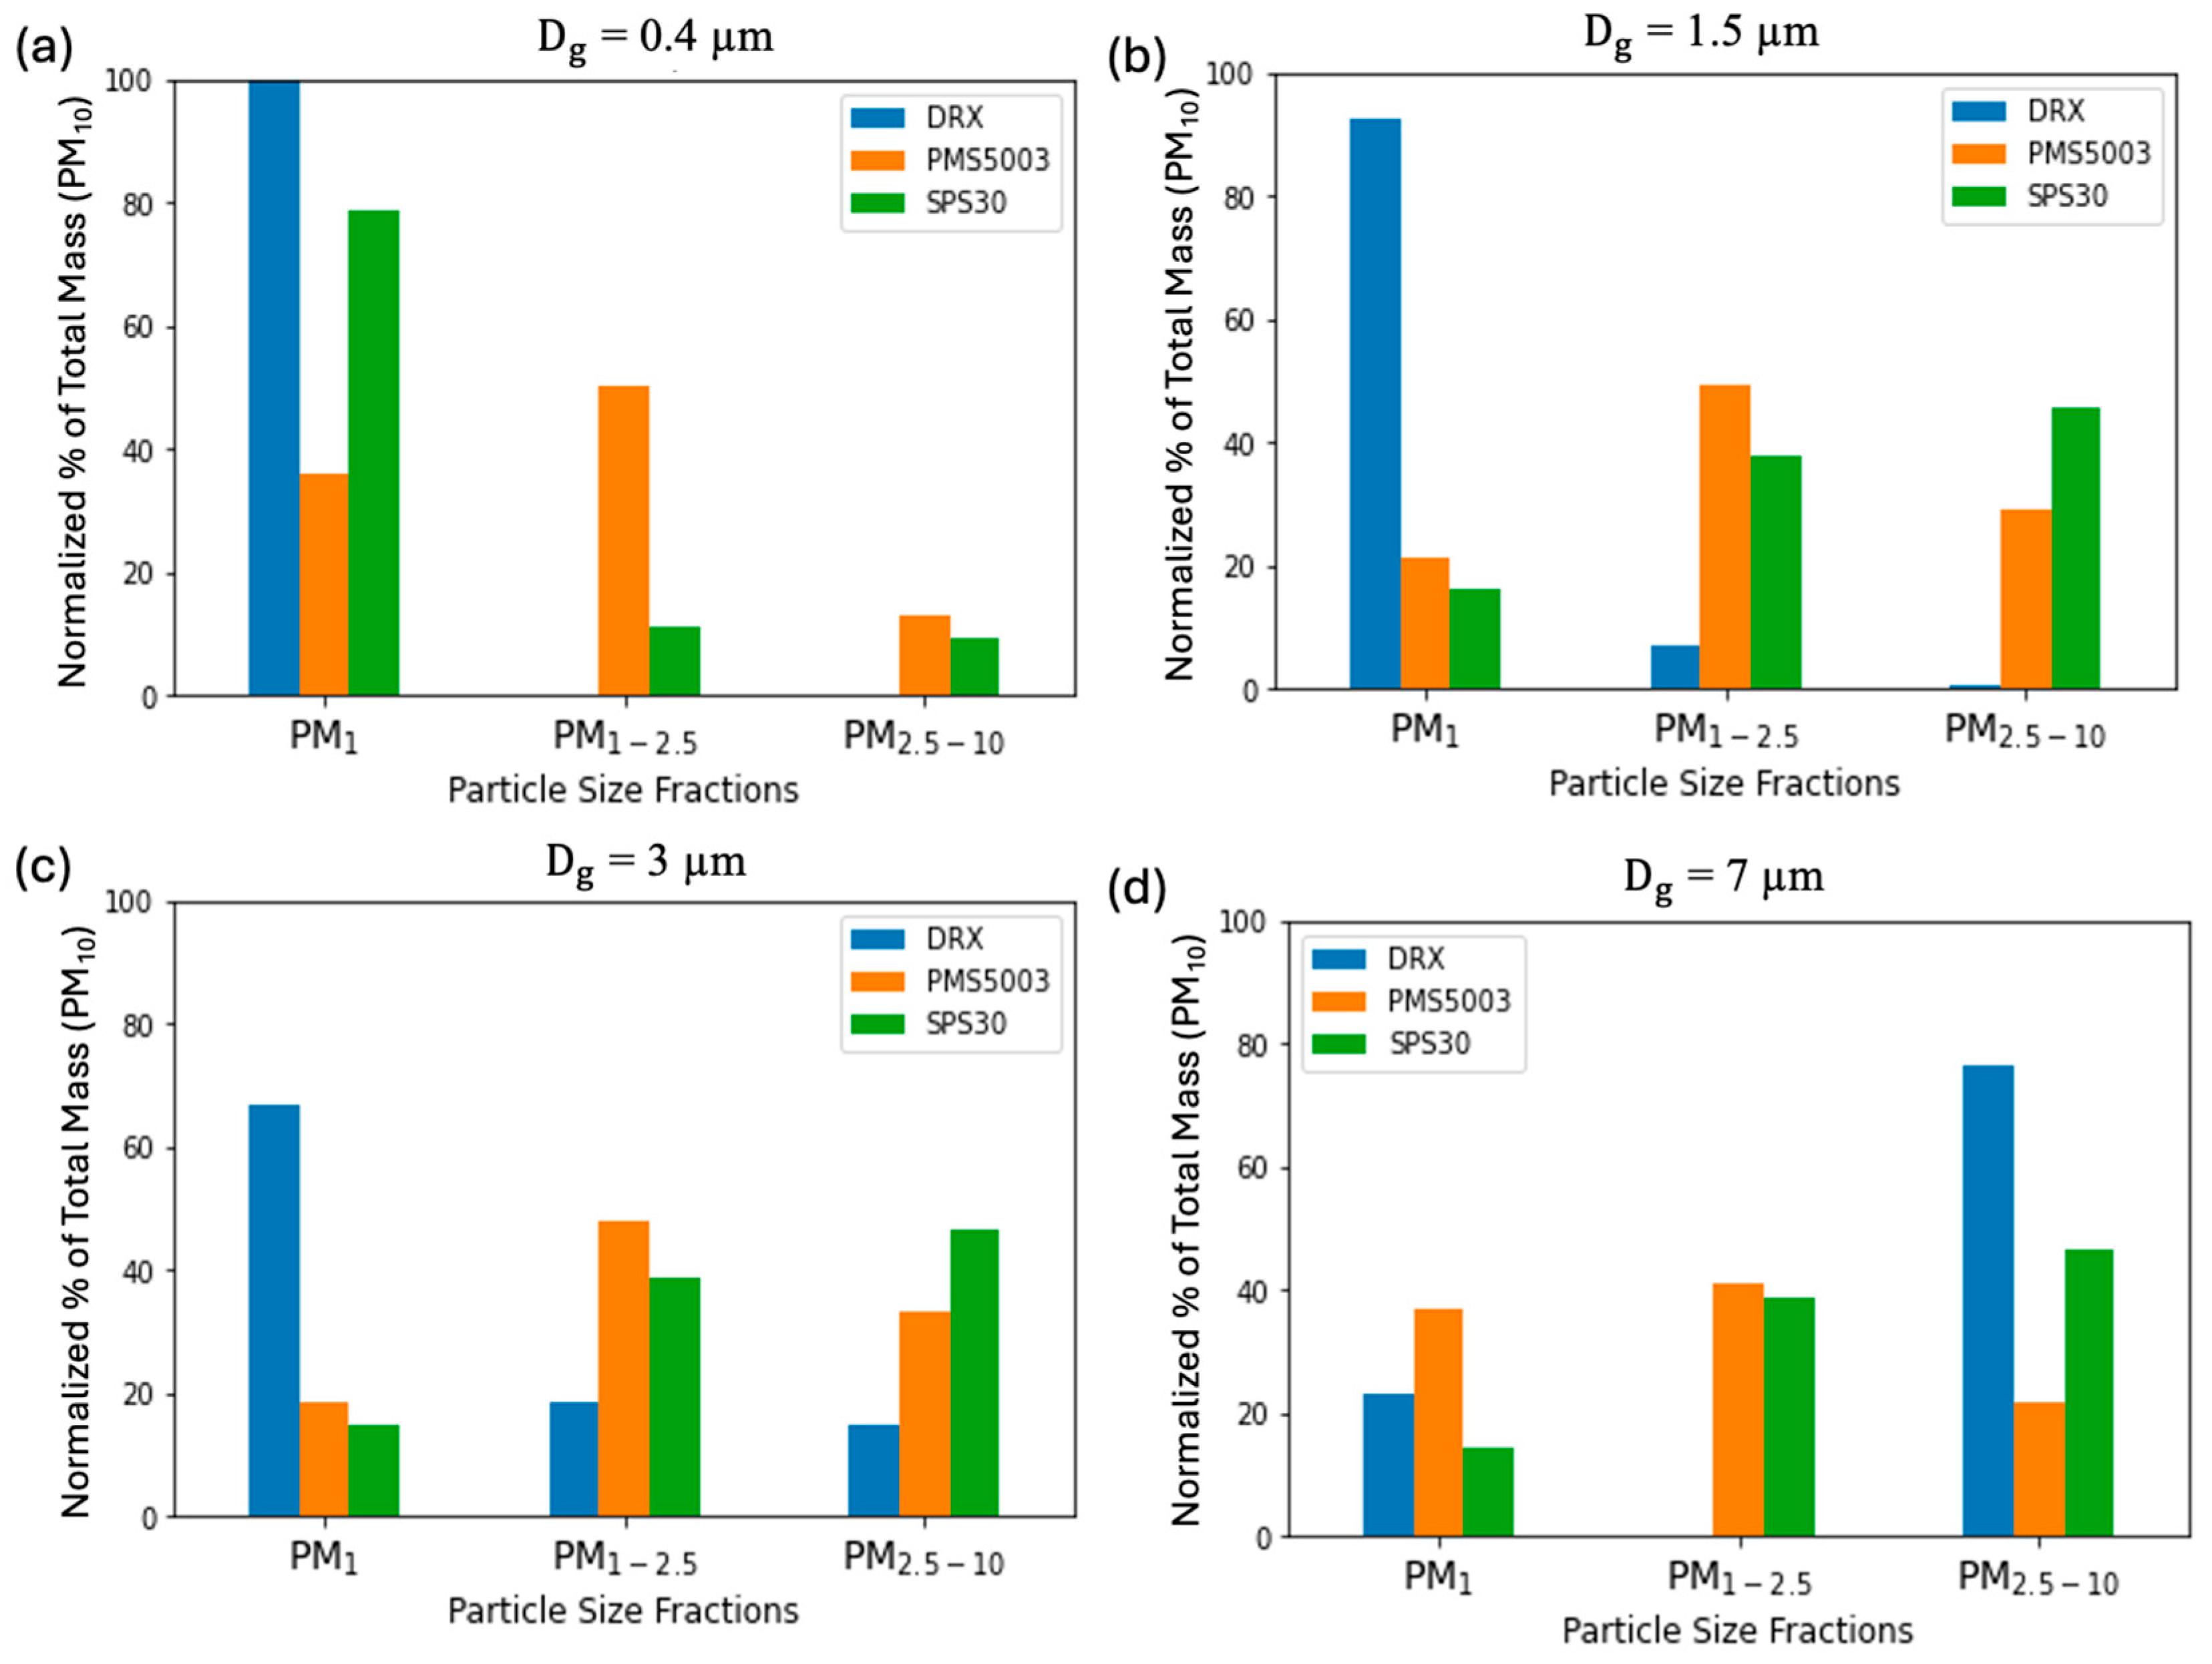
3.4. Mass Distribution of PM1, PM1–2.5, and PM2.5–10 Measured with SPS30, PMS5003, and DRX

As most current air quality standards for PM regulate mass concentrations, it is informative to compare the size-segregated mass concentrations reported by the sensors. Figure 7 shows the fraction of the PM10 mass (in percent) measured in PM1, PM1–2.5, and PM2.5–10 channels by the DRX, PMS5003, and SPS30 for particle Dg values of 0.4, 1.5, 3, and 7 μm. Data for additional diameters are shown in Figure S5. The DRX reported the highest PM1 mass concentrations for particle Dg values of 0.4, 1.5, and 3 μm. As the particle size increased, higher PM mass concentrations were observed in the PM1–2.5 and PM2.5–10 ranges. For a particle diameter of 7 μm, the DRX showed the highest (75%) mass concentration in the PM2.5–10 range, with 23% also observed in the PM1 range, but none in the PM1–2.5 range. This indicates that the PM1 by DRX may have artifacts from larger sizes.
Even though few particles were detected in the 2.5–10 µm size range by the PMS5003 (Figure 5), it still reported the mass across all size intervals, which did not agree with the volume distribution calculated from the number distribution, assuming the particles are spherical. The highest concentrations were observed in the PM1–2.5 range, regardless of the actual particle size. These observations indicate that the mass concentrations were not directly derived from particle counting and sizing.
The SPS30 measurements show that the particle mass was mainly detected in the PM1 range for Dg = 0.4 µm (and Dg = 0.6 µm, Figure S5), with smaller amounts in the PM1–2.5 and PM2.5–10 ranges. For larger diameters (Dg = 1.5, 3, and 7 µm), the particle mass was primarily observed in the following order: PM2.5–10 > PM1–2.5 > PM1.
Table 2 lists the PM2.5/PM1, PM10/PM2.5, and PM10/PM1 mass ratios reported by the PMS5003 and SPS30 for monodisperse particles. For smaller particles (Dg = 0.4 and 0.6 µm), the expected PM2.5/PM1.0 and PM10/PM1 should be close to 1 because all particles are in the PM1 size fraction. This was the case for the SPS30, while the PMS5003 had ratios > 2. The ratios were significantly greater for Dg ≥ 1 μm than those for the submicron particles, and the ratios remained similar regardless of the actual particle size. These observations further indicate that some of the PM mass fractions may be estimated from measured values for other PM size fractions rather than from direct measurements of the larger particles.

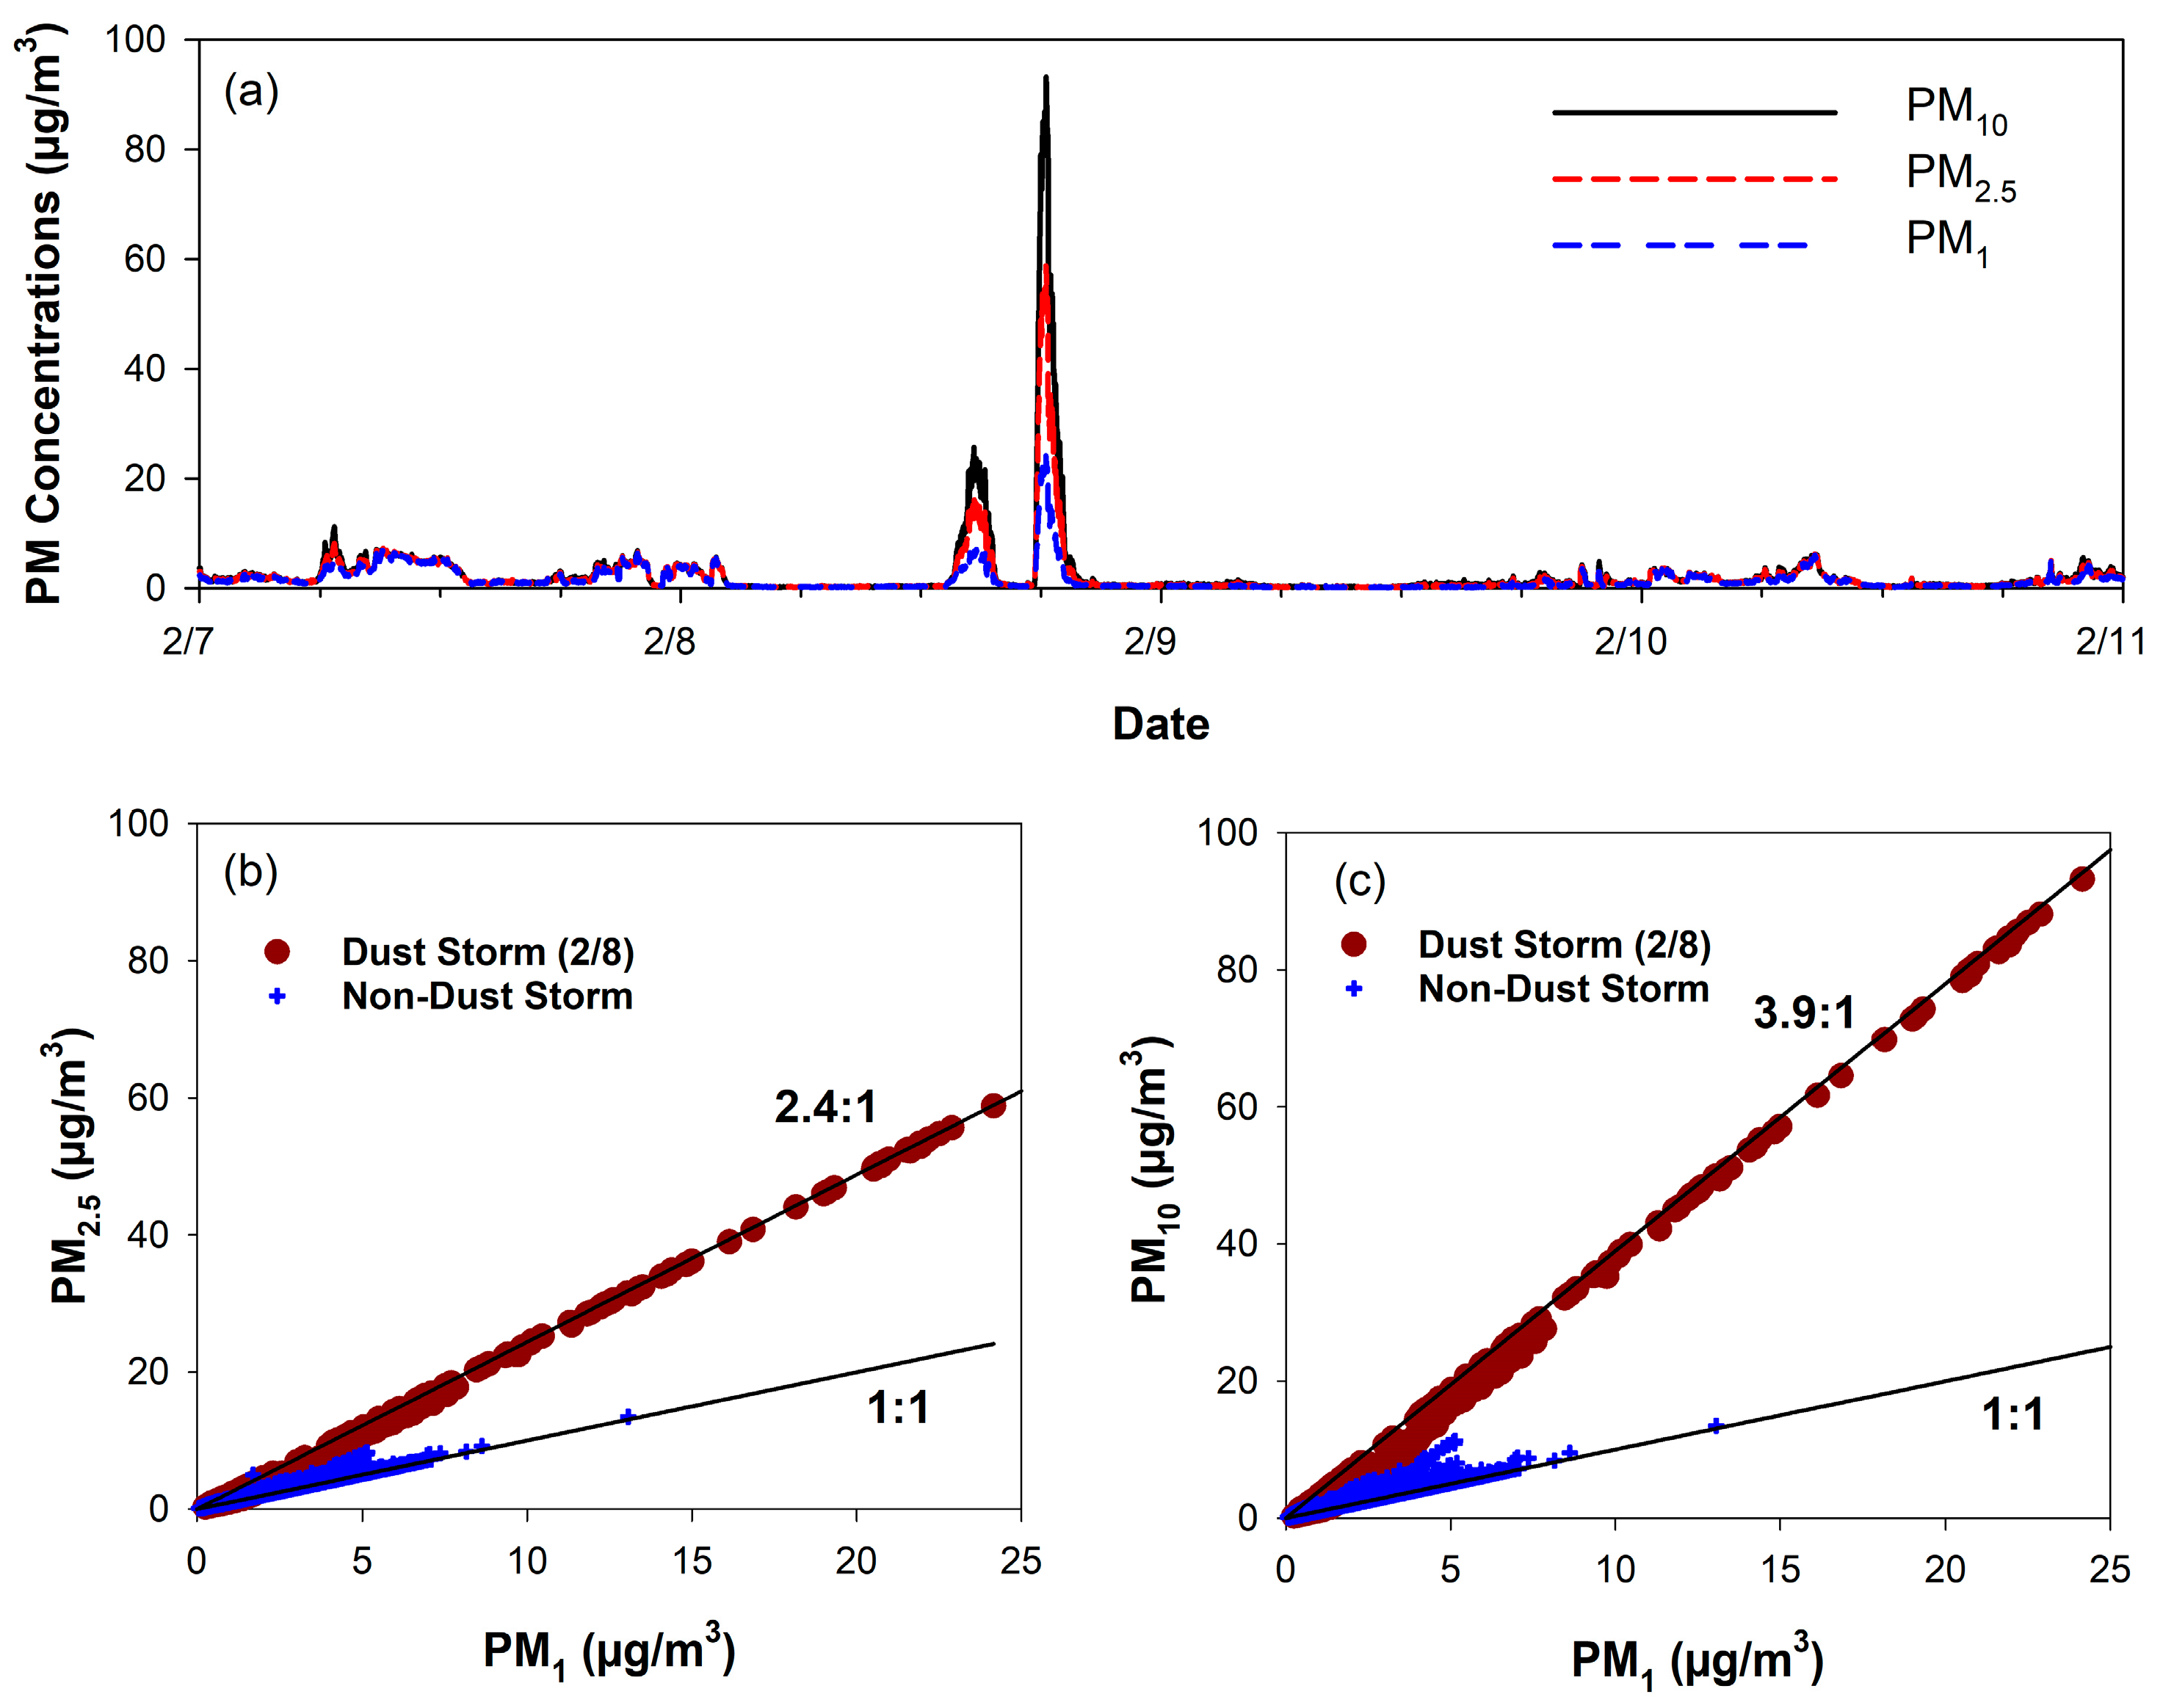
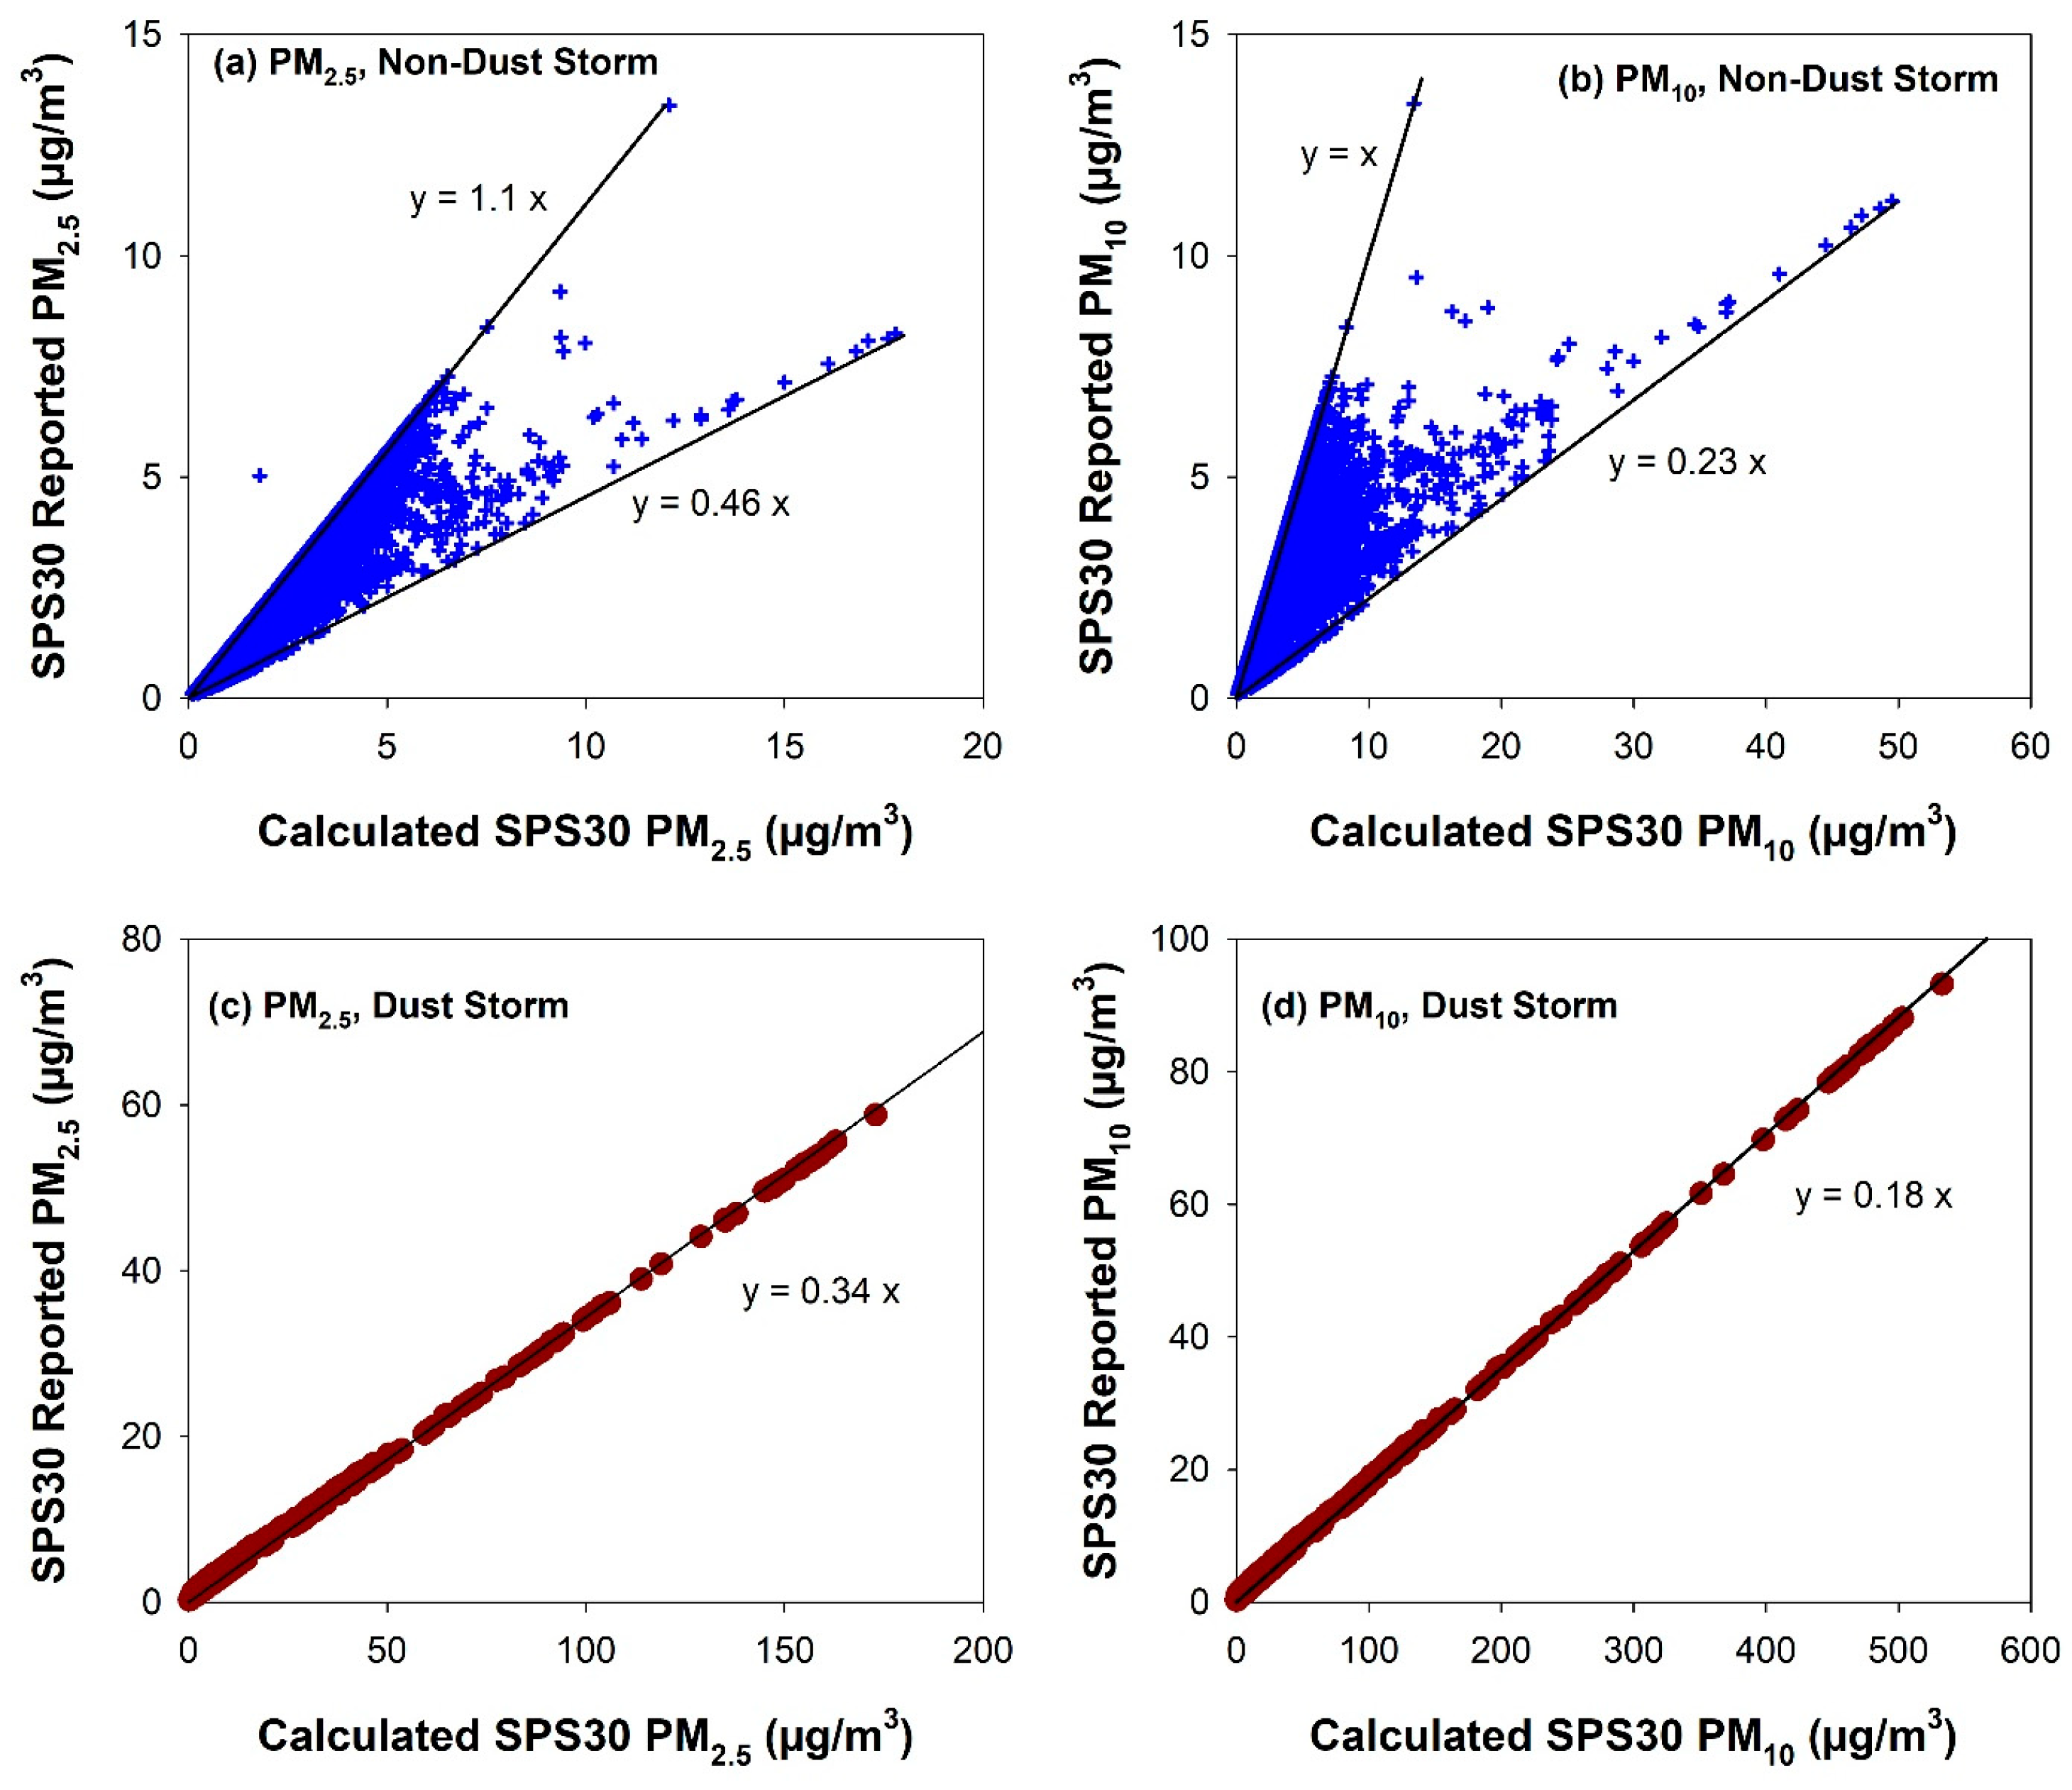
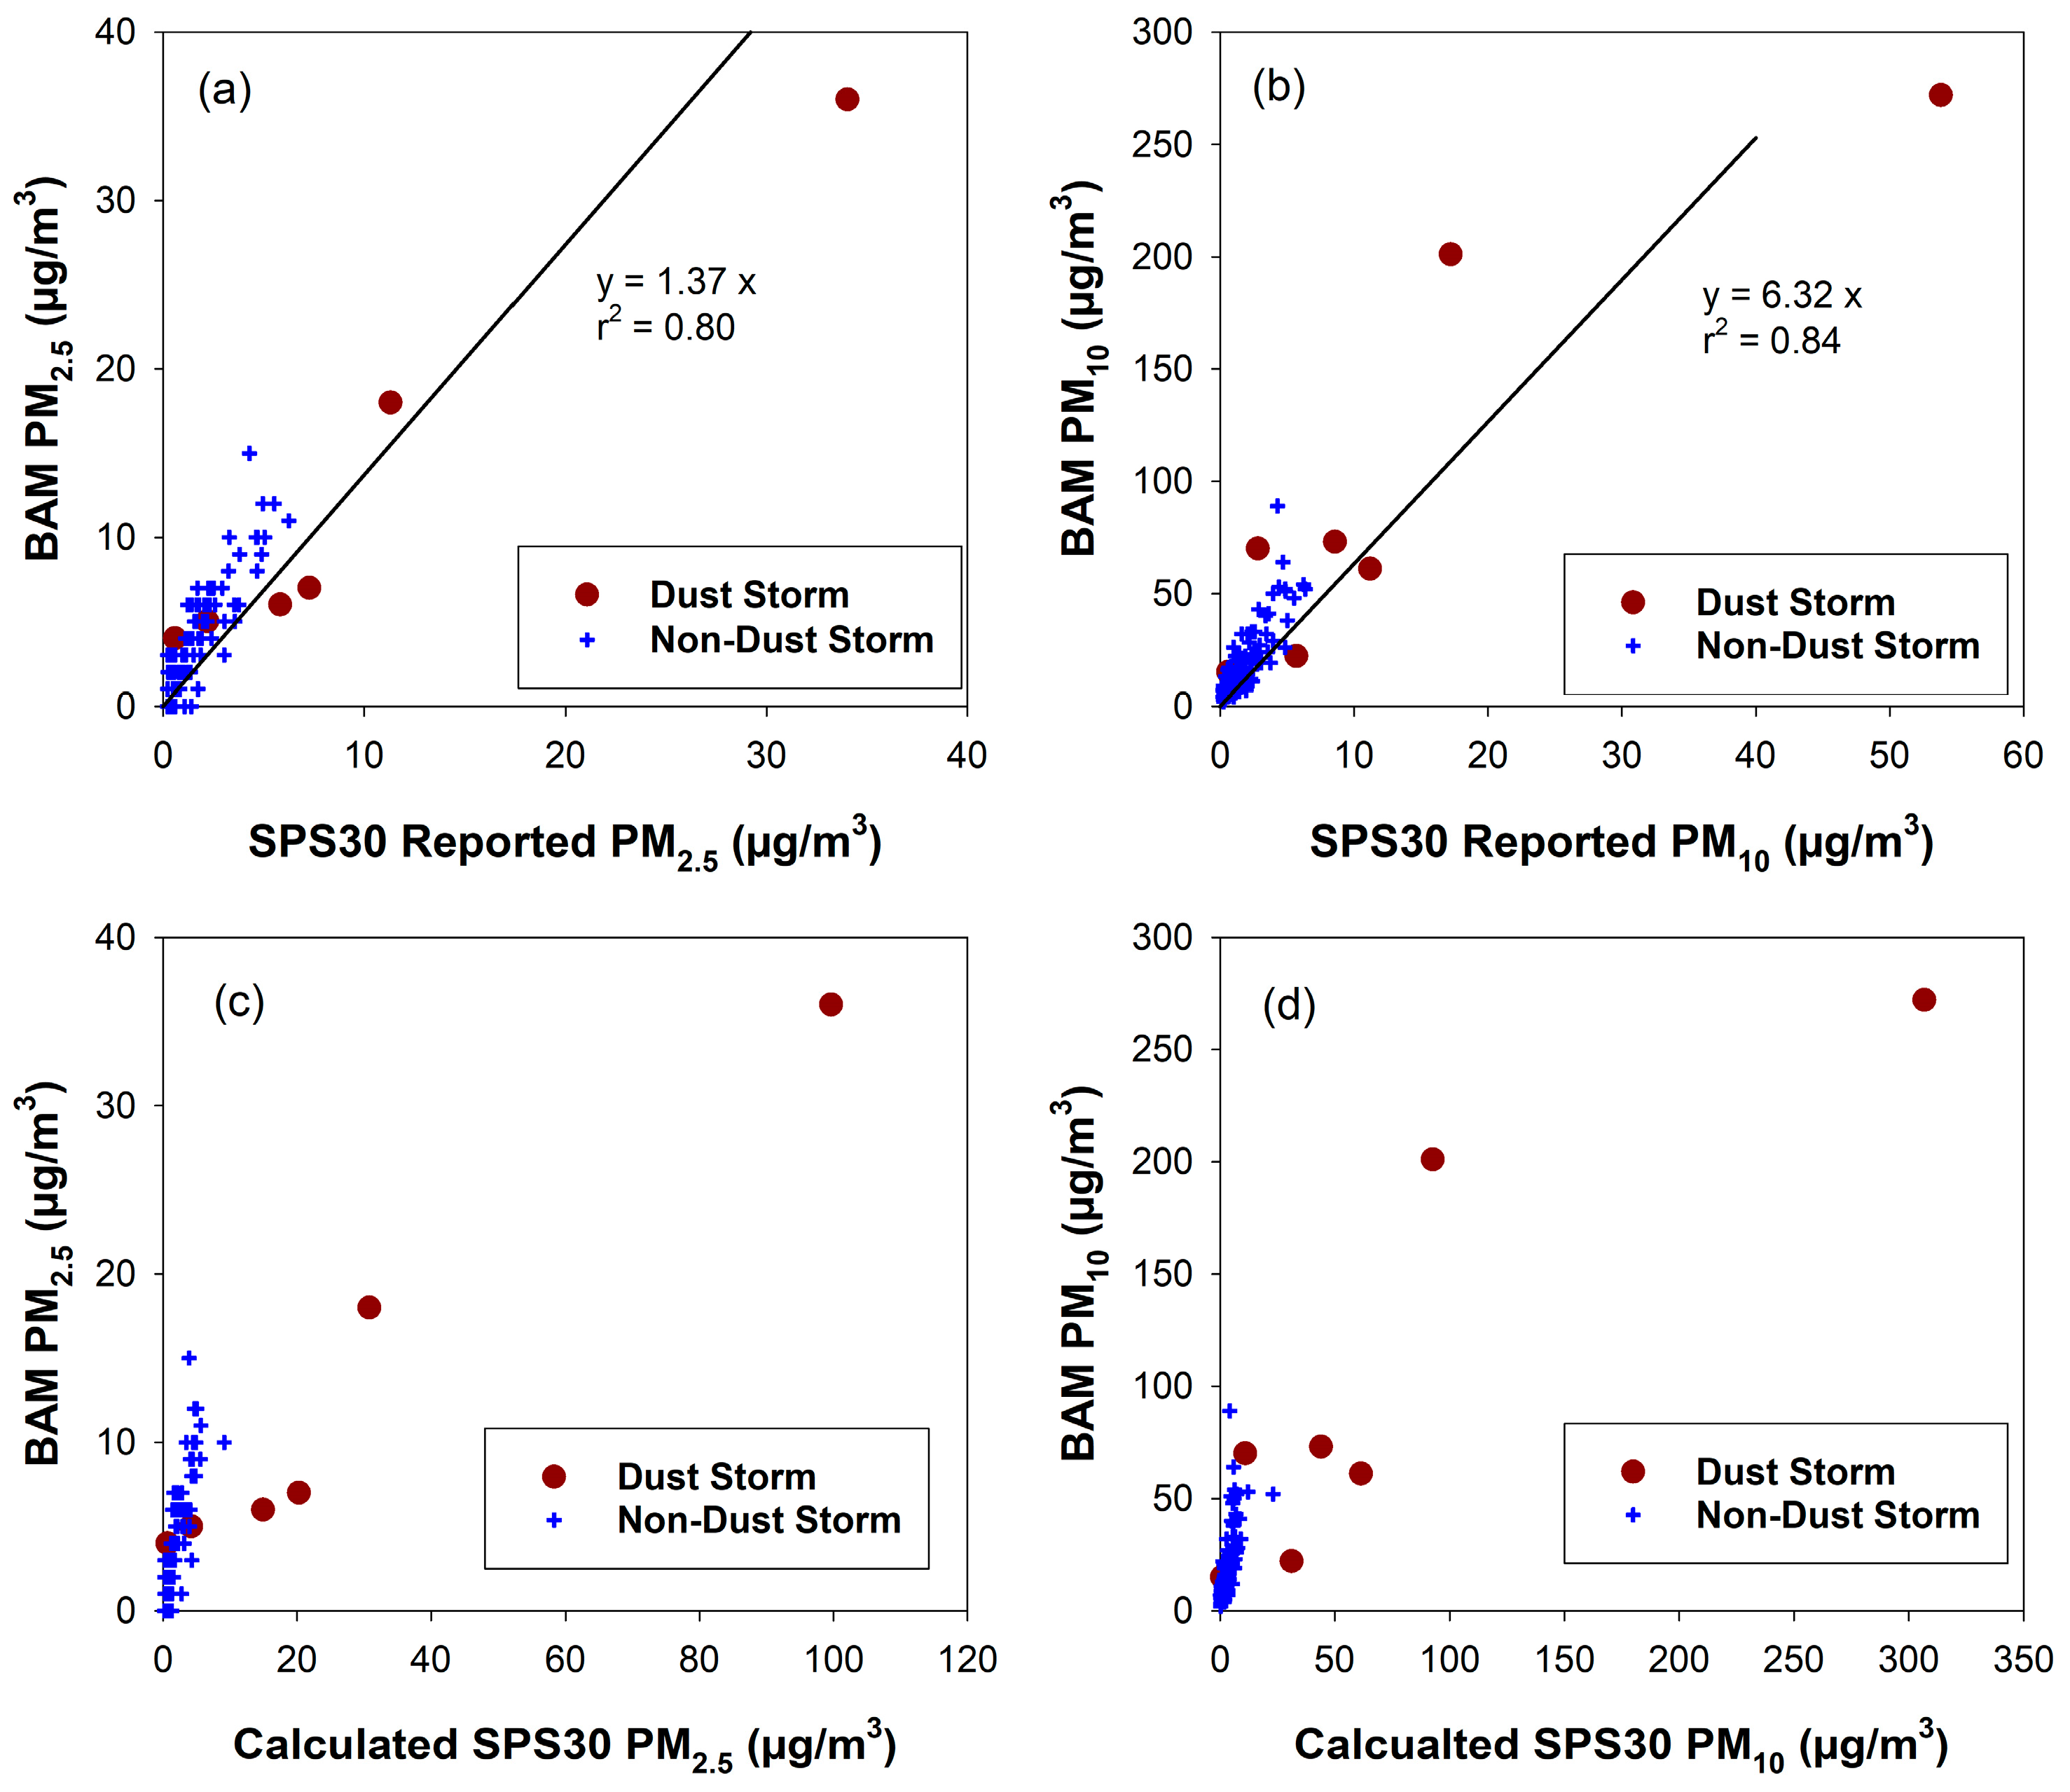
3.5. Ambient PM2.5 and PM10 Measured with SPS30 and Beta-Attenuation Monitors

Similar limits for the PM ratios were also observed in ambient measurements. Figure 8 presents the ambient PM data collected at the University of Nevada Reno Department of Physics over several days in February 2020. A dust storm occurred in the afternoon of 8 February 2020, as indicated by the high peaks in Figure 8a. Figure 8b,c show that the PM2.5/PM1 and PM10/PM1 mass ratios reported by the SPS30 had upper limits of 2.4 and 3.9, respectively, corresponding to the dust storm event. During the non-dust storm periods, the ratios ranged between these upper limits and the lower limit of 1. These upper limits were lower than those shown in Table 2.
To gain insights into the SPS30 data-processing algorithms, mass concentrations were computed from number concentrations by assuming spherical particles with a density of 1 g/cm3. These values were compared to the mass concentrations directly reported by the SPS30. Figure 9a,b show that, during the non-dust storm periods, the ratios of the reported and calculated PM2.5 values ranged from 0.46 to 1.1, while those for PM10 ranged from 0.23 to 1.0. In contrast, during the dust storm periods (Figure 9c,d), the reported and calculated PM2.5 and PM10 had a ratio of 0.34 and 0.18, respectively. These results indicate that the SPS30 generally reports lower mass concentrations than those calculated from number concentrations, with the scaling factor varying depending on the particle size and concentration.
Two beta-attenuation monitors (BAMs) were collocated with the SPS30 to measure the hourly average PM2.5 and PM10 (Figure S6). During the dust storm period, the average PM10/PM2.5 mass ratio was 7.8 (ranging from 4 to 14), which is substantially higher than the SPS30 ratio of 1.6 shown in Figure 8. As shown in Figure 10a,b, the SPS30-reported PM2.5 and PM10 mass concentrations were reasonably correlated with the BAM measurements across both dust storm and non-dust storm periods (r2 ≥ 0.8). The PM2.5 concentrations measured by the SPS30 differed from the BAM by a factor < 2, whereas the PM10 concentrations were underestimated by a factor of ~6. Interestingly, the mass concentrations derived from the SPS30 number concentrations showed a reduced correlation with the BAM data, although the calculated PM10 values were closer in magnitude to those from the BAM. Despite its inaccuracy in the sizing of monodisperse particles under laboratory conditions, the SPS30 appears to employ internal algorithms that enhance its correlations with reference instruments across a broad concentration range. However, the proprietary and opaque nature of its signal- and data-processing algorithms limits the ability to derive physics-based interpretations or propose informed improvements [13].

4. Conclusions and Discussion

This study evaluated the particle-sizing accuracy of several widely used sensors, using laboratory-generated monodisperse particles. The OPC-N3 resolved particle sizes, although its reported size distributions were wider than those measured by reference instruments, and small particles were reported when measuring large-sized particles. The DRX was able to size small and large particles; however, the concentrations were reported in the PM1 channel when measuring particles larger than 1 µm, due to a compromise between high-concentration measurements and the sizing accuracy. The PMS5003 and SPS30 did not accurately size either fine or coarse particles, and there was not a simple relationship between the number and mass distributions for coarse particles. Despite the inaccuracy in sizing monodisperse particles, a short period of ambient measurement, including a dust storm event, showed that the SPS30 had reasonable correlations with reference instruments for both PM2.5 and PM10. This study highlights the need for proper calibration and careful data analyses when using these sensors. The PMS5003 and SPS30 are suitable for estimating ambient PM1 or PM2.5 concentrations, but are not a substitute for dependable, high-quality air quality monitoring systems.
There are two main differences between the low-cost PM sensors (e.g., PMS5003 and SPS30) and higher-end OPCs (e.g., OPC-N3, DRX, and OPS). First, higher-end OPCs typically have a small inlet nozzle to create a collimated or focused particle beam that propagates through the most intense part of the laser beam. The particle beam width is smaller than the laser beam to reduce edge effects due to lower laser intensities near the edges. Some OPCs further use sheath flow to confine the particle beam and reduce recirculation inside the optical chamber. In contrast, the particle beams in low-cost sensors are often wider than the laser beam, resulting in only a small fraction of the particles propagating through the focused portion of the laser beam. Therefore, particles are sized incorrectly due to the varying laser intensity across the laser beam. The sizing accuracy of low-cost sensors could also be partly influenced by their electronic designs and signal-processing methods and algorithms. Second, most higher-end OPCs have a short, vertical, and straight flow path from the inlet through the optical chamber and outlet to reduce particle deposition. In contrast, low-cost sensors often do not have a well-organized flow path, causing size-dependent losses before the particles enter the sensing volume [24]. Therefore, two key modifications are needed to increase the accuracy of low-cost sensors: (1) focusing the particle beam to pass through a more uniform portion of the laser beam or making the laser beam intensity more uniform, and (2) making the flow path short, vertical, and straight. These modifications may increase the cost of these sensors, but more accurate measurements would increase the data’s value and reduce the data analysis cost. Additionally, sensor manufacturers are strongly encouraged to share more information about their signal- and data-processing methods, while preserving proprietary details. This transparency would not only help users interpret the data more accurately, but it would also foster innovation to improve the technologies.

Supplementary Materials

The following supporting information can be downloaded at: https://www.mdpi.com/article/10.3390/atmos16050502/s1, Figure S1. Particle size distributions of dioctyl sebacate (DOS) measured with the reference instruments for set geometric diameters (Dg): (a) 0.6 μm and (b) 1 μm, generated with DMA and measured with OPS; (c) 2 μm and (d) 6 μm, generated with FMAG and measured with APS. Figure S2. Mass concentrations of DOS particles measured with DRX for three geometric diameters (Dg): (a) 1 μm, (b) 2 μm, and (c) 6 μm. Figure S3. Particle number size distributions measured with PMS5003 for four geometric particle diameters (Dg): (a) 0.6 μm, (b) 1 μm, (c) 2 μm, and d) 6 μm. Figure S4. Particle number size distributions measured with SPS30 for four geometric particle diameters (Dg): (a) 0.6 μm, (b) 1 μm, (c) 2 μm, and (d) 6 μm. Figure S5. PM1, PM1–2.5, and PM2.5–10 fractional mass concentrations measured with DRX, PMS5003, and SPS30 for geometric diameters (Dg): (a) 0.6 μm, (b) 1 μm, (c) 2 μm, and (d) 6 μm. Figure S6. Time series of hourly-averaged PM2.5 and PM10 concentrations by two beta-attenuation monitors (BAMs) collocated with the SPS30. The data were taken in Reno, Nevada, during 7–10 February 2020.

Author Contributions

Conceptualization, P.G. and X.W.; methodology, P.G., A.R., S.B., W.P.A., and X.W.; software, P.G. and A.R.; validation, P.G. and X.W.; formal analysis, P.G. and X.W.; investigation, P.G., A.R., and S.B.; resources, X.W., J.C.C., and J.G.W.; data curation, P.G., A.R., and S.B.; writing—original draft preparation, P.G. and X.W.; writing—review and editing, P.G., X.W., J.C.C., J.G.W., W.P.A., and H.M.; visualization, P.G. and X.W.; supervision, X.W.; project administration, X.W.; funding acquisition, X.W. and W.P.A. All authors have read and agreed to the published version of the manuscript.

Funding

This research was funded by the Department of Energy, grant award No. DE-SC0021214.

Institutional Review Board Statement

Not applicable.

Informed Consent Statement

Not applicable.

Data Availability Statement

The raw data supporting the conclusions of this article will be made available by the authors upon request.

Conflicts of Interest

The authors declare no conflicts of interest. The funders had no role in the design of the study; in the collection, analyses, or interpretation of data; in the writing of the manuscript; or in the decision to publish the results.

References

  1. Feng, S.; Gao, D.; Liao, F.; Zhou, F.; Wang, X. The health effects of ambient PM2.5 and potential mechanisms. Ecotoxicol. Environ. Saf. 2016, 128, 67–74. [Google Scholar] [CrossRef] [PubMed]
  2. Fuzzi, S.; Baltensperger, U.; Carslaw, K.; Decesari, S.; Denier van der Gon, H.; Facchini, M.C.; Fowler, D.; Koren, I.; Langford, B.; Lohmann, U.; et al. Particulate matter, air quality and climate: Lessons learned and future needs. Atmos. Chem. Phys. 2015, 15, 8217–8299. [Google Scholar] [CrossRef]
  3. Watson, J.G. Visibility: Science and regulation. J. Air Waste Manage. Assoc. 2002, 52, 628–713. [Google Scholar]
  4. U.S. EPA. Integrated Science Assessment (ISA) for Particulate Matter (Final Report, Dec 2019); U.S. Environmental Protection Agency (U.S. EPA): Washington, DC, USA, 2019. Available online: https://ordspub.epa.gov/ords/eims/eimscomm.getfile?p_download_id=539935 (accessed on 29 October 2024).
  5. U.S. EPA. Supplement to the 2019 Integrated Science Assessment for Particulate Matter (Final Report, 2022); U.S. Environmental Protection Agency (U.S. EPA): Washington, DC, USA, 2022. Available online: https://ordspub.epa.gov/ords/eims/eimscomm.getfile?p_download_id=544706 (accessed on 29 October 2024).
  6. Wilson, W.E.; Chow, J.C.; Claiborn, C.; Fusheng, W.; Engelbrecht, J.; Watson, J.G. Monitoring of particulate matter outdoors. Chemosphere 2002, 49, 1009–1043. [Google Scholar] [CrossRef] [PubMed]
  7. Alfano, B.; Barretta, L.; Del Giudice, A.; De Vito, S.; Di Francia, G.; Esposito, E.; Formisano, F.; Massera, E.; Miglietta, M.L.; Polichetti, T. A Review of Low-Cost Particulate Matter Sensors from the Developers’ Perspectives. Sensors 2020, 20, 6819. [Google Scholar] [CrossRef]
  8. U.S. EPA. List of Designated Reference and Equivalent Methods; Research Triangle Park, NC, 15 December 2024. Available online: https://www.epa.gov/system/files/documents/2024-12/amtic-list-december-2024_final.pdf (accessed on 22 February 2025).
  9. Snyder, E.G.; Watkins, T.H.; Solomon, P.A.; Thoma, E.D.; Williams, R.W.; Hagler, G.S.W.; Shelow, D.; Hindin, D.A.; Kilaru, V.J.; Preuss, P.W. The Changing Paradigm of Air Pollution Monitoring. Environ. Sci. Technol. 2013, 47, 11369–11377. [Google Scholar] [CrossRef] [PubMed]
  10. deSouza, P.; Barkjohn, K.; Clements, A.; Lee, J.; Kahn, R.; Crawford, B.; Kinney, P. An analysis of degradation in low-cost particulate matter sensors. Environ. Sci. Atmos. 2023, 3, 521–536. [Google Scholar] [CrossRef]
  11. Giordano, M.R.; Malings, C.; Pandis, S.N.; Presto, A.A.; McNeill, V.F.; Westervelt, D.M.; Beekmann, M.; Subramanian, R. From low-cost sensors to high-quality data: A summary of challenges and best practices for effectively calibrating low-cost particulate matter mass sensors. J. Aerosol Sci. 2021, 158, 105833. [Google Scholar] [CrossRef]
  12. Wang, X.L.; Chancellor, G.; Evenstad, J.; Farnsworth, J.E.; Hase, A.; Olson, G.M.; Sreenath, A.; Agarwal, J.K. A Novel Optical Instrument for Estimating Size Segregated Aerosol Mass Concentration in Real Time. Aerosol Sci. Technol. 2009, 43, 939–950. [Google Scholar] [CrossRef]
  13. Hagan, D.H.; Kroll, J.H. Assessing the accuracy of low-cost optical particle sensors using a physics-based approach. Atmos. Meas. Tech. 2020, 13, 6343–6355. [Google Scholar] [CrossRef]
  14. Gebhart, J. Optical Direct-Reading Techniques: Light Intensity Systems. In Aerosol Measurement: Principles, Techniques, and Applications, 2nd ed.; Baron, P.A., Willeke, K., Eds.; John Wiley & Sons, Inc.: New York, NY, USA, 2001; pp. 419–454. [Google Scholar]
  15. Binnig, J.; Meyer, J.; Kasper, G. Calibration of an optical particle counter to provide PM2.5 mass for well-defined particle materials. J. Aerosol Sci. 2007, 38, 325–332. [Google Scholar] [CrossRef]
  16. Whitby, K.T.; Willeke, K. Single Particle Optical Counters: Principles and Field Use. In Aerosol Measurement; Lundgren, D.A., Lippmann, M., Harris, F.S., Clark, W.E., Marlow, W.H., Durham, M.D., Eds.; University Presses of Florida: Gainesville, FL, USA, 1979; pp. 145–182. [Google Scholar]
  17. EN 16450; Ambient Air—Automated Measuring Systems for the Measurement of the Concentration of Particulate Matter (PM10; PM2,5). European Committee for Standardization: Brussels, Belgium, 2017. Available online: https://standards.iteh.ai/catalog/standards/cen (accessed on 30 March 2025).
  18. Mehadi, A.; Moosmüller, H.; Campbell, D.E.; Ham, W.; Schweizer, D.; Tarnay, L.; Hunter, J. Laboratory and Field Evaluation of Real-time and Near Real-time PM2.5 Smoke Monitors. J. Air Waste Manag. Assoc. 2020, 70, 158–179. [Google Scholar] [CrossRef]
  19. Kaur, K.; Kelly, K.E. Performance evaluation of the Alphasense OPC-N3 and Plantower PMS5003 sensor in measuring dust events in the Salt Lake Valley, Utah. Atmos. Meas. Tech. 2023, 16, 2455–2470. [Google Scholar] [CrossRef]
  20. Kosmopoulos, G.; Salamalikis, V.; Pandis, S.N.; Yannopoulos, P.; Bloutsos, A.A.; Kazantzidis, A. Low-cost sensors for measuring airborne particulate matter: Field evaluation and calibration at a South-Eastern European site. Sci. Total Environ. 2020, 748, 141396. [Google Scholar] [CrossRef]
  21. Mei, H.; Han, P.; Wang, Y.; Zeng, N.; Liu, D.; Cai, Q.; Deng, Z.; Wang, Y.; Pan, Y.; Tang, X. Field Evaluation of Low-Cost Particulate Matter Sensors in Beijing. Sensors 2020, 20, 4381. [Google Scholar] [CrossRef]
  22. Molina Rueda, E.; Carter, E.; L’Orange, C.; Quinn, C.; Volckens, J. Size-Resolved Field Performance of Low-Cost Sensors for Particulate Matter Air Pollution. Environ. Sci. Technol. Lett. 2023, 10, 247–253. [Google Scholar] [CrossRef] [PubMed]
  23. Sensirion. Sensor Specification Statement: How to Understand Specifications of Sensirion Particulate Matter Sensors; Sensirion AG: Staefa, Switzerland, 2020; Available online: https://sensirion.com/media/documents/B7AAA101/61653FB8/Sensirion_Particulate_Matter_AppNotes_Specification_Statement.pdf (accessed on 1 December 2024).
  24. Ouimette, J.; Arnott, W.P.; Laven, P.; Whitwell, R.; Radhakrishnan, N.; Dhaniyala, S.; Sandink, M.; Tryner, J.; Volckens, J. Fundamentals of low-cost aerosol sensor design and operation. Aerosol Sci. Technol. 2024, 58, 1–15. [Google Scholar] [CrossRef]
  25. He, M.; Kuerbanjiang, N.; Dhaniyala, S. Performance characteristics of the low-cost Plantower PMS optical sensor. Aerosol Sci. Technol. 2020, 54, 232–241. [Google Scholar] [CrossRef]
  26. Kuula, J.; Mäkelä, T.; Aurela, M.; Teinilä, K.; Varjonen, S.; González, Ó.; Timonen, H. Laboratory evaluation of particle-size selectivity of optical low-cost particulate matter sensors. Atmos. Meas. Tech. 2020, 13, 2413–2423. [Google Scholar] [CrossRef]
  27. Kaur, K.; Kelly, K.E. Laboratory evaluation of the Alphasense OPC-N3, and the Plantower PMS5003 and PMS6003 sensors. J. Aerosol Sci. 2023, 171, 106181. [Google Scholar] [CrossRef]
  28. Barkjohn, K.K.; Gantt, B.; Clements, A.L. Development and application of a United States-wide correction for PM2.5 data collected with the PurpleAir sensor. Atmos. Meas. Tech. 2021, 14, 4617–4637. [Google Scholar] [CrossRef] [PubMed]
  29. Wallace, L. Testing a New “Decrypted” Algorithm for Plantower Sensors Measuring PM2.5: Comparison with an Alternative Algorithm. Algorithms 2023, 16, 392. [Google Scholar] [CrossRef]
  30. Wallace, L. Cracking the code—Matching a proprietary algorithm for a low-cost sensor measuring PM1 and PM2.5. Sci. Total Environ. 2023, 893, 164874. [Google Scholar] [CrossRef]
  31. Wang, X.L.; Zhou, H.; Arnott, W.P.; Meyer, M.E.; Taylor, S.; Firouzkouhi, H.; Moosmüller, H.; Chow, J.C.; Watson, J.G. Evaluation of Gas and Particle Sensors for Detecting Spacecraft-Relevant Fire Emissions. Fire Saf. J. 2020, 113, 1–12. [Google Scholar] [CrossRef]
  32. He, R.; Han, T.; Bachman, D.; Carluccio, D.J.; Jaeger, R.; Zhang, J.; Thirumurugesan, S.; Andrews, C.; Mainelis, G. Evaluation of two low-cost PM monitors under different laboratory and indoor conditions. Aerosol Sci. Technol. 2020, 55, 316–331. [Google Scholar] [CrossRef]
  33. ISO 21501-1:2009; Determination of Particle Size Distribution—Single Particle Light Interaction Methods—Part 1: Light Scattering Aerosol Spectrometer. International Organization for Standardization: Geneva, Switzerland, 2009.
  34. TSI. Optical Particle Sizer: Model 3330; TSI Inc.: Shoreview, MN, USA, 2024; Available online: https://tsi.com/getmedia/9728dd3d-5528-4621-9877-a116ee742528/3330_5001323_Web?ext=.pdf (accessed on 2 December 2024).
  35. Vasilatou, K.; Wälchli, C.; Koust, S.; Horender, S.; Iida, K.; Sakurai, H.; Schneider, F.; Spielvogel, J.; Wu, T.Y.; Auderset, K. Calibration of optical particle size spectrometers against a primary standard: Counting efficiency profile of the TSI Model 3330 OPS and Grimm 11-D monitor in the particle size range from 300 nm to 10 μm. J. Aerosol Sci. 2021, 157, 105818. [Google Scholar] [CrossRef]
  36. Baron, P.A. Calibration and Use of the Aerodynamic Particle Sizer (APS 3300). Aerosol Sci. Technol. 1986, 5, 55–67. [Google Scholar] [CrossRef]
  37. Peters, T.M. Use of the Aerodynamic Particle Sizer to Measure Ambient PM10–2.5: The Coarse Fraction of PM10. J. Air Waste Manage. Assoc. 2006, 56, 411–416. [Google Scholar] [CrossRef]
  38. Tryner, J.; Mehaffy, J.; Miller-Lionberg, D.; Volckens, J. Effects of aerosol type and simulated aging on performance of low-cost PM sensors. J. Aerosol Sci. 2020, 150, 105654. [Google Scholar] [CrossRef]
  39. Rader, D.J.; McMurry, P.H.; Smith, S. Evaporation Rates of Monodisperse Organic Aerosols in the 0.02- to 0.2-µm-Diameter Range. Aerosol Sci. Technol. 1987, 6, 247–260. [Google Scholar] [CrossRef]
  40. Sang-Nourpour, N.; Olfert, J.S. Calibration of optical particle counters with an aerodynamic aerosol classifier. J. Aerosol Sci. 2019, 138, 105452. [Google Scholar] [CrossRef]
  41. Hinds, W.C. Aerosol Technology, Properties, Behavior, and Measurement of Airborne Particles, 2nd ed.; A Wiley-Interscience Publication: Los Angeles, CA, USA, 1999. [Google Scholar]
  42. Flagan, R.C. On Differential Mobility Analyzer Resolution. Aerosol Sci. Technol. 1999, 30, 556–570. [Google Scholar] [CrossRef]
  43. Wang, X.L.; Caldow, R.; Sem, G.J.; Hama, N.; Sakurai, H. Evaluation of a condensation particle counter for vehicle emission measurement: Experimental procedure and effects of calibration aerosol material. J. Aerosol Sci. 2010, 41, 306–318. [Google Scholar] [CrossRef]
  44. Duan, H.; Romay, F.J.; Li, C.; Naqwi, A.; Deng, W.; Liu, B.Y.H. Generation of monodisperse aerosols by combining aerodynamic flow-focusing and mechanical perturbation. Aerosol Sci. Technol. 2016, 50, 17–25. [Google Scholar] [CrossRef]
Figure 1. A schematic diagram of the experimental setup for evaluating the particle sizing accuracy of low-cost sensors. (DMA: differential mobility analyzer; DOS: dioctyl sebacate; FMAG: flow-focusing monodisperse aerosol generator; IPA: isopropanol alcohol.)
Atmosphere 16 00502 g001
Figure 2. Particle size distributions of dioctyl sebacate (DOS) measured with the reference instruments for four geometric particle diameters (Dg): (a) DMA-generated 0.4 μm particles measured with OPS and FMAG-generated (b) 1.5 μm, (c) 3 μm, and (d) 7 μm particles measured with APS. Additional particle size distribution measurements can be found in Figure S1.
Atmosphere 16 00502 g002
Figure 3. Number distributions of DOS particles measured with the OPC-N3 for four particle diameters (Dg): (a) 1 μm, (b) 2 μm, (c) 3 μm, and (d) 6 μm.
Atmosphere 16 00502 g003
Figure 4. Mass concentrations of DOS particles measured with DRX for four particle diameters (Dg): (a) 0.4 μm, (b) 1.5 μm, (c) 3μm, and (d) 7 μm. Additional particle size distribution measurements can be found in Figure S2.
Atmosphere 16 00502 g004
Figure 5. The particle number size distributions measured with the PMS5003 for four particle diameters (Dg): (a) 0.4 μm, (b) 1.5 μm, (c) 3 μm, and (d) 7 μm. Additional particle size distribution measurements can be found in Figure S3.
Atmosphere 16 00502 g005
Figure 6. Particle number size distributions measured with SPS30 for four particle diameters (Dg): (a) 0.4 μm, (b) 1.5 μm, (c) 3 μm, and (d) 7 μm. Additional particle size distribution measurements can be found in Figure S4.
Atmosphere 16 00502 g006
Figure 7. PM1, PM1–2.5, and PM2.5–10 fractional mass concentrations measured with DRX, PMS5003, and SPS30 for geometric diameters (Dg): (a) 0.4 μm, (b) 1.5 μm, (c) 3 μm, and (d) 7 μm. Fractional mass concentrations for additional diameters are in Figure S5.
Atmosphere 16 00502 g007
Figure 8. Minute-averaged PM concentrations measured by an SPS30 in Reno, Nevada, during 7–10 February 2020: (a) time series of PM1, PM2.5, and PM10 concentrations reported by the SPS30; (b) PM2.5 vs. PM1 during dust storm and non-dust storm periods; and (c) PM10 vs. PM1 during dust storm and non-dust storm periods.
Atmosphere 16 00502 g008
Figure 9. A comparison of minute-averaged PM mass concentrations reported by the SPS30 and those calculated from the SPS30 number distributions: (a) PM2.5 during non-dust storm periods; (b) PM10 during non-dust storm periods; (c) PM2.5 during dust storm periods; and (d) PM10 during dust storm periods.
Atmosphere 16 00502 g009
Figure 10. Hourly-averaged PM mass concentrations measured by a beta-attenuation monitor (BAM) collocated with the SPS30. Data were taken in Reno, Nevada, during 7–10 February 2020: (a) PM2.5 by the BAM vs. that reported by the SPS30; (b) PM10 by the BAM vs. that reported by the SPS30; (c) PM2.5 by the BAM vs. that calculated from the SPS30 number distributions; and (d) PM10 by the BAM vs. that calculated from the SPS30 number distributions.
Atmosphere 16 00502 g010
Table 1. Key features of low-cost PM sensors and research-grade instruments.
Sensor/InstrumentsScattering AngleWavelengthOutputPrice (USD)
OPC-N3 32–88°658 nmPM1, PM2.5, PM10, and number concentrations for 0.35–40 µm in 24 channels~500
Plantower PMS500390 ± 37°657 nmPM1, PM2.5, PM10, and number concentrations for >0.3, >0.5, >1, >2.5, >5, and >10 µm~20
Sensirion SPS30Data not available660 nmPM1, PM2.5, PM4, PM10, and number concentrations for 0.3–0.5, 0.3–1, 0.3–2.5, 0.3–4, and 0.3–10 µm~50
TSI DRX 853490 ± 62°655 nmPM1, PM2.5, PM4, PM10, and total PM~11,000
TSI OPS 333090 ± 60°660 nmNumber, surface area, and mass distributions for 0.3–10 μm in up to 16 channels~19,000
TSI APS 3321Aerodynamic particle sizingAerodynamic size distribution for 0.5–20 µm in 52 channels~57,000
Table 2. PM2.5/PM1.0 and PM10/PM2.5 mass ratios reported by PMS5003 and SPS30 for monodisperse particles.
Sizes (µm)PM2.5/PM1 Mass RatioPM10/PM2.5 Mass RatioPM10/PM1 Mass Ratio
PMS5003SPS30PMS5003SPS30PMS5003SPS30
0.42.391.141.151.102.751.25
0.62.261.261.361.213.071.52
13.173.101.371.804.345.58
1.53.303.311.401.844.626.09
23.503.551.471.865.156.60
33.563.611.501.875.346.75
63.253.531.351.844.396.50
72.123.681.281.882.716.92
Disclaimer/Publisher’s Note: The statements, opinions and data contained in all publications are solely those of the individual author(s) and contributor(s) and not of MDPI and/or the editor(s). MDPI and/or the editor(s) disclaim responsibility for any injury to people or property resulting from any ideas, methods, instructions or products referred to in the content.

