Observation and Analysis of Particle Nucleation at a Forest Site in Southeastern US


Abstract
:
1. Introduction
2. Experimental
2.1. Site Description
2.2. Measurements
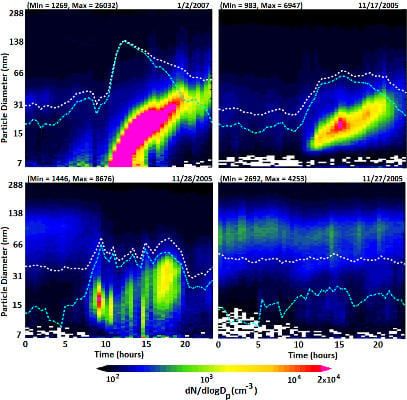
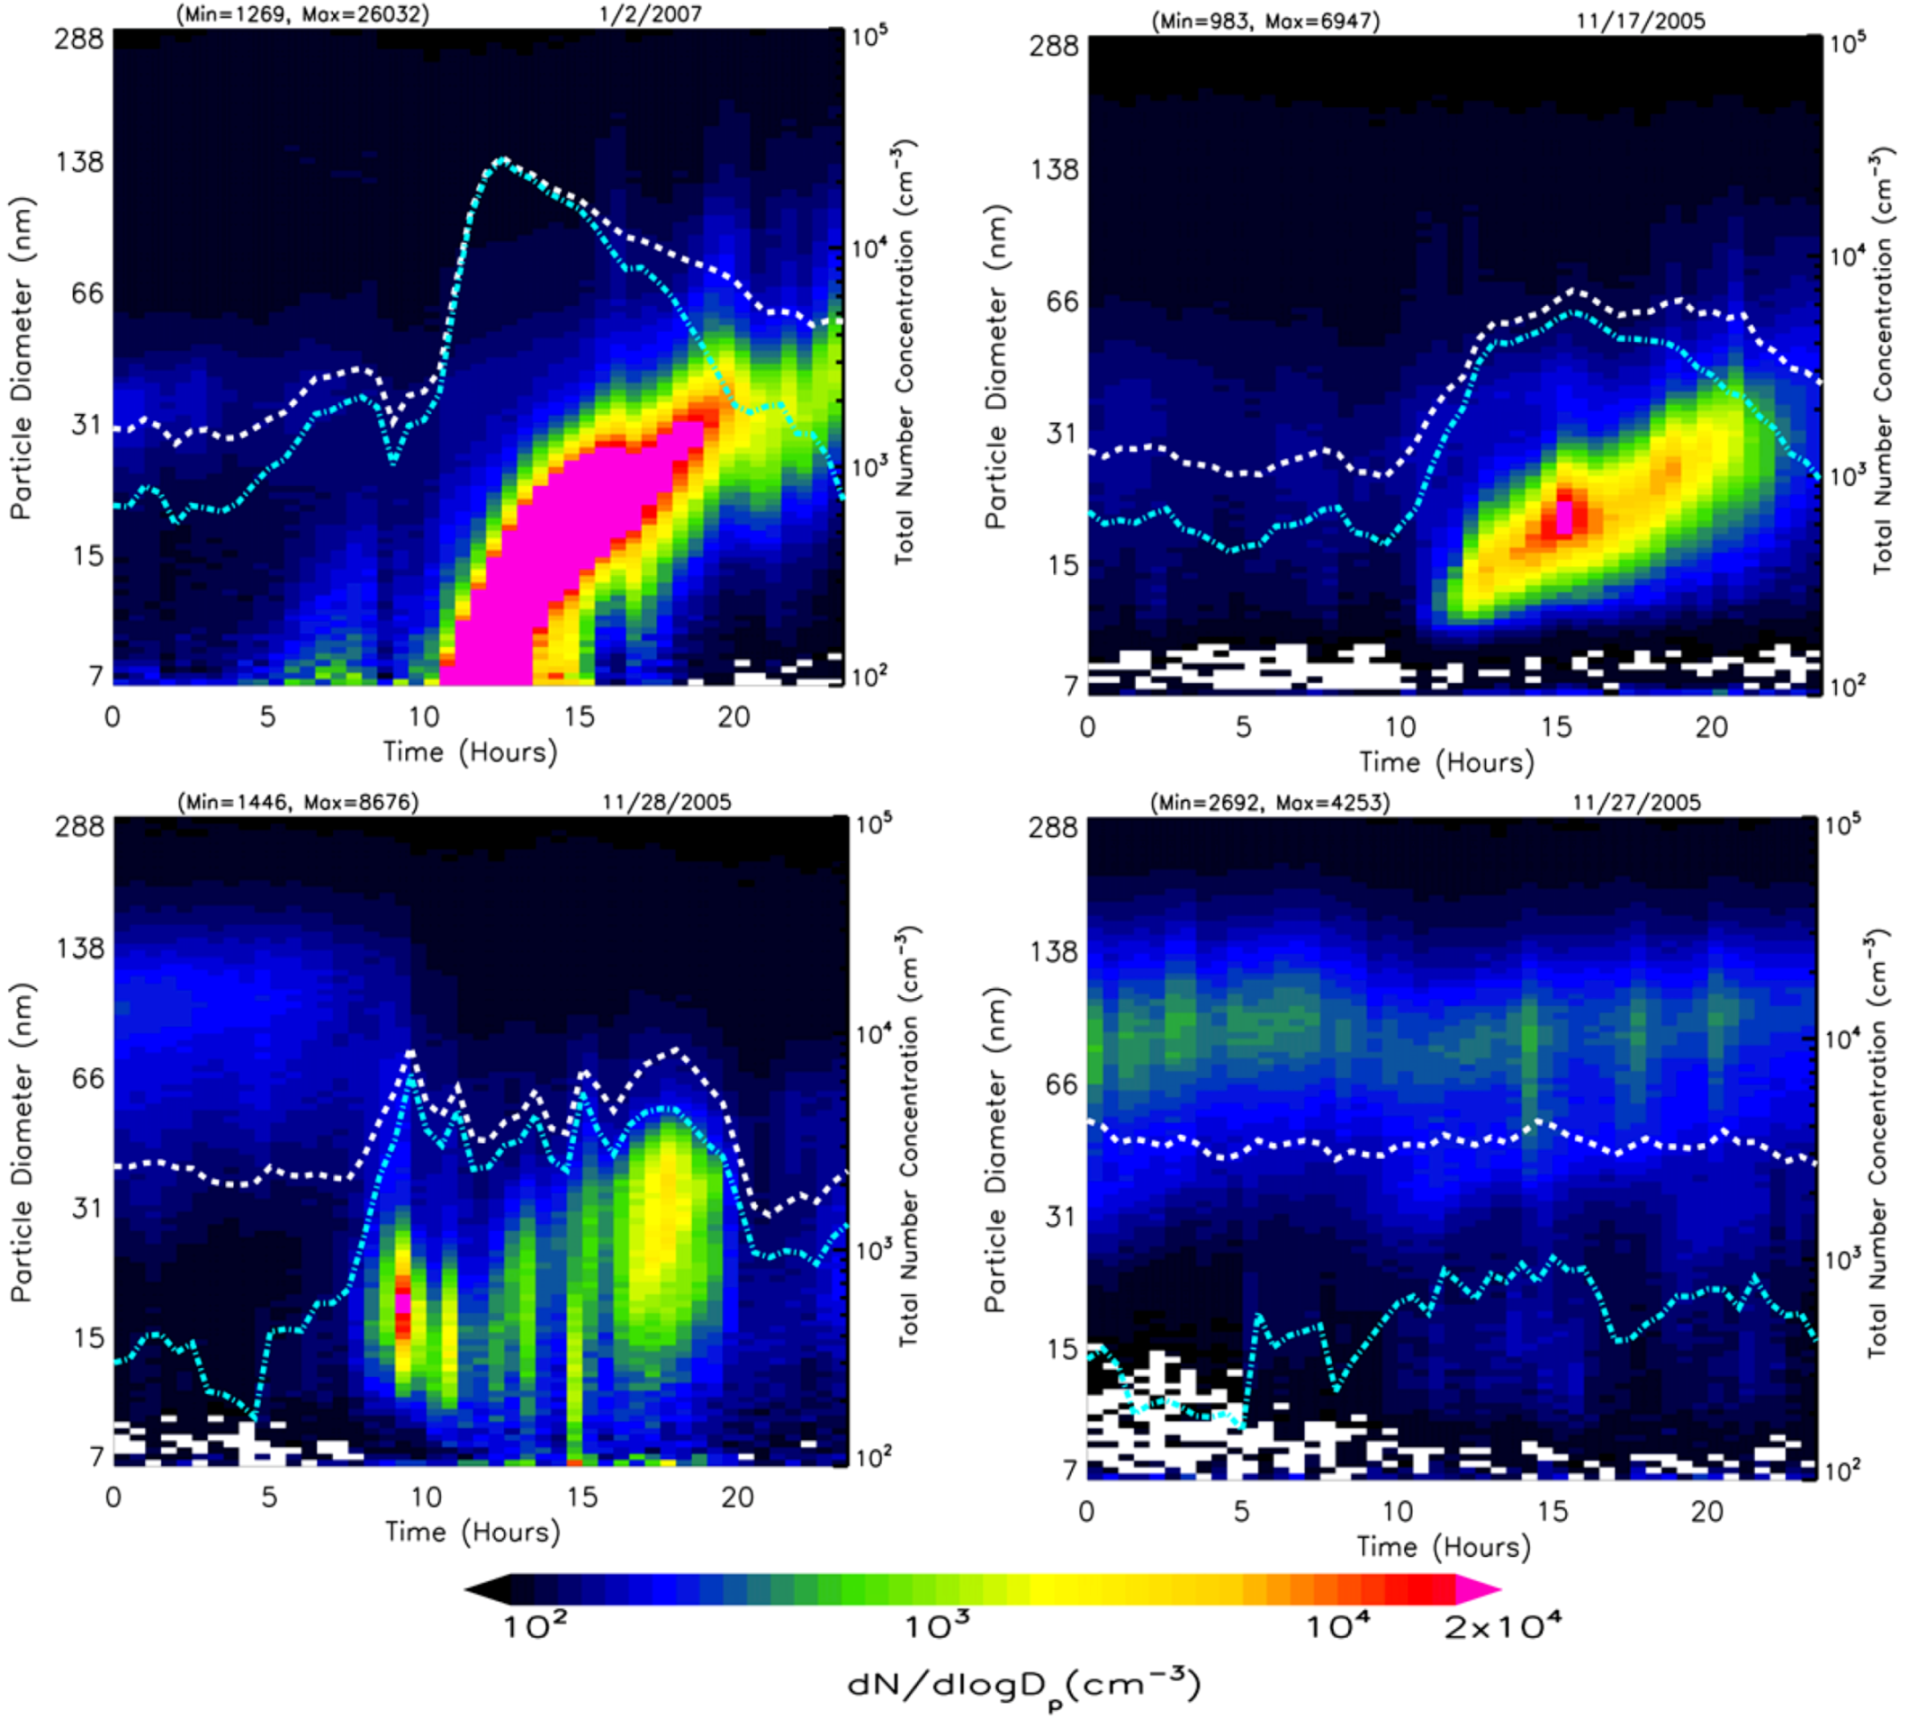
2.3. Detection and Classification of Nucleation Events

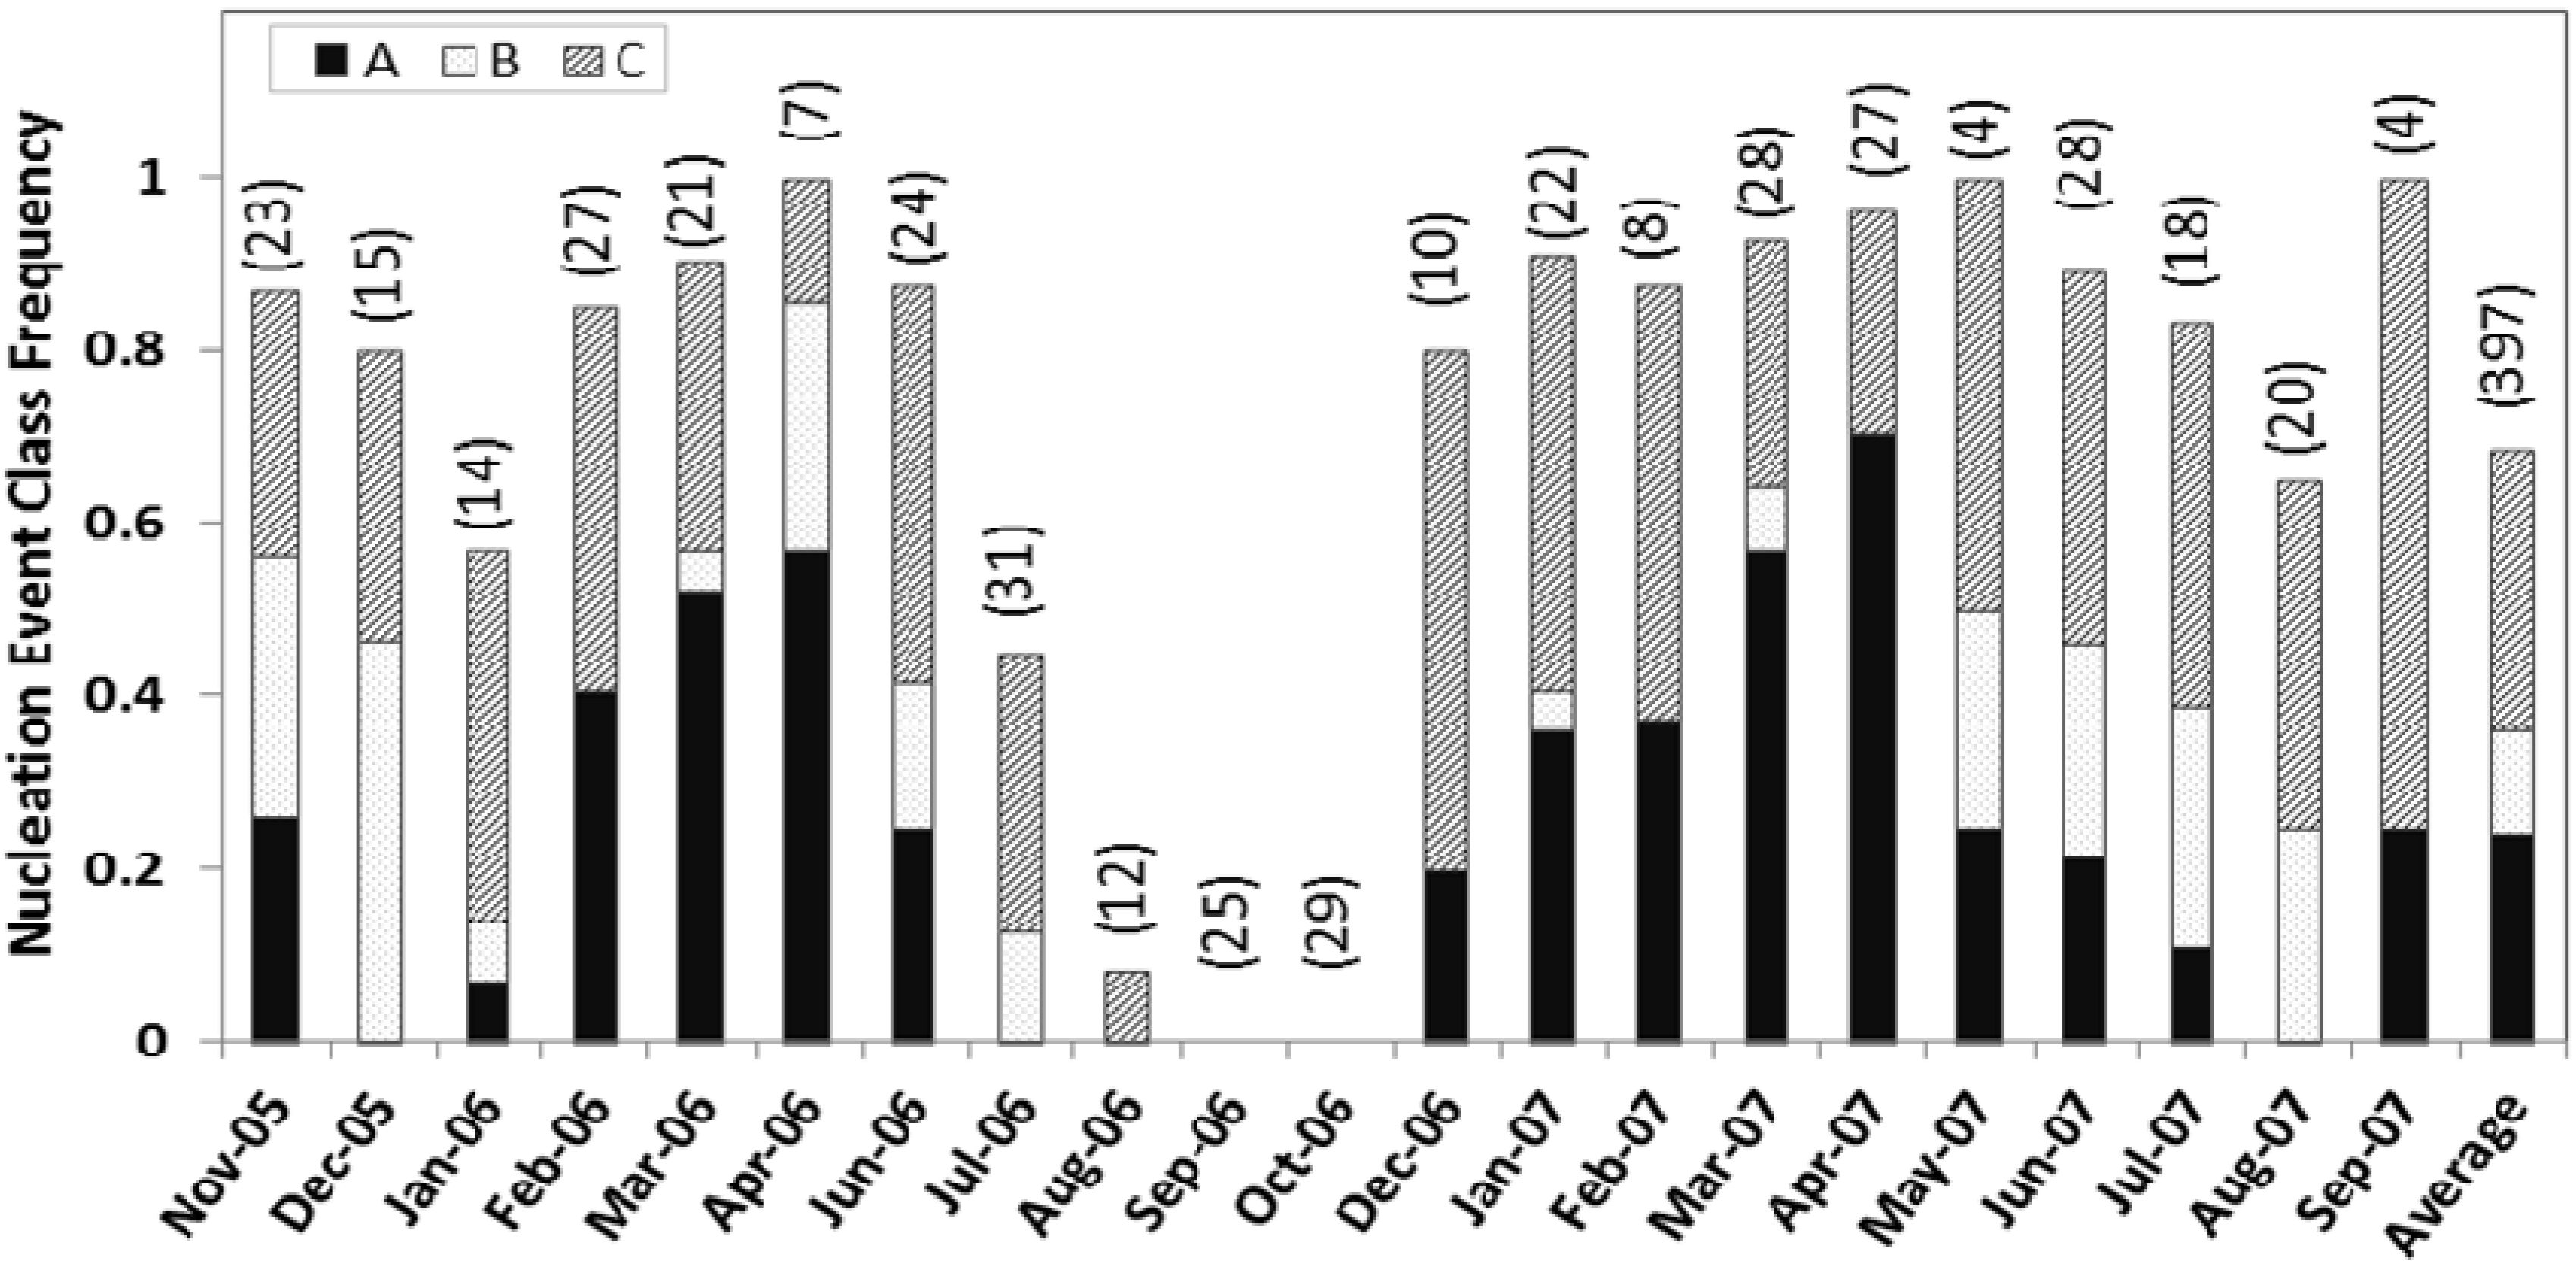
2.4. Condensation Sink (CS) and Growth Rate


3. Results and Discussions
3.1. Summary Statistics


| Time | N (cm−3) | N25 (cm−3) | CS | Dpeak | GR |
|---|---|---|---|---|---|
| (10nm ≤ Dp ≤ 250 nm) | (10 ≤ Dp ≤ 25 nm) | (cm−2) | (nm) | (nm·h−1) | |
| 9:00 am | 2,530 | 1,559 | 0.0034 | 8.82 | - |
| 11:00 am | 10,522 | 9,462 | 0.0041 | 9.14 | 1.60 |
| 13:00 pm | 19,964 | 19,128 | 0.0058 | 15.70 | 3.28 |
| 15:00 pm | 20,307 | 18,975 | 0.0078 | 18.80 | 3.10 |

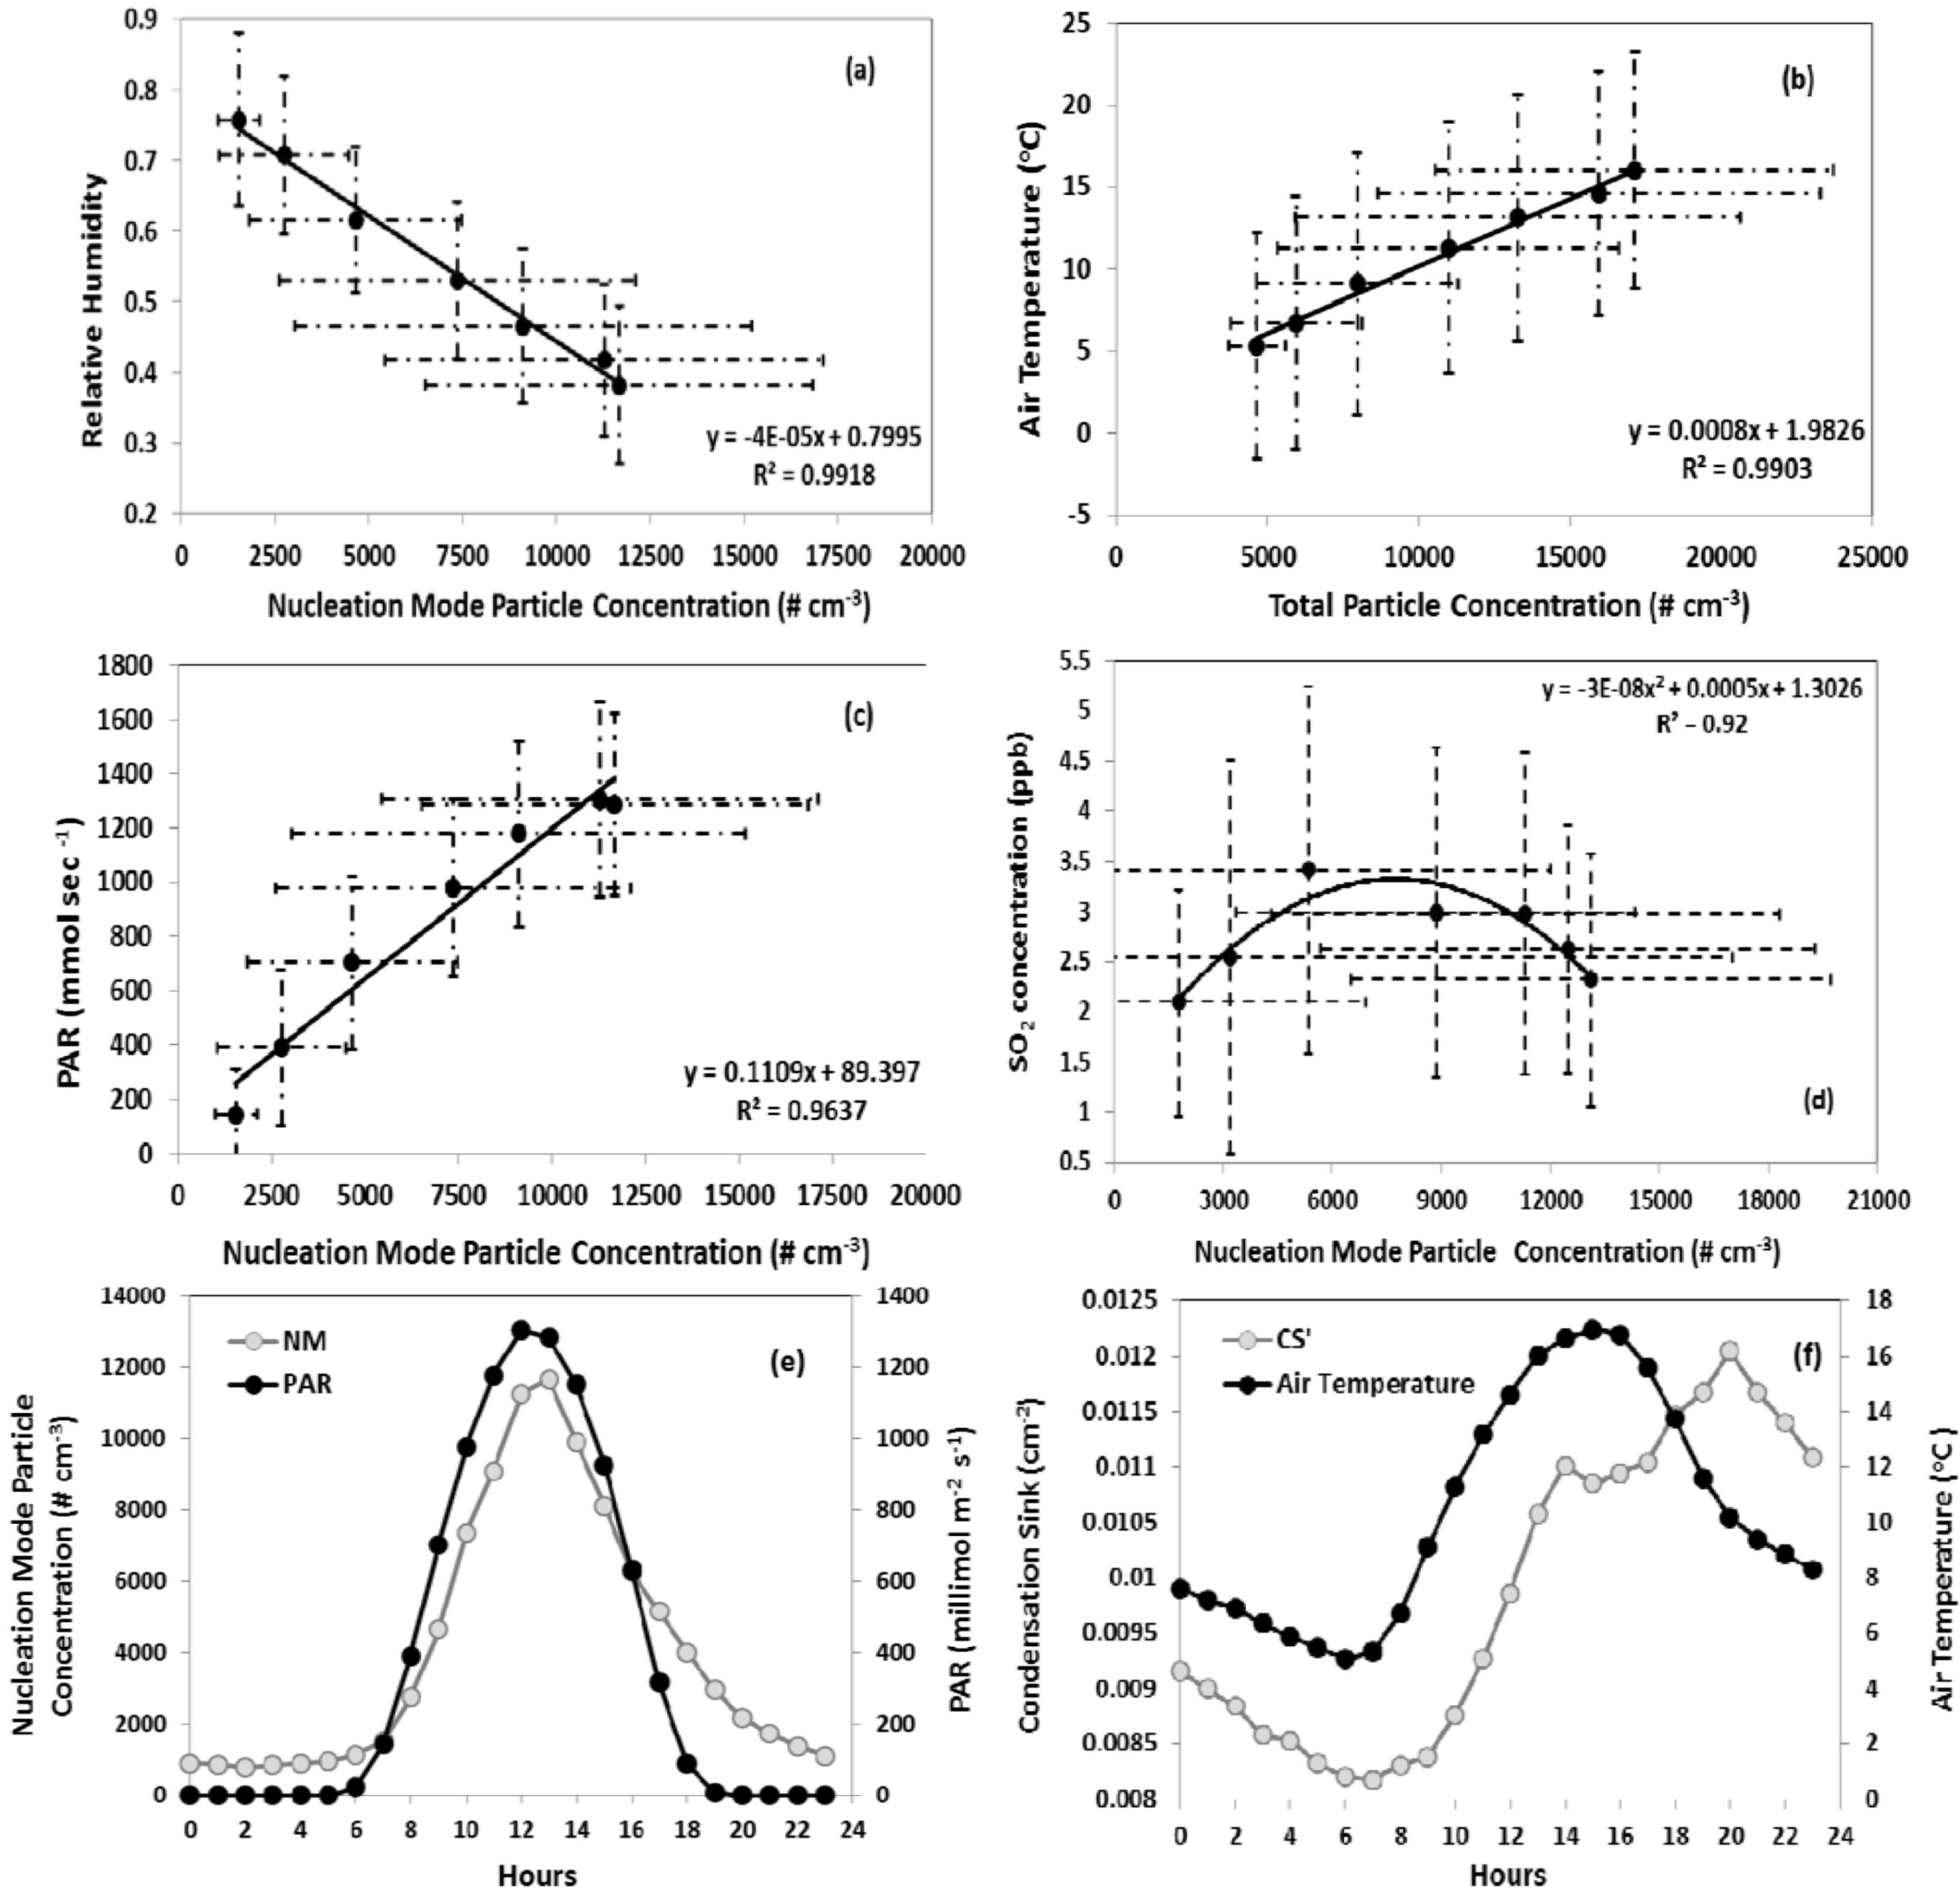
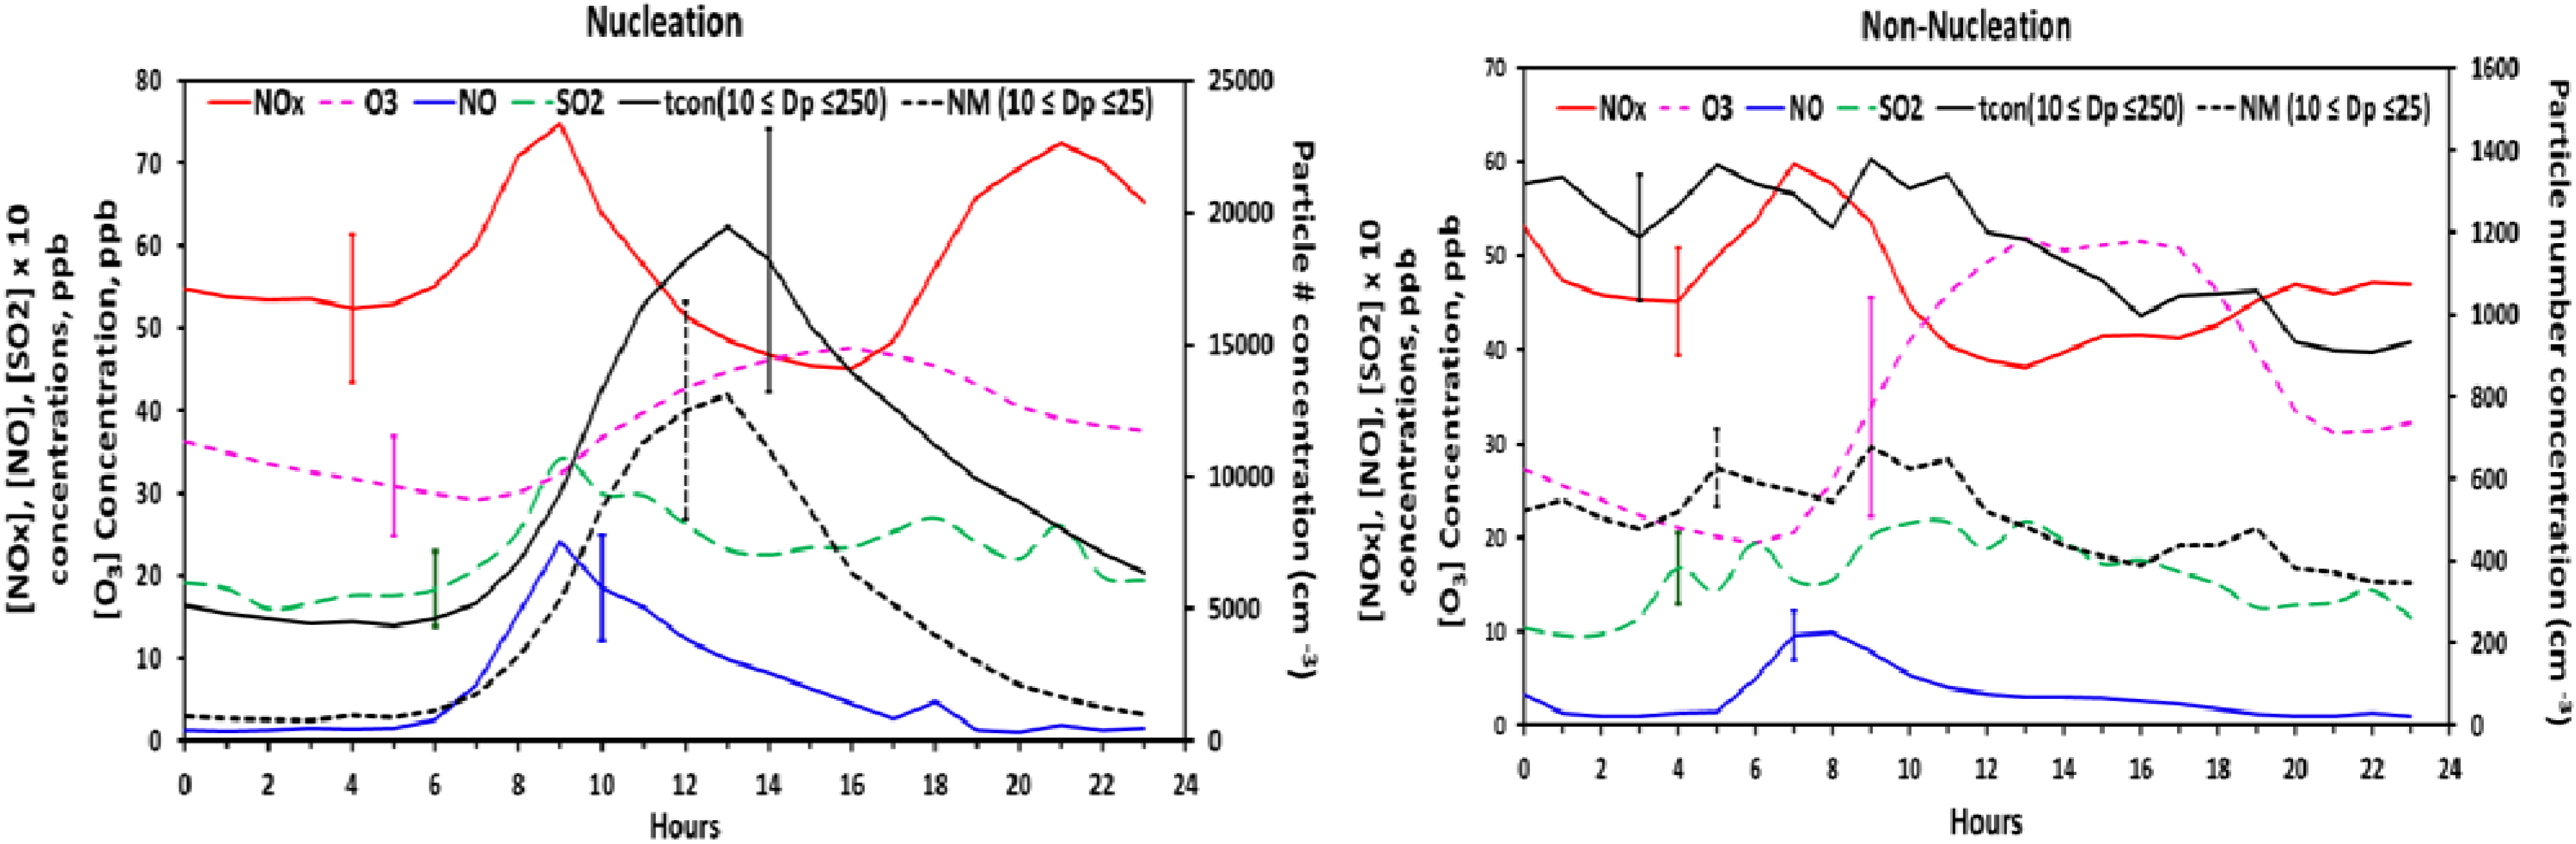
3.2. Relation to Meteorology


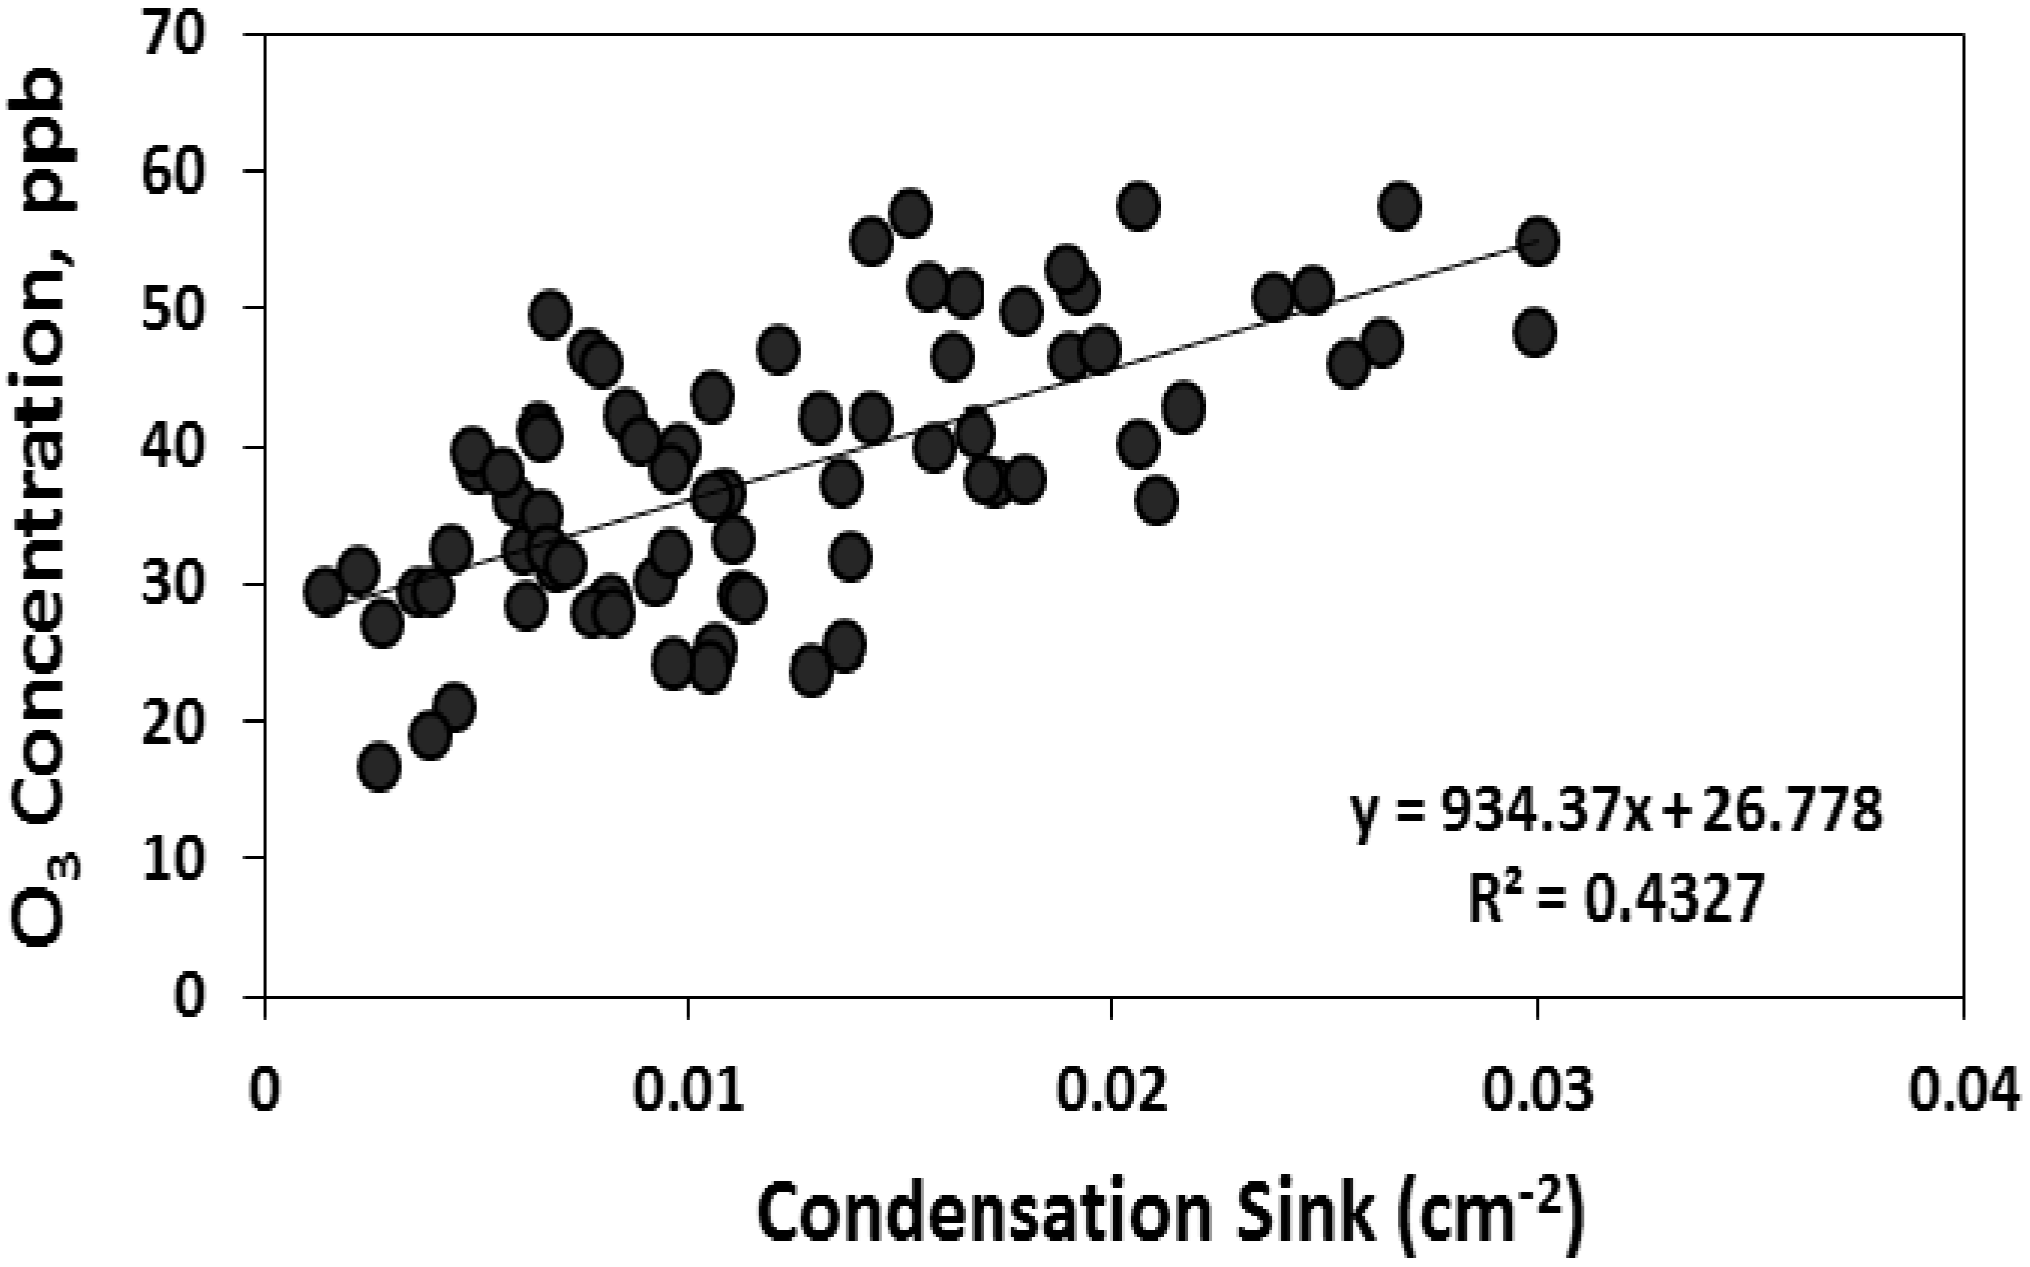
3.3. Relation to Chemistry


4. Summary and Conclusions
Acknowledgments
References
- Ramanathan, V.; Crutzen, P.J.; Kiehl, J.T.; Rosenfeld, D. Aerosols, climate and the hydrological cycle. Science 2001, 294, 2119–2124. [Google Scholar] [CrossRef]
- Climate Change 2007: The Physical Science Basis. Contribution of Working Group I to the Fourth Assessment Report of the Intergovernmental Panel on Climate Change; Solomon, S.; Qin, D.; Manning, M.; Chen, Z.; Marquis, M.; Averyt, K.B.; Tignor, M.; Miller, H.L. (Eds.) Cambridge University Press: Cambridge, UK, 2007.
- Ehn, M.; Petja, T.; Birmili, W.; Junninen, H.; Aalto, P.; Kulmala, M. Non-volatile residuals of newly formed atmospheric particles in the boreal forest. Atmos. Chem. Phys. 2007, 7, 677–684. [Google Scholar] [CrossRef]
- Kulmala, M.; Korhonen, P.; Napari, I.; Karlsson, A.; Berresheim, H.; O’Dowd, C.D. Aerosol formation during PARFORCE: Ternary nucleation of H2SO4, NH3, and H2O. J. Geophys. Res. 2002. [Google Scholar] [CrossRef]
- Kulmala, M. How particles nucleate and grow. Science 2003, 302, 1000–1001. [Google Scholar] [CrossRef]
- Yu, F.Q.; Turco, R.P. From molecular clusters to nanoparticles: Role of ambient ionization in tropospheric aerosol formation. J. Geophys. Res. 2001, 106, 4797–4814. [Google Scholar] [CrossRef]
- Zhang, R.; Suh, I.; Zhao, J.; Zhang, D.; Fortner, E.C.; Tie, X.; Molina, L.T.; Molina, M.J. Atmospheric new particle formation enhanced by organic acids. Science 2004, 304, 1487–1490. [Google Scholar] [CrossRef]
- Stanier, C.O.; Khlystov, A.Y.; Pandis, S.N. Ambient aerosol size distributions and number concentrations measured during the Pittsburgh Air Quality Study (PAQS). Atmos. Environ. 2004, 38, 3275–3284. [Google Scholar] [CrossRef]
- Kulmala, M.; Vehkamäki, H.; Petäjä, T.; Dal Maso, M.; Lauri, A.; Kerminen, V.M.; Birmili, W.; McMurry, P.H. Formation and growth rates of ultrafine atmospheric particles: A review of observations. J. Aerosol Sci. 2004, 35, 143–176. [Google Scholar] [CrossRef]
- Kulmala, M.; Petäjä, T.; Mönkkönen, P.; Koponen, I.K.; Dal Maso, M.; Aalto, P.P.; Lehtinen, K.E.J.; Kerminen, V.M. On the growth of nucleation mode particles: Source rates of condensable vapor in polluted and clean environments. Atmos. Chem. Phys. 2005, 5, 409–416. [Google Scholar] [CrossRef]
- Stanier, C.O.; Khlystov, A.Y.; Pandis, S.N. Nucleation events during the Pittsburgh air quality study: Description and relation to key meteorological, gas phase, and aerosol parameters. Aerosp. Sci. Technol. 2004, 38, 253–264. [Google Scholar] [CrossRef]
- Cheung, H.C.; Morawska, L.; Ristovski, Z.D. Observation of new particle formation in subtropical urban environment. Atmos. Chem. Phys. Discuss. 2010, 10, 22623–22652. [Google Scholar] [CrossRef]
- Jeong, C.H.; Evans, G.J.; McGuire, M.L.; Chang, R.Y.W.; Abbatt, J.P.D.; Zeromskiene, K.; Mozurkewich, M.; Li, S.M.; Leaitch, W.R. Particle formation and growth at five rural and urban sites. Atmos. Chem. Phys. Discuss. 2010, 10, 11615–11657. [Google Scholar] [CrossRef]
- Boy, M.; Kazil, J.; Lovejoy, E.R.; Guenther, A.; Kulmala, M. Relevance of ion-induced nucleation of sulfuric acid and water in the lower troposphere over the boreal forest at northern latitudes. Atmos. Res. 2008, 90, 151–158. [Google Scholar] [CrossRef]
- Gerrit, D.L.; Kunz, G.J.; Buzorius, G.; O’Dowd, C.D. Meteorological influences on coastal new particle formation. J. Geophys. Res. 2002. [Google Scholar] [CrossRef]
- O’Dowd, C.D.; Hämeri, K.; Mäkelä, J.M.; Väkeva, M.; Aalto, P.; de Leeuw, G.; Kunz, G.J.; Becker, E.; Hansson, H.-C.; Allen, A.G.; et al. Coastal new particle formation: Environmental conditions and aerosol physicochemical characteristics during nucleation bursts. J. Geophys. Res. 2002. [Google Scholar] [CrossRef]
- Place, P.F.; Ziemba, L.D.; Griffine, R.J. Observations of nucleation-mode particle events and size distributions at a rural New England site. Atmos. Environ. 2010, 44, 88–94. [Google Scholar] [CrossRef]
- Erupe, M.E.; Benson, D.R.; Li, J.; Young, L.H.; Verheggen, B.; Al-Refai, M.; Tahboub, O.; Cunningham, V.; Frimpong, E.; Viggiano, A.; et al. Correlation of aerosol nucleation rate with sulfuric acid and ammonia in Kent, Ohio: An atmospheric observation. J. Geophys. Res. 2010. [Google Scholar] [CrossRef]
- O’Halloran, T.L.; Fuentes, J.D.; Collins, D.R.; Cleveland, M.J.; Keene, W.C. Influence of air mass source region on nanoparticle events and hygroscopicity in central Virginia, U.S. Atmos. Environ. 2009, 43, 3586–3595. [Google Scholar] [CrossRef]
- Stroud, C.A.; Nenes, A.; Jimenez, J.L.; DeCarlo, P.F.; Huffman, J.A.; Bruintjes, R.; Nemitz, E.; Delia, A.E.; Toohey, D.W.; Guenther, A.B.; et al. Cloud activating properties of aerosol observed during CELTIC. J. Atmos. Sci. 2007, 64, 441–459. [Google Scholar] [CrossRef]
- Woo, K.S.; Chen, D.R.; Pui, D.Y.H.; McMurry, P.H. Measurements of Atlanta aerosol size distributions: Observations of ultrafine particle events. Aerosp. Sci. Technol. 2001, 34, 75–87. [Google Scholar]
- Pryor, S.C.; Spaulding, A.M.; Barthelmie, R.J. New particle formation in the Midwestern USA: Event characteristics, meteorological context and vertical profiles. Atmos. Environ. 2010, 44, 4413–4425. [Google Scholar] [CrossRef]
- Geron, C.D. Carbonaceous aerosol over a Pinus taeda forest in central North Carolina, USA. Atmos. Environ. 2009, 43, 659–969. [Google Scholar] [CrossRef]
- Frank, B.P.; Saltiel, S.; Hogrefe, O.; Grygas, J.; Lala, G.G. Determination of mean particle size using the electrical aerosol detector and the condensation particle counter: Comparison with the scanning mobility particle sizer. J. Aerosol Sci. 2008, 39, 19–29. [Google Scholar] [CrossRef]
- Von der Weiden, S.-L.; Drewnick, F.; Borrmann, S. Particle loss calculator—A new software tool for the assessment of the performance of aerosol inlet systems. Atmos. Meas. Tech. 2009, 2, 479–494. [Google Scholar] [CrossRef]
- Dal Maso, M.; Kulmala, M.; Riipinen, I.; Wagner, R.; Hussein, T.; Aalto, P.P.; Lehtinen, K.E.J. Formation and growth of fresh atmospheric aerosols: Eight years of aerosol size distribution data from SMEAR II, Hyytiälä, Finland. Bor. Environ. Res. 2005, 10, 323–336. [Google Scholar]
- Boy, M.; Karl, T.; Turnipseed, A.; Mauldin, R.L.; Kosciuch, E.; Greenberg, J.; Rathbone, J.; Smith, J.; Held, A.; Barsanti, K.; et al. New particle formation in the front range of the Colorado Rocky Mountains. Atmos. Chem. Phys. Discuss. 2008, 7, 15581–15617. [Google Scholar]
- Pryor, S.C.; Barthelmie, R.J.; Sørensen, L.L.; McGrath, J.G.; Hopke, P.; Petäjä, T. Spatial and vertical extent of nucleation events in the Midwestern USA: Insights from the Nucleation In Forests (NIFTy) experiment. Atmos. Chem. Phys. 2011, 11, 1641–1657. [Google Scholar]
- Dal Maso, M.; Kulmala, M.; Lehtinen, K.E.J.; Makela, J.M.; Aalto, P.; O’Dowd, C.D. Condensation and coagulation sinks and formation of nucleation mode particles in coastal and boreal forest boundary layers. J. Geophys. Res. 2002. [Google Scholar] [CrossRef]
- Kulmala, M.; Dal Maso, M.; Makela, J.M.; Pirjola, L.; Vakeva, M.; Aalto, P.; Miikkulainen, P.; Ha¨meri, K.; O’Dowd, C.D. On the formation, growth and composition of nucleation mode particles. Tellus B 2001, 53B, 479–490. [Google Scholar]
- Fuchs, N.A.; Sutugin, A.G. High-Dispersed Aerosols. In Current Aerosol Research; Hidy, G.M., Brock, J., Eds.; Pergamon: Oxford, UK, 1971; pp. 1–60. [Google Scholar]
- Kuuluvainen, H.; Kannosto, J.; Virtanen, A.; Mäkelä, J.M.; Kulmala, M.; Aalto, P.; Keskinen, J. Technical note: Measuring condensation sink and ion sink of atmospheric aerosols with the electrical low pressure impactor (ELPI). Atmos. Chem. Phys. 2010, 10, 1361–1368. [Google Scholar] [CrossRef]
- Sihto, S.L.; Kulmala, M.; Kerminen, V.M.; Dal Maso, M.; Petaja, T.; Riipinen, I.; Korhonen, H.; Arnold, F.; Janson, R.; Boy, M.; et al. Atmospheric sulphuric acid and aerosol formation: Implications from atmospheric measurements for nucleation and early growth mechanisms. Atmos. Chem. Phys. 2006, 6, 4079–4091. [Google Scholar] [CrossRef]
- McMurry, P.; Fink, M.; Sakurai, H.; Stolzenburg, M.; Mauldin, R.; Smith, J.; Eisele, F.; Moore, K.; Sjostedt, S.; Tanner, D.; et al. A criterion for new particle formation in the sulfur-rich Atlanta atmosphere. J. Geophys. Res. 2005. [Google Scholar] [CrossRef]
- Qian, S.; Sakurai, H.; McMurry, P.H. Characteristics of regional nucleation events in urban East St. Louis. Atmos. Environ. 2007, 41, 4119–4127. [Google Scholar] [CrossRef]
- Boy, M.; Kulmala, M. Nucleation events in the continental boundary layer: Influence of physical and meteorological parameters. Atmos. Chem. Phys. 2002, 2, 1–16. [Google Scholar]
- Jaatinen, A.; Hamed, A.; Joutsensaari, J.; Mikkonen, S.; Birmili, W.; Wehner, B.; Spindler, G.; Wiedensohler, A.; Decesari, S.; Mircea, M.; et al. A comparison of new particle formation events in the boundary layer at three different sites in Europe. Bor. Environ. Res. 2009, 14, 481–498. [Google Scholar]
- Berresheim, H.; Elste, T.; Tremmel, H.G.; Allen, A.G.; Hansson, H.C.; Rosman, K.; Dal Maso, M.; Makela, J.M.; Kulmala, M. Gas-aerosol relationships of H2SO4, MSA, and OH: Observations in the coastal marine boundary layer at Mace Head, Ireland. J. Geophys. Res. 2002. [Google Scholar] [CrossRef]
- Bonn, B.; Moortgat, G.K. New particle formation during α- and β-pinene oxidation by O3, OH, and NO3, and the influence of water vapor: Particle size distribution studies. Atmos. Chem. Phys. 2002, 2, 183–196. [Google Scholar] [CrossRef]
- Zhang, X.; Chen, Z.M.; Wang, H.L.; He, S.Z.; Huang, D.M. An important pathway for ozonolysis of alpha-pinene and beta-pinene in aqueous phase and its atmospheric implications. Atmos. Environ. 2009, 43, 4465–4471. [Google Scholar] [CrossRef]
- Hamed, A.; Korhonen, H.; Sihto, S.-L.; Joutsensaari, J.; Järvinen, H.; Petäjä, T.; Arnold, F.; Nieminen, T.; Kulmala, M.; Smith, J.N.; et al. The role of relative humidity in continental new particle formation. J. Geophys. Res. 2011. [Google Scholar] [CrossRef]
- Hagler, G.S.W.; Baldauf, R.W.; Thoma, E.D.; Long, T.R.; Snow, R.F.; Kinsey, J.S.; Oudejans, L.; Gullett, B.K. Ultrafine particles near a major roadway in Raleigh, North Carolina: Downwind attenuation and correlation with traffic-related pollutants. Atmos. Environ. 2009, 43, 1229–1234. [Google Scholar] [CrossRef]
- Weber, R.J.; Marti, J.J.; McMurry, P.H.; Eisele, F.L.; Tanner, D.J.; Jefferson, A. Measurements of new particle formation and ultrafine particle growth rates at a clean continental site. J. Geophys. Res. 1997, 102, 4375–4385. [Google Scholar]
- Metzger, A.; Verheggen, B.; Dommen, J.; Duplissy, J.; Prevot, A.S.H.; Weingartner, E.; Riipinen, I.; Kulmala, M.; Spracklen, D.V.; Carslaw, K.S.; et al. Evidence for the role of organics in aerosol particle formation under atmospheric conditions. Proc. Natl. Acad. Sci. USA 2010, 107, 6646–6651. [Google Scholar] [CrossRef]
- Laaksonen, A.; Kulmala, M.; O’Dowd, C.D.; Joutsensaari, J.; Vaattovaara, P.; Mikkonen, S.; Lehtinen, K.E.J.; Sogacheva, L.; Dal Maso, M.; Aalto, P.; et al. The role of VOC oxidation products in continental new particle formation. Atmos. Chem. Phys. 2008, 8, 2657–2665. [Google Scholar]
- Geron, C.D. Carbonaceous aerosol characteristics over a Pinus taeda plantation: Results from the CELTIC experiment. Atmos. Environ. 2011, 45, 794–801. [Google Scholar] [CrossRef]
- Guenther, A.; Zimmerman, P.R.; Harley, P. Isoprene and monoterpenes emission rate variability: Model evaluations and sensitivity analysis. J. Geophys. Res. 1993, 98, 12609–12617. [Google Scholar] [CrossRef]
- Geron, C.D.; Arnts, R.R. Seasonal monoterpene and sesquiterpene emissions from Pinus taeda and Pinus virginiana. Atmos. Environ. 2010, 44, 4240–4251. [Google Scholar] [CrossRef]
- Stroud, C.; Makar, P.; Karl, T.; Guenther, A.; Geron, C.; Turnipseed, A.; Nemitz, E.; Baker, B.; Potosnak, M.; Fuentes, J.D. Role of canopy-scale photochemistry in modifying biogenic-atmosphere exchange of reactive terpene species: Results from the CELTIC field study. J. Geophys. Res. 2005. [Google Scholar] [CrossRef]
© 2013 by the authors; licensee MDPI, Basel, Switzerland. This article is an open access article distributed under the terms and conditions of the Creative Commons Attribution license (http://creativecommons.org/licenses/by/3.0/).
Share and Cite
Pillai, P.; Khlystov, A.; Walker, J.; Aneja, V. Observation and Analysis of Particle Nucleation at a Forest Site in Southeastern US. Atmosphere 2013, 4, 72-93. https://doi.org/10.3390/atmos4020072
Pillai P, Khlystov A, Walker J, Aneja V. Observation and Analysis of Particle Nucleation at a Forest Site in Southeastern US. Atmosphere. 2013; 4(2):72-93. https://doi.org/10.3390/atmos4020072
Chicago/Turabian StylePillai, Priya, Andrey Khlystov, John Walker, and Viney Aneja. 2013. "Observation and Analysis of Particle Nucleation at a Forest Site in Southeastern US" Atmosphere 4, no. 2: 72-93. https://doi.org/10.3390/atmos4020072