Article

Characteristics of Organic and Elemental Carbon in PM2.5 and PM0.25 in Indoor and Outdoor Environments of a Middle School: Secondary Formation of Organic Carbon and Sources Identification

1
Department of Environmental Science and Engineering, Xi'an Jiaotong University, Xi'an 710049, China
2
Key Lab of Aerosol Chemistry & Physics, Institute of Earth Environment, Chinese Academy of Sciences, Xi'an 710061, China
3
Laboratoire d'Aerologie, Observatory Midi-Pyrenees, CNRS—University of Toulouse, Toulouse 31400, France
4
School of Public Health and Primary Care, The Chinese University of Hong Kong, Hong Kong, China
5
School of Human Settlements and Civil Engineering, Xi'an Jiaotong University, Xi'an 710049, China
6
Shaanxi Meteorological Bureau, Xi'an 710014, China
7
Laboratory of Atmospheric Chemistry, Paul Scherrer Institute (PSI), 5232 Villigen, Switzerland
8
Centre for Climate and Air Pollution Studies, Ryan Institute, National University of Ireland Galway, Galway, Ireland
9
Institute of Global Environmental Change, Xi'an Jiaotong University, Xi'an 710049, China
*
Authors to whom correspondence should be addressed.
Atmosphere 2015, 6(3), 361-379; https://doi.org/10.3390/atmos6030361
Submission received: 24 December 2014 / Revised: 13 February 2015 / Accepted: 27 February 2015 / Published: 17 March 2015
(This article belongs to the Special Issue Sources, Formation and Impacts of Secondary Aerosol)

Abstract

:
Secondary organic carbon (SOC) formation and its effects on human health require better understanding in Chinese megacities characterized by a severe particulate pollution and robust economic reform. This study investigated organic carbon (OC) and elemental carbon (EC) in PM2.5 and PM0.25 collected 8–20 March 2012. Samples were collected inside and outside a classroom in a middle school at Xi’an. On average, OC and EC accounted for 20%–30% of the particulate matter (PM) mass concentration. By applying the EC-tracer method, SOC’s contribution to OC in both PM size fractions was demonstrated. The observed changes in SOC:OC ratios can be attributed to variations in the primary production processes, the photochemical reactions, the intensity of free radicals, and the meteorological conditions. Total carbon (TC) source apportionment by formula derivation showed that coal combustion, motor vehicle exhaust, and secondary formation were the major sources of carbonaceous aerosol. Coal combustion appeared to be the largest contributor to TC (50%), followed by motor vehicle exhaust (25%) and SOC (18%) in both size fractions.

1. Introduction

Organic carbon (OC) and elemental carbon (EC) are the major components of ambient atmospheric aerosols that originate from natural and anthropogenic combustion sources. Total carbon (i.e., the sum of OC and EC or carbonaceous aerosol) contribution to the mean China urban aerosol mass ranges from 20% to 50% in both fine and coarse fractions [1,2,3,4,5,6,7,8,9,10,11,12,13,14,15]. OC and EC have long been studied to investigate their effects on the regional climate, air quality, and visibility in China [16,17,18]. However, these indicators are of concern owing to their possible adverse effects on human health, as several studies have supported a positive correlation between exposure to OC or EC and the exacerbation of cardiopulmonary diseases or the increase of daily mortality [19,20,21,22].
EC is a primary product emitted from combustion processes and OC exists in two forms: (i) Primary OC (POC), which is directly emitted into the atmosphere either from fossil fuel combustion by industries, road transportation, and the residential sector or by biomass burning; and (ii) secondary OC (SOC), which is formed through atmospheric oxidation of volatile organic compounds (VOCs) and gas-to-particle conversion processes. Huang et al. showed that the severe haze pollution events during winters in China were generally caused by secondary aerosol formation, which contributed 30%–77% of PM2.5 (particulate matter with aerodynamic diameters ≤ 2.5 μm) and 44%–71% of organic aerosols [23]. The estimation of the sources and concentrations of SOC is therefore crucial to understand the formation mechanisms of haze and assess its related health effects. However, there is currently no direct analysis method available to separate and quantify POC from SOC in aerosols [24].
Indirect quantitative methods can be summarized as follows:
1. The tracer methods: (i) The widely-accepted EC-tracer method uses EC to trace any primary sources and calculate the primary OC in ambient samples given the OC/EC ratio provided from primary emissions and ambient OC and EC concentration data [24]; and (ii) the secondary organic aerosol (SOA)-tracer method identifies a series of tracer compounds in SOA based on chamber experiments. Ratios of these tracers to SOA or SOC obtained from the chamber simulation are used to estimate SOA or SOC from different precursors using literature data of measured tracers in ambient samples [25].
2. The chemical transport models: (i) Reactive chemical transport models are used for predicting the concentrations of POC and SOC. This model includes emission, dispersion, and chemical transformation of gaseous and particulate OC [26,27]; and (ii) non-reactive transport models are used to estimate POC first, then SOC is calculated at ambient monitoring sites by subtracting the model POC from the measured OC [28].
3. Joint approaches: They include approaches such as the EC-tracer method combined with radiocarbon (14C) analysis [29], radiocarbon analysis with chemical mass balance (CMB) [30], and the direct estimation of SOC with input of secondary species when applying the positive matrix factorization (PMF) model [31]. Last, aerosol mass spectrometry (AMS) is an advanced approach providing high time resolution [32].
Xi’an, the largest urban area in northwest China, is located in the middle of the Central Shaanxi Plain on the Yellow River and has a population of more than eight million. The city suffers from severe local and regional air pollution problems caused by rapid Chinese economic development over the past two decades. A total of 1741 elementary and secondary schools were recorded in 2012, including 962,000 students aged from 6 to 18 [33]. On average, over the school year period (holidays excluded), students spend 30%–50% of their time at school. Children are especially vulnerable to air pollutants because their respiratory systems are not fully developed yet [34,35]. Many studies have demonstrated that elevated particulate matter (PM) concentrations in classrooms may have a significant adverse effect on children’s health and performance [36,37]. However, there are only a limited number of studies concerning the chemical properties (e.g., OC and EC) of PM in school environments in China [38,39,40].This study therefore aims to (i) characterize the indoor and outdoor OC and EC concentrations in PM2.5 and PM0.25 (PM with aerodynamic diameters ≤ 0.25 μm) in Xi’an during the end of winter 2012 at a middle school; (ii) investigate SOC mass contribution to OC and the SOC sources; and (iii) apportion TC contributions from coal combustion, motor vehicle exhaust, secondary formation, and other primary emissions. Outputs from this study may lead to better understanding about the SOC formation mechanisms of different size particles outdoors and indoors in Chinese cities experiencing serious PM pollution and to establishing source emission control strategies for particulate matter, especially for carbonaceous aerosol.

2. Materials and Methods

2.1. Site Description

The targeted middle school is located approximately 5 km south of Xi’an city center, in a commercial and residential area. The school environment was not under the direct influence of any industrial emissions, nor traffic as the closest main road is more than 300 m away. Indoor sampling was set up in a classroom located on the second floor, about 8 m above ground level. It was occupied by the same 30 students, aged between 12 and 14, from Monday to Friday, 8:00 am to 12:00 am and 1:30 pm to 5:30 pm local time. Indoor samplers were located in the back of the classroom and their inlets were set up 1.2 m above the ground. The same instrumental package was set up outdoors, at the end of the corridor passing alongside the surveyed classroom, about 6 m away from the indoor sampling site. The location of the outdoor sampling site was defined to account for the ambient air inside the school environment and not for the air from the street. The classroom was ventilated manually using two large windows, each 1.8 × 1.5 m in size, located on both sides of the classroom. One side was connected to a small street and the other one to the inner corridor. Windows remained opened during school hours but were closed after school and during the weekends.

2.2. PM Sample Collection

PM2.5 and PM0.25 were synchronously sampled on pre-fired (780 °C, 3 h) 47 mm Whatman quartz microfiber filters (QM/A, Whatman Inc., UK) indoors and outdoors during the period 8–20 March 2012 over 24-h period from 8:00 am local time onwards. Daily PM2.5 samples were continuously collected using mini-volume air samplers (Airmetrics, OR, USA) at a flow rate of 5 L∙min−1. Daily PM0.25 samples were collected from the last particle size stage of a Sioutas Personal Cascade Impactor (SKC Inc., Fullerton, CA, USA) operating at 9 L∙min−1. Particles whose diameter is equal to or lower than 0.25 µm are hereafter either defined as PM0.25 or very fine particles (VFP). Their collection was controlled by an electrical timer, which allowed both indoor and outdoor sampling to run for 30 min every hour to avoid overloading, that is, 12 h for every 24 h. Twenty-six indoor and 26 outdoor samples were collected in total, excluding field blanks for this study.

2.3. PM Gravimetric and Chemical Analysis

PM samples were weighed on a Sartorius ME 5-F electronic microbalance (sensitivity ±1 μg, Sartorius, Germany) before and after sampling, after equilibration for 24 h at 20–23 °C and 35%–45% of relative humidity, in order to determine mass concentrations. The absolute errors between duplicate weights were less than 0.015 mg for blank filters and 0.020 mg for samples. The exposed quartz fiber filters were stored in a refrigerator at <−4 °C prior to chemical analysis to prevent evaporation of volatile components.
OC and EC were analyzed for each sample from a 0.5 cm2 punch using a Desert Research Institute (DRI) Model 2001 Thermal/Optical Carbon Analyzer (Atmoslytic Inc., Calabasas, CA, USA) following the IMPROVE_A (Interagency Monitoring of Protected Visual Environment) thermal/optical reflectance (TOR) protocol. The method provided data following four OC fractions (OC1, OC2, OC3, and OC4 in a non-oxidizing Helium (He) atmosphere at 140 °C, 280 °C, 480 °C, and 580 °C, respectively), one OP fraction (a pyrolyzed carbon fraction, obtained in an oxidizing atmosphere and determined when the reflected laser light reaches its original intensity) and three EC fractions (EC1, EC2m and EC3 in an oxidizing atmosphere of 2% O2 in a balance of 98% He at 580 °C, 780 °C, and 840 °C, respectively). The IMPROVE_A protocol defines TC as OC + EC, OC as OC1 + OC2 + OC3 + OC4 + OP, and EC as EC1 + EC2 + EC3 − OP. The detailed determination procedures of OC, EC, and the QA/QC can be viewed in Chow et al. [41,42] and Cao et al. [8].

3. Results and Discussion

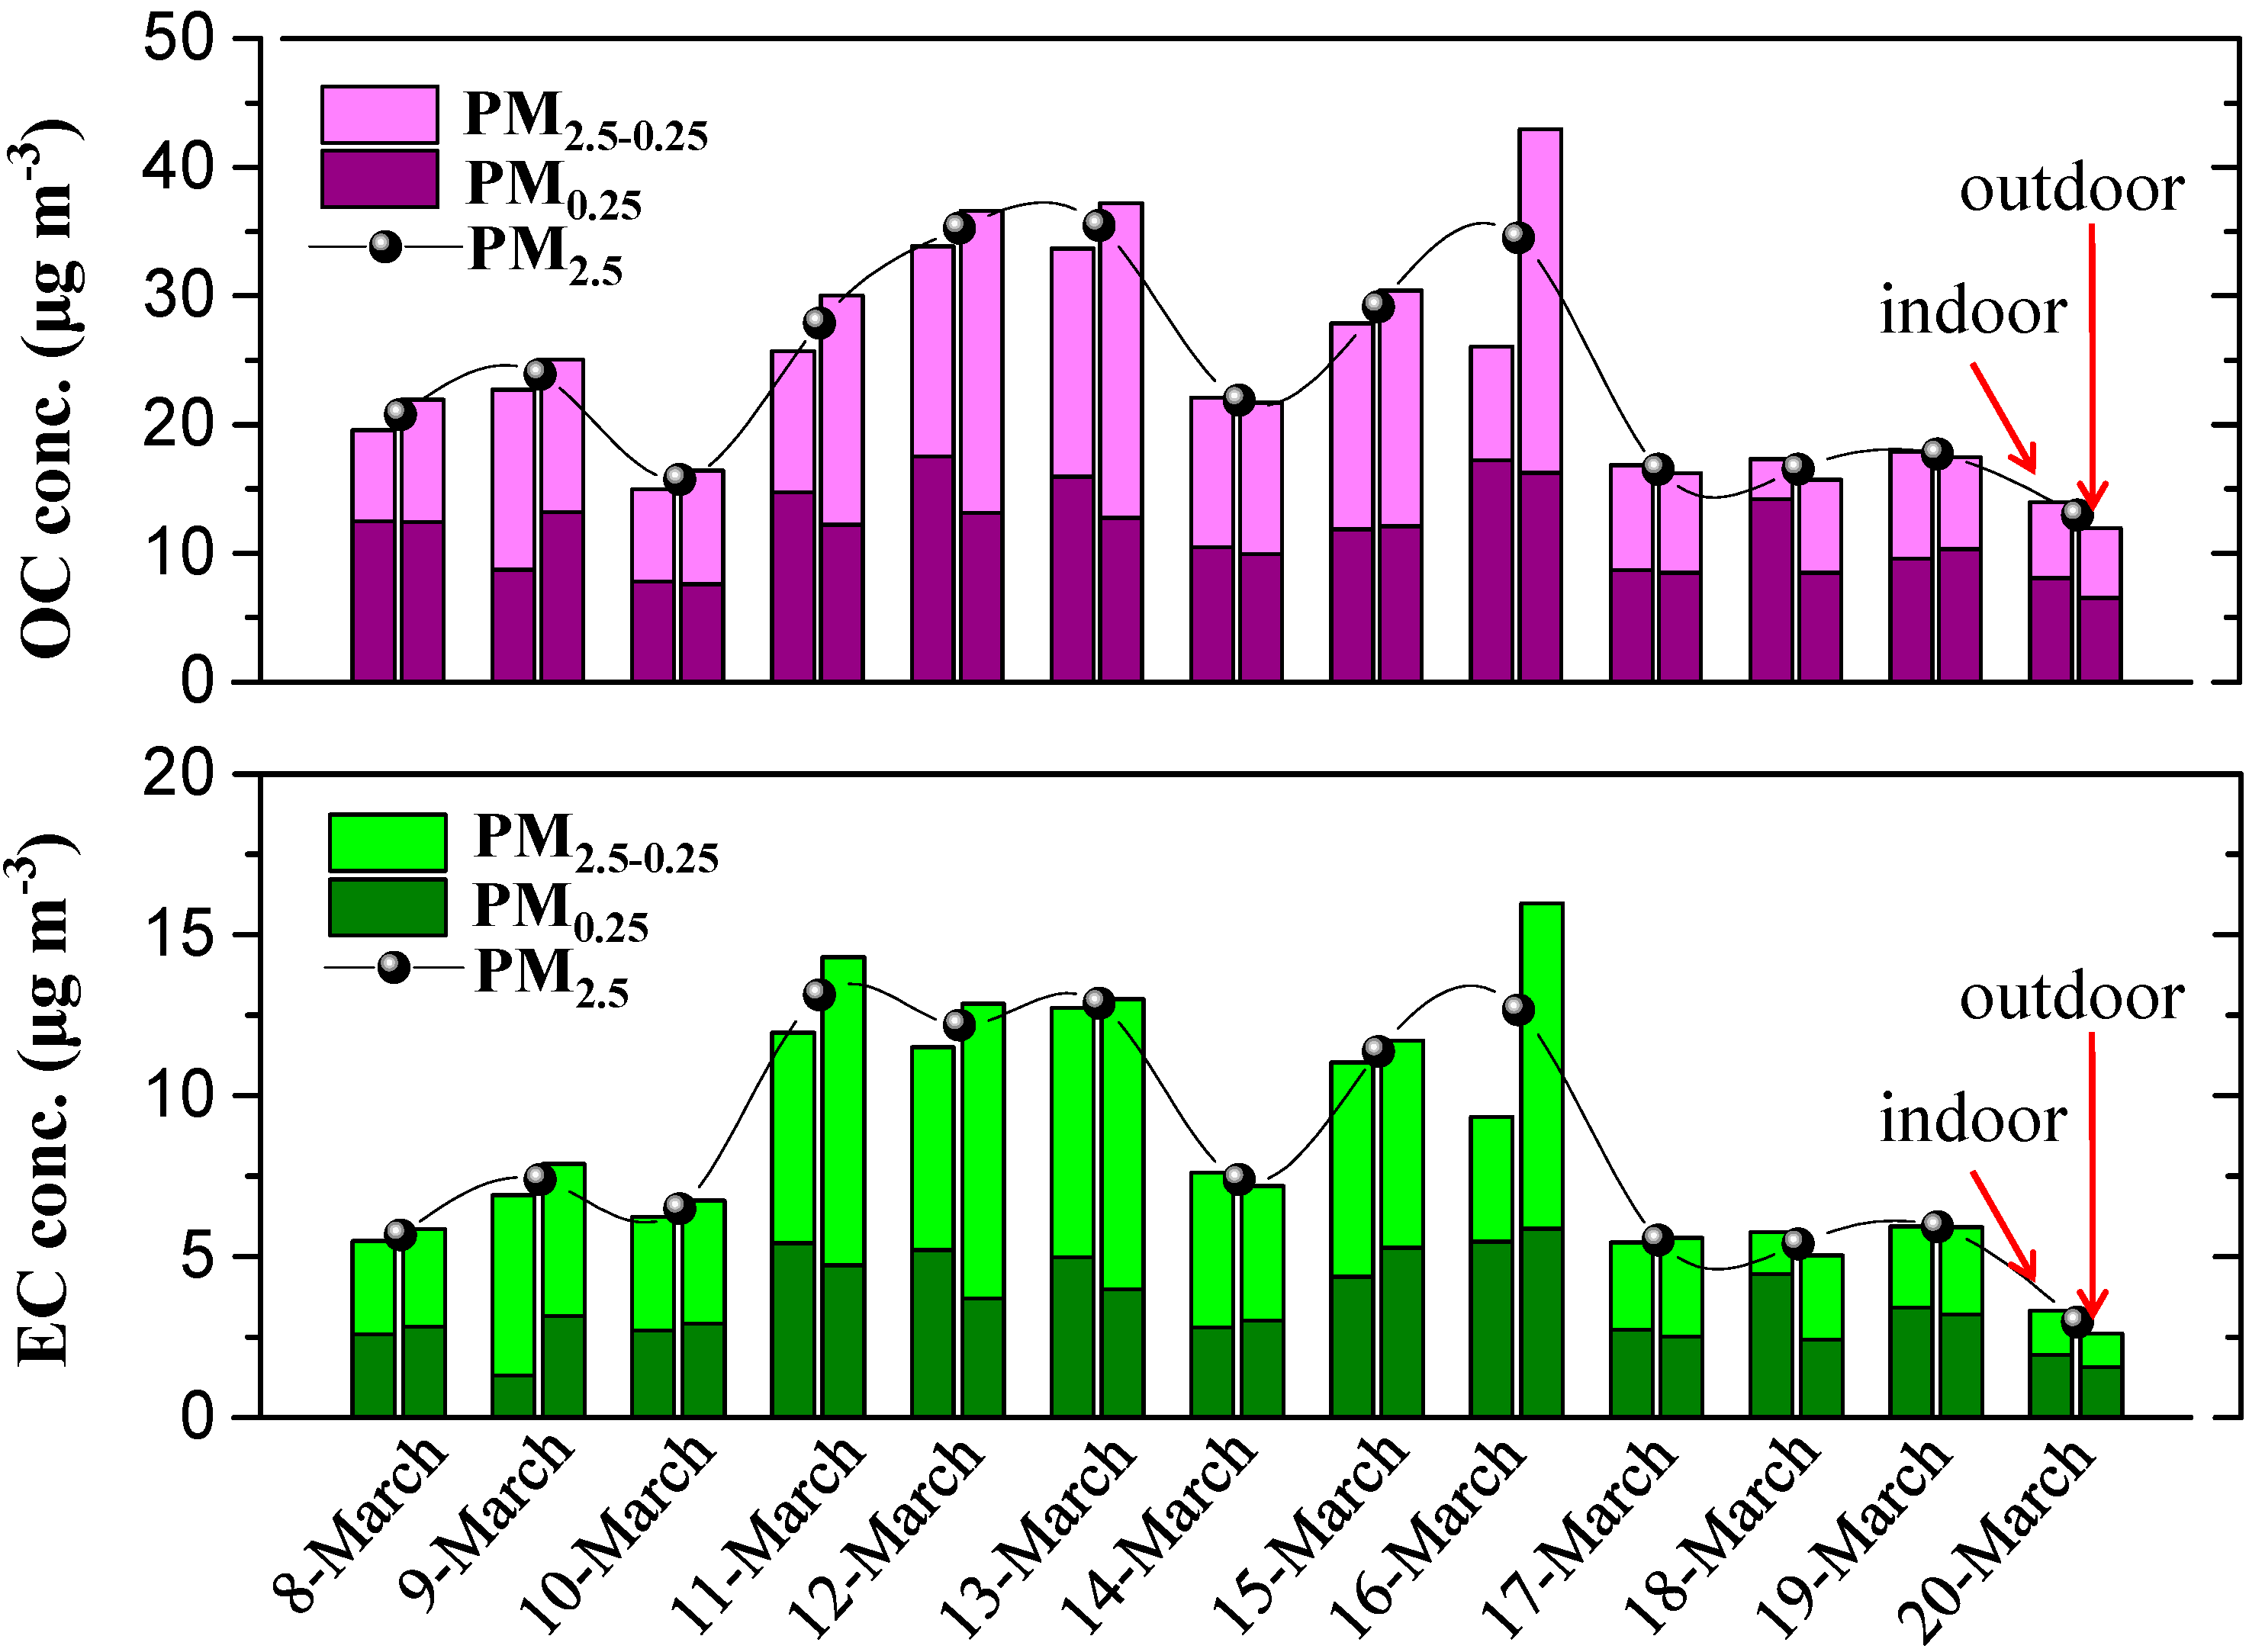
3.1. OC and EC Concentrations in PM2.5 and PM0.25

The indoor and outdoor PM2.5 and PM0.25 mass concentrations are summarized in Table 1. PM2.5 and PM0.25 indoor concentrations averaged 141.8 ± 42.5 and 53.5 ± 22.9 μg∙m−3, while the outdoor concentrations averaged 167.8 ± 58.6 and 49.1 ± 17.3 μg∙m−3, respectively. The PM0.25/PM2.5 mass ratios over 24 h averaged 37.8%, ranging from 25.1% to 59.3% indoors, and averaged 29.3%, ranging from 23.0% to 41.2% outdoors. PM0.25/PM2.5 mass ratios hence appear to be nearly 9% higher indoors than outdoors. The indoor-to-outdoor ratio (I/O) ranged from 0.7 to 1.1 (averaged 0.8) for PM2.5, and from 0.5 to 1.6 (averaged 1.1) for PM0.25. This suggests not only that the contribution of PM0.25 to PM2.5 is higher indoors, but also that there are more PM0.25 indoors than outdoors. Specific sources of PM0.25 mass in the classroom may originate from students and/or teachers, such as coughing, sneezing, usage of cleaning products, and smoking [43,44,45,46,47,48]. A bias may have been created by the input of PM0.25 coming from the street via a window, while the outdoor sampling site located within the school was less affected.
Table 1. PM2.5 and PM0.25 mass concentrations inside the classroom and outdoors during the sampling period in Xi’an, China.
SitePM2.5 (μg∙m−3)PM0.25 (μg∙m−3)PM0.25/PM2.5 (%)
Concentration aN bConcentration aN bAverageRange
Indoor141.8 ± 42.51353.5 ± 22.91337.825.1–59.3
Outdoor167.8 ± 58.61349.1 ± 17.31329.323.0–41.2
I/O c0.8131.1131.3/
a Values represent average ± standard deviation; b Number of sample; c Indoor to outdoor ratio.
Descriptive statistics of TC, OC, and EC concentrations in PM2.5 and PM0.25 in the indoor and outdoor environments of the classroom are summarized in Table 2. The average TC, OC, and EC concentrations in PM2.5 were 30.5 ± 9.5, 22.5 ± 6.6, and 7.9±3.0 μg∙m−3 indoors, and 33.7 ± 13.8, 24.9 ± 9.8, and 8.8 ± 4.2 μg∙m−3 outdoors, respectively. As for the VFP fraction, TC, OC, and EC were found to be 15.8 ± 4.8, 12.1 ± 3.5, and 3.6 ± 1.4 μg∙m−3 indoors, and 14.5 ± 3.8, 11.0 ± 2.7, and 3.6 ± 1.2 μg∙m−3 outdoors, respectively. OC concentrations were in general 2.0 ± 0.5 times higher than EC (Table 2 and Figure 1). The PM0.25/PM2.5 ratios were similar for TC, OC, and EC in mass (0.4 to 0.5), which were higher than the proportions in mass of PM0.25 in PM2.5, suggesting that TC, OC, and EC are inclined to accumulate in the smaller particles. As also shown in Table 2, for indoors, TC, OC, and EC accounted for on average 21.5%, 15.9%, and 5.6% of PM2.5 mass loading, and 29.4%, 22.6%, and 6.8% of PM0.25 mass loading, respectively; corresponding for outdoors, TC, OC, and EC accounted for on average 20.1%, 14.8%, and 5.3% of PM2.5 mass loading, and 29.6%, 22.5%, and 7.3% of PM0.25 mass loading, respectively. These also showed that TC, OC, and EC tend to concentrate in finer particle fraction (PM0.25), consistent with previous studies [3,13,49].
Table 2. The concentrations of OC and EC in PM2.5 and PM0.25 inside the classroom and outdoors.
SiteTC (μg∙m−3)OC (μg∙m−3)EC (μg∙m−3)
PM2.5 aPM0.25 aRatio bPM2.5 aPM0.25 aRatio bPM2.5 aPM0.25 aRatio b
Indoor30.5 ± 9.515.8 ± 4.80.522.5 ± 6.612.1± 3.50.57.9 ± 3.03.6 ± 1.40.5
C/PM (%)c21.529.41.415.922.61.45.66.81.2
Outdoor33.7 ± 13.814.5 ± 3.80.424.9 ± 9.811.0 ± 2.70.48.8 ± 4.23.6 ± 1.20.4
C/PM (%)c20.129.61.514.822.51.55.37.31.4
a Values represent average ± standard deviation; b PM0.25 to PM2.5 ratio; c Percentage of carbonaceous aerosol concentration to PM mass concentration.
Figure 1. Time variations of OC and EC concentrations in PM2.5 and PM0.25 inside the classroom (left one of a couple of bars) and outdoors (right one of a couple of bars) in Xi’an, 2012.
Atmosphere 06 00361 g001
Figure 1 shows the temporal variations of OC and EC over the study period. OC appears highly correlated with EC indoors and outdoors, in both PM2.5 and PM0.25 (see more details in Section 3.2.2.). OC and EC concentrations varied significantly with time, ranging in PM2.5 from 12.0 to 43.0 μg∙m−3 for OC, and from 2.6 to 16.0 μg∙m−3 for EC. In PM0.25, OC ranged from 6.5 to 16.2 μg∙m−3 and EC from 1.6 to 5.9 μg∙m−3. OC and EC concentrations were slightly higher during the weekdays than weekends due to the increase in traffic volume and congestion on weekdays. However, the “weekend effect” was offset by the relatively long distance (300 m) between the sampling site and the closest road. Moreover, Xi’an has a formal heating season from 15 November to 15 March. OC and EC concentrations significantly decreased in the post-heating period of observation—typically by 40% to 50%. The highest numbers, displayed on 16 March, can be explained by the stable meteorological conditions on that day, a possible “hysteresis effect” on particle diffusion, or a delay in turning off the heating system.

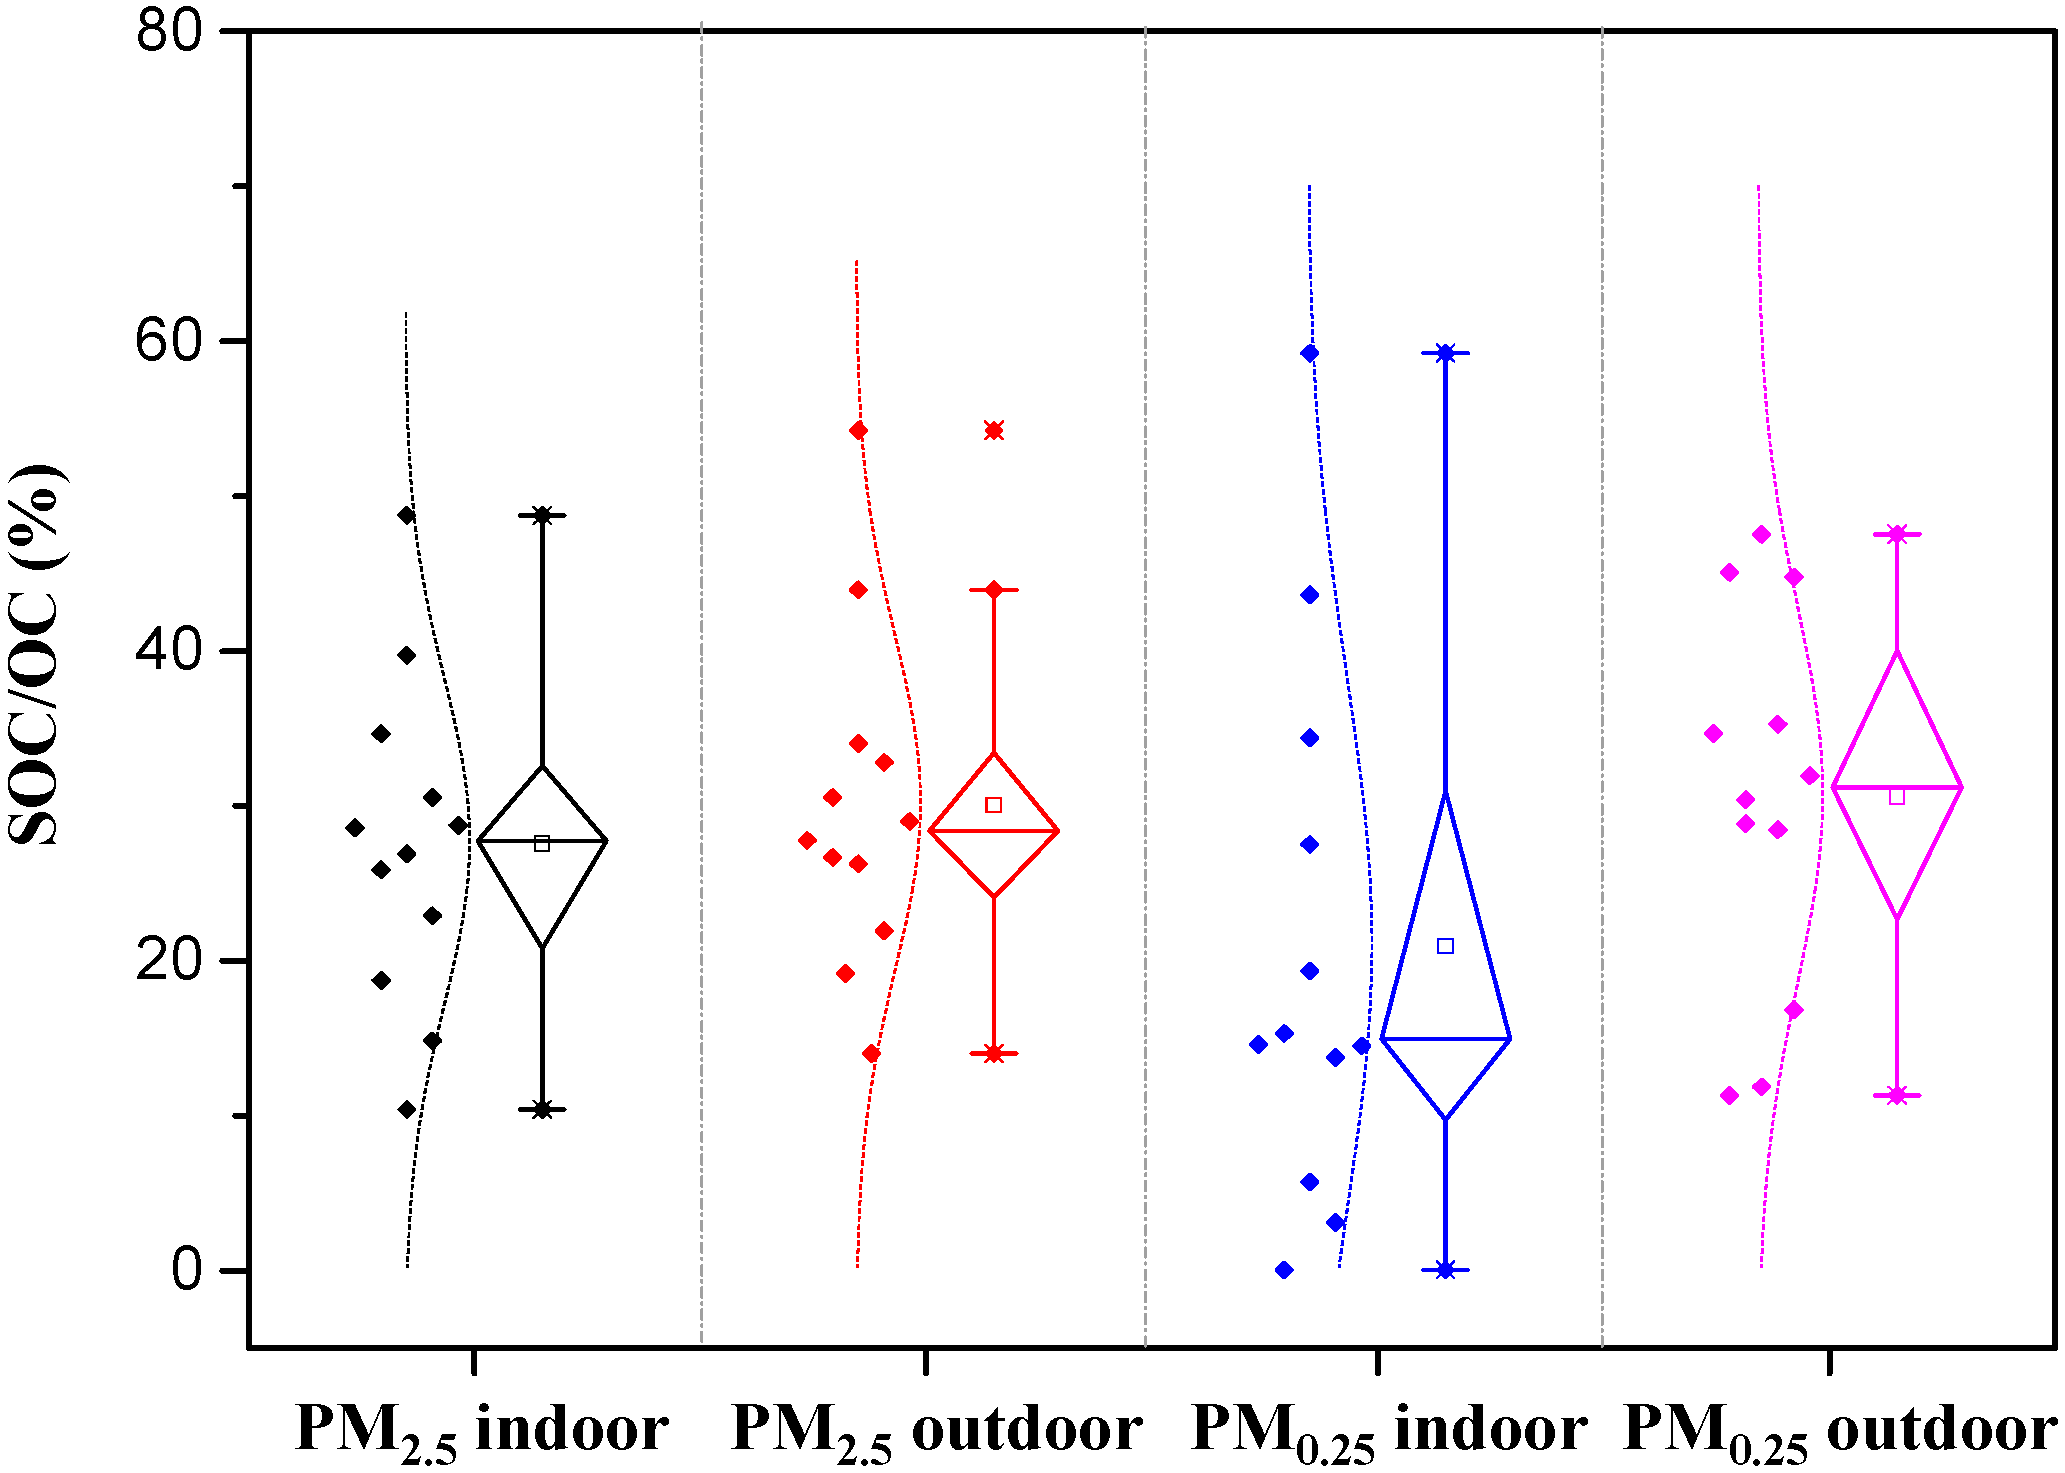
3.2. Identification of SOC and Its Sources

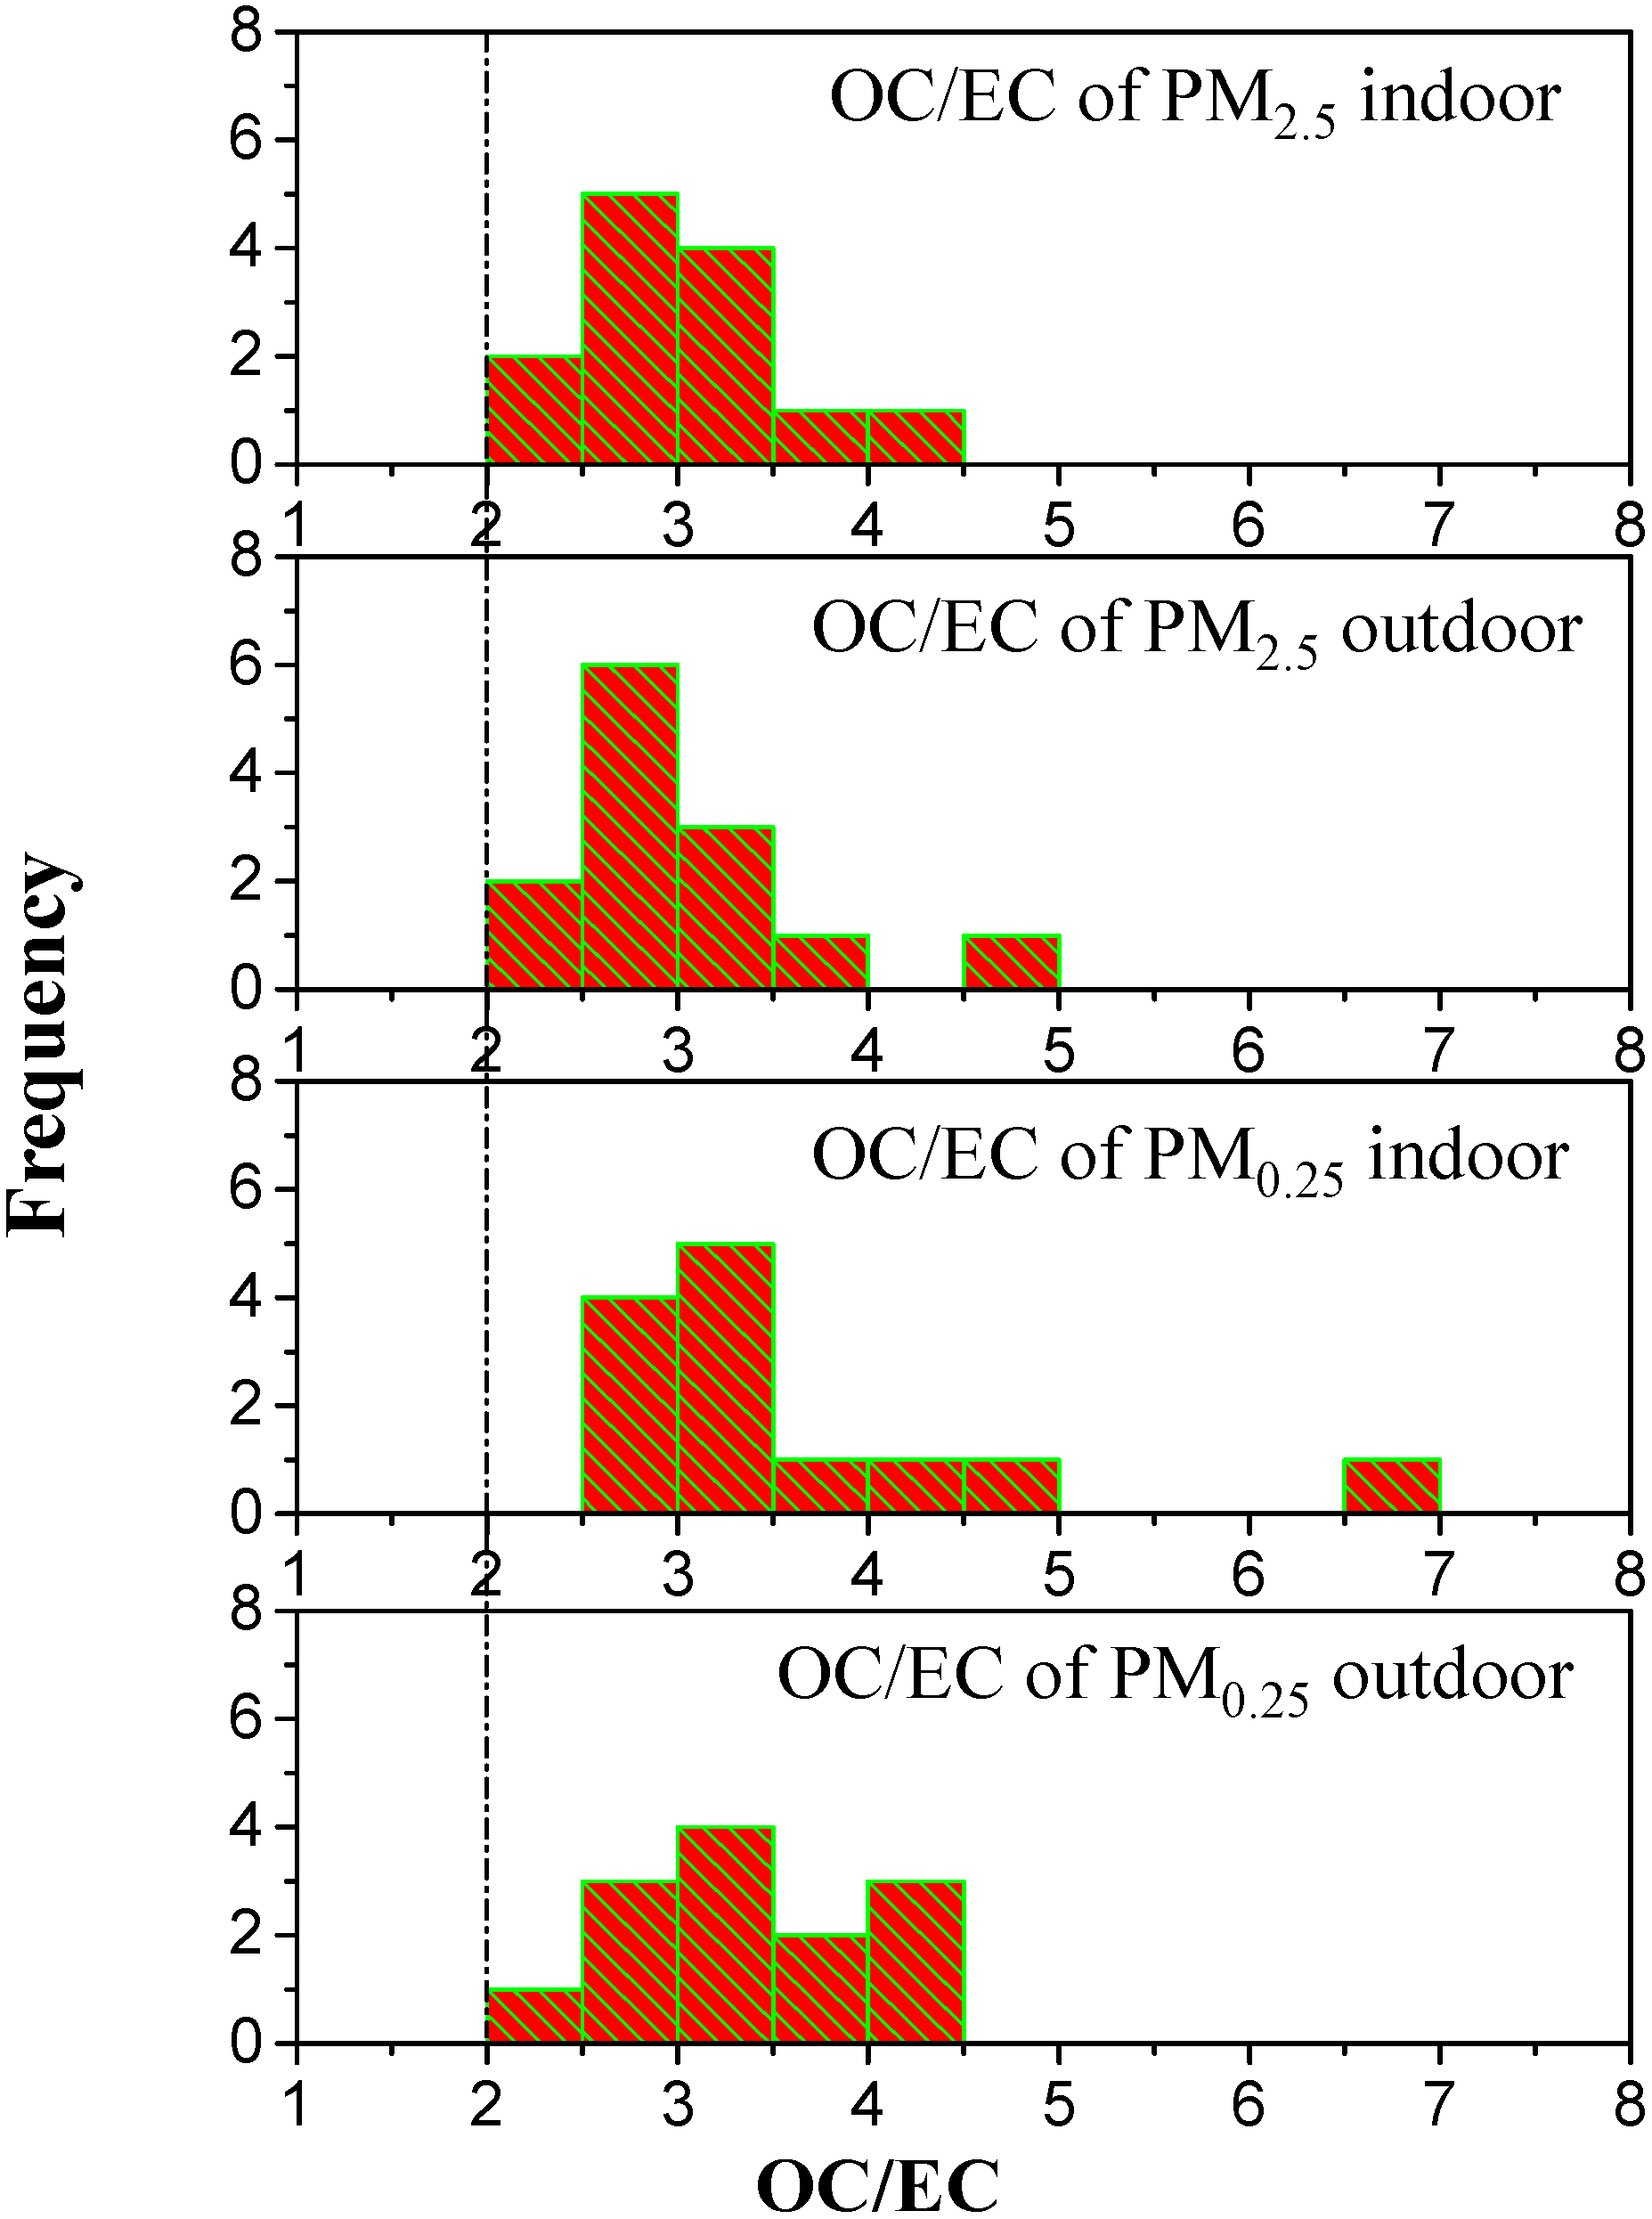
3.2.1. Ratios of OC to EC

The OC-to-EC ratio (OC/EC) has been used to determine the emission and transformation characteristics of carbonaceous aerosols. OC/EC exceeding 2.0 indicates the presence of SOA or SOC [50]. The frequency histogram of OC/EC ratios in PM2.5 and PM0.25 inside the classroom and outdoors are shown in Figure 2. For each aerosol size fraction, either collected indoors or outdoors, the OC/EC values were higher than 2.0, thus suggesting the presence of SOA or SOC. OC/EC ratios were compared for PM2.5 and PM0.25 in Table 3. The highest ratio was recorded on 9 March, with 6.7 in PM0.25 indoors. As shown in Figure 2, the highest frequency of OC/EC ratios was observed in the subsection of 2.5 to 3.0, with the counts of 18. The following one was between 3.0 and 3.5.
Figure 2. Frequency histogram of OC-to-EC ratios (OC/EC) in PM2.5 and PM0.25 inside the classroom and outdoors.
Atmosphere 06 00361 g002
Table 3. SOC concentrations in PM2.5 and PM0.25 inside the classroom and outdoors, estimated from the EC-tracer method.
SiteOC/EC(OC/EC)min aSOC (μg∙m−3)SOC/OC (%)
PM2.5PM0.25PM2.5PM0.25PM2.5PM0.25PM2.5PM0.25
Indoor3.03.62.22.75.42.225.419.3
Outdoor3.03.32.12.36.43.127.728.2
Average3.03.52.12.55.92.626.623.8
a Minimum of OC to EC ratio.
Literature data suggested that average OC/EC ratios of 2.7 characterize coal combustion, with 1.1 for motor vehicle exhaust [51] and 9.0 for biomass burning [52] (Figure 3). In China, the available OC/EC ratios in PM2.5 for cities such as Guangzhou [3] and Hong Kong [3,7] showed relatively low values (i.e., 2.0 and 2.7, respectively) which suggests the predominant contribution of motor vehicle emissions. High OC/EC ratios (3.2) in the present study point to coal combustion emissions as the main contributor to winter carbonaceous aerosol levels in Xi’an.
Figure 3. OC-to-EC ratios (OC/EC) in PM2.5 and PM0.25 inside the classroom and outdoors.
Atmosphere 06 00361 g003

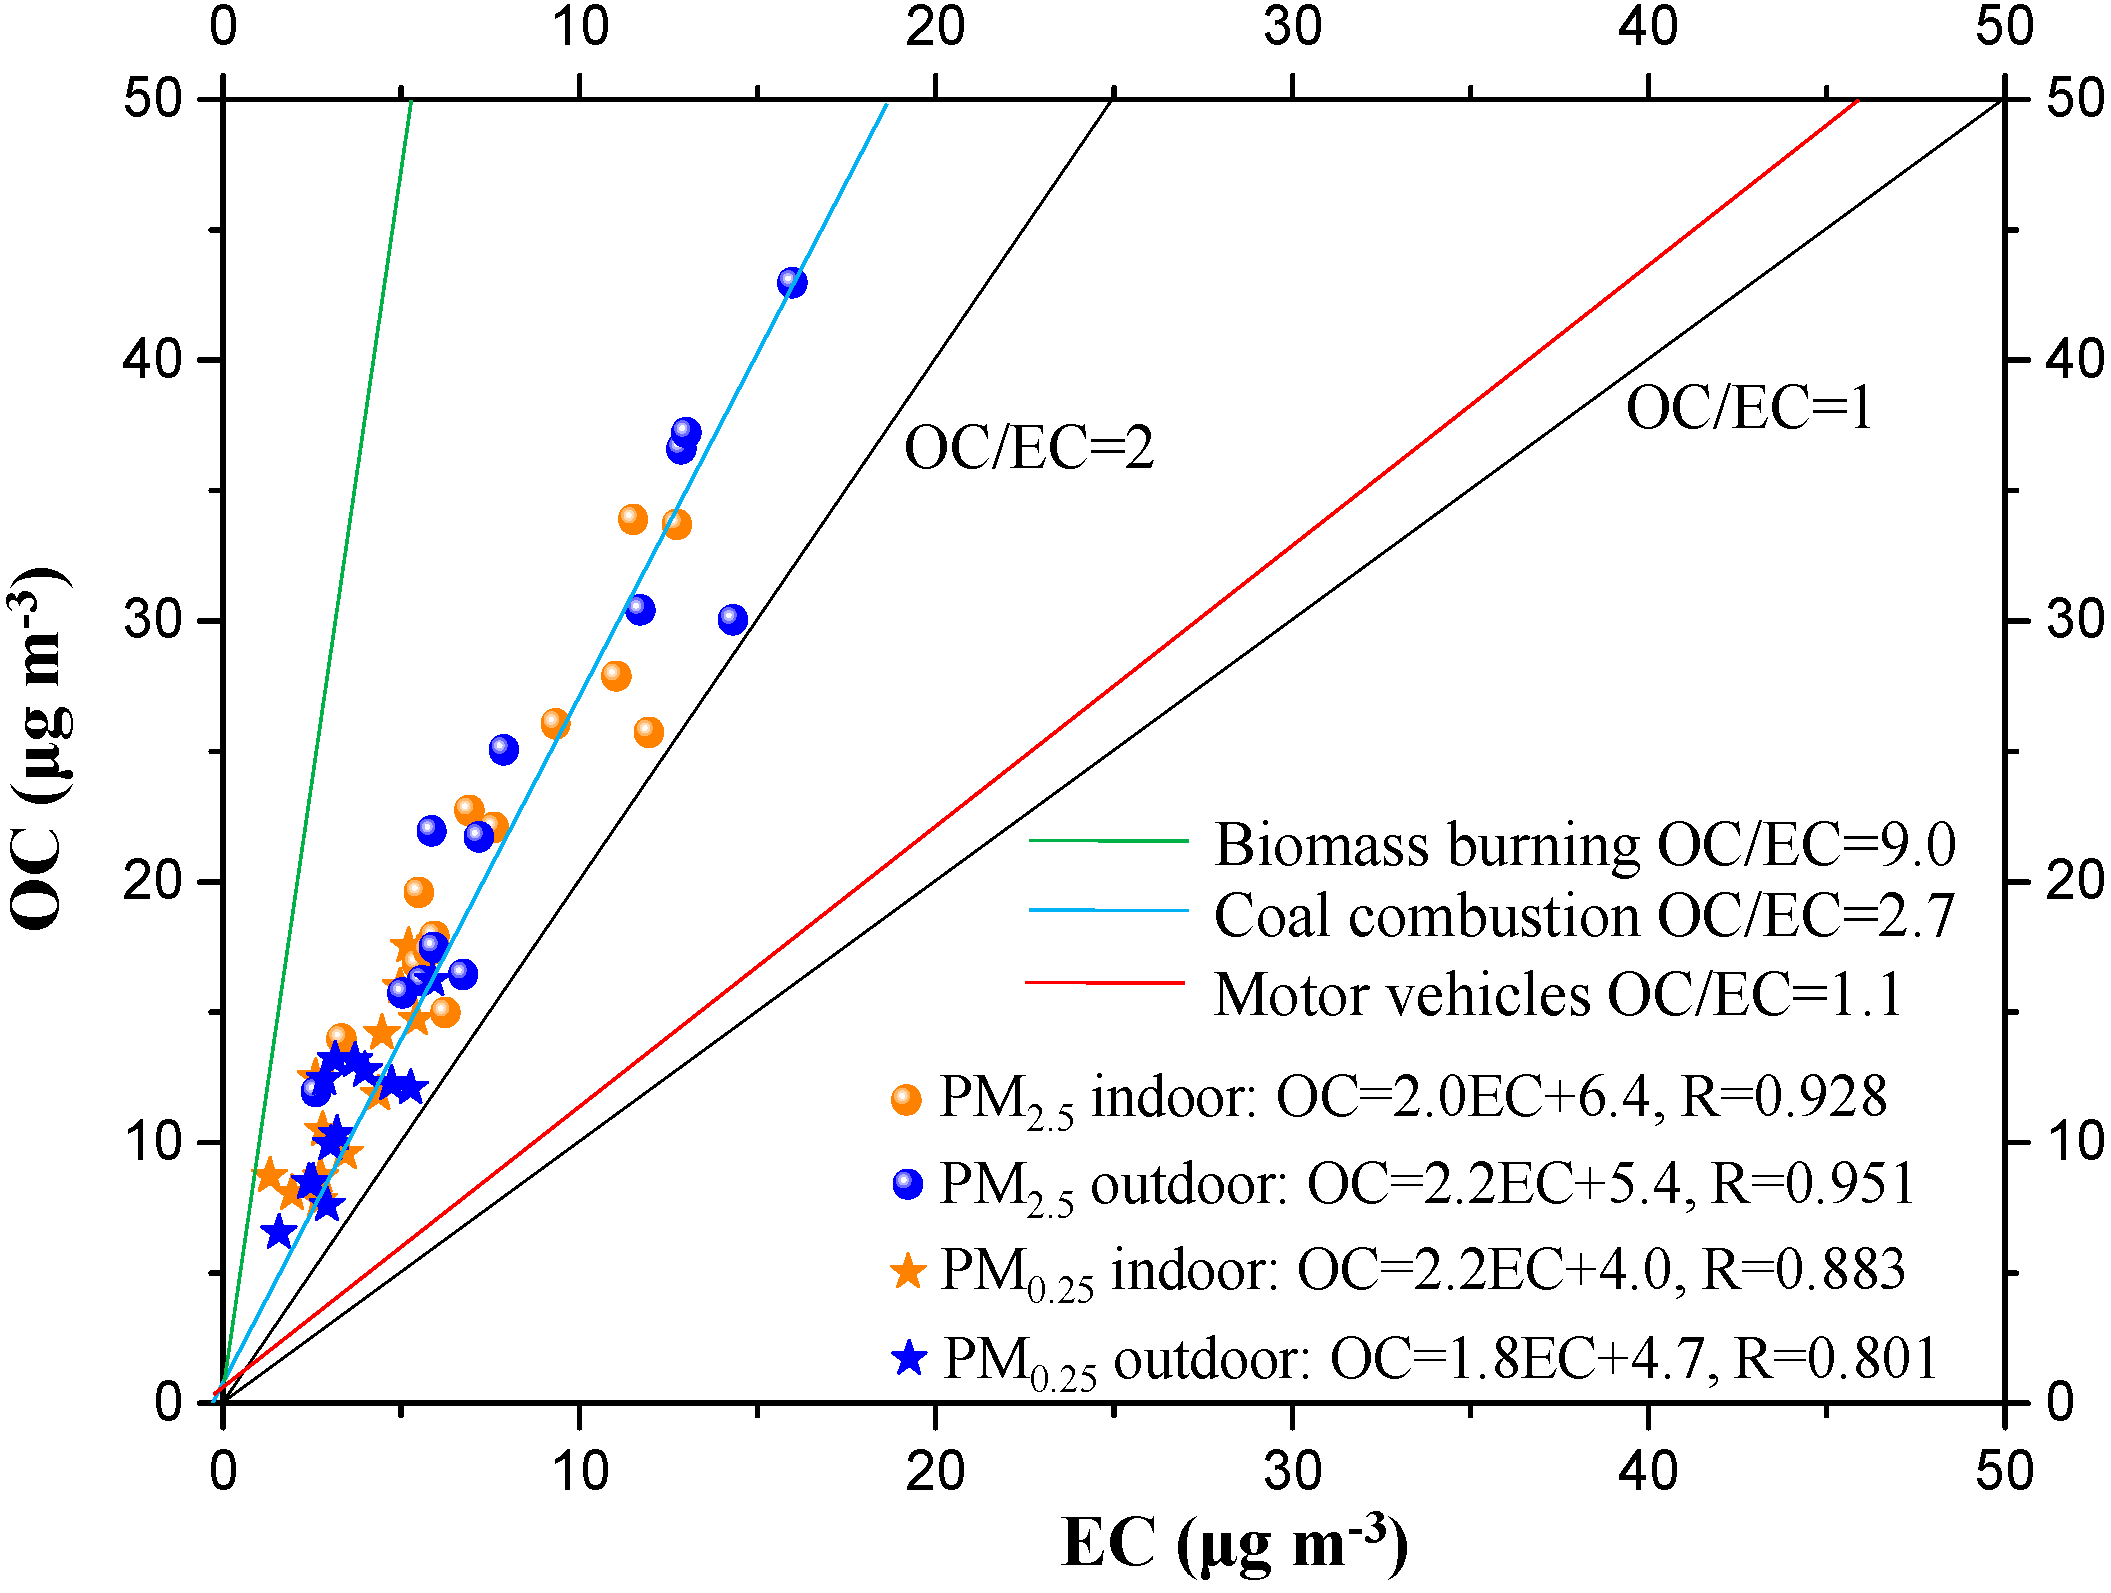
3.2.2. Relationship between OC and EC

Evidence of SOA can be inferred not only from the OC/EC ratio, but also from the absolute carbon concentration. OC and EC correlations are useful for identifying periods of significant secondary formation [24]. The regressions between OC and EC concentrations in PM2.5 and PM0.25 inside the classroom and outdoors are shown in Figure 3, along with data from literature [51,52]. All OC/EC ratio data points in this study are displayed between motor vehicle exhaust and biomass burning linear regressions for both PM2.5 and PM0.25, which reflect the combined contributions from coal combustion, motor vehicle exhaust, and biomass burning emissions. High correlation coefficients (R) of 0.93 indoors and 0.95 outdoors were found between OC and EC in PM2.5. R values were slightly lower in PM0.25, suggesting a clearer source signature for PM2.5 than for PM0.25.
According to linear regressions relating OC to EC in Figure 3, two origins of OC can be deduced—one from the intercept when EC is negligible and the other as directly correlated to EC. In the latter case, SOA formation is negligible, thus the intercept is an aggregate of non-combustion sources (e.g., biogenic OC), and can be used to represent the primary component [24]. The slopes and intercept of OC versus EC inside the classroom were 2.0 and 6.4 for PM2.5 and 2.2 and 4.0 for PM0.25, compared to those outdoors, 2.2 and 5.4 for PM2.5 and 1.8 and 4.7 for PM0.25 (Figure 3), implying that OC primary non-combustion emissions in PM2.5 were higher than those in PM0.25. The differences may be ascribed to variation of source contributions to two different particle size fractions. For example, biogenic and crustal sources generate relatively larger particles and as a result contribute more to PM2.5 OC.

3.2.3. Estimation of SOC from the EC-Tracer Method

EC is predominantly emitted by incomplete combustion of fuels, and has stable chemical properties. Therefore, EC is a good tracer of primary anthropogenic pollutants and it has been used to estimate the concentrations of SOC, as mentioned in the introduction. The EC-tracer method is simple and straightforward, and provided that there are available measurements of OC and EC. SOC is estimated following Equation (1) [24,53]:
SOC = OCtot − POC = OCtot – EC × (OC/EC)min
where OCtot is the total amount of OC in the aerosol sample and (OC/EC)min is the minimum ratio observed during the whole sampling period.
The fraction of SOC in OCtot is shown in Table 3 and the distribution of SOC/OC (%) is illustrated in Figure 4. Estimated SOC accounted for 25.4% indoors and 27.7% outdoors of OC in PM2.5, and 19.3% and 28.2% of OC in PM0.25, indoors and outdoors, respectively. SOC production mainly depends on the emission rate and chemical reactivity of SOC precursors, the latter being controlled by meteorological factors such as solar radiation (given that the reactant species and their concentration are constant in the reaction) [54]. Interestingly, the SOC proportion was higher outdoors than indoors for both size fractions, which might be due to the occurrence of photochemical reactions outdoors. Generally, walls and windows reduce sunlight in buildings, and consequently photochemical formation of SOC at indoors [55,56]. This is supported in this study by the fact that the average PM0.25 indoor SOC percentage was found to be the lowest.
The average contribution of SOC to OC in the entire dataset is comparable for PM2.5 (26.6%) and PM0.25 (23.8%), both indoors and outdoors (Table 3). But the attempt to discriminate indoors from outdoors leads to interesting observations. Indoors, the higher PM2.5 SOC proportion could be due to the relatively high concentration of precursors, which can be correlated with students’ perspiration and use of detergents. Outdoors, the SOC to OC ratio appeared to be similar between PM2.5 and PM0.25, possibly due to two distinct reasons: (i) PM2.5 is primarily derived from direct high-temperature combustion processes emissions and complex atmospheric chemical reactions of gas-phase precursors [57,58]; and (ii) most of PM0.25 is generated from gas-to-particle transformation reactions in the atmosphere [59]. In addition, PM0.25 remain suspended for longer periods and can thus be transported over longer distances in the ambient air than PM2.5, leading to more opportunities for OC in PM0.25 to age [12,48] and produce SOC. As an illustration, the higher average percentage of SOC/OC in our dataset was found in PM0.25 outdoors (28.2%), that is, the size fraction in the source environment where aerosols probably experience the longest residence time and the lowest contributions from primary emissions.
Figure 4 shows the SOC-to-OC ratio (%) indoors and outdoors for the two size fractions in this study. Daily PM0.25 SOC/OC indoors varied by a factor of 19.0, ranging from 3.1% to 59.2%, followed by a factor of 4.7 for PM2.5 indoors. SOC/OC was affected due to household cleaning product usage. Household cleaning products are an important source of indoor air pollution [60]. VOCs emitted from cleaning agents can react rapidly with indoor ozone, resulting in formation of secondary pollutants such as reactive radicals and SOA [60]. Once the cleaning product dispersed over the classroom, SOC/OC reached a relatively high level. In most schools in China, the students clean the classroom by themselves. In this school, the task was achieved every Monday, that is, on March 12th and 19th, as provided by classroom occupancy and activity records. The usage of household cleaning products generated more PM0.25 SOC than PM2.5 SOC, suggesting a predominant contribution of secondary rather than primary formation aerosols [3]. SOC, POC, and EC accounted for 18.1%, 56.6%, and 25.3% of TC on average in this study, respectively. The sum of these latter numbers shows that more than three quarters of TC in northern China’s urban atmosphere in March may originate from primary emissions. Previous studies [4,7] that worked out the seasonal variations of SOC showed that summer was the worst period of the year, and that southern cities may suffer generally higher levels of SOC than those in the north of China. This underlines an urgent need for better understanding about SOC sources and variations, especially in East Asia.
Figure 4. Box plots of SOC/OC (%) in PM2.5 and PM0.25 inside the classroom and outdoors.
Atmosphere 06 00361 g004

3.3. Source of Carbonaceous Aerosol

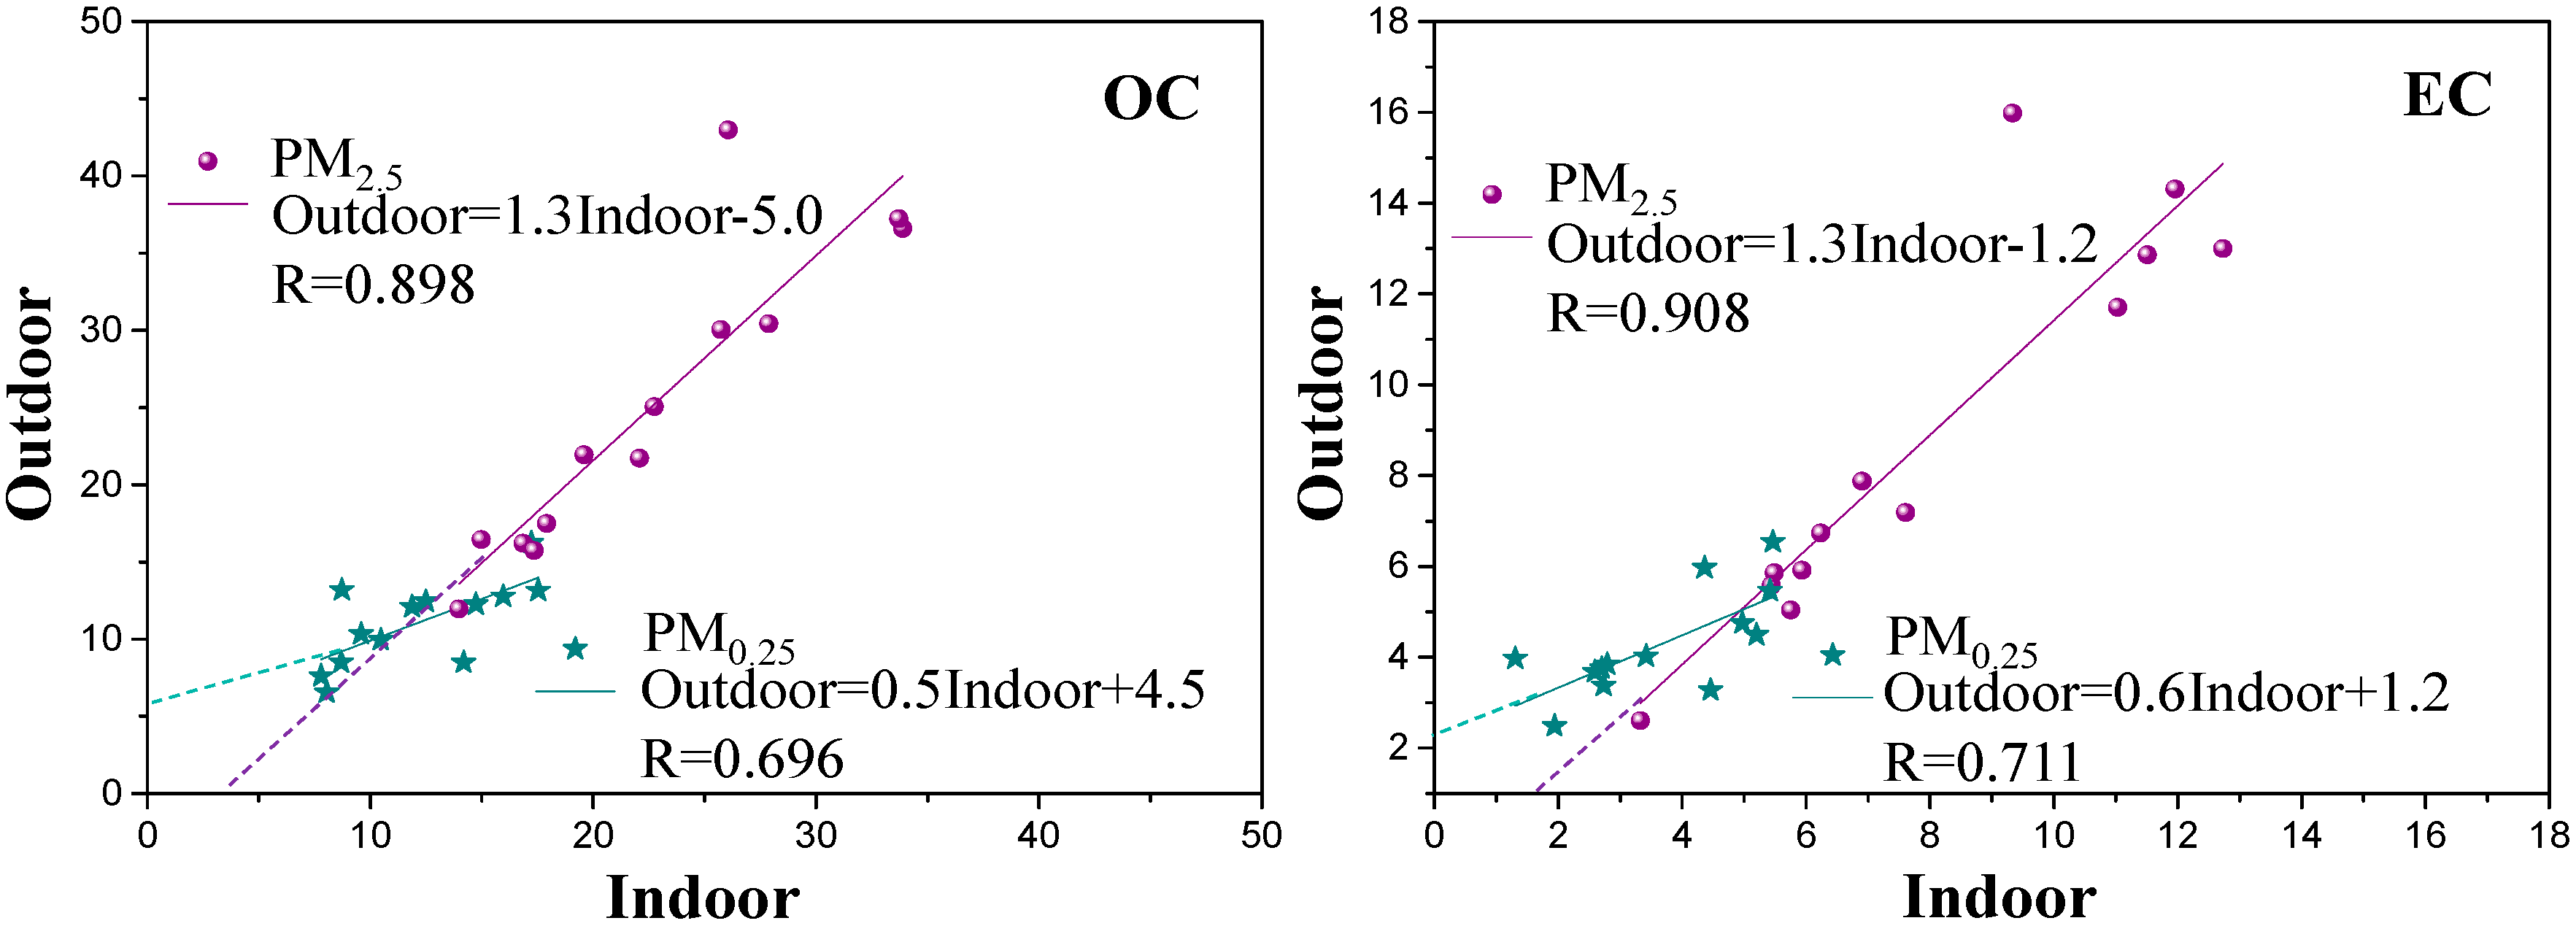
3.3.1. OC and EC Relationship between Indoors and Outdoors

The correlation coefficient between indoor and outdoor data has been used as an indicator of the consistency of the source between indoors and outdoors, and the degree to which PM or its chemical compositions indoors can be attributed to infiltration from outdoors [61,62,63,64,65]. The relationships between indoor and outdoor OC and EC concentrations are shown in Figure 5. The coefficient (R) of determination between indoors and outdoors for OC and EC concentrations ranged between 0.70 and 0.91, suggesting a relatively high infiltration rate into the classroom, probably resulting from frequent exchanges of air.
Figure 5. Indoor and outdoor comparisons of OC and EC mass concentrations in PM2.5 and PM0.25.
Atmosphere 06 00361 g005
The indoor OC and EC concentrations in PM2.5 were strongly correlated with the corresponding outdoor concentrations, displaying R values of 0.90 and 0.91, respectively. This suggests that these carbonaceous aerosols mainly originate from an outdoor environment. As for PM0.25, fair indoor versus outdoor correlations of OC (R = 0.70) and EC (R = 0.71) concentrations were observed. This implies that indoor OC and EC in PM0.25 were derived, at least in part, from outdoor air. This further reveals that some indoor sources may contribute to the PM0.25 fraction, almost exclusively, such as student coughing or sneezing, usage of cleaning products in the classroom, teaching activities (e.g., usage of chalk) [39], and smoking in or nearby the classroom. Moreover, for EC, there were better correlations between indoors and outdoors for both PM2.5 and PM0.25 than for OC, which was consistent with results reported by Ho et al. [62] and Jones et al. [64]. Huang et al. [66] concluded that the majority of EC came from outdoors, mostly due to motor vehicle emissions.

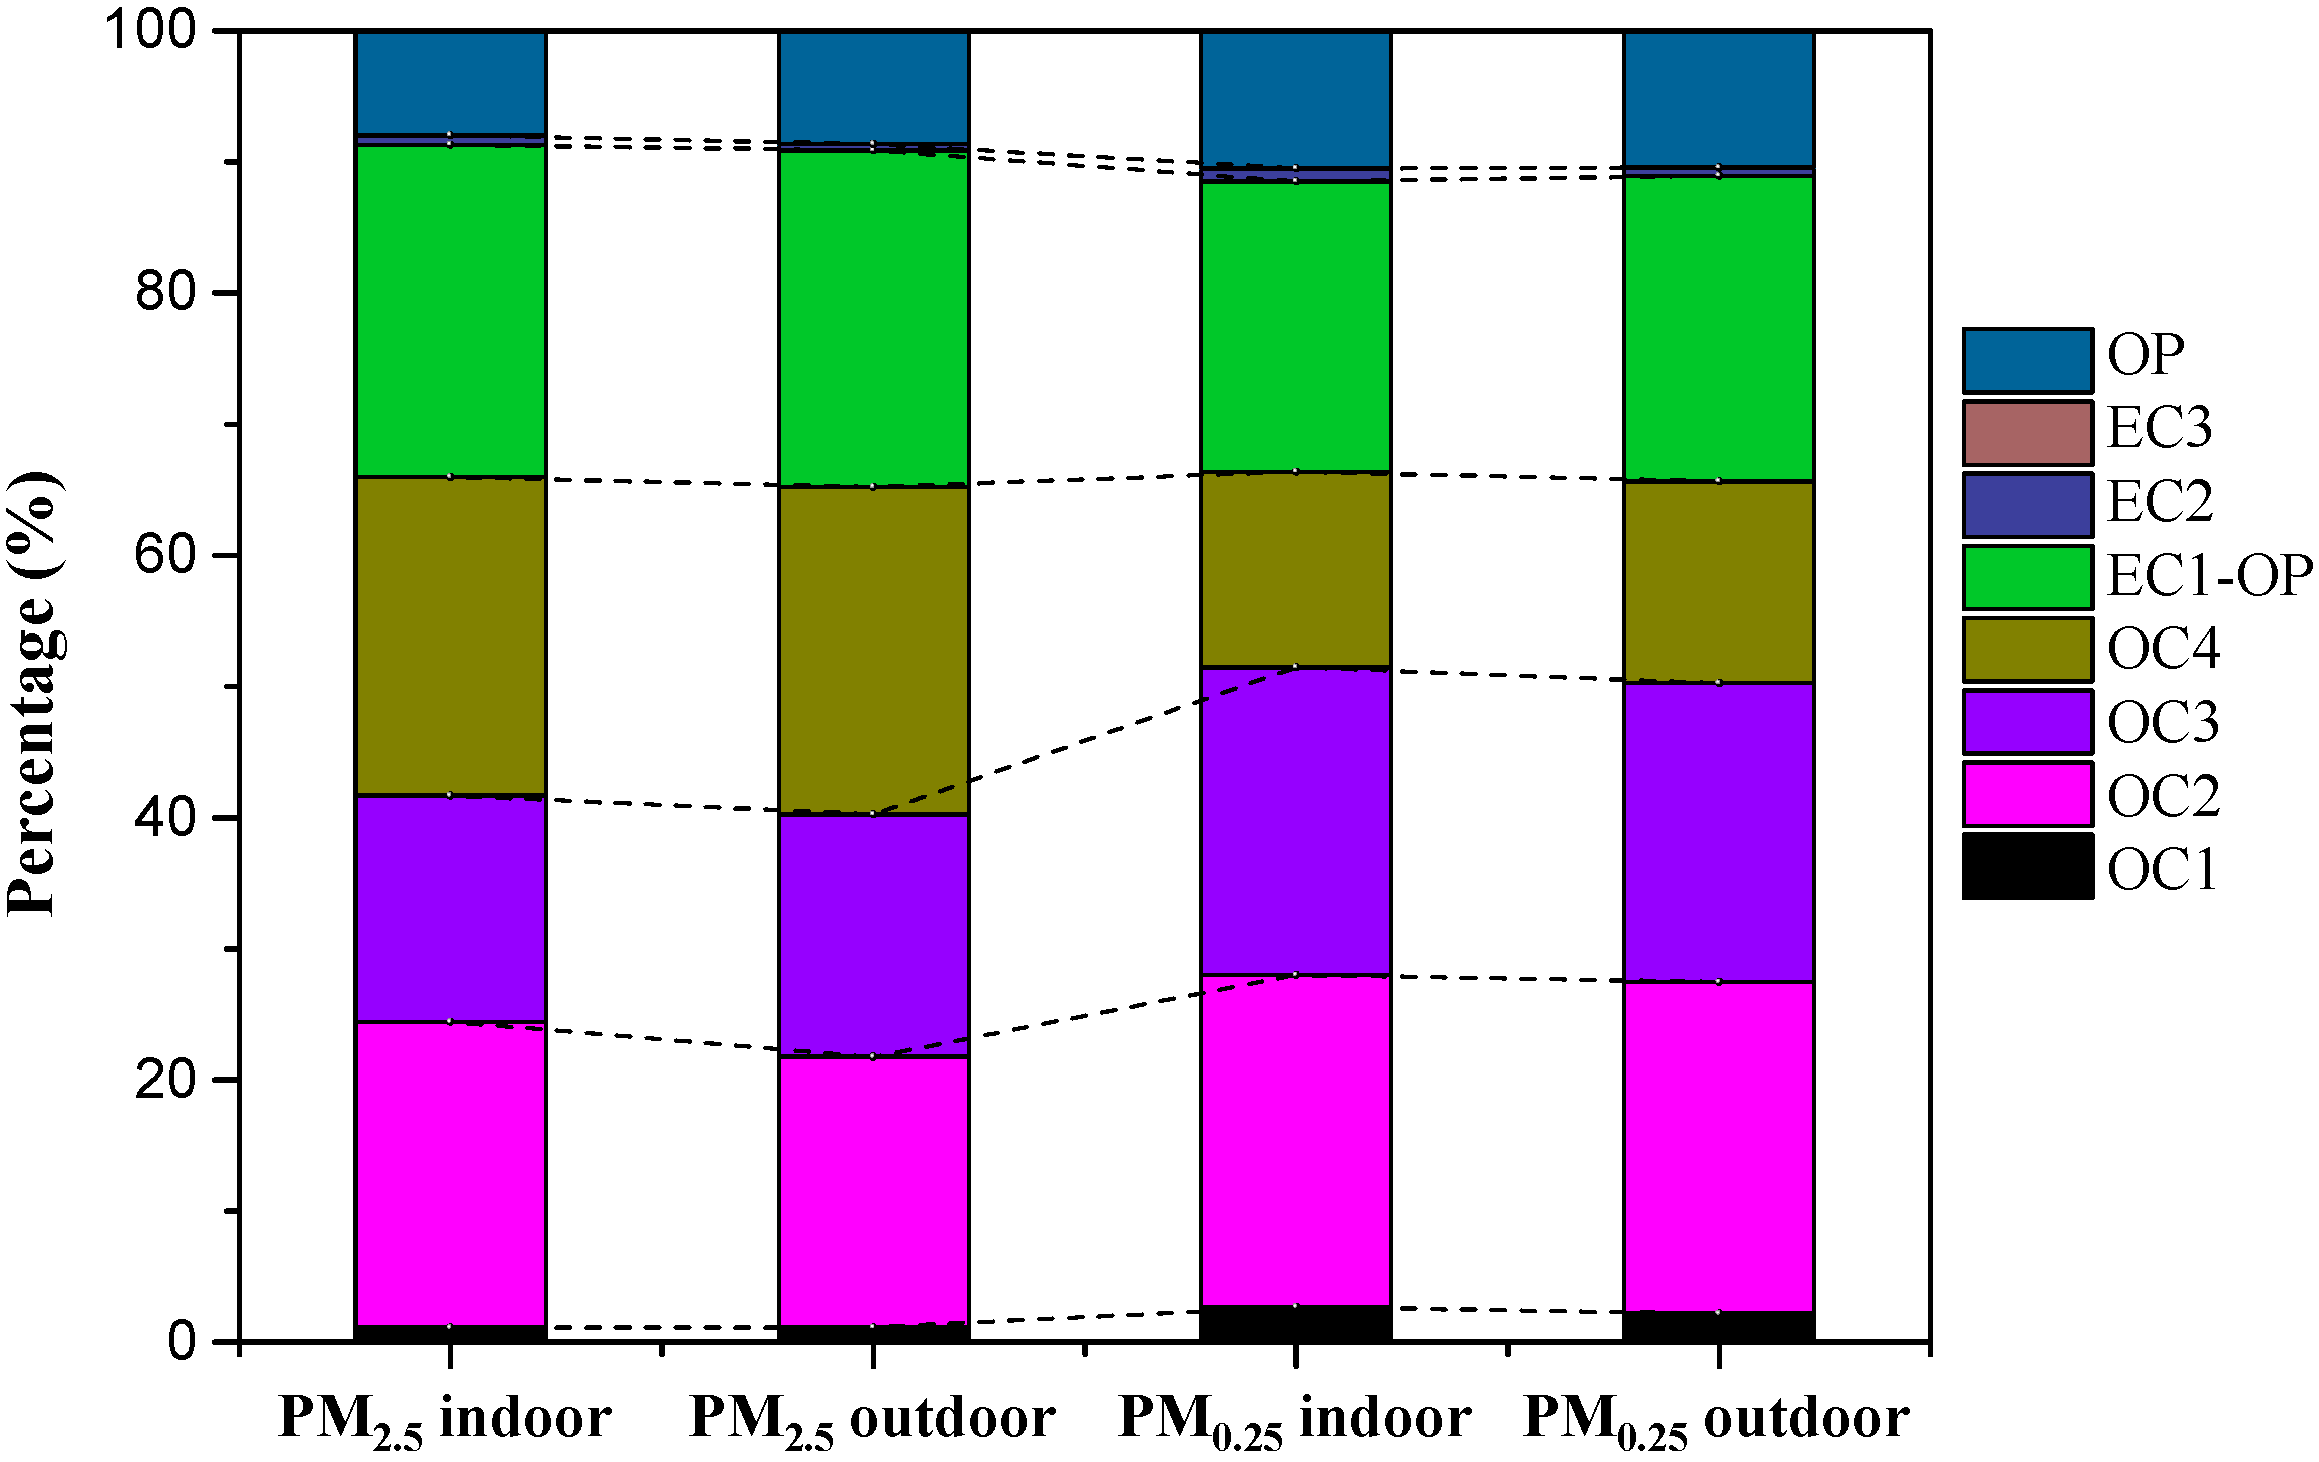
3.3.2. Distribution of OC and EC Eight Fractions

Thermal carbon fractions of OC and EC are different according to the type of sources [67,68,69]. The fractions have been used for source apportionment analysis of carbonaceous aerosols [5,8,70,71]. Different carbon fractions in coal combustion, biomass burning (maize residue) and motor vehicle exhaust (highway with heavy traffic) source samples were studied by Cao et al. [5]. OC2, EC1, and EC2 can be considered as the markers of coal combustion, gasoline motor vehicle exhaust, and diesel motor vehicle exhaust, respectively [4,5,67,71].
Figure 6. Percentage variations of OC and EC eight fractions in PM2.5 and PM0.25 inside the classroom and outdoors.
Atmosphere 06 00361 g006
The respective contribution of the eight thermal carbon fractions to TC in PM2.5 and PM0.25, indoors and outdoors, are shown in Figure 6. OC2, OC3, OC4, and EC1-OP dominate. The relatively low levels of EC2 and EC3 in the samples may be due to the relatively long distance from the direct emissions of running vehicles; some motor vehicle control policy implementation may also be considered, such as the “Government Circular on Strengthening Management of the Motor Vehicle Traffic in Xi’an City.” Diesel vehicles, especially trucks, were banned in Xi’an in 2007 within the second ring road from 7:00 am to 10:00 pm and important traffic regulations are in place on the second ring road during rush hour. The most abundant species—OC2, OC3, OC4, and EC1 (EC1-OP+OP)—displayed different variation trends in PM2.5 compared to PM0.25, but no significant differences between indoors and outdoors could be observed for the same particle size fraction. The contributions of OC2 and OC3 in TC increased from 22.0% and 17.9% in PM2.5 to 25.3% and 23.1% in PM0.25; meanwhile, OC4 in TC decreased from 24.6% in PM2.5 compared to 15.2% in PM0.25. EC1 in PM2.5 and PM0.25 compared to TC in the same size fractions were similar (32.6%–34.3%). These variations possibly reflected increased contributions from primary coal combustion emissions and probable secondary formation from PM2.5 to PM0.25. It also suggested that the contributions from gasoline-fuel motor vehicle exhaust and the corresponding secondary formation to PM2.5 and PM0.25 were consistent.

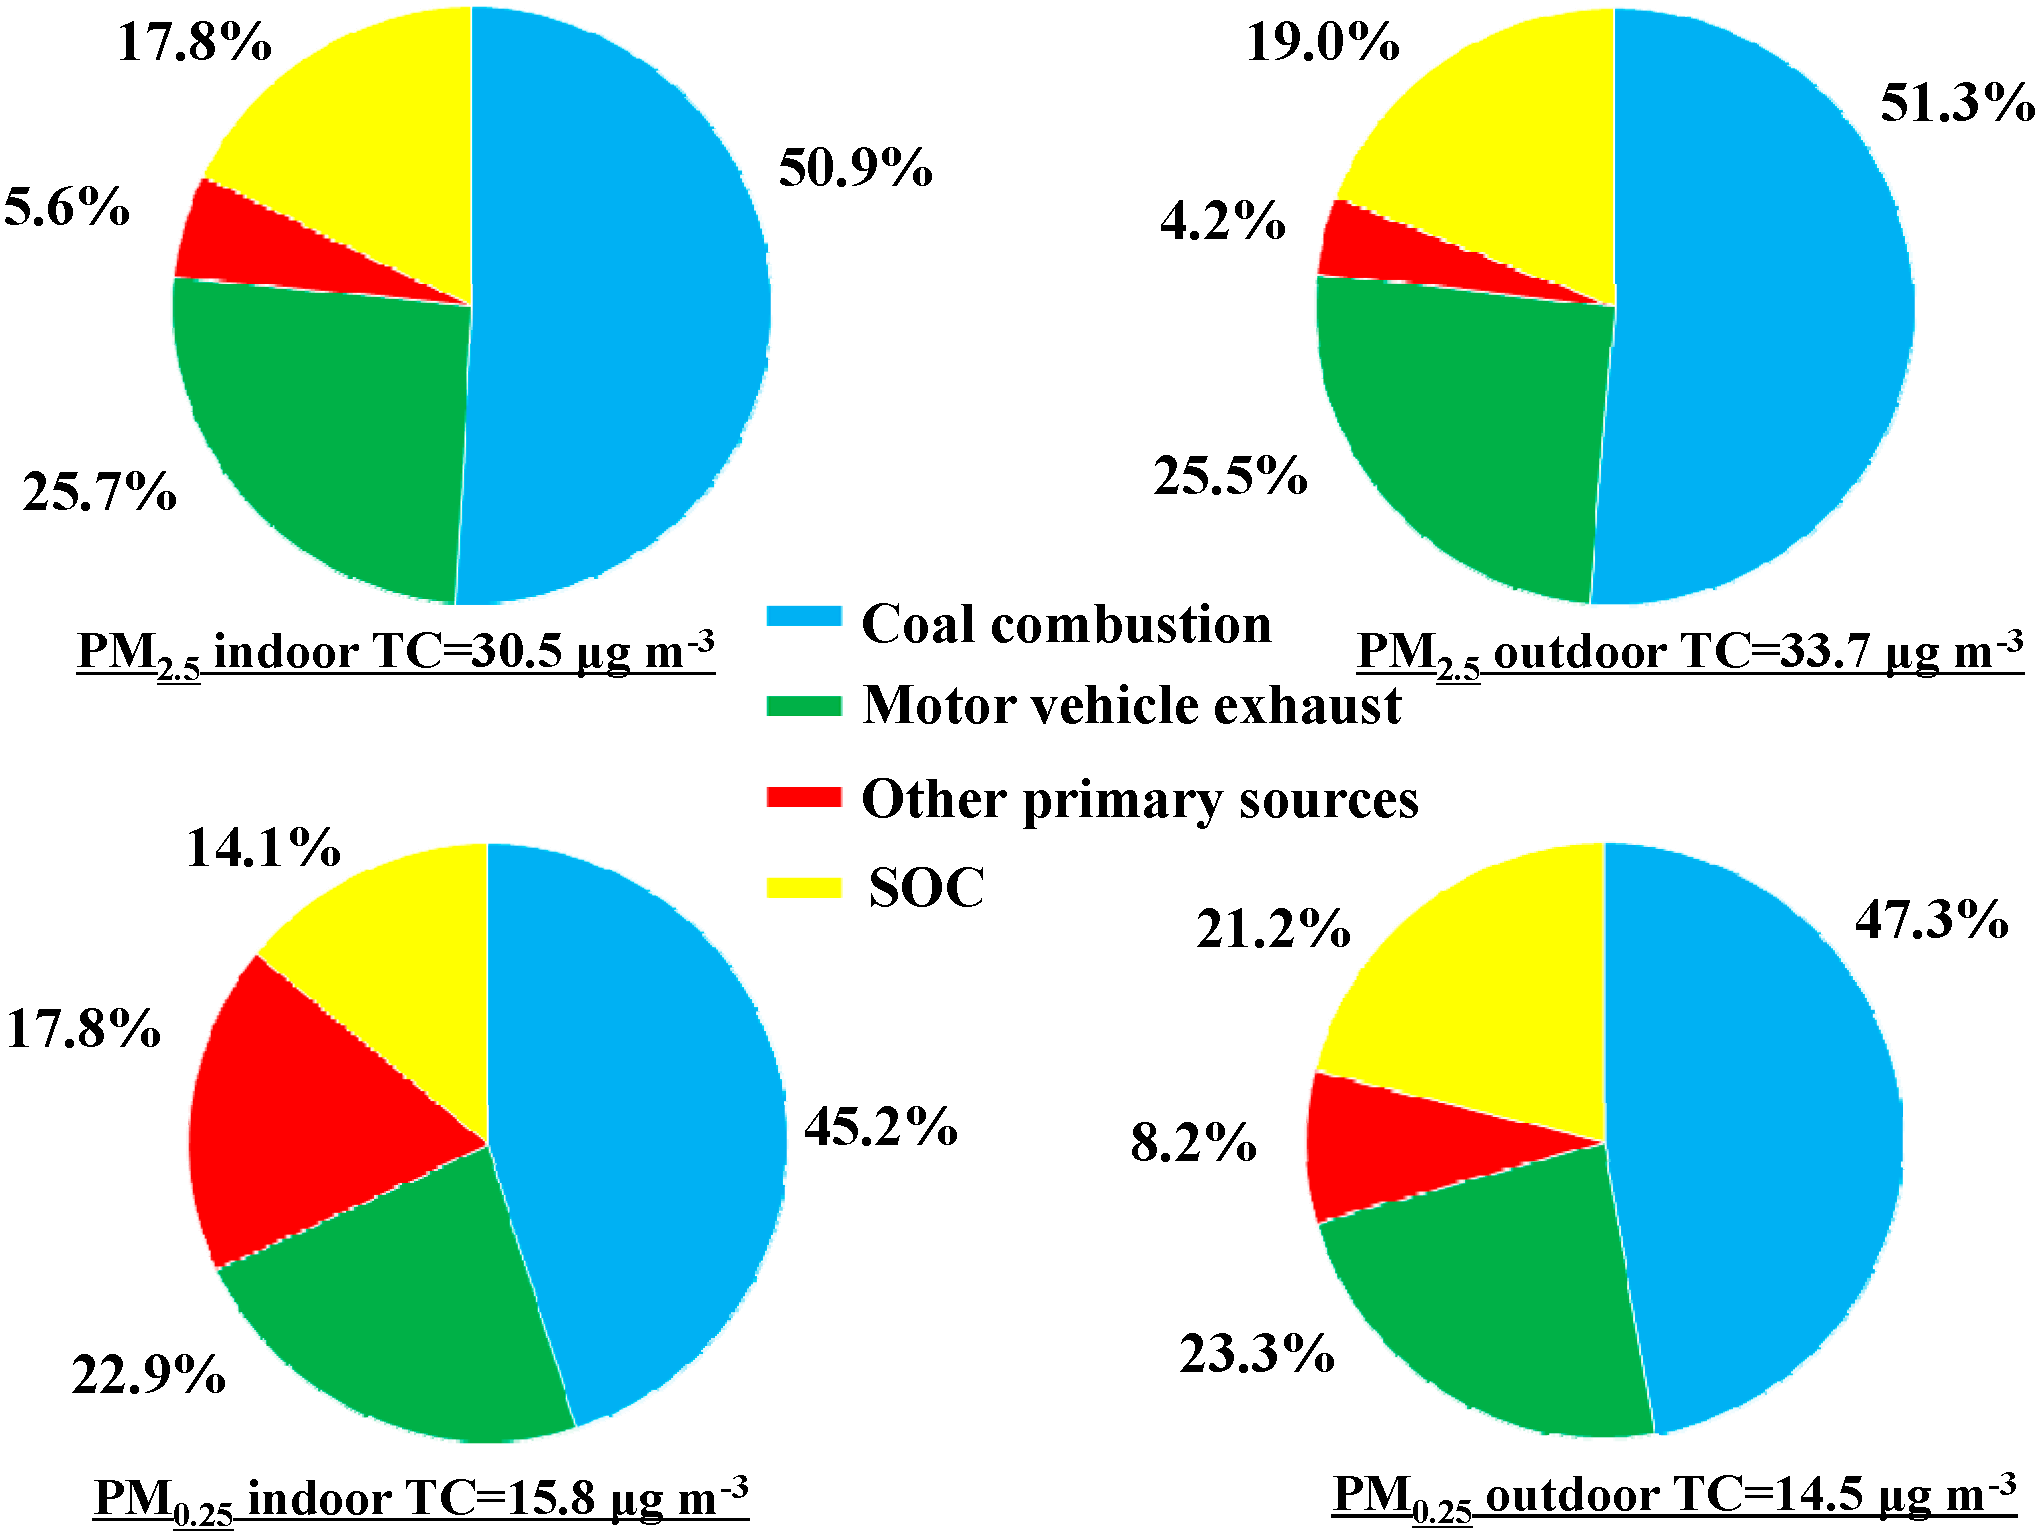
3.3.3. Source Apportionment of TC

A previous study in Xi’an concluded that during winter, TC was produced from gasoline exhaust (44%), coal burning (44%), biomass burning (9%), and diesel exhaust (3%) [5]. Thus, assuming in the present study that the contributions from biomass burning and diesel exhaust on EC were minimal, we considered coal combustion and motor vehicle exhaust as the main contributors. According to Cao et al. [8], their average percent contributions to EC, calculated via the 13C-EC isotope mass balance approach, were 53% for coal combustion and 47% for motor vehicle exhaust. As mentioned, Watson et al. [51] reported an OC/EC ratio of 2.7 for coal combustion (CC) and 1.1 for motor vehicle exhaust (MV), which we express in Equations (2) and (3):
(OC/EC)CC = 2.7
(OC/EC)MV = 1.1(3)
The fraction of primary OC from coal combustion (POCCC) and motor vehicle exhaust (POCMV) can then be expressed as Equations (4) and (5):
POCCC = 2.7 × ECCC = 2.7 × (53% × EC) = 2.7 × 53% × 7.9 μg·m−3 = 11.3 μg·m−3
POCMV = 1.1 × ECMV = 1.1 × (47% × EC) = 1.1 × 47% × 7.9 μg·m−3 = 4.1 μg·m−3
where the average EC concentration is 7.9 μg∙m−3 in indoor PM2.5, ECCC refers to EC from coal combustion, and ECMV refers to EC from motor vehicle exhaust. POC concentration can be written as the sum of POCCC, POCMV, and primary OC from other sources (POCothers). POCothers, containing POC from marine, soil, and biogenic emissions, can be estimated from Equation (6):
POCothers = POC − (POCCC + POCMV)
where the average POC concentration was 17.1 μg∙m−3 in indoor PM2.5. We used this information and Equation (6) to calculate POCothers and found POCothers was equal to 1.7 μg∙m−3 in indoor PM2.5. The respective contributions to TC of CC, MV, other primary sources, and SOC can finally be calculated from Equation (7):
TC = OC + EC = POC + SOC + EC = (POCCC + POCMV + POCothers) + SOC +
(ECCC + ECMV) = (POCCC + ECCC) + (POCMV +ECMV) + POCothers + SOC
where SOC concentration is 5.4 μg∙m−3 in indoor PM2.5, (POCCC + ECCC) refers to TC from coal combustion, and (POCMV + ECMV) refers to TC from motor vehicle exhaust. As a result, the average concentrations in PM2.5 inside the classroom attributed to coal combustion, motor vehicle exhaust, other primary sources, and SOC and calculated from Equation (7) were 15.5, 7.8, 1.7, and 5.4 μg∙m−3, respectively.
Similarly, we estimated the relative contributions to TC of the four main sources mentioned for the three other combinations (Figure 7). On average, the results pointed out that coal combustion was the largest contributor (48.7%), followed by motor vehicle exhaust (24.4%) and SOC (18.0%), underlining that coal combustion was a dominant source of TC in Xi’an, late in the heating season for both indoors and outdoors. Moreover, coal combustion was estimated to emit more than half of the PM2.5 TC, which was 5% higher than that of PM0.25. The OC2 fraction variations reflected that SOC formation related to coal combustion emissions was elevated in PM0.25. TC originating from motor vehicle exhaust ranged from 22.9% to 25.7%, implying relatively constant inputs from this source, consistent with the variations of EC1 mentioned before. It should be noted that TC emitted from other primary sources in PM0.25 indoor was significantly higher than in other combinations. The value found for indoor PM0.25 (17.8%) suggested that there were other VFP sources existing in the classroom, which was also supported, earlier in this article, by the OC and EC relationships between indoors and outdoors.
Figure 7. Relative contributions from different sources to TC in PM2.5 and PM0.25 inside the classroom and outdoors.
Atmosphere 06 00361 g007

4. Conclusions

Daily PM2.5 and PM0.25 samples collected from 8 to 20 March 2012, inside and outside a classroom in a middle school at Xi’an, China, were used to feature OC and EC according to two different particle size fractions and to identify SOC by various methods in order to understand the SOC formation pathways and the source apportionment of TC. OC and EC constituted significant fractions of PM in atmosphere, as they accounted for 20.8% and 29.5% of PM2.5 and PM0.25 mass concentrations, respectively. High OC/EC ratios (3.2), compared to other cities in China, underlined that coal combustion emissions were the most important emission source of elevated carbonaceous aerosol levels in Xi’an. Based on the EC-tracer method, SOC accounted for 25.4% and 27.7% of OC for PM2.5 indoors and outdoors, and 19.3% and 28.2% of OC for PM0.25 indoors and outdoors, respectively. The SOC-to-OC ratios indoors and outdoors were comparable between PM2.5 and PM0.25, which is consistent with higher levels outside the classroom than inside, and might result from outdoor photochemical reactions, as well as from EC primary emissions in outdoor combustion sources. High OC and EC correlations of PM2.5 and PM0.25 indicated a similar origin of OC and EC; similarly, a decent relationship between the indoor and outdoor OC and EC concentrations suggested relatively good ventilation in the classroom, and suggested that the highest composition of indoor carbonaceous aerosols could be attributed to outdoor PM permeation.
TC source apportionment by formula derivation showed that coal combustion, motor vehicle exhaust, other primary sources, and secondary formation were the major sources of carbonaceous sources in the present study. The contribution of coal combustion to PM0.25 displayed a lower value (46.3%) than to PM2.5 (51.1%), while motor vehicle exhaust contribution was similar (approximately 25%) for both particle sizes. Interestingly, contributions from other primary sources increased from 5.6% in indoor PM2.5 to 17.8% in indoor PM0.25, pointing out the existence of special indoor VFP sources such as students coughing, sneezing, usage of cleaning products, teaching activities, smoking, and so on. Overall, carbonaceous aerosols were characterized as a major component in PM2.5 and more importantly in PM0.25. PM0.25 are expected to be one of the major components influencing regional atmospheric chemistry and climate change in China. Our results therefore suggested that the importance of reducing carbonaceous aerosols in the atmosphere requires more control to enhance the policies of coal combustion and motor vehicle exhaust emissions, in addition to controlling secondary production of organic compounds from OC through their gaseous precursors.

Acknowledgments

This study was supported by different projects entitled “International (Regional) Cooperation and Exchange Projects, Research Fund for International Young Scientists of the Chinese Academy of Sciences (41150110474),” “New teachers’ scientific research support plan” of Xi’an Jiaotong University (XJTU-HRT-002),” and “Fundamental Research Funds for the Central Universities (XJJ2015035).”

Author Contributions

Benjamin Guinot, Hongmei Xu, and Junji Cao designed the study. Hongmei Xu, Benjamin Guinot, and Xinyi Niu collected particulate samples. Hongmei Xu and Xinyi Niu performed the gravimetric and OC, EC analysis. Hongmei Xu analyzed the data. Hongmei Xu and Benjamin Guinot designed and wrote the paper. All authors reviewed and commented on the paper.

Conflicts of Interest

The authors declare no conflict of interest.

References

  1. He, K.; Yang, F.; Ma, Y.; Zhang, Q.; Yao, X.; Chan, C.K.; Cadle, S.; Chan, T.; Mulawa, P. The characteristics of PM2.5 in Beijing, China. Atmos. Environ. 2001, 35, 4959–4970. [Google Scholar] [CrossRef]
  2. Ye, B.M.; Ji, X.L.; Yang, H.Z.; Yao, X.H.; Chan, C.K.; Cadle, S.H.; Chan, T.; Mulaw, P.A. Concentration and chemical composition of PM2.5 in Shanghai for a 1-year period. Atmos. Environ. 2003, 37, 499–510. [Google Scholar] [CrossRef]
  3. Cao, J.J.; Lee, S.C.; Ho, K.F.; Zhang, X.Y.; Zou, S.C.; Fung, K.; Chow, J.C.; Watson, J.G. Characteristics of carbonaceous aerosol in Pearl River Delta region, China during 2001 winter period. Atmos. Environ. 2003, 37, 1451–1460. [Google Scholar] [CrossRef]
  4. Cao, J.J.; Lee, S.C.; Ho, K.F.; Zou, S.C.; Fung, K.; Li, Y.; Watson, J.G.; Chow, J.C. Spatial and seasonal variations of atmospheric organic carbon and elemental carbon in Pearl River Delta Region, China. Atmos. Environ. 2004, 38, 4447–4456. [Google Scholar] [CrossRef]
  5. Cao, J.J.; Wu, F.; Chow, J.C.; Lee, S.C.; Li, Y.; Chen, S.W.; An, Z.S.; Fung, K.K.; Watson, J.G.; Zhu, C.S.; et al. Characterization and source apportionment of atmospheric organic and elemental carbon during fall and winter of 2003 in Xi’an, China. Atmos. Chem. Phys. 2005, 5, 3127–3137. [Google Scholar] [CrossRef]
  6. Cao, J.J.; Lee, S.C.; Zhang, X.Y.; Chow, J.C.; An, Z.S.; Ho, K.F.; Watson, J.G.; Fung, K.K.; Wang, Y.Q.; Shen, Z.X. Characterization of airborne carbonate over a site near Asian Dust source regions during spring 2002 and its climatic and environmental significance. J. Geophys. Res. 2005, 110, 1–8. [Google Scholar]
  7. Cao, J.J.; Lee, S.C.; Chow, J.C.; Watson, J.G.; Ho, K.F.; Zhang, R.J.; Jin, Z.D.; Shen, Z.X.; Chen, G.C.; Kang, Y.M.; et al. Spatial and seasonal distributions of carbonaceous aerosols over China. J. Geophys. Res. 2007, 112, D22S11. [Google Scholar] [CrossRef]
  8. Cao, J.J.; Zhu, C.S.; Tie, X.X.; Geng, F.H.; Xu, H.M.; Ho, S.S.H.; Wang, G.H.; Han, Y.M.; Ho, K.F. Characteristics and sources of carbonaceous aerosols from Shanghai, China. Atmos. Chem. Phys. 2013, 13, 803–817. [Google Scholar] [CrossRef]
  9. Guinot, B.; Cachier, H.; Sciare, J.; Tong, Y.; Xin, W.; Yu, J. Beijing aerosol: Atmospheric interactions and new trends. J. Geophys. Res. Atmos. 2007, 112. [Google Scholar] [CrossRef]
  10. Guinot, B.; Cachier, H.; Oikonomou, K. Geochemical perspectives from a new aerosol chemical mass closure. Atmos. Chem. Phys. 2007, 7, 1657–1670. [Google Scholar] [CrossRef]
  11. Shen, Z.X.; Cao, J.J.; Arimoto, R.; Zhang, R.J.; Jie, D.M.; Liu, S.X.; Zhu, C.S. Chemical composition and source characterization of spring aerosol over Horqinsandland in northeastern China. J. Geophys. Res. 2007, 112. [Google Scholar] [CrossRef]
  12. Shen, Z.X.; Cao, J.J.; Tong, Z.; Liu, S.X.; Reddy, L.S.S.; Han, Y.M.; Zhang, T.; Zhou, J. Chemical characteristics of submicron particles in winter in Xi’an. Aerosol Air Qual. Res. 2009, 9, 80–93. [Google Scholar] [CrossRef]
  13. Shen, Z.X.; Cao, J.J.; Liu, S.X.; Zhu, C.S.; Wang, X.; Zhang, T.; Xu, H.M.; Hu, T.F. Chemical composition of PM10 and PM2.5 collected at ground level and 100 meters during a strong winter-time pollution episode in Xi’an, China. J. Air Waste Manag. Assoc. 2011, 61, 1150–1159. [Google Scholar] [PubMed]
  14. Shen, Z.X.; Cao, J.J.; Zhang, L.M.; Liu, L.; Zhang, Q.; Li, J.J.; Han, Y.M.; Zhu, C.S.; Zhao, Z.Z.; Liu, S.X. Day-night differences and seasonal variations of chemical species in PM10 over Xi’an, northwest China. Environ. Sci. Pollut. Res. 2014, 21, 3697–3705. [Google Scholar] [CrossRef]
  15. Tao, J.; Shen, Z.X.; Zhu, C.S.; Yue, J.H.; Cao, J.J.; Liu, S.X.; Zhu, L.H.; Zhang, R.J. Seasonal variations and chemical characteristics of sub-micrometer particles (PM1) in Guangzhou, China. Atmos. Res. 2012, 118, 222–231. [Google Scholar] [CrossRef]
  16. Jacobson, M.Z. Control of fossil-fuel particulate black carbon and organic matter, possibly the most effective method of slowing global warming. J. Geophys. Res. 2002, 107. [Google Scholar] [CrossRef]
  17. Menon, S. Current uncertainties in assessing aerosol effects on climate. Annu. Rev. Environ. Resour. 2004, 29, 1–30. [Google Scholar] [CrossRef]
  18. Ramana, M.V.; Ramanathan, V.; Feng, Y.; Yoon, S.-C.; Kim, S.-W.; Carmichael, G.R.; Schauer, J.J. Warming influenced by the ratio of black carbon to sulphate and the black-carbon source. Nat. Geosci. 2010, 3, 542–545. [Google Scholar] [CrossRef]
  19. Jansen, K.; Larson, T.; Koenig, J.; Mar, T.; Fields, C.; Stewart, J.; Lippmann, M. Associations between health effects and particulate matter and black carbon in subjects with respiratory disease. Environ. Health Perspect. 2005, 113, 1741–1746. [Google Scholar] [CrossRef] [PubMed]
  20. Lewne, M.; Plato, N.; Gustavsson, P. Exposure to particles, elemental carbon and nitrogen dioxide in workers exposed to motor exhaust. Ann. Occup. Hyg. 2007, 51, 693–701. [Google Scholar] [CrossRef] [PubMed]
  21. Shih, T.S.; Lai, C.H.; Hung, H.F.; Ku, S.Y.; Tsai, P.J.; Yang, T.; Liou, S.H. Elemental and organic carbon exposure in highway tollbooths: A study of Taiwanese toll station workers. Sci. Total Environ. 2008, 402, 163–170. [Google Scholar] [CrossRef] [PubMed]
  22. Cao, J.J.; Xu, H.M.; Xu, Q.; Chen, B.H.; Kan, H.D. Fine particulate matter constituents and cardiopulmonary mortality in a heavily polluted Chinese city. Environ. Health Perspect. 2012, 120, 373–378. [Google Scholar] [CrossRef] [PubMed]
  23. Huang, R.-J.; Zhang, Y.L.; Bozzetti, C.; Ho, K.-F.; Cao, J.J.; Han, Y.M.; Daellenbach, K.R.; Slowik, J.G.; Platt, S.M.; Canonaco, F.; et al. High secondary aerosol contribution to particulate pollution during haze events in China. Nature 2014, 514, 218–222. [Google Scholar]
  24. Turpin, B.J.; Huntzicker, J.J. Identification of secondary organic aerosol episodes and quantitation of primary and secondary organic aerosol concentrations during SCAQS. Atmos. Environ. 1995, 29, 3527–3544. [Google Scholar] [CrossRef]
  25. Kleindienst, T.E.; Jaoui, M.; Lewandowski, M.; Offenberg, J.H.; Lewis, C.W.; Bhave, P.V.; Edney, E.O. Estimates of the contributions of biogenic and anthropogenic hydrocarbons to secondary organic aerosol at a southeastern US location. Atmos. Environ. 2007, 41, 8288–8300. [Google Scholar] [CrossRef]
  26. Pandis, S.N.; Harley, R.H.; Cass, G.R.; Seinfeld, J.H. Secondary organic aerosol formation and transport. Atmos. Environ. 1992, 26A, 2269–2282. [Google Scholar] [CrossRef]
  27. Strader, R.; Lurmann, F.; Pandis, S.N. Evaluation of secondary organic aerosol formation in winter. Atmos. Environ. 1999, 33, 4849–4863. [Google Scholar] [CrossRef]
  28. Hildemann, L.M.; Rogge, W.F.; Cass, G.R.; Mazurek, M.A.; Simoneit, B.R.T. Contribution of primary aerosol emissions from vegetation-derived sources to fine particle concentrations in Los Angeles. J. Geophys. Res. 1996, 101, 19541–19549. [Google Scholar] [CrossRef]
  29. Schichtel, B.A.; Malm, W.C.; Bench, G.; Fallon, S.; McDade, C.E.; Chow, J.C.; Watson, J.G. Fossil and contemporary fine particulate carbon fractions at 12 rural and urban sites in the United States. J. Geophys. Res. 2008, 113. [Google Scholar] [CrossRef]
  30. Ding, X.; Zheng, M.; Edgerton, E.S.; Jansen, J.J.; Wang, X. Contemporary or fossil origin: Split of estimated secondary organic carbon in the southeastern United States. Environ. Sci. Technol. 2008, 42, 9122–9128. [Google Scholar] [CrossRef] [PubMed]
  31. Yuan, Z.B.; Yu, J.Z.; Lau, A.K.H.; Louie, P.K.K.; Fung, J.C.H. Application of positive matrix factorization in estimating aerosol secondary organic carbon in Hong Kong and its relationship with secondary sulfate. Atmos. Chem. Phys. 2006, 6, 25–34. [Google Scholar] [CrossRef]
  32. Sun, Y.; Zhang, Q.; Zheng, M.; Ding, X.; Edgerton, E.S.; Wang, X. Characterization and source apportionment of water-soluble organic matter in atmospheric fine particles (PM2.5) with high-resolution aerosol mass spectrometry and GC-MS. Environ. Sci. Technol. 2011, 45, 4854–4861. [Google Scholar] [CrossRef]
  33. Xi’an Municipal Bureau of Statistics and NBS Survey Office in Xi’an. Statistics Communique on the National Economy and Social Development of the City of Xi’an. In Xi’an Statistical Yearbook; China Statistics Press: Beijing, China, 2013; pp. 563–588. [Google Scholar]
  34. Bennett, W.D.; Zeman, K.L. Deposition of fine particles in children spontaneously breathing at rest. Inhal. Toxicol. 1998, 10, 831–842. [Google Scholar] [CrossRef]
  35. Kulkarni, N.; Grigg, J. Effect of air pollution on children. J. Paediatr. Child Health 2008, 18, 238–243. [Google Scholar] [CrossRef]
  36. Mendell, M.J.; Heath, G.A. Do indoor pollutants and thermal conditions in schools influence student performance? A critical review of the literature. Indoor Air 2005, 15, 27–52. [Google Scholar] [CrossRef]
  37. Tran, D.T.; Alleman, L.Y.; Coddeville, P.; Galloo, J.-C. Elemental characterization and source identification of size resolved atmospheric particles in French classrooms. Atmos. Environ. 2012, 54, 250–259. [Google Scholar] [CrossRef]
  38. Ward, T.J.; Noonan, C.W.; Hooper, K. Results of an indoor size fractionated PM school sampling program in Libby, Montana. Environ. Monit. Assess. 2007, 130, 163–171. [Google Scholar] [CrossRef] [PubMed]
  39. Fromme, H.; Diemer, J.; Dietrich, S.; Cyrys, J.; Heinrich, J.; Lang, W.; Kiranoglu, M.; Twardella, D. Chemical and morphological properties of particulate matter (PM10, PM2.5) in school classrooms and outdoor air. Atmos. Environ. 2008, 42, 597–660. [Google Scholar] [CrossRef]
  40. Pegas, P.N.; Nunes, T.; Alves, C.A.; Silva, J.R.; Vieira, S.L.A.; Caseiro, A.; Pio, C.A. Indoor and outdoor characterization of organic and inorganic compounds in city centre and suburban elementary schools of Aveiro, Portugal. Atmos. Environ. 2012, 55, 80–89. [Google Scholar] [CrossRef]
  41. Chow, J.C.; Yu, J.Z.; Watson, J.G.; Ho, S.S.H.; Bohannan, T.L.; Hays, M.D.; Fung, K.K. The application of thermal methods for determining chemical composition of carbonaceous aerosols: A review. J. Environ. Sci. Health 2007, 42, 1521–1541. [Google Scholar] [CrossRef]
  42. Chow, J.C.; Watson, J.G.; Robles, J.; Wang, X.L.; Chen, L.-W.A.; Trimble, D.L.; Kohl, S.D.; Tropp, R.J.; Fung, K.F. Quality assurance and quality control for thermal/optical analysis of aerosol samples for organic and elemental carbon. Anal. Bioanal. Chem. 2011, 401, 3141–3152. [Google Scholar] [CrossRef] [PubMed]
  43. Lee, S.C.; Chang, M. Indoor and outdoor air quality investigation at schools in Hong Kong. Chemosphere 2000, 41, 109–113. [Google Scholar] [CrossRef] [PubMed]
  44. Lai, A.C.K. Particle deposition indoors: A review. Indoor Air 2002, 12, 211–214. [Google Scholar] [CrossRef] [PubMed]
  45. Heudorf, U.; Neitzert, V.; Spark, J. Particulate matter and carbon dioxide in classrooms-The impact of cleaning and ventilation. Int. J. Hyg. Environ. Health 2009, 212, 45–55. [Google Scholar] [CrossRef] [PubMed]
  46. Slezakova, K.; Castro, D.; Pereira, M.C.; Morais, S.; Delerue-Matos, C.; Alvim-Ferraz, M.C. Influence of tobacco smoke on carcinogenic PAH composition in indoor PM10 and PM2.5. Atmos. Environ. 2009, 43, 6376–6382. [Google Scholar] [CrossRef]
  47. Alshitawi, M.S.; Awbi, H.B. Measurement and prediction of the effect of students’ activities on airborne particulate concentration in a classroom. Int. J. HVAC R Res. 2011, 17, 446–464. [Google Scholar]
  48. Zhang, Q.; Zhu, Y. Characterizing ultrafine particles and other air pollutants at five schools in South Texas. Indoor Air 2012, 22, 33–42. [Google Scholar] [CrossRef] [PubMed]
  49. Roger, J.; Guinot, B.; Cachier, H.; Mallet, M.; Dubovik, O.; Yu, T. Aerosol complexity in megacities: From size-resolved chemical composition to optical properties of the Beijing atmospheric particles. Geophys. Res. Lett. 2009, 36, L18806. [Google Scholar] [CrossRef]
  50. Gray, H.A.; Cass, G.R.; Huntzicker, J.J.; Heyerdahl, E.K.; Rau, J.A. Characteristics of atmospheric organic and elemental carbon particle concentrations in Los Angeles. Environ. Sci. Technol. 1986, 20, 580–589. [Google Scholar] [CrossRef] [PubMed]
  51. Watson, J.G.; Chow, J.C.; Houck, J.E. PM2.5 chemical source profiles for vehicle exhaust, vegetative burning, geological material, and coal burning in northwestern Colorado during 1995. Chemosphere 2001, 43, 1141–1151. [Google Scholar]
  52. Cachier, H.; Bremond, M.P.; Buat-Menard, P. Carbonaceous aerosols from different tropical biomass burning sources. Nature 1989, 340, 371–373. [Google Scholar] [CrossRef]
  53. Castro, L.M.; Pio, C.A.; Harrison, R.M.; Smith, D.J.T. Carbonaceous aerosol in urban and rural european atmospheres: Estimation of secondary organic carbon concentrations. Atmos. Environ. 1999, 33, 2771–2781. [Google Scholar] [CrossRef]
  54. Robinson, A.L.; Donahue, N.M.; Shrivastava, M.K.; Weitkamp, E.A.; Sage, A.M.; Grieshop, A.P.; Lane, T.E.; Pierce, J.R.; Pandis, S.N. Rethinking organic aerosols: Semivolatile emissions and photochemical aging. Science 2007, 315, 1259–1262. [Google Scholar] [CrossRef] [PubMed]
  55. Dockery, D.W.; Spengler, J.D. Indoor-outdoor relationships of respirable sulfates and particles. Atmos. Environ. 1981, 15, 335–343. [Google Scholar] [CrossRef]
  56. Guo, H.; Morawska, L.; He, C.R.; Zhang, Y.L.; Ayoko, G.; Cao, M. Characterization of particle number concentrations and PM2.5 in a school: Influence of outdoor air pollution on indoor air. Environ. Sci. Pollut. Res. Int. 2010, 17, 1268–1278. [Google Scholar] [CrossRef] [PubMed] [Green Version]
  57. Seinfeld, J.H.; Pandis, S.N. From Air Pollution to Climate Change; John Wiley & Sons: New York, NY, USA, 2006. [Google Scholar]
  58. Remer, L.A.; Chin, M.; DeCola, P.; Fein-gold, G.; Halthore, R.; Kahn, R.A.; Quinn, P.K.; Rind, D.; Schwartz, S.E.; Streets, D.G.; et al. Atmospheric Aerosol Properties and Climate Impacts: Aerosols and Their Climate Effects, 1–2. Available online: http://download.globalchange.gov/sap/sap2-3/sap2-3-final-report-FrontMatter.pdf (accessed on 9 March 2015).
  59. Shrivastava, M.K.; Lane, T.E.; Donahue, N.M.; Pandis, S.N.; Robinson, A.L. Effects of gas particle partitioning and aging of primary emissions on urban and regional organic aerosol concentrations. J. Geophys. Res. 2008, 113, D18301. [Google Scholar] [CrossRef]
  60. Huang, Y.; Lee, S.C.; Ho, K.F.; Ho, S.S.H.; Cao, N.Y.; Cheng, Y.; Gao, Y. Effect of ammonia on ozone-initiated formation of indoor secondary product with emissions from cleaning products. Atmos. Environ. 2012, 59, 224–231. [Google Scholar] [CrossRef]
  61. Colome, S.; Kado, N.; Jaques, P.; Kleinman, M. Indoor-outdoor air pollution relations: Particulate matter less than 10 mm in aerodynamic diameter (PM10) in homes of asthmatics. Atmos. Environ. 1992, 26A, 2173–2178. [Google Scholar] [CrossRef]
  62. Ho, K.F.; Cao, J.J.; Harrison, R.M.; Lee, S.C.; Bau, K.K. Indoor/outdoor relationships of organic carbon (OC) and elemental carbon (EC) in PM2.5 in roadside environment of Hong Kong. Atmos. Environ. 2004, 38, 6327–6335. [Google Scholar] [CrossRef]
  63. Zhu, C.S.; Cao, J.J.; Shen, Z.X.; Liu, S.X.; Zhang, T.; Zhao, Z.Z.; Xu, H.M.; Zhang, E.K. Indoor and outdoor chemical components of PM2.5 in the rural areas of Northwestern China. Aerosol Air Qual. Res. 2012, 12, 1157–1165. [Google Scholar]
  64. Jones, N.C.; Thornton, C.A.; Mark, D.; Harrison, R.M. Indoor/outdoor relationships of particulate matter in domestic homes with roadside, urban and rural locations. Atmos. Environ. 2000, 34, 2603–2612. [Google Scholar] [CrossRef]
  65. Huang, H.; Zou, C.W.; Cao, J.J.; Tsang, P.K.; Zhu, F.X.; Yu, C.L.; Xue, S.J. Water-soluble ions in PM2.5 on the Qianhu campus of Nanchang university, Nanchang city: Indoor-outdoor distribution and source implications. Aerosol Air Qual. Res. 2012, 12, 435–443. [Google Scholar]
  66. Huang, H.; Zou, C.W.; Cao, J.J.; Tsang, P.K. Carbonaceous aerosol characteristics in outdoor and indoor environments of Nanchang, China, during summer 2009. J. Air Waste Manag. Assoc. 2011, 61, 1262–1272. [Google Scholar] [PubMed]
  67. Watson, J.G.; Chow, J.C.; Lowenthal, D.H.; Pritchett, L.C.; Frazier, C.A.; Neuroth, G.R.; Robbins, R. Differences in the carbon composition of source profiles for diesel- and gasoline-powered vehicles. Atmos. Environ. 1994, 28, 2493–2505. [Google Scholar] [CrossRef]
  68. Chow, J.C.; Watson, J.G.; Chen, L.W.A.; Arnott, W.P.; Moosmuller, H.; Fung, K.K. Equivalence of elemental carbon by thermal/optical reflectance and transmittance with different temperature protocols. Environ. Sci. Technol. 2004, 38, 4414–4422. [Google Scholar] [CrossRef] [PubMed]
  69. Niu, Z.C.; Wang, S.; Chen, J.S.; Zhang, F.W.; Chen, X.Q.; He, C.; Lin, L.F.; Yin, L.Q.; Xu, L.L. Source contributions to carbonaceous species in PM2.5 and their uncertainty analysis at typical urban, peri-urban and background sites in southeast China. Environ. Pollut. 2013, 181, 107–114. [Google Scholar] [CrossRef] [PubMed]
  70. Kim, E.; Hopke, P.K. Improving source identification of fine particles in a rural northeastern US area utilizing temperature-resolved carbon fractions. J. Geophys. Res. 2004, 109, 1–13. [Google Scholar]
  71. Cao, J.J.; Lee, S.C.; Ho, K.F.; Fung, K.; Chow, J.C.; Watson, J.G. Characterization of roadside fine particulate carbon and its eight fractions in Hong Kong. Aerosol Air Qual. Res. 2006, 6, 106–122. [Google Scholar]

