2. Heliosat
Within this study the Heliosat method ([
2,
10]) is used to retrieve the effective cloud albedo (also referred to as cloud index) from visible images of geostationary satellites. As a first step of the retrieval procedure the effect of variations in the Sun-Earth distance and the solar zenith angle have to be corrected in order to normalize the illuminance conditions. Furthermore, the dark offset of the instrument has to be subtracted from the counts measured by the satellite instrument. Thus, the observed reflections are normalized by application of Equation (
1):
Here, D is the observed digital count including the dark offset of the satellite instrument. is the dark offset, θ is the solar zenith angle and f corrects the variations in the Sun-Earth distance. The resulting ρ is the normalized reflection based on the satellite measurements.
The effective cloud albedo (CAL) is then derived from the normalized reflections by using Equation (
2):
Here,
ρ is the observed normalized reflection for each pixel and time.
is the clear sky reflection, which is a monthly value derived for every pixel and time slot separately. This is done by iteration as follows. First, all reflection values
ρ (within the time span covering usually 1 month) are used to calculate an average reflection
. This average reflection serves as initial threshold value
. A new average is then calculated with all reflections that are smaller than the initial threshold value plus a small value
σ, given as
This average is then the threshold for the next iteration, where again all reflection values below
are used to calculate a new value for
. The iteration is proceeded until no reflection value is available that is higher than
, hence until the threshold does not change any more.
is then set equal to the final
. It is assumed that at this point all cloudy pixels are filtered out.
is the “maximum" reflection. It is determined by the 95 percentile of all reflection values at local noon in a target region, characterized by high frequency of cloud occurrence for each month. In this manner changes in the satellite brightness sensitivity are accounted for. Further details are given in [
16].
The effective cloud albedo (cloud index) is subsequently used to estimate the all sky irradiance, in general (CAL between 0 and 0.8) by:
Hence, the application of a clear sky model enables the estimation of the all sky irradiance. For this step information about aerosols is needed, either directly or within turbidity information. For the calculation of the clear sky radiation the sophisticated SPECMAGIC method is used, which is described in detail in [
16]. It is based on radiative transfer modeling and enables an appropriate treatment of the aerosol effect on solar surface irradiance.
3. Results and Discussion
As described in
Section 2,
is a statistical minimum of the observed reflectances, which is retrieved from visible images. Clouds increase the reflection signal, hence
ρ is usually higher than
in the presence of clouds.
represents therefore in a statistical manner the “clear sky” reflection. However, higher
ρ values might also occur in cloud free situations during the occurrence of specific aerosol events like biomass burning or desert storms. These events lead typically to a temporal increase of aerosol optical depth relative to the background/climatological value. In order to investigate this possible effect theoretically radiative transfer calculations have been performed with libRadtran [
17].
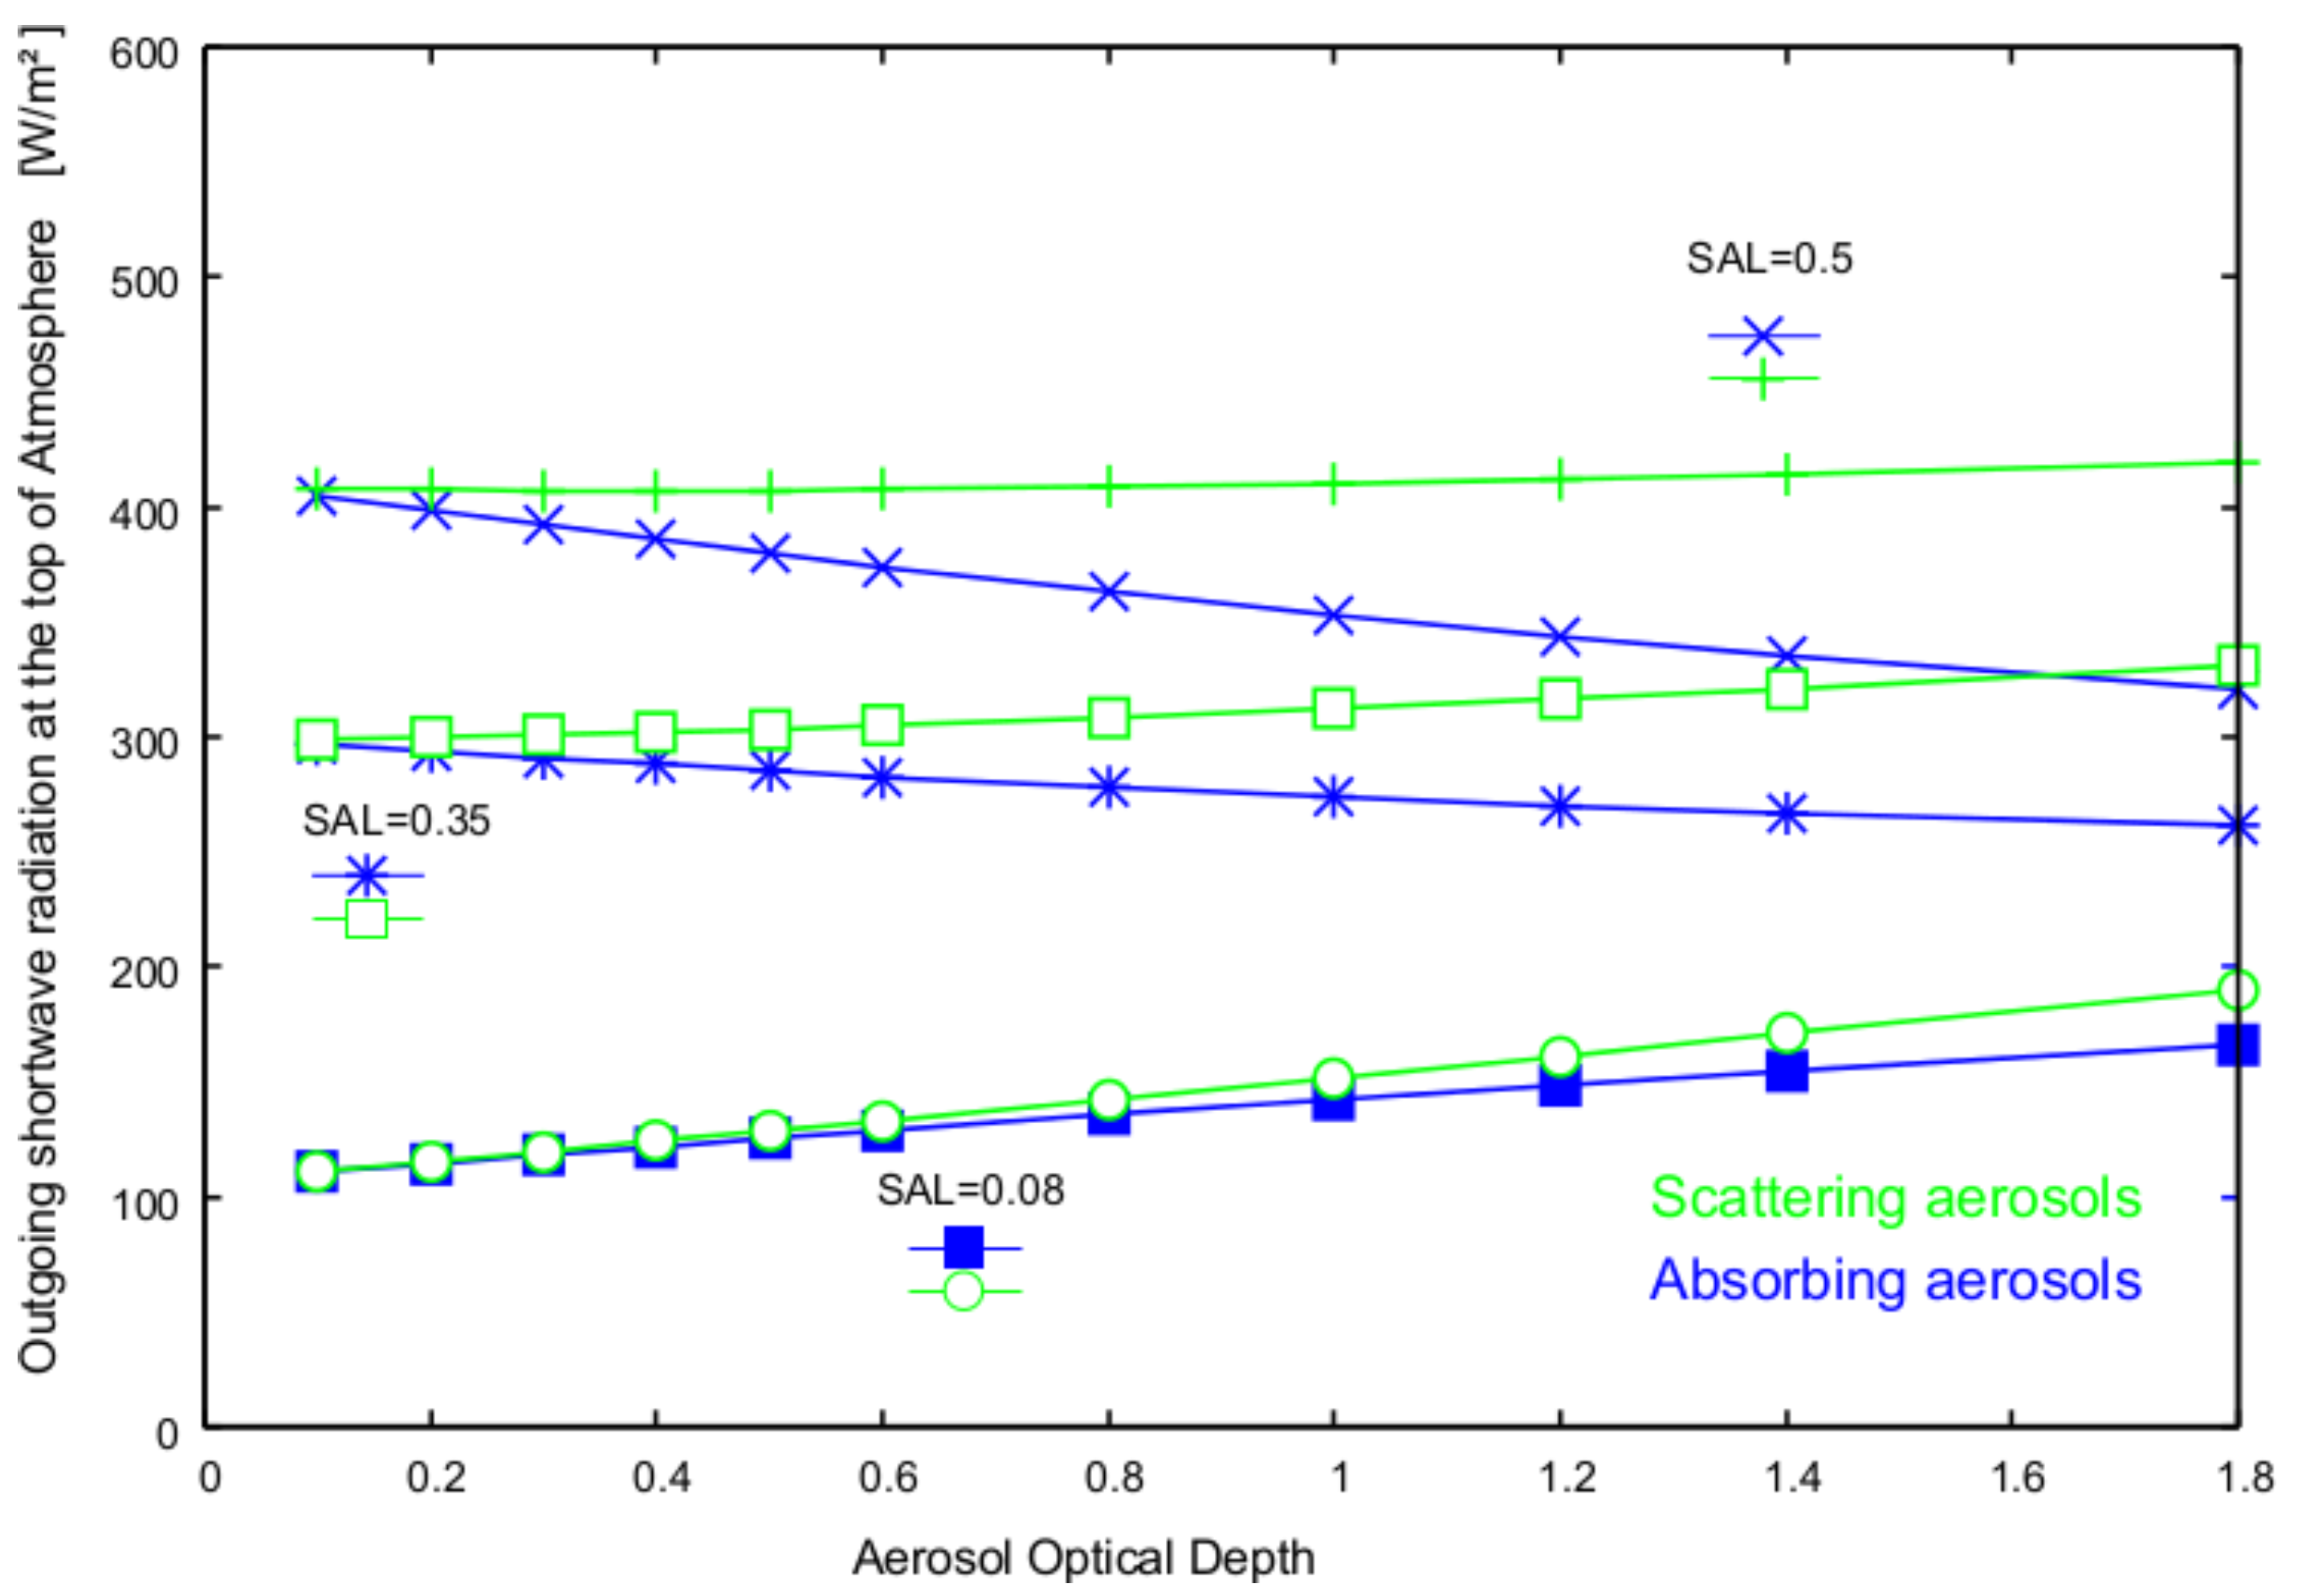
Figure 1 shows that the increase of scattering aerosols is coupled with the increase of the planetary reflection, and hence with the increase of the reflection signal received by the satellite. As the statistical method estimates the “minimum reflection” it has in turn to be expected that in these cases
ρ is significantly higher than
for a certain period. Thus, that aerosol events are at least partly treated as clouds, leading to increased values of CAL, even in cloud free situations.
Figure 1.
Results of the radiative transfer modeling with libRadtran for US-standard atmosphere, 335 DU ozone, 15 mm water vapor and scattering aerosols (ssa = 0.99). Increase of the aerosol optical depth leads to a significant increase for low to high surface albedo (SAL) values. Only for very high SAL values above 0.5 the increase is getting insignificant. For low to high SAL (up to ca. 0.45) it has to be expected that a temporary increase of AOD induced by specific aerosol events leads to an increase of cloud albedo (CAL) values.
Indeed comparison of CAL images with SeaWIFS (Sea-viewing Wide Field-of-view Sensor) ocean color images [
18] and MODIS (Moderate-Resolution Imaging Spectroradiometer) fire images [
19] show evidence that aerosol clouds lead to enhanced CAL values even for cloud-free skies.
Figure 2 and
Figure 3 show respective examples.
In Sede Boker and Tamanrasset AERONET stations [
20] are operated in addition to the BSRN stations. The respective AOD measurements at 500 nm/675 nm show high variability of AOD and regularly occurring high AOD values above 0.4. Therefore, the relation between AOD and CAL has been investigated at these sites for the period 2006–2009.
Table 1 shows that on average CAL increases with increasing AOD, which provides further evidence that high AOD values induced by dust events leads to an increase in the observed CAL values.
In summary, empirical findings and RTM results give evidence that the aerosol effect on solar surface irradiance is partly considered by an increase of CAL. Hence, truncation of high aerosol values in the MACC aerosol climatology might lead to better results in the estimated solar surface irradiance than using the original MACC data. Further, also climatological background values might work well. Therefore, the performance of “original” MACC aerosol information is compared to a truncated MACC version and to constant aerosol approaches, in detail Aerosol Optical Depth of 0.18 and 0.0 in the troposphere, respectively. An AOD of 0.18 corresponds approximately to the constant visibility of 20 km, which has been proven to perform well within the SAF comparison study [
15].
The “original” MACC aerosol information results from a data assimilation system for global reactive gases, aerosols and greenhouse gases. It consists of a forward model for aerosol composition and dynamics [
22] and the data assimilation procedure described in detail in [
23]. The data is generated by the European Centre for Medium Range Weather Forecasts.
The truncation of the MACC aerosol information, referred to as MACC modified (MACCmod), is performed as follows:
Here, is the truncated AOD and is the original MACC AOD. Monthly long term means on a 0.5 × 0.5 degree latitude-longitude grid are used. The pixel value is derived by spatial interpolation and assignment of the respective monthly mean.
Figure 2.
Example of the effect of aerosol events on CAL. The SesWIFS image from 26 February 2000 [
18,
21] shows clearly a dust storm over parts of the land and ocean (top, yellowish color). The “dust cloud” shows a different texture than the surrounding water clouds. This dust cloud leads to a significantly increased CAL value (bottom), which subsequently leads to significantly lower solar surface radiation, see
Figure 4. The top figure has been provided by SeaWIFS project, NASA/GSFC and ORBIMAGE.
Figure 3.
Biomass burning (red color) leads to biomass burning “clouds” in theMODIS [
19,
26] fire monitoring image, 13 June 2003, 12:30 (top). The thick fire clouds with large geographical coverage are also apparent as increased CAL values (pale blue) in the CAL image (same time). However, compared to the desert event images the effect seems to be less pronounced. This item will be discussed later on.
Figure 4.
Example for the effect of high CAL values induced by aerosol events. The high CAL values induced by the dust storm (
Figure 2) leads to a significant reduction of the direct normal irradiance relative to the surrounding area.
Figure 4.
Example for the effect of high CAL values induced by aerosol events. The high CAL values induced by the dust storm (
Figure 2) leads to a significant reduction of the direct normal irradiance relative to the surrounding area.
Table 1.
Comparison of CAL and AOD for the sites Tamanrasset (TAM) and Sede Boker (SBO). Only tuples where the observation matches within ±1 min have been used. On average the values of CAL increase with increasing AOD, hence with increasing frequency of dust storms. The CAL images as well as the AERONET AOD time series show that there is a relative high frequency of clouds, in particular of optical thin clouds. The satellite observes an area of about 3 × 3 km while the AERONET measurements look straight towards the sun. Thus, the cloud screening is different for the two observations, which explains that CAL is on average not zero for background aerosol, although, AOD is theoretically only observed in clear sky. The AOD at 500 nm has been used for Sede Boker. Tamanrasset does not provide data around 500 nm, thus, 675 nm has been used. SBO/TAM in the table means that the results for Sede Boker are on the left hand and that for Tamanrasset on the right hand of the "/" sign.
| AOD Bin | AOD Mean | CAL Mean | Increase in CAL | Number of Tuples |
|---|
| SBO/TAM | SBO/TAM | SBO/TAM | SBO/TAM |
|---|
| <0.15 | 0.09/0.06 | 0.058/0.010 | - | 947/883 |
| 0.15–0.4 | 0.23/0.23 | 0.067/0.024 | 0.01/0.014 | 766/274 |
| >0.4 | 0.64/0.68 | 0.145/0.080 | 0.087/0.07 | 109/113 |
MACC is used as baseline for the comparison study as it has been evaluated to perform significantly better than the “Kinne” [
24] GADS/OPAC [
7,
8] and MAC-v1 climatology [
6], see [
5] for further details.
For the estimation of the solar surface irradiance, and thus the comparison study, the same retrieval method than in [
5] has been used. The method is referred to as SPECMAGIC and consists of the Heliosat approach for the treatment of the cloud effect (CAL) and a spectrally resolved clear sky model, the complete approach is described and discussed in detail in [
3,
16]. Monthly means of solar surface irradiance are calculated using the different aerosol information described above and subsequently compared to ground measurements of the Baseline Surface Radiation Network (BSRN) [
25] for all sky conditions. The comparison is performed for the period of 2006 to 2009. The BSRN stations used for the validation are listed in
Table 2. Only those stations were used that cover at least a period of 1 year. The stations and periods correspond to that used in [
5].
Table 2.
List of Baseline Surface Radiation Network (BSRN) stations used.
Table 2.
List of Baseline Surface Radiation Network (BSRN) stations used.
| Station | Country | Code | Latitude | Longitude | Elevation | Number of Months |
|---|
| | |
|---|
| Palaiseau | France | pal | 48.73 | 2.21 | 156 | 16 |
| Lerwick | UK | ler | 60.13 | −1.18 | 84 | 13 |
| Lindenberg | Germany | lin | 52.21 | 14.12 | 125 | 12 |
| Carpentras | France | car | 44.05 | 5.03 | 100 | 48 |
| Payerne | Switzerland | pay | 46.81 | 6.94 | 491 | 48 |
| Sede Boker | Israel | sbo | 30.9 | 34.78 | 500 | 48 |
| Tamanrasset | Algeria | tam | 22.78 | 5.51 | 1385 | 48 |
| Toravere | Estonia | tor | 58.25 | 26.46 | 70 | 48 |
| Cabauw | Netherlands | cab | 51.97 | 4.93 | 0 | 48 |
The stations cover different climates, but the majority is located in regions with weak to moderate aerosol loads and variations. Exceptions are Sede Boker and Tamanrasset which are located close to and in the Sahara desert, respectively. The limited number of stations does not allow to draw final conclusions on the global performance of the investigated aerosol information.
For the comparison only the aerosol information has been altered, all other input variables remained unchanged. Hence, the differences in the error measures can only result from the different aerosol information. As main error measure the Mean Absolute Bias (MAB) and Bias are used. The MAB and bias are defined by Equations (
5) and (
6).
RADmm is the monthly mean of radiation for satellite (sat) and ground based measurements (gbm), respectively, and n is the number of the monthly means. The absolute bias is preferred as, in contrast to RMSE, it is a linear quantity and avoids bias cancellation of errors across months or stations.
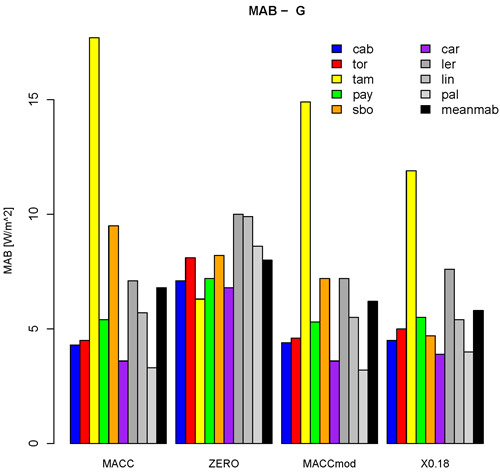
Figure 5.
Mean Absolute Bias of the global irradiance (MAB-G, top) and the direct irradiance (MAB-B, bottom) for MACC, MACCmod and the zero and 0.18 AOD assumptions, evaluated at nine different Baseline Surface Radiation Network (BSRN) stations (colored bars). “meanmab” is the mean MAB over all nine stations. The effect of aerosols on direct irradiance is much more pronounced. As a result much higher errors are apparent for direct irradiance than for global irradiance.
Figure 6.
Bias for the global irradiance (Bias-G, top) and direct irradiance (Bias-B, bottom).
Figure 6.
Bias for the global irradiance (Bias-G, top) and direct irradiance (Bias-B, bottom).
Table 3.
Mean Absolute Bias (MAB) over all stations for global irradiance G and direct (beam) irradiance B in absolute units and relative units, MAB deviation relative to the mean . The last two lines show the bias in . The AOD = 0 and AOD = 0.18 columns provide the results for zero and 0.18 AOD of tropospheric aerosol.
| Variable | MACC | AOD = 0 | MACCmod | AOD = 0.18 |
|---|
| MAB G in | 6.8 | 8.0 | 6.2 | 5.8 |
| in | 3.8 | 4.5 | 3.4 | 3.3 |
| MAB B in | 11.3 | 25.8 | 9.7 | 10.5 |
| in | 9.6 | 21.9 | 8.2 | 8.9 |
| Bias G in | −4.0 | 5.4 | −3.0 | −1.5 |
| Bias B in | −7.6 | 24.6 | −3.3 | 2.1 |
The use of the MACC modified climatology leads to a considerable increase in the accuracy of the estimated surface radiation compared to the original MACC data, in particular when the results at the stations Tamanrasset and Sede Boker are appropriately considered. These stations are located in, respectively, close to the Sahara desert region where desert storms occur regularly, and thus higher variability of AOD has to be expected. The use of MACC, MACCmod and an AOD of 0.18 result in better accuracies than the zero aerosol approach, which means that all these approaches provide useful information compared to the zero assumption. However, the accuracy in the retrieved solar surface irradiance is higher using the constant aerosol optical depth of 0.18 than using the MACC data. But, for the interpretation of this result it has to be considered that the majority of stations are located in Europe. There 0.18 is probably a good climatological value. This assumption is supported by the SAF surface radiation inter-comparison study [
15], where a constant AOD value of around 0.18 (visibility of 20 km) has performed well over Europe [
15]. Higher aerosol loads at Tamanrasset and Sede Boker induced by desert storms might be partly considered by the effective cloud albedo on the other hand. These arguments might explain the good performance of the 0.18 AOD approach.
The results show that aerosol information used within the clear sky model has to be modified in order to account for the aerosol effect on the CAL retrieval. Otherwise, the effect of scattering aerosols is considered twice, increasing the uncertainty of the retrieved solar surface irradiance. However, the best manner for the correction of aerosol information is not straightforward and needs further investigations, which in turn requires accurate information about the single scattering albedo (aerosol type) as pre-requisite. This is due to the fact that aerosols with high absorption rate (urban aerosols) behave different to scattering aerosols. For low to moderate surface albedo the planetary reflection still increases with increasing AOD, but the increase is much lower than for scattering aerosols. Yet, for higher surface albedo the reflection decreases with increasing AOD of urban aerosols, see
Figure 7. Hence, the magnitude of the aerosol effect on CAL depends on the single scattering albedo, in other words, on the aerosol type. Indeed, by comparison of the biomass and desert storm events it seems that the effect of biomass burning is less pronounced. One reason could be that the single scattering albedo is expected to be significantly higher for dust than for biomass burning aerosols, which contains soot. Thus, for an optimal adjustment of the aerosol information applied in the clear sky model accurate knowledge of the single scattering albedo and the surface albedo is required.
Figure 7.
Results of the radiative transfer modeling with libRadtran for US-standard atmosphere, 335 DU ozone, 15 mm water vapor for scattering aerosols (ssa = 0.99) and urban (absorbing) aerosols (ssa ca. 0.8). For absorbing aerosols the increase of the aerosol optical depth leads to a significant decrease of the planetary reflection for bright surfaces. This behavior is quite contrary for scattering aerosols.
A good potential to generate reliable single scattering albedo data might be given by the MACC project itself. MACC provides beside the total AOD also the black carbon AOD. The relation of total AOD and black carbon AOD can be used to estimate the single scattering albedo. However, using this information in order to achieve a better accuracy of solar surface radiation is not a trivial task, given that the accuracy of the solar surface radiation is already close to that of ground based measurements. It requires further and detailed RTM studies, which are out of the scope of this study, but which are intended as a next step towards optimal aerosol information for the retrieval of solar surface radiation using Heliosat.
The results discussed here might be also relevant for the retrieval of cloud fraction and cloud properties using other methods that do not include an appropriate separation between water and aerosol clouds. Descriptively, the dust outbreak illustrated in
Figure 2 leads also to an enhanced cloud fraction in the CLARA-A1 [
27] data set.
Further, it has to be also considered that errors in the MACC aerosol information (overestimation of AOD) might contribute to the better performance of MACC modified and the 0.18 AOD assumption.
Howsoever, the results (e.g., better performance of 0.18 AOD approach) show that it can not be assumed a priori that higher spatial and temporal resolution of aerosol information applied within the clear sky model lead to higher accuracies in the retrieved solar surface irradiance.


