Abstract
This study examines the variability of precipitation in the south-east of Tunisia through the analysis of data about annual and monthly precipitation at five stations in the Watershed of Gabes, from 1977 to 2015. Standardized precipitation ratio, wavelet and coherence wavelet analyses were applied to examine the temporal variability of monthly and annual precipitation and to determine the effect of climatic fluctuations on rainfall variability. Results of wavelet analysis showed varied energy bands at the studied stations at annual and inter-annual scales. The depicted bands spread according to intervals of 1-, 2- to 4-, 4- to 8- and 8- to 12-year cycles, obviously influenced by regional factors including altitude, proximity to the Mediterranean Sea and global fluctuations. Eventually, an analysis of wavelet coherence showed a strong correlation between precipitation and Mediterranean Oscillation (MO) in Gabes Watershed at different temporal scales. Contribution of the MO ranged between 51% and 93% of fluctuations (8–12 years) in the different examined rainfall stations.
1. Introduction
In recent decades, climate change has had a considerable impact on natural systems and human life. According to a recent assessment report on climate change [1], precipitation pattern changes and temperature increases have had an impact on the hydrologic system in numerous regions. It resulted in weather condition alterations and climatic extremes. Potential climate change can affect the hydrological cycle largely through changes in spatio-temporal patterns of precipitation [2,3,4], increase of temperatures [5], frequent occurrence of hydrological extremes, such as floods and drought [6], rise of sea level [7], reduction of snow cover and changes in soil moisture [8], etc. Undoubtedly, semi-arid and arid areas of the Mediterranean Basin are among the zones affected by climate change [9]. In this context, it is important to identify and characterize the variability of precipitation in space and time in the region and its relationship with climate change. This will be particularly relevant for the interpretation of the corresponding changes in the hydrological cycle.
Precipitation is a key meteorological parameter for the occurrence of hydrological extremes (droughts or floods). Understanding rainfall patterns and trends is vital for an efficient and sustainable management of water resources. It helps improve water management strategies, save resources and plan accurate agricultural production activities [10]. Investigation of rainfall trends is vital to the anticipation and management of the potential climate change implications to water resources [11].
Different studies have examined the variability of rainfall over time and space using statistical methods, such as principal component analysis, kriging, and standardized precipitation index (SPI) [10,11,12,13,14]. However, statistical methods have several limitations due to the complexity of the precipitation variability, taking into account their non-linearity and non-stationarity. The method of wavelet transforms has been introduced as an alternative due to its capacity to capture temporal variability at multiple scales. It is a robust mathematical device that yields a time-scale signal representation and is primarily useful in the study of non-stationary associations using time series data. Wavelet transform provides the decomposition of precipitation time series inside time–frequency spaces by identifying the principal variability modes; their temporal distribution into spectra. In this investigation, we applied continuous wavelet transform to provide a better exploration of time-varying structures of the monthly rainfall data and the links between precipitation and climate during the whole of Gabes Watershed.
In hydrology, several studies recently applied the wavelet method to investigate meteorological variables including precipitation and detect climate changes over time. These include research studies by Coulibaly [15], Mishra et al. [16], Rashid et al. [17] and Joshi et al. [18] among others who examined precipitation patterns in humid and arid regions around the world. Coulibaly [15] applied the wavelet approach to simulate the spatio-temporal variability of seasonal precipitation in Canada. The Canadian seasonal rainfall was dominated by the following bands: 3–6 and 2–3 year activity. The clear differences between timing and intensity of the temporal distribution in terms of seasons were highlighted. For 6–12 year bands, it was dominated by white noise in the spectra at the totality of seasons. Additionally, human-induced land cover modifications and the global warming phenomenon were associated with changing rainfall patterns [14]. Mishra et al. [16] used wavelet transforms to perform wet and dry episode analyses of precipitation generated by a global climate model. Rashid et al. [17] focused on the subdivision of the input precipitation time series in distinct periodicities by the wavelet method and statistical investigation to detect trends in precipitation at various time scales. This study was elaborated in South Australia (Watershed of Onkaparinga) at 30 rainfall stations from 1960 to 2010. Joshi et al. [18] applied wavelet transform coupled with Mann-Kendall to study the prevailing tendency and periodicity related to drought in India from 1871 to 2012.
A better understanding of global climate fluctuations will result in a better explanation of rainfall variability. Global fluctuations are mainly attributed to changes in climate indices, as the North Atlantic Oscillation (NAO), the Southern Oscillation Index (SOI), etc. Such diagnostic tools are used to depict the condition of a climatic system and understand different climate mechanisms [19]. Numerous studies have used climate indicators in order to define the variability of climatic and hydrologic components. These include Massei et al. [20], Rampelotto et al. [21], Hermida et al. [22], Jobin and Prasannakumar [23], Saghafian et al. [24], Churchill [25]; Turki et al. [26] among others.
Massei et al. [20] showed that fluctuations in the Seine River (France) stream flow could be associated with the NAO components, large time variability shifts and a trend progress in accordance with the low frequency of NAO’s fluctuation. In the same context, Rampelotto et al. [21] examined the precipitation and temperature fluctuations in Santa Maria (southern Brazil) over a long period and elucidate their likely link with natural phenomena including solar activity and the El Niño Southern index (ENSO). Spectral analyses proved that temperature and rainfall frequencies evolve in parallel. In fact, the variability of rainfall and temperature was proved to be closely dependent on of SOI Index and solar activity. ENSO and solar activity also have a probable relevant influence on the climatic system in south of Brazil [21]. Hermida et al. [22] analyzed precipitation in south-western France from 1901 to 2010, and established a link between total precipitation and hail variables. The author also examined links between precipitation and climate indices in particular NAO, in south-western France. Jobin and Prasannakumar [23] characterized temporal variability of rainfall (1871–2012) in Kerala State of India by means of the wavelet approach. The analysis of variability of precipitation over a period of 141 years showed decreasing and rather increasing trends for the different monsoon phases. The analysis of annual and seasonal rainfall revealed inconsistent periodicities (2–8 years) conforming to the periodicity of ENSO. Saghafian [24] studied the effects of ENSO on the annual maximal flood in the south-west of Iran. ENSO index was additionally correlated with annual maximum flood. It was indicating that El Niño phenomenon reinforces March–April floods comparing to neutral conditions.
In this context, this paper examines the temporal variability of precipitation in Gabes Basin (south-east of Tunisia), which stands as a representative instance of the arid Mediterranean climate. We applied statistical and spectral analysis techniques to annual and monthly precipitation data in five rainfall stations distributed over the Gabes basin, to illustrate the variability modes at annual and inter-annual scales. Next, various climate forcing factors (precipitation, climate indices) were examined and analyzed so as to unveil the origin of this variability.
2. Materials and Methods
2.1. Study Basin and Data Employed
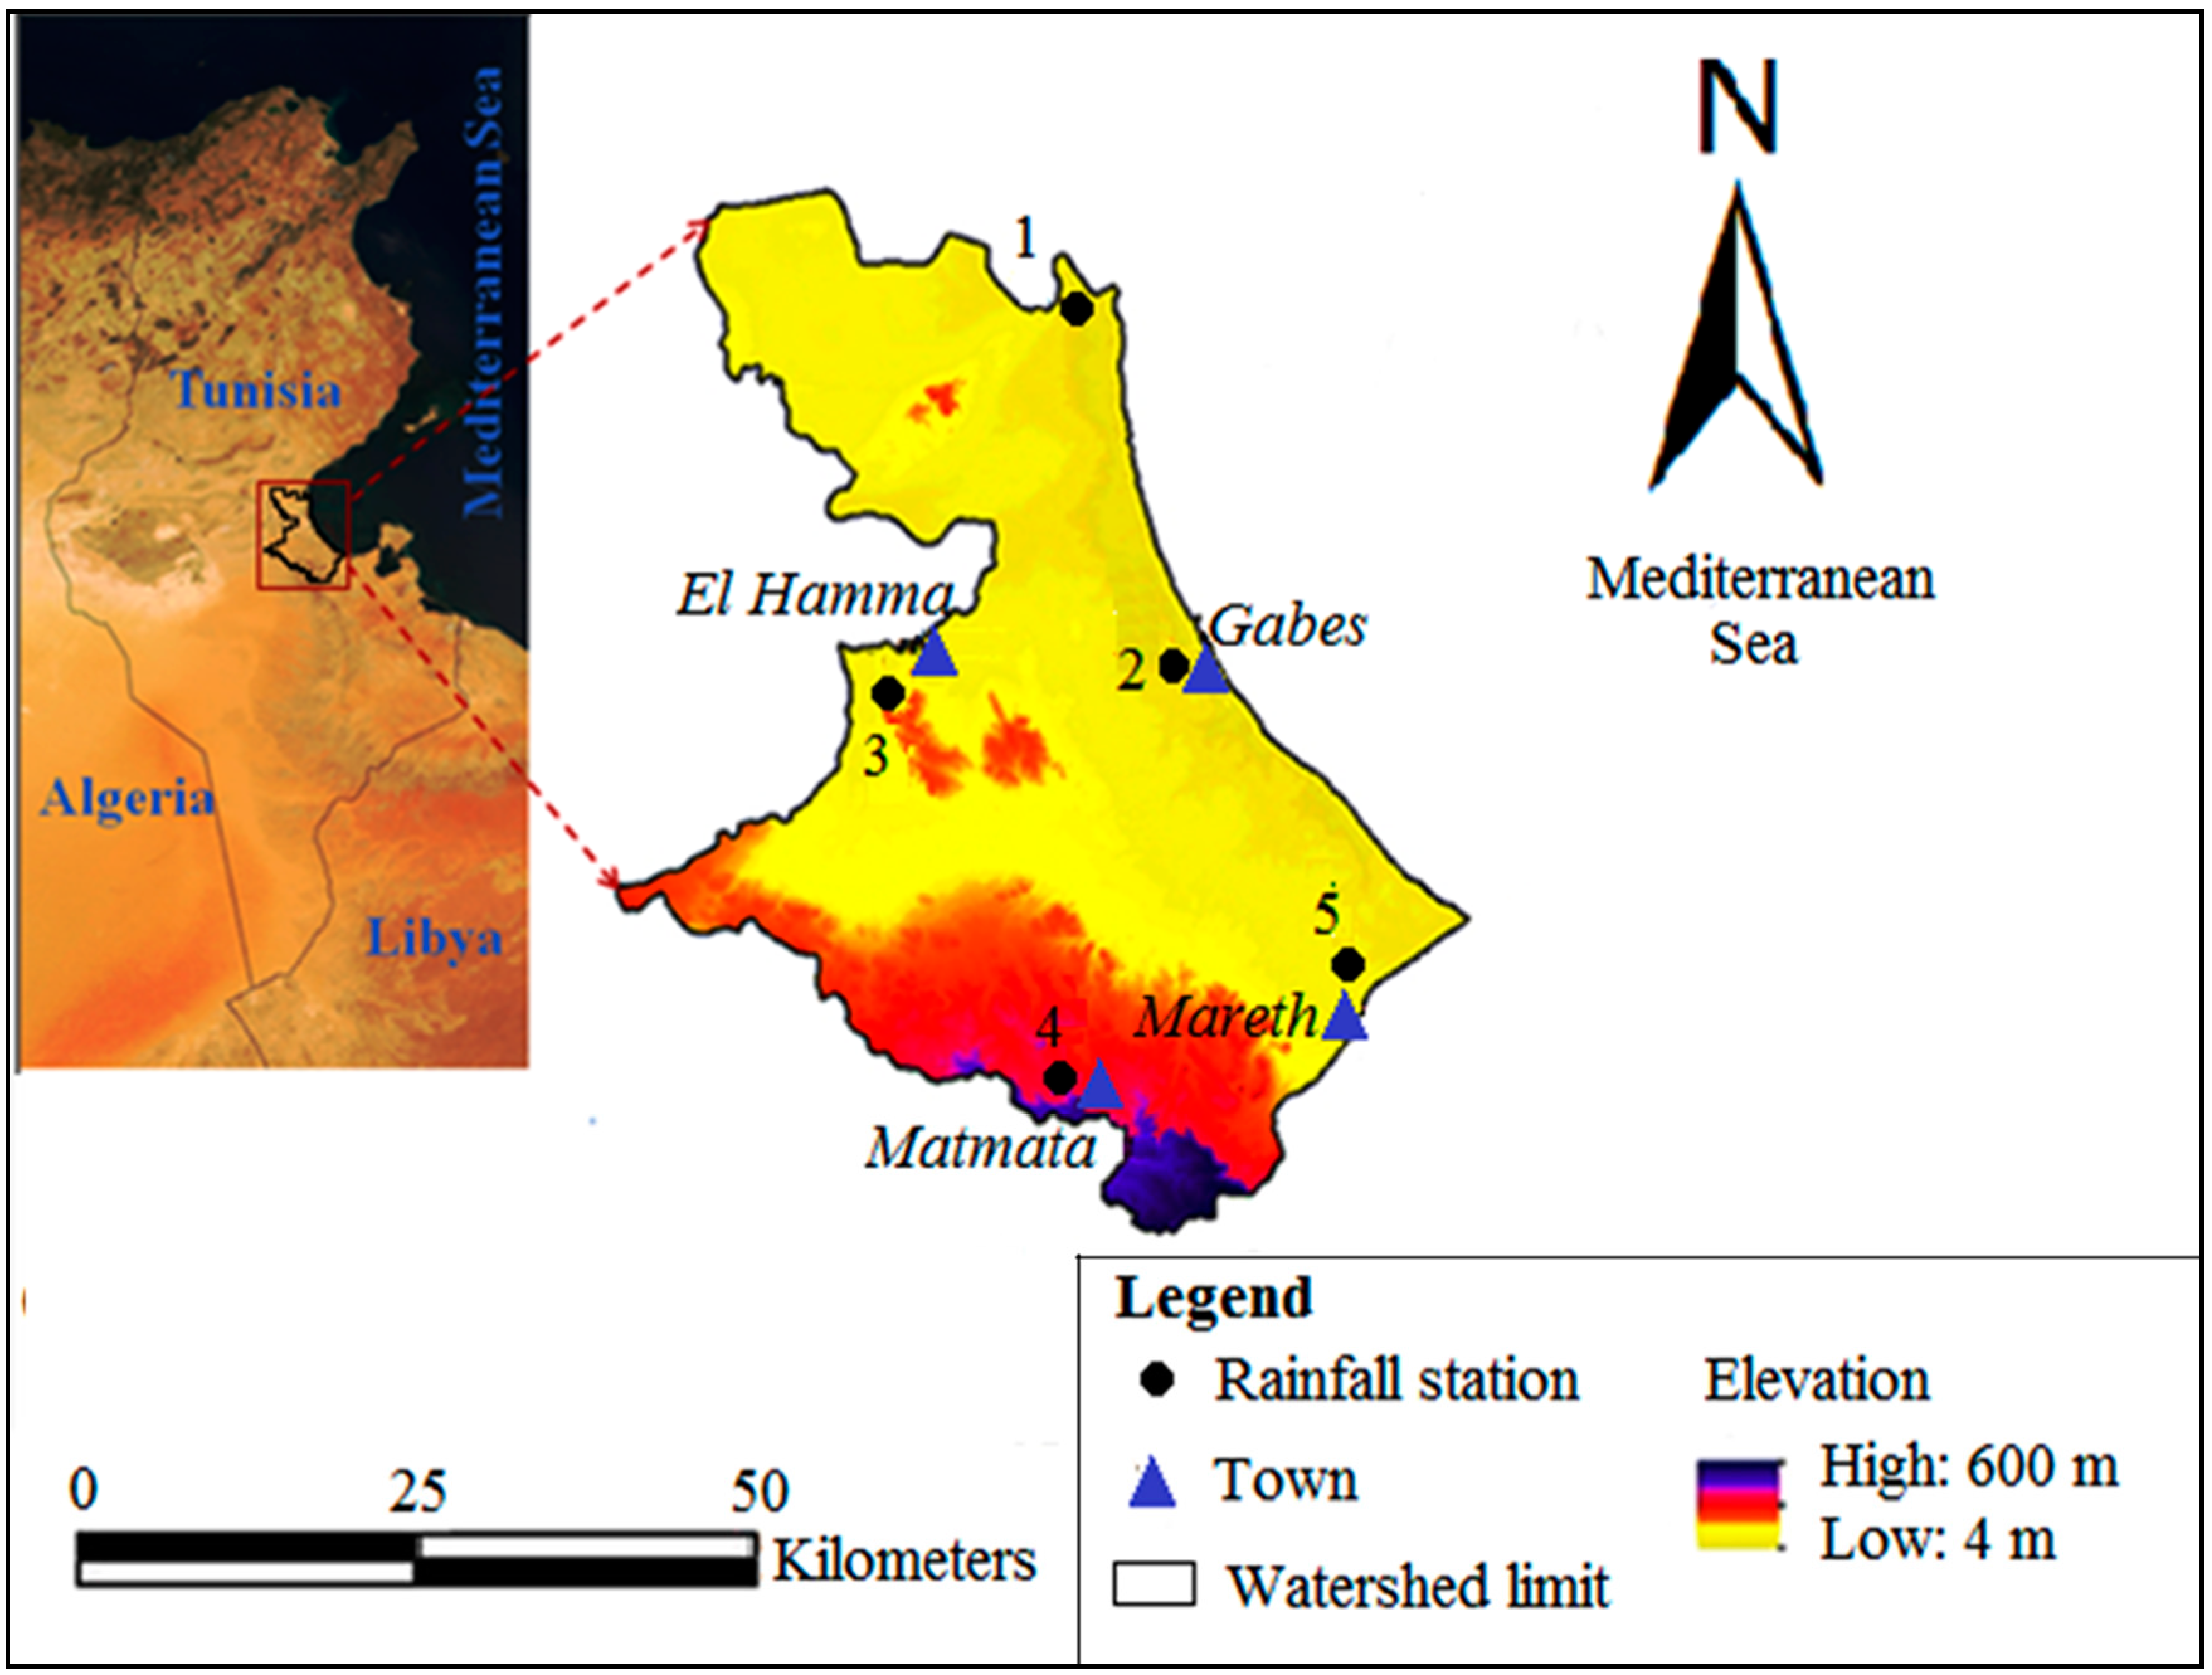
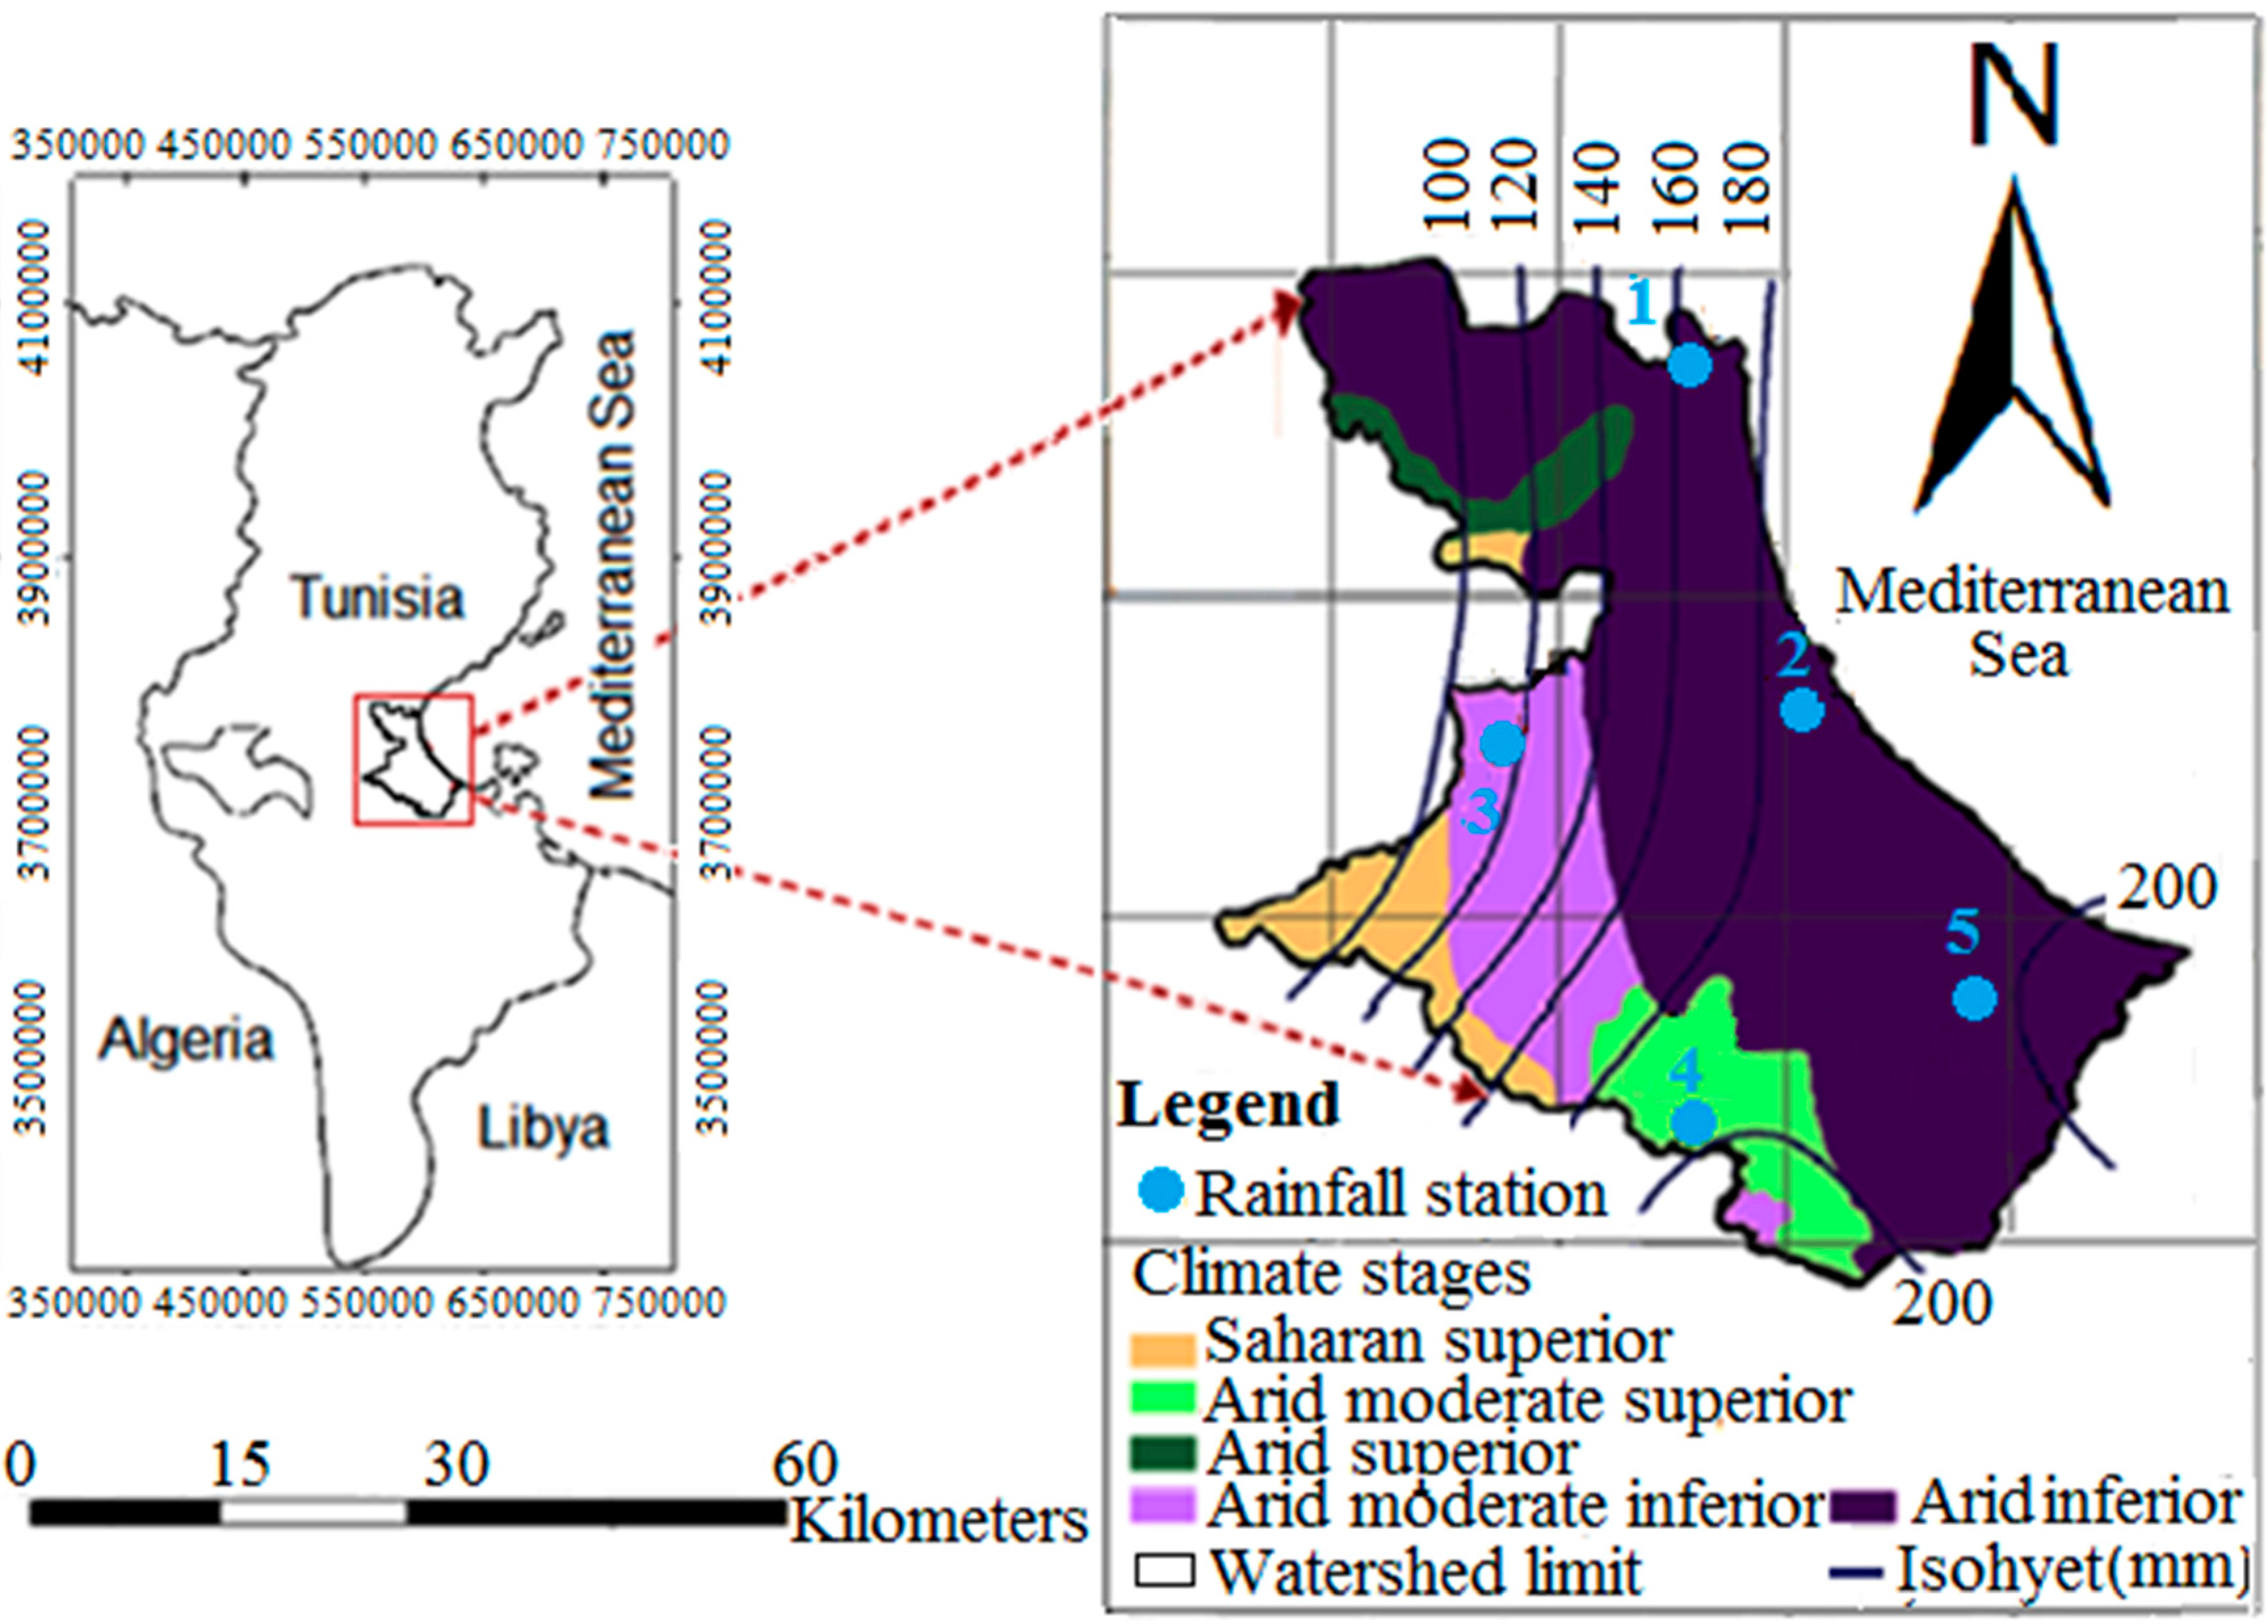
The Watershed of Gabes lies in the south-east of Tunisia. It covers 3125 km2 between the longitudinal lines 9° E and 10° E and 33° N to 34° N latitudinal. According to the Digital Elevation Model presented in Figure 1, Watershed of Gabes is principally plane along altitudes mostly not exceeding 100 m. The mountainous region of Matmata in the south represents the exception, with altitudes varying between 120 and 610 m. The study basin is also characterized by the existence of low and humid zones. The study area also has an arid Mediterranean climate, with hot dry summers and mild wet winters (Figure 2). It is influenced, due to its location, by the Mediterranean Sea in east and the Sahara in the south. In summer, it is the Sahara that influences as it is exposed to the cyclonic conditions.
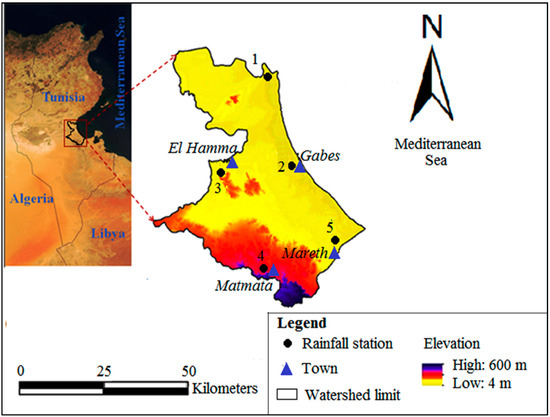
Figure 1.
The Digital Elevation Model (DEM) of Gabes Watershed. (Jemai et al. [14], modified).
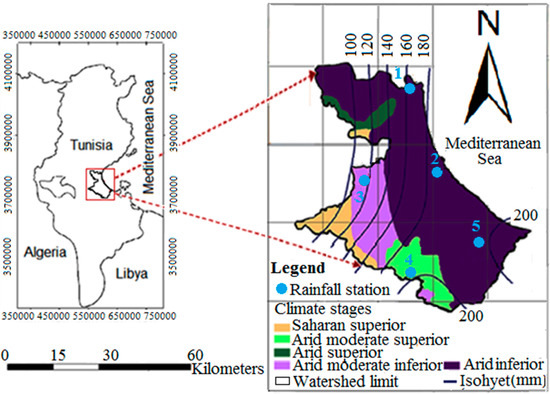
Figure 2.
Bioclimatic map of Gabes Watershed.
During the study period, mean annual temperatures fluctuated between 16 °C and 24 °C. Mean potential evaporation varied from 1500 mm to 2000 mm. Gabes region is fairly windy where the wind blows 300 days per year. The region is mainly under the influence of sea winds from the north-east and east, which are beneficial because they bring a lot of moisture. Unlike these sea winds, western winds originating from the high continental hinterland are violent and dry. Finally, south-west winds are the least frequent (25 days/year) but the most devastating. It is a particular sirocco wind in the Matmata region south of Gabes that greatly lowers the humidity of the air by increasing its temperature. Rainfall around the study area is typically scarce, with extreme events that frequently result in flash floods. The mean annual precipitation varies from 100 to 200 mm in the Gabes basin [14].
We collected precipitation data at 5 rainfall stations in the Watershed on a monthly scale from 1977 to 2015. These reference stations are homogeneously distributed and represent the different zones in the study basin (Figure 1). We obtained precipitation data from the Tunisian Ministry of Agriculture and Water Resources [27]. Most study stations are coastal with altitudes not exceeding 100 m. Station 4 is the exception (441 m.a.s.l). This station lies in the mountainous zone of Matmata in the south of the study area. Rainfall data sets firstly underwent the test of Mann-Kendall. It was for randomness, homogeneity and absence of trends. All five selected stations passed the test with a rate of 95% as confidence interval.
In this study, the main climate indices employed to detect climate variability are the Atlantic Multidecadal Oscillation (AMO), the Arctic Oscillation (AO), the North Atlantic Oscillation (NAO), the Mediterranean Oscillation (MO), the West Mediterranean Oscillation (WeMO), the Pacific Decadal Oscillation (PDO), the Southern Oscillation Index (SOI) and the Pacific–North-America teleconnection (PNA). Data about monthly climate indices were obtained from NOAA Climate Prediction Center (CPC), Climatic Research Unit (CRU) and Joint Institute for the Study of the Atmosphere and Ocean (JISAO) during the period 1977–2015. MO and WeMO indices data extend over two different periods, namely 1977 to 2000 and 1977 to 2013 respectively.
2.2. Methodology
An analysis of the standardized precipitation ratio was first performed on the annual scale to identify alternating dry and wet periods. Then, analytical and spectral tools (continuous wavelet transform and wavelet coherence analysis) were used to identify the variability modes and determine the origin of this variability. Obtained data were processed via the R software [28] and Sowas package [29] in order to perform continuous wavelet transform and wavelet coherence analysis and determine the coherence rate [20,30,31].
2.2.1. Standardized Precipitation Ratio
The standardized precipitation ratio (Ip) was used to determine dry and wet periods and their alternations according to positive (wet) and negative (dry) values. It is a dimensionless parameter, based on the ratio of the precipitation difference from the mean to standard deviation (Equation (1)). It is described as follows:
where
- : Rainfall for a given study year;
- : Average rainfall during a given study period;
- σ: Standard deviation of rainfall for the same period.
2.2.2. Continuous Wavelet Transform
Continuous wavelet transform is recognized as one of the robust tools for the investigation of processes with high temporal variability [32]. It is appropriate in particular for the examination of non-stationary processes, like climate variables. In this study, monthly precipitation series in Gabes Watershed were studied by means of wavelet analysis. Wavelet transform provides the variability of a given signal across time, allowing thereby determining climate fluctuations relying on precipitation (periodic, non-periodic) by considering their spectral composition modifications. Wavelet transform decomposes signals into daughter wavelets that refer to versions of a mother wavelet. Every wavelet length is finite and ever precisely localized in time. The mother wavelet includes two parameters: scaling a and temporal location b (Equation (2)):
with:
- : Wavelet daughter;
- a: scale parameter ;
- b: time-localization parameter.
Parameterization of scale and wavelet daughters admits the finding of various frequencies that compose signal. Further, these various frequencies components maybe investigated during time to have a best understanding of non-stationary phenomenon [32,33]. The continuous wavelet transform of the signal S(t) generating a wavelet spectrum. It is expressed as follows (Equation (3)):
For more details about the methodology on this analytical technique and their applications, the reader may refer to Torrence and Compo [32], Labat [34] and Massei et al. [35].
2.2.3. Wavelet Coherence
Wavelet coherence determines the relationship between two time series within time frequency space [36]. Wavelet coherence analysis consists in measuring the correlation between the two signals according to different scales (frequencies) over time, with values extending from 0 to 1 [34,37]. Labat [18] suggested the computation of wavelet coherence in wavelet analysis. This new approach helps understand the dynamics of hydrological cycle by studying the variability structure of hydrological components (precipitation, runoff, evaporation, etc.). Labat [34] defined coherence as an assessment of the temporal progress relating to the linearity along with relations between two signals at a given scale. Coherence wavelet is obtained by the defined formula (Equation (4)):
where refers to wavelet coherence;
- Wn forms the wavelet;
- S represents the signal;
- X, Y correspond to the two examined variables.
2.2.4. Contribution of the Climatic Indices
The rates (%) of climatic indices contribution to rainfall variability at the studied stations were determined. Statistics were conducted by means of the R software using specific scripts and the Sowas package [30,31]. More research was investigated for evaluating the contribution of a definite component [20,38]. The wavelet transform component served for the decomposition and reconstruction of signals.
3. Results and Discussion
3.1. Standardized Precipitation Ratio Analysis
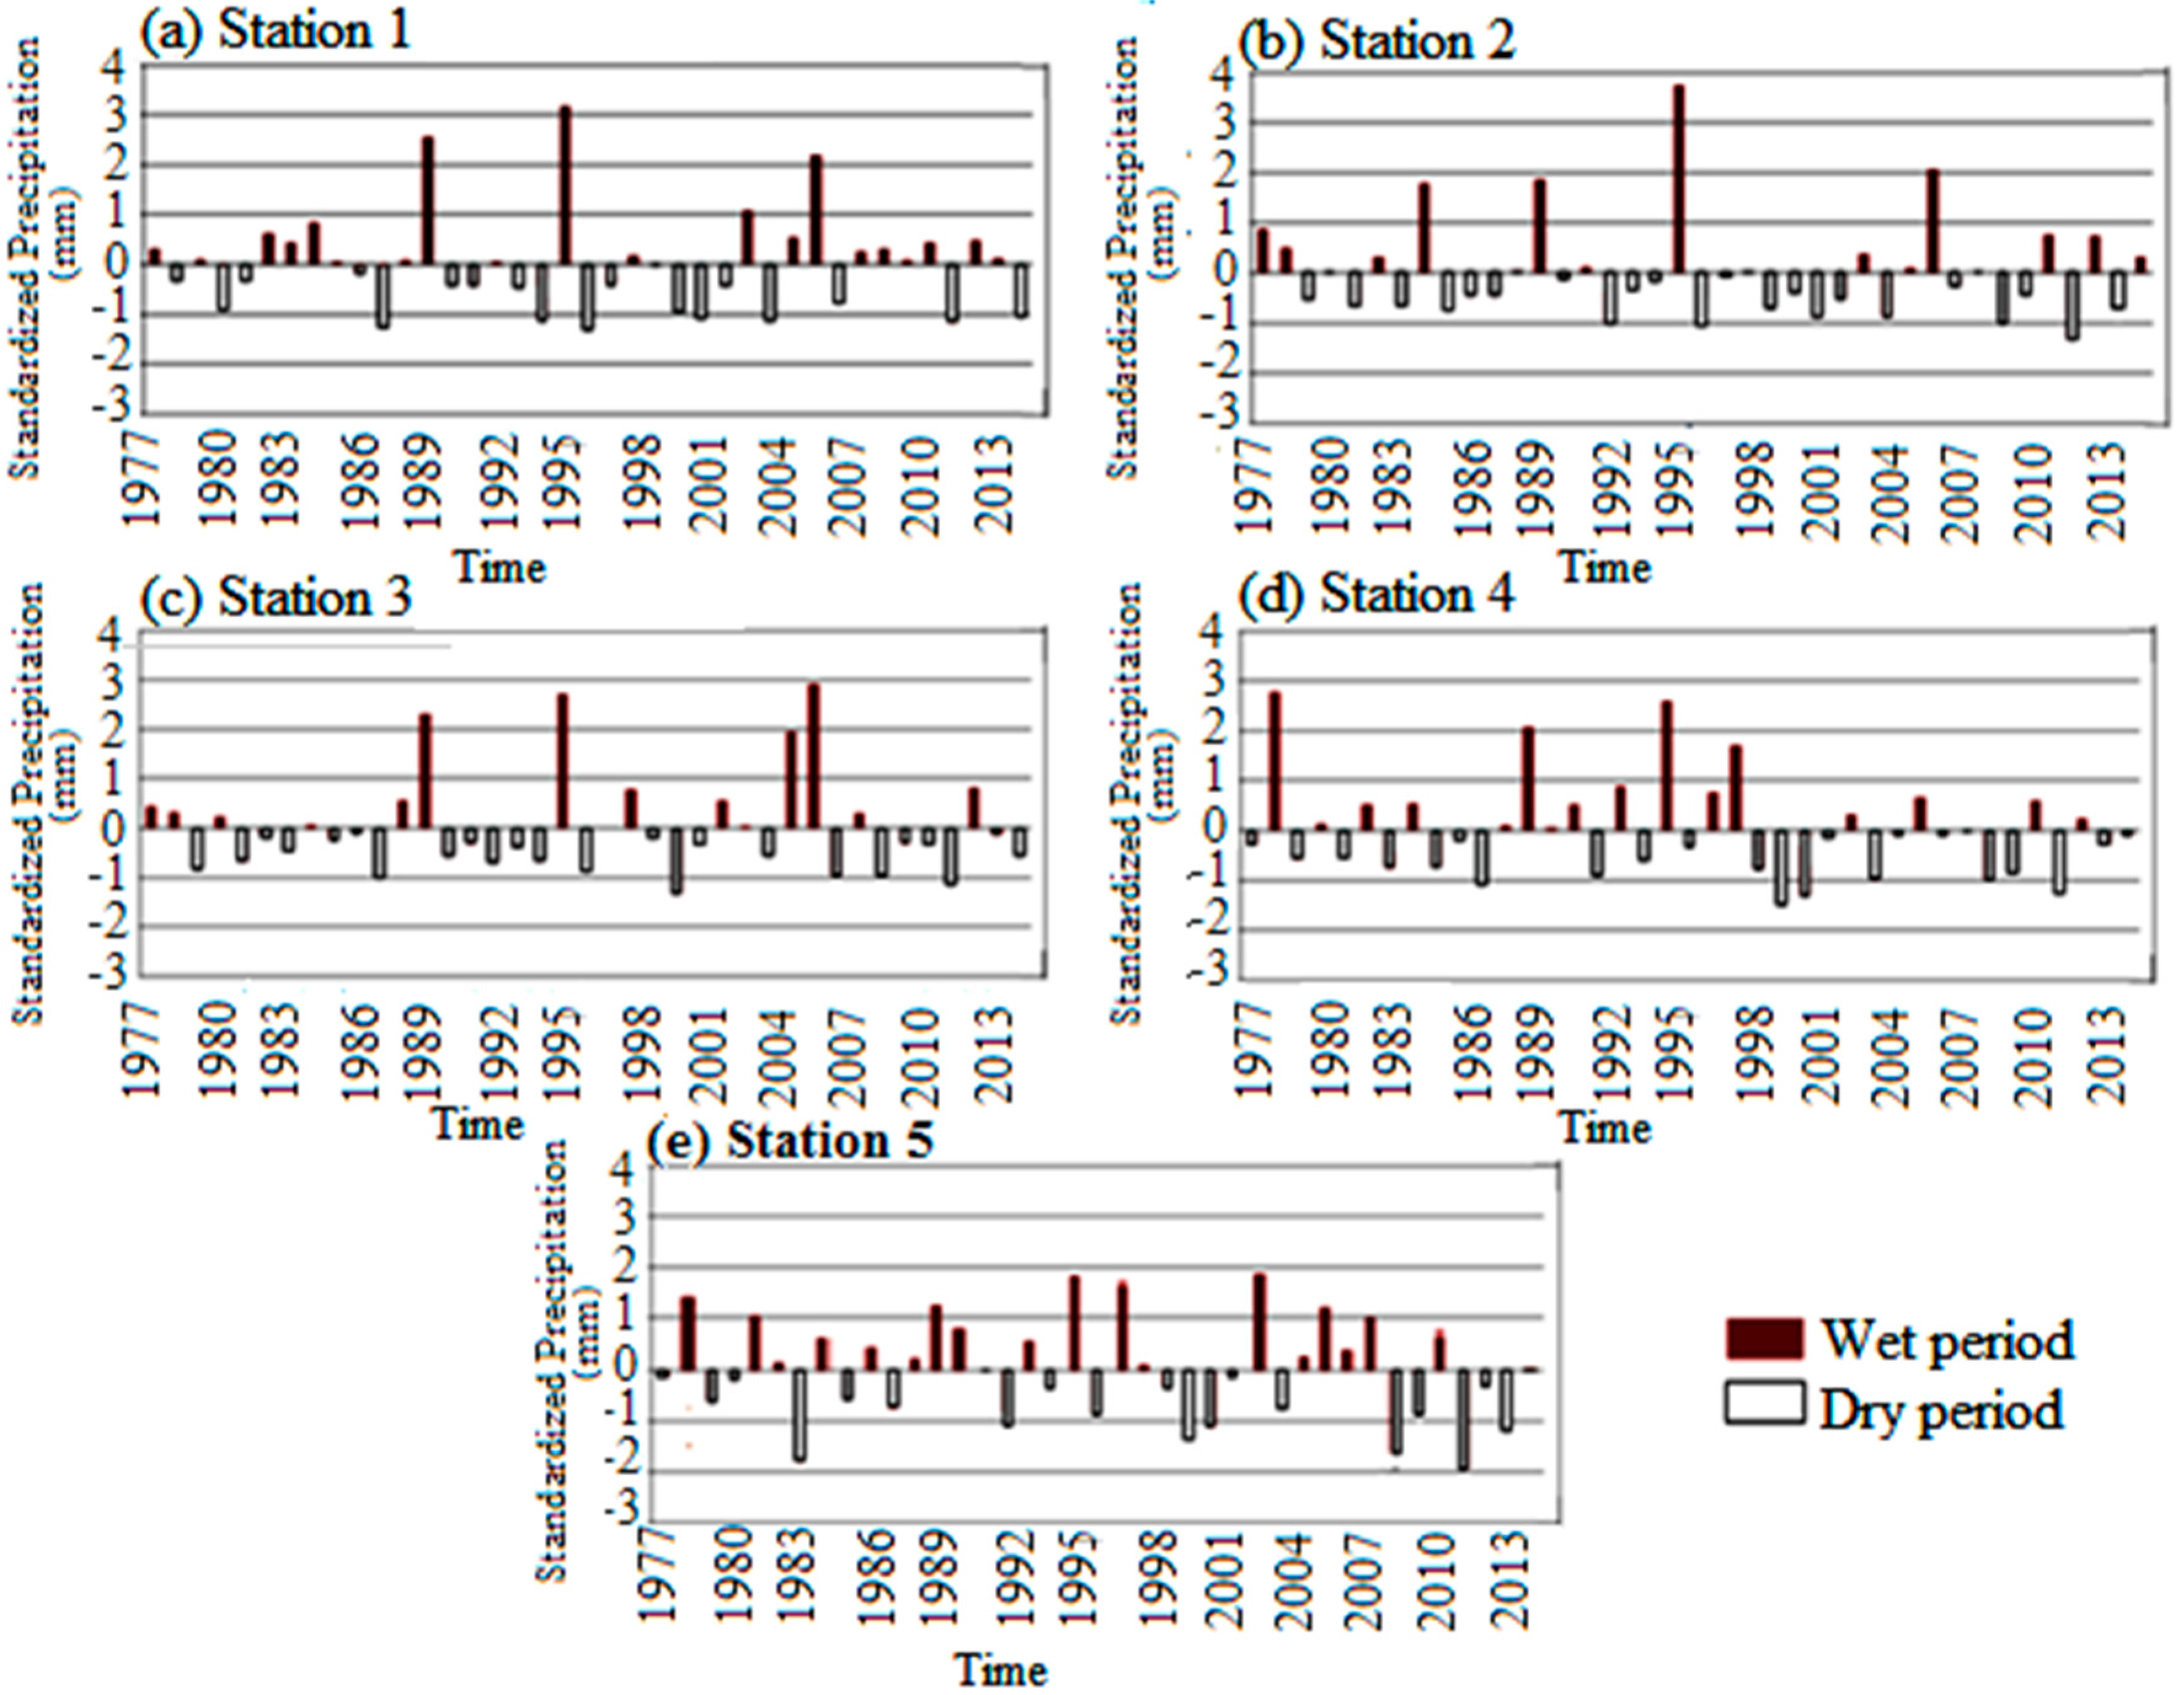
Due to the irregularity of precipitation distribution, standardized precipitation was calculated to distinguish wet and dry periods. Standardized precipitation ratio results are displayed in Figure 3, which shows reasonably some difference trends for stations 4 and 5 in comparison to 1, 2 and 3. Three different periods are generally distinguished (Figure 3):
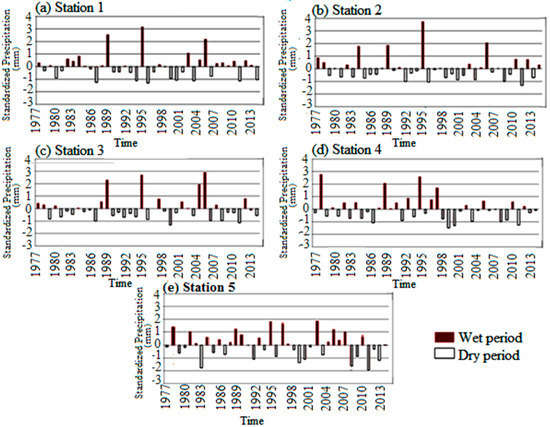
Figure 3.
Standardized precipitation ratio of rainfall in the 5 selected representative stations (1977–2015). Positive values: Wet period, Negative values: Dry period. (a): Station 1, (b): Station 2, (c): Station 3, (d): Station 4, (e): Station 5.
The first period (1977–1988) was generally dry, with the occurrence of few slightly humid years. The negative standardized precipitation ratio reached a value of −1.76;
The second period (1989–2001) was marked by a succession of deficit years varying from one to five years, interrupted by humid years (1989, 1995 and 1998);
The third period (2002–2015) was distinguished with an increase of wet years and more frequent dry years compared to the first period. Stations 4 and 5 showed some difference, especially until around 2004. Standardized precipitation ratio presented negative and positive values varying from −1.95 to 2.91
The results obtained agree with those found in several recent studies. Nouaceur et al. [39,40] compared variability of precipitation in North African countries (Algeria, Tunisia and Morocco). In Tunisia, a main drought period was shown between 1977 and 2001. Rainfall evolution was distinguished by three different periods alternating between humid period and drought over study period (1970–2011). Eventually, new precipitation conditions indicating new climate trends have been registered from 2002 in Tunisia and Algeria (a return to wetter conditions). In Morocco, these new conditions also were detected more recently, from 2008 (Nouaceur et al. [39]). Laignel et al. [41] studied the global climatic fluctuations and precipitation variability in north of Africa between 1970 and 2010. The longest drought occurred over a long period between 1982 and 2001 in Tunisia. The most recent years of time series witnessed an increasing of the persistence of wet years. It was noticed in Algeria since 1996 and in Tunisia since 2001. This phenomenon has been observed in Morocco since 2007. In other research, in Gabes Basin, the most prominent droughts in terms of duration or geographical extent happened in the late 1980s and 2000 for most stations [14]. The method of standardized precipitation ratio (Ip) should be tested for validation purposes in other countries of the region such Algeria, etc.
3.2. Modes of Rainfall Variability
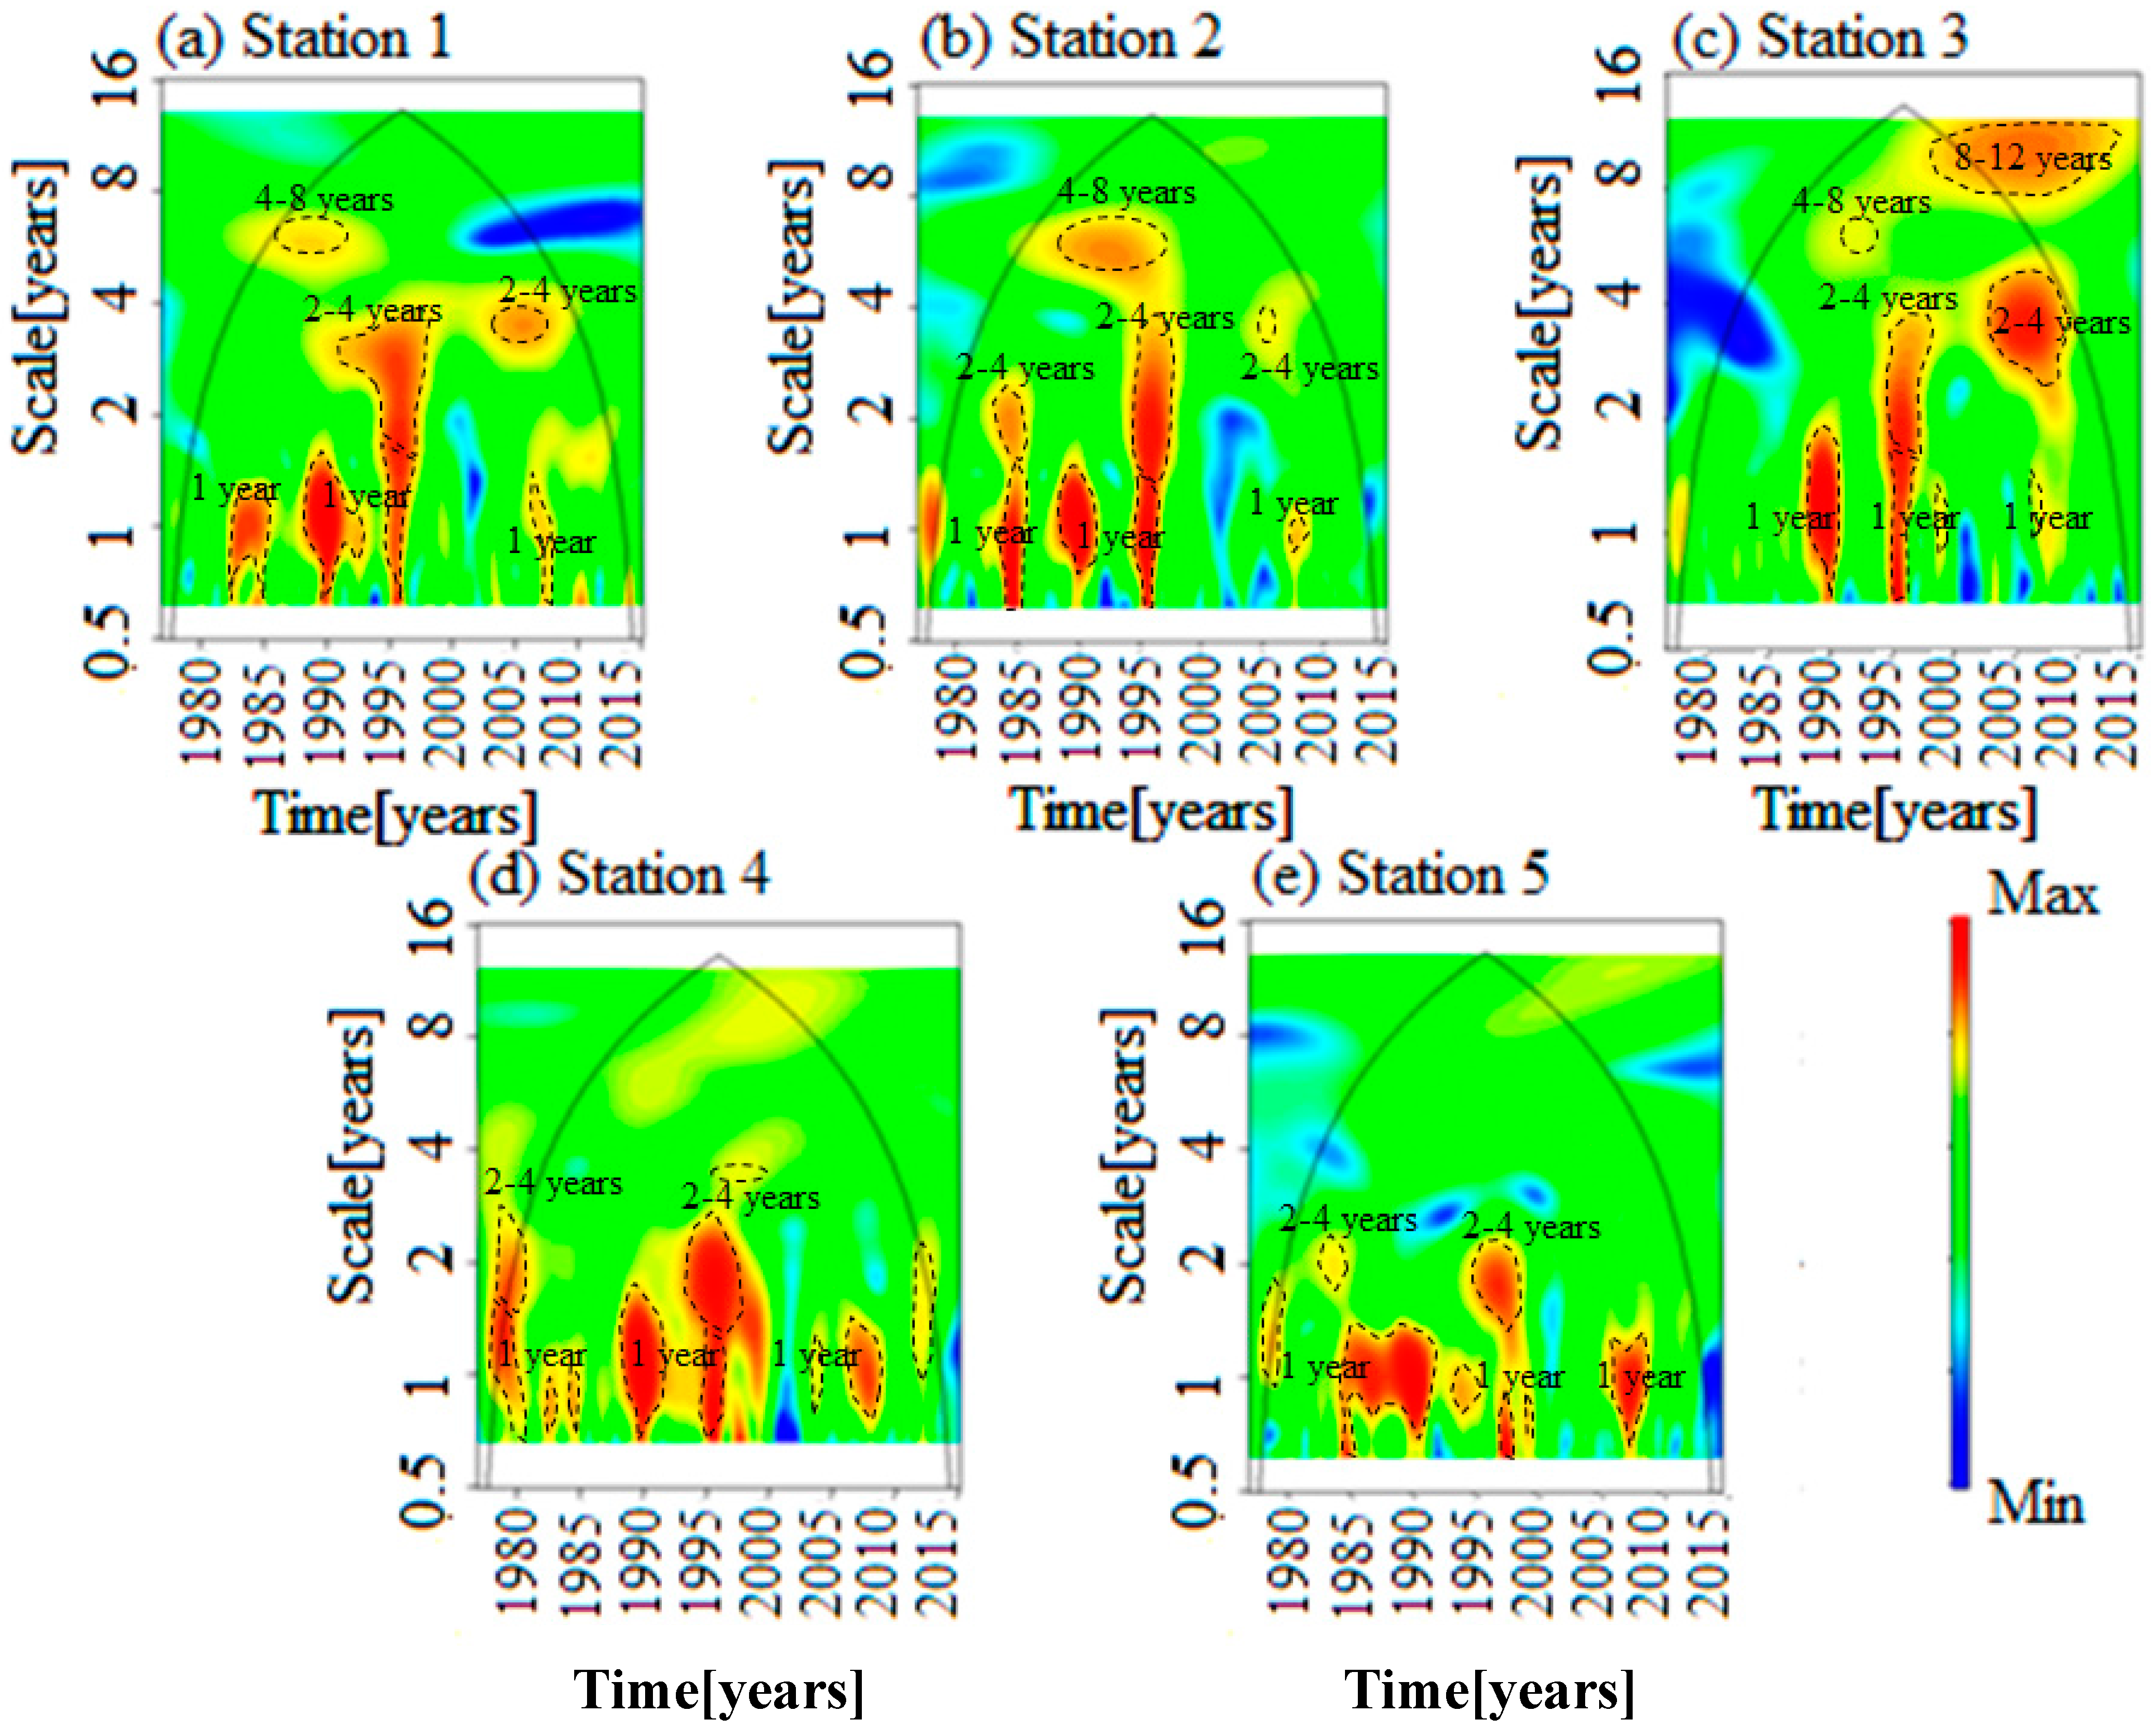
Wavelet power spectrums of the monthly rainfall patterns are presented in Figure 4. Several frequency modes were detected. Moreover, energy bands at annual and inter-annual scales (2–4, 4–8 and 8–12 years) are illustrated (Figure 4, Table 1). The annual mode was observed in all the stations studied as well as the mode 2–4 year whereas the modes of variability 4–8 year and 8–12 year are specific to stations 1, 2 and 3. A frequency of an annual cycle was identified in most of the stations (Figure 4, Table 1). The annual cycle reveals strong variability of energy from 1975 to approximately 1997. Then, a reduction in the energy band was observed. The 2–4 year band was observed in most stations centered over 1995, except for stations 1 and 3, where the 2–4 year band was rather observed in 2005 and 2010. The 4–8 year band, which reflects strong fluctuations, was detected from 1990 to 1995 in station 1, 2 and 3. A strong 8–12 year band was depicted at the end of the time series 2005–2010 located in the east of the basin (station 3). Table 1 recapitulates the different variability of precipitation modes or frequencies. A major discontinuity was detected in the different stations over the period from 1995 to 1997, where multiple energy bands are spotted on the wavelet spectrum for selected stations (Figure 4, Table 1).
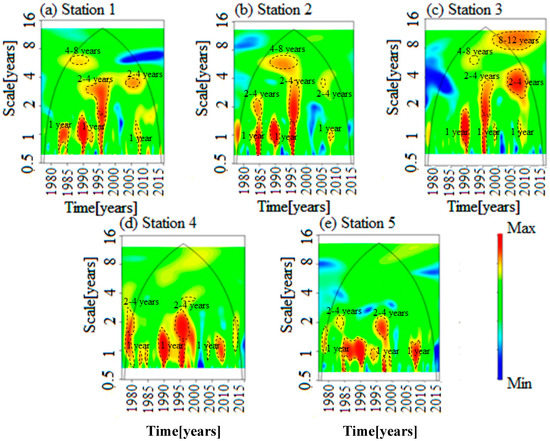
Figure 4.
Wavelet spectrum of monthly rainfall (1977–2015) for 5 stations in Gabes Watershed. Annual scale (1 year), Inter-annual scales (2–4, 4–8 and 8–12 years). (a): Station 1, (b): Station 2, (c): Station 3, (d): Station 4, (e): Station 5.

Table 1.
Time variation of rainfall Mode variability (annual and inter-annual) from wavelet spectrum analysis for 5 stations in Gabes Basin (1977–2015).
In Gabes basin, two major dry periods were registered (1977–1988; 1989–2001). Wetter periods were recorded in a homogeneous trend as shown by the wavelet (Figure 4a–c). Monthly precipitation variability can correspond to wet years found by the standardized precipitation ratio. Thus, results of the wavelet analysis are consistent with the analysis of standardized precipitation ratio. According to Figure 4, Total spectral energy is not constant in time and varies following three periods in the studied stations (1977–1988; 1989–2001; 2002–2015) (Figure 4). These periods were already detected by standardized precipitation ratio analysis. Jlassi et al. [42] characterized the hydrological variability of Medjerda Basin (northern Tunisia) by spectral tools. Their analysis revealed various hydrological phases for the period studied (1998–2003, 2003–2005 and 2005–2008) as well as the principal modes of variability (1–3 months, 1 year, 2–3 years).
3.3. Origin of Rainfall Variability
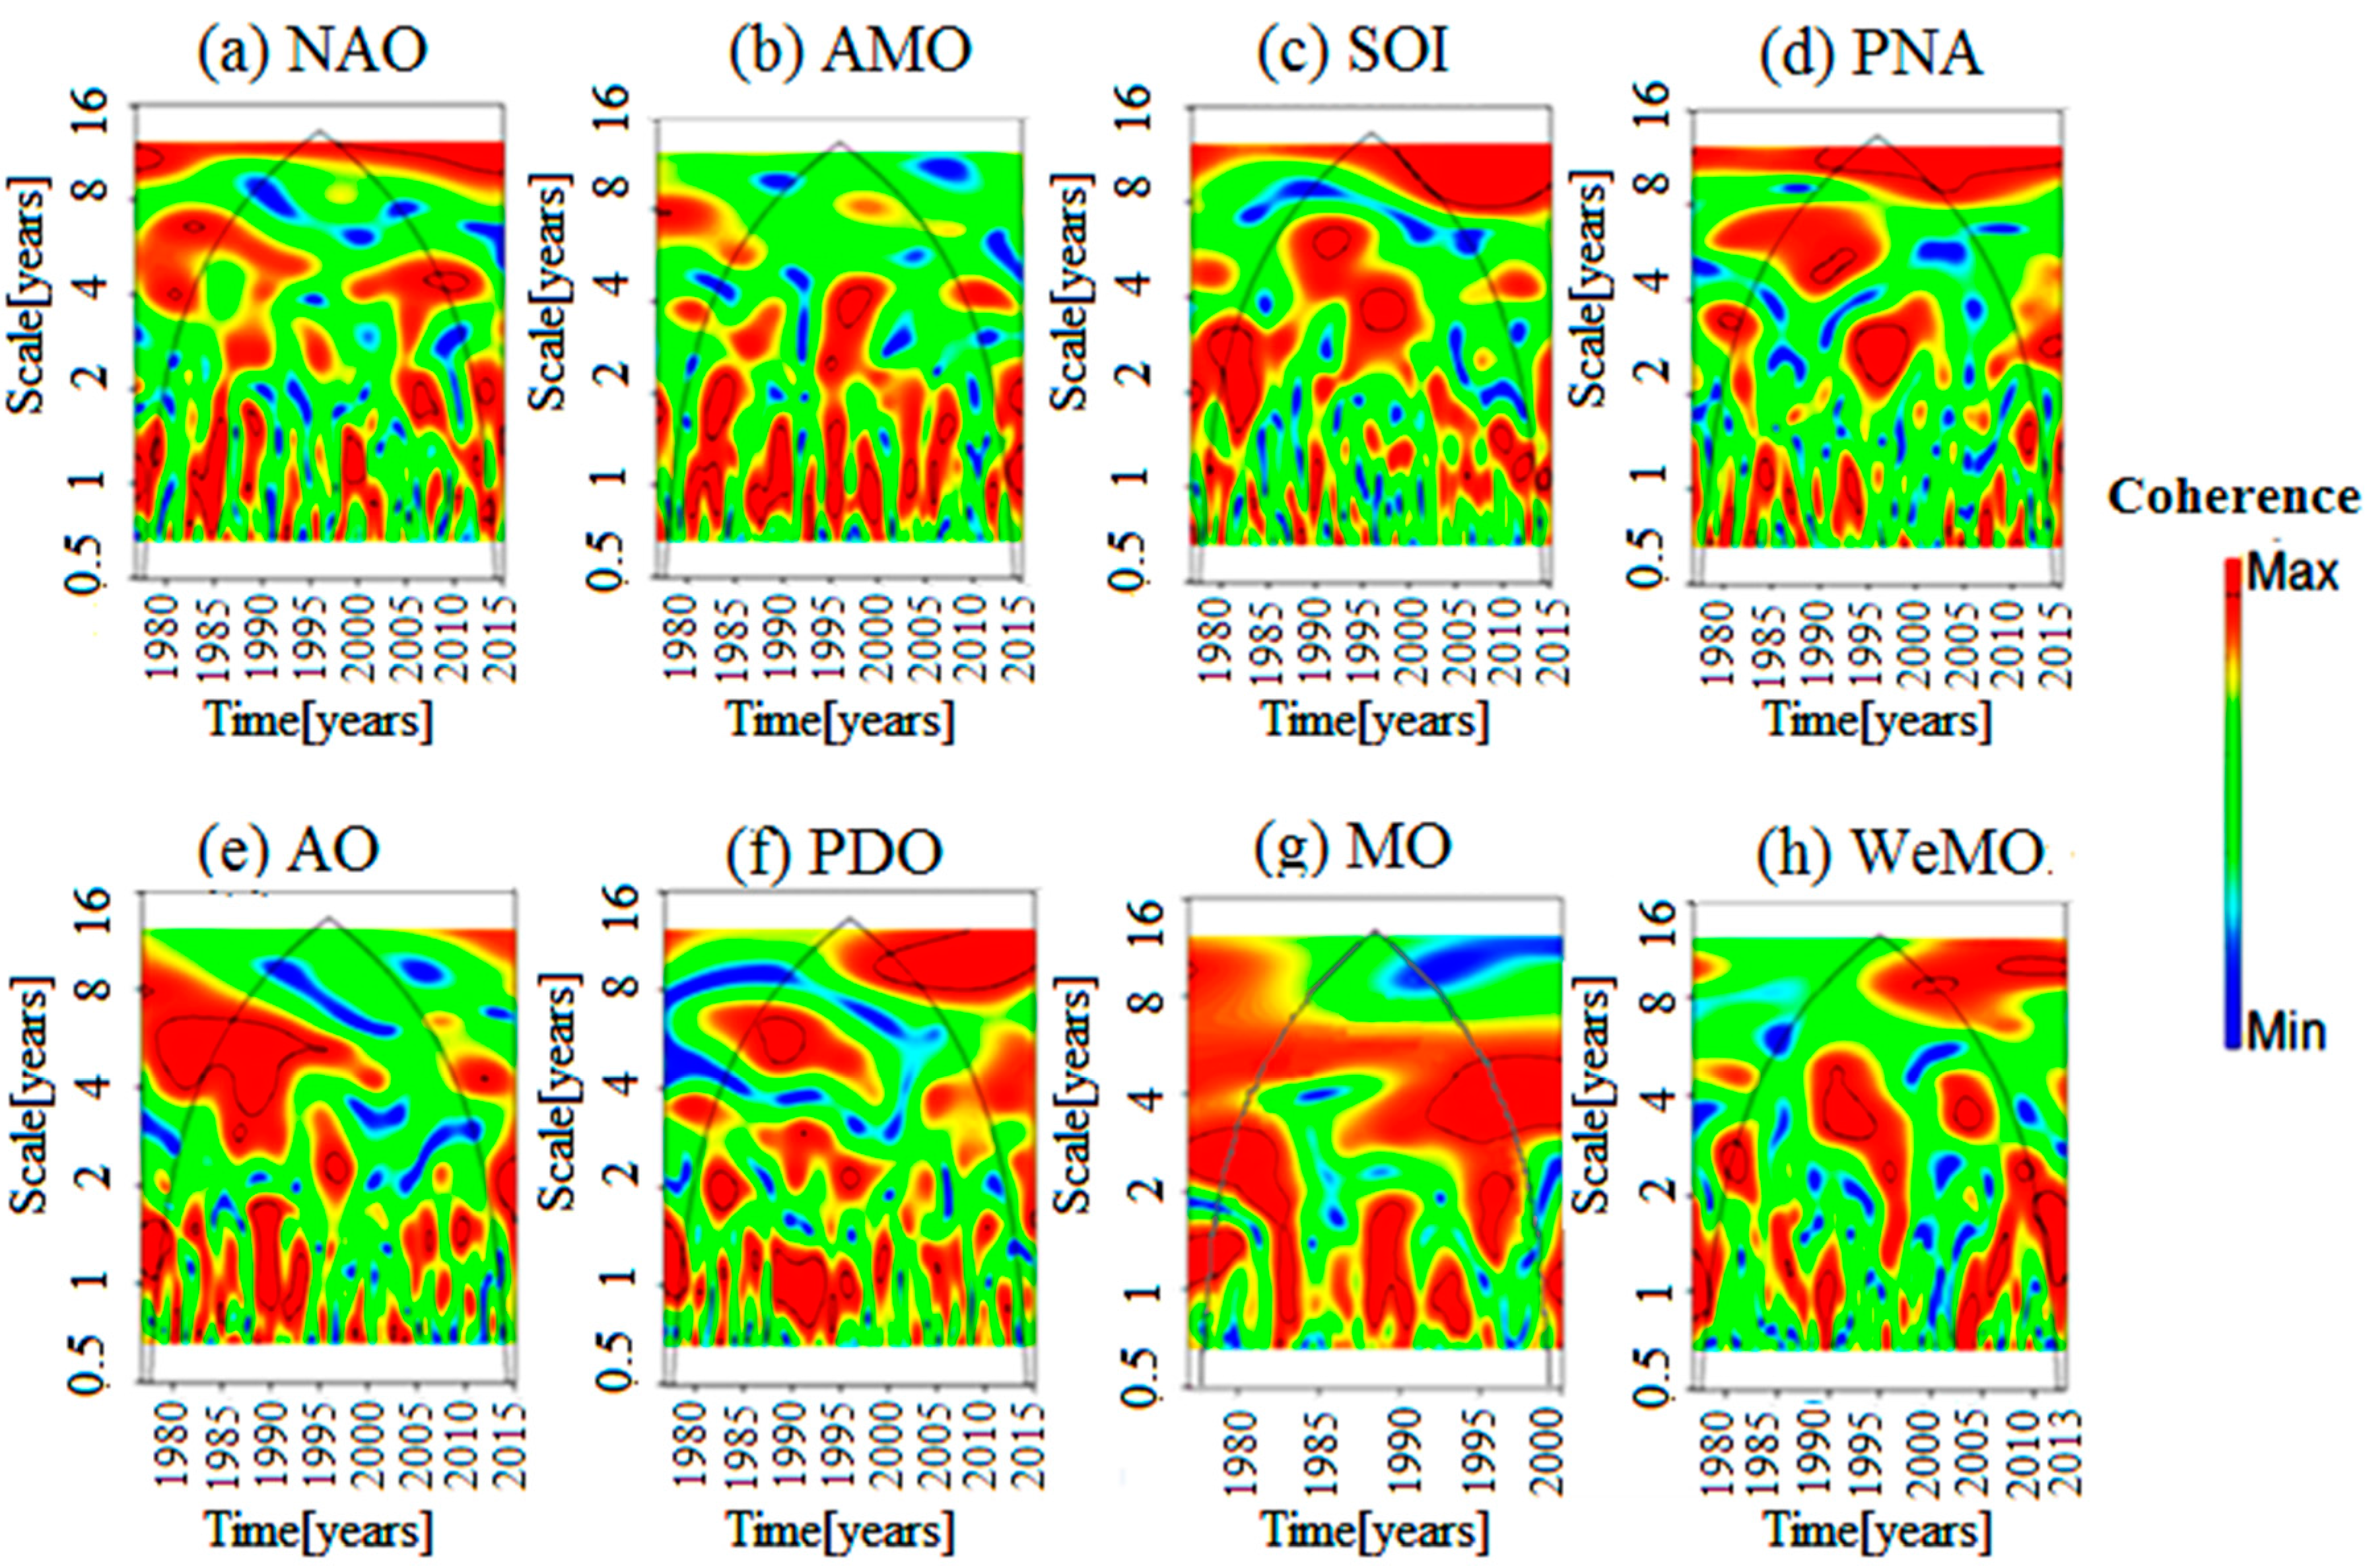
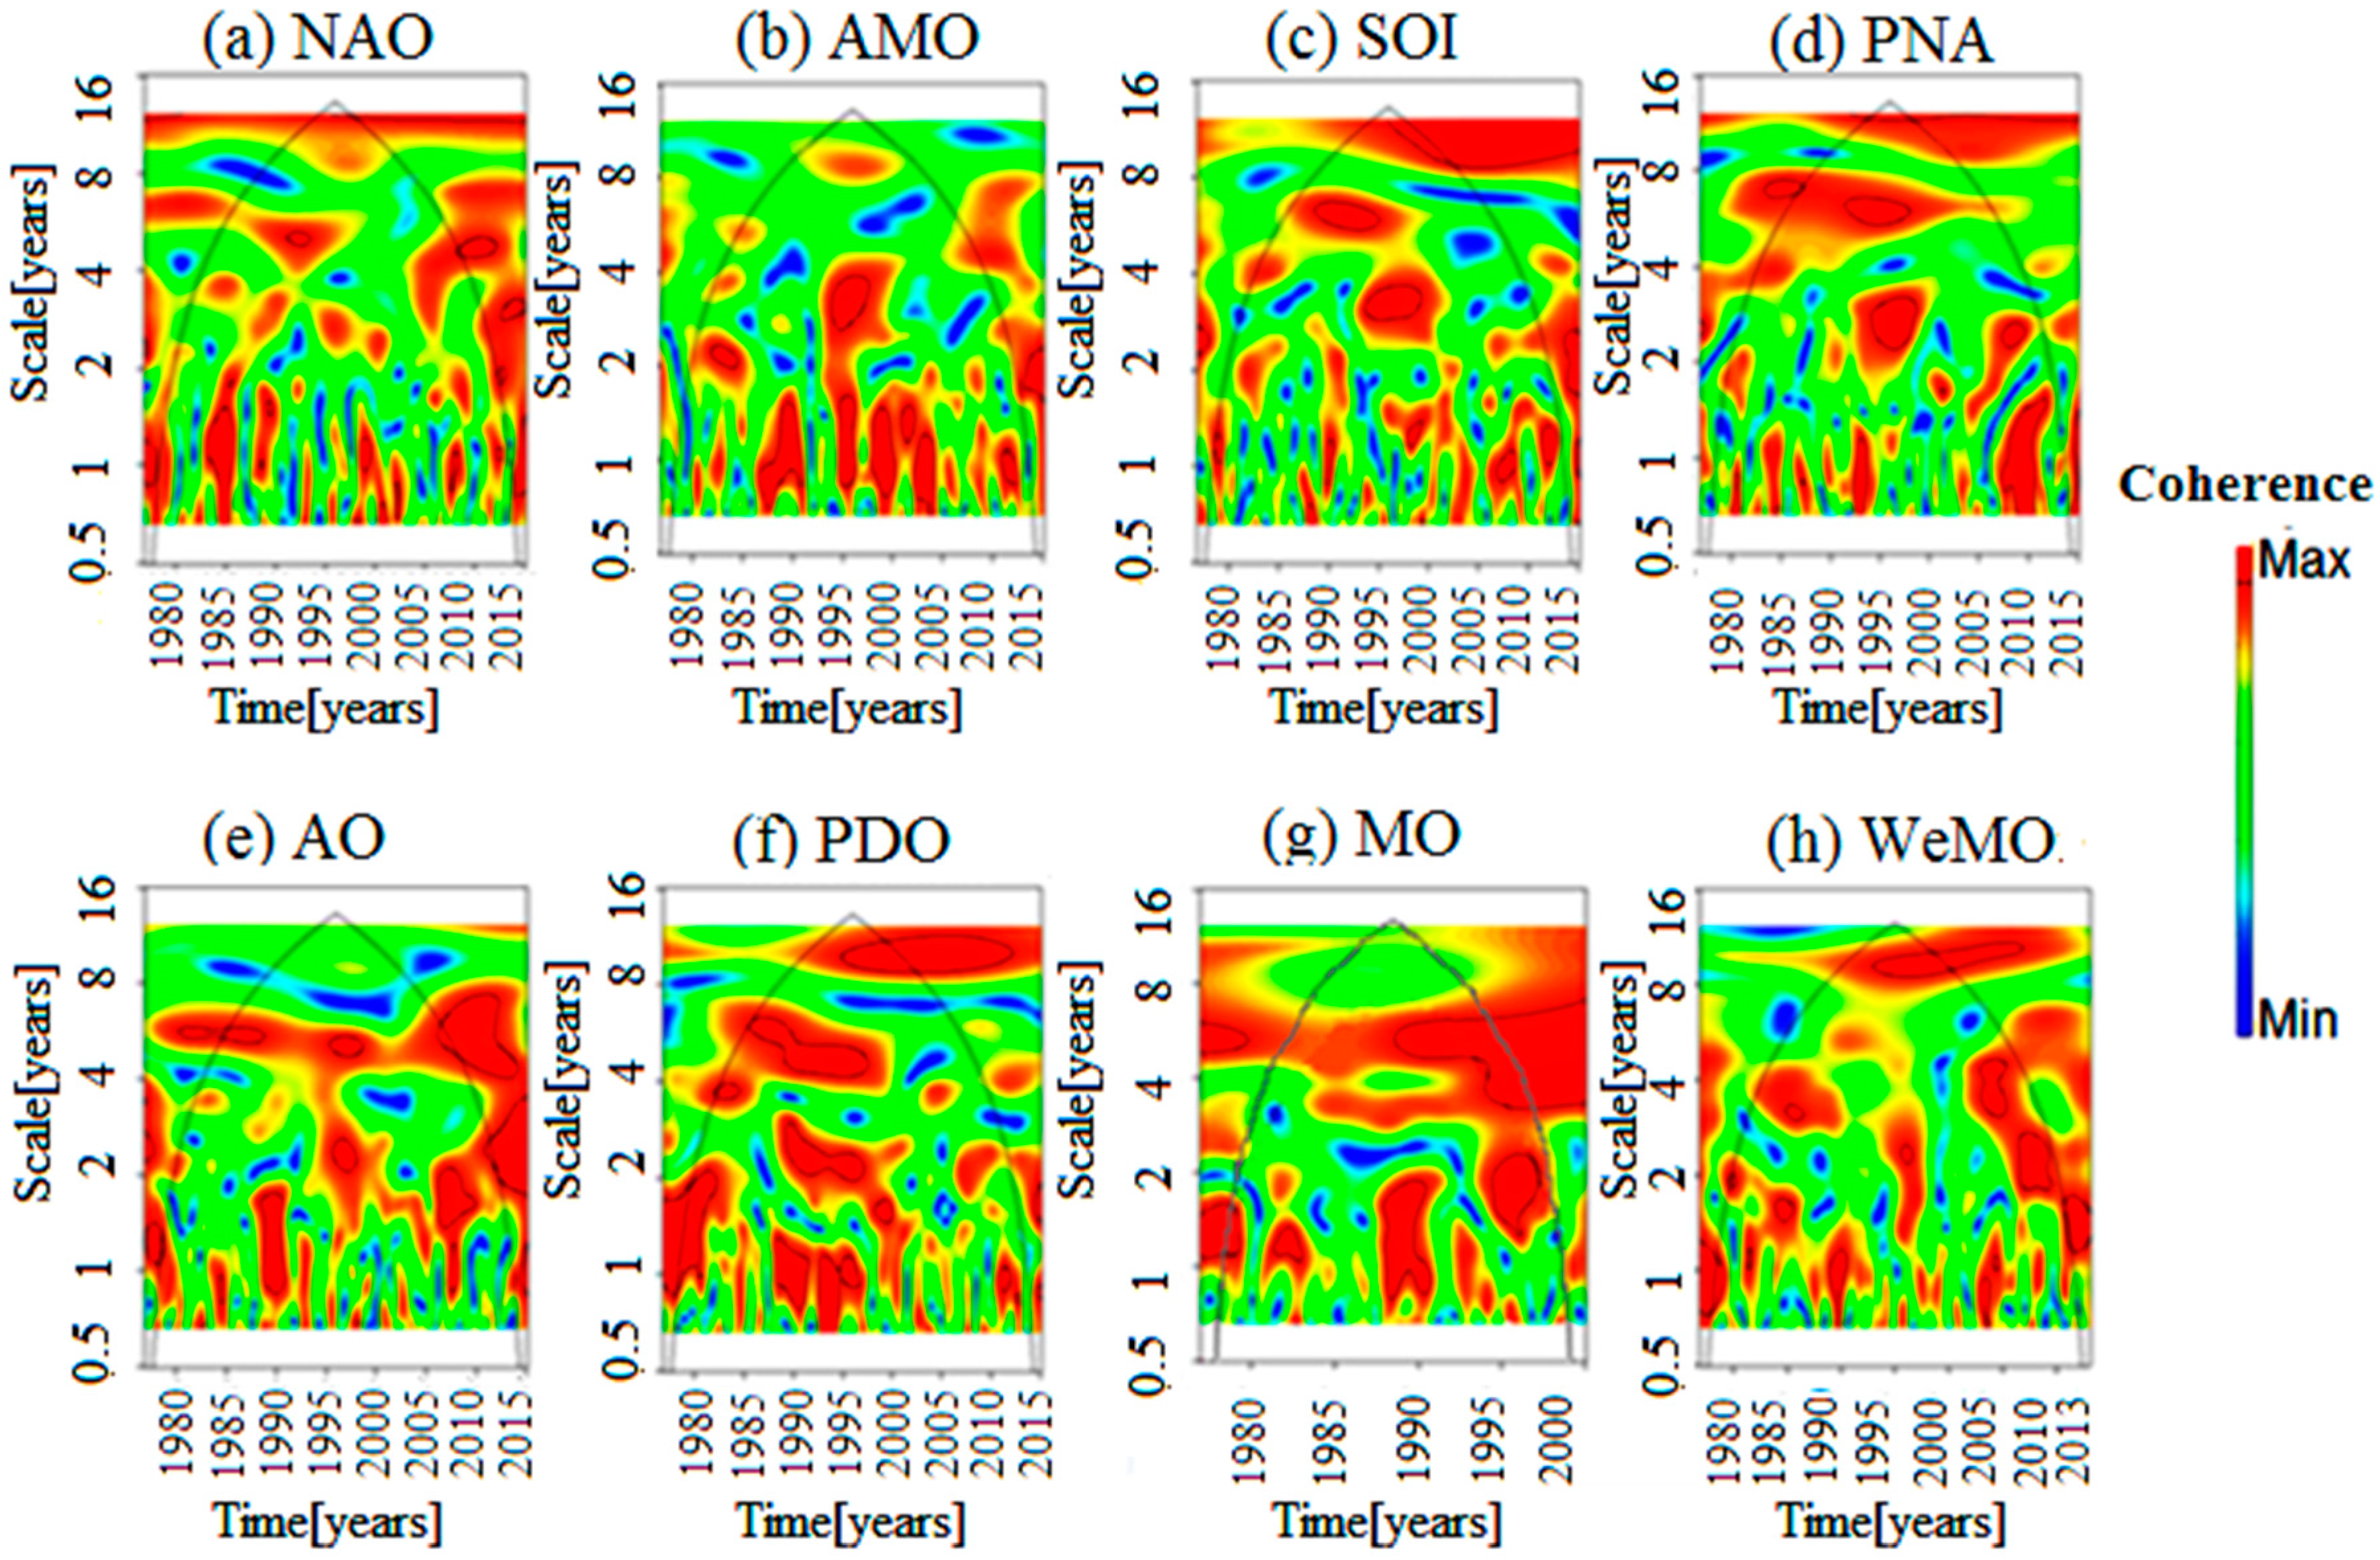
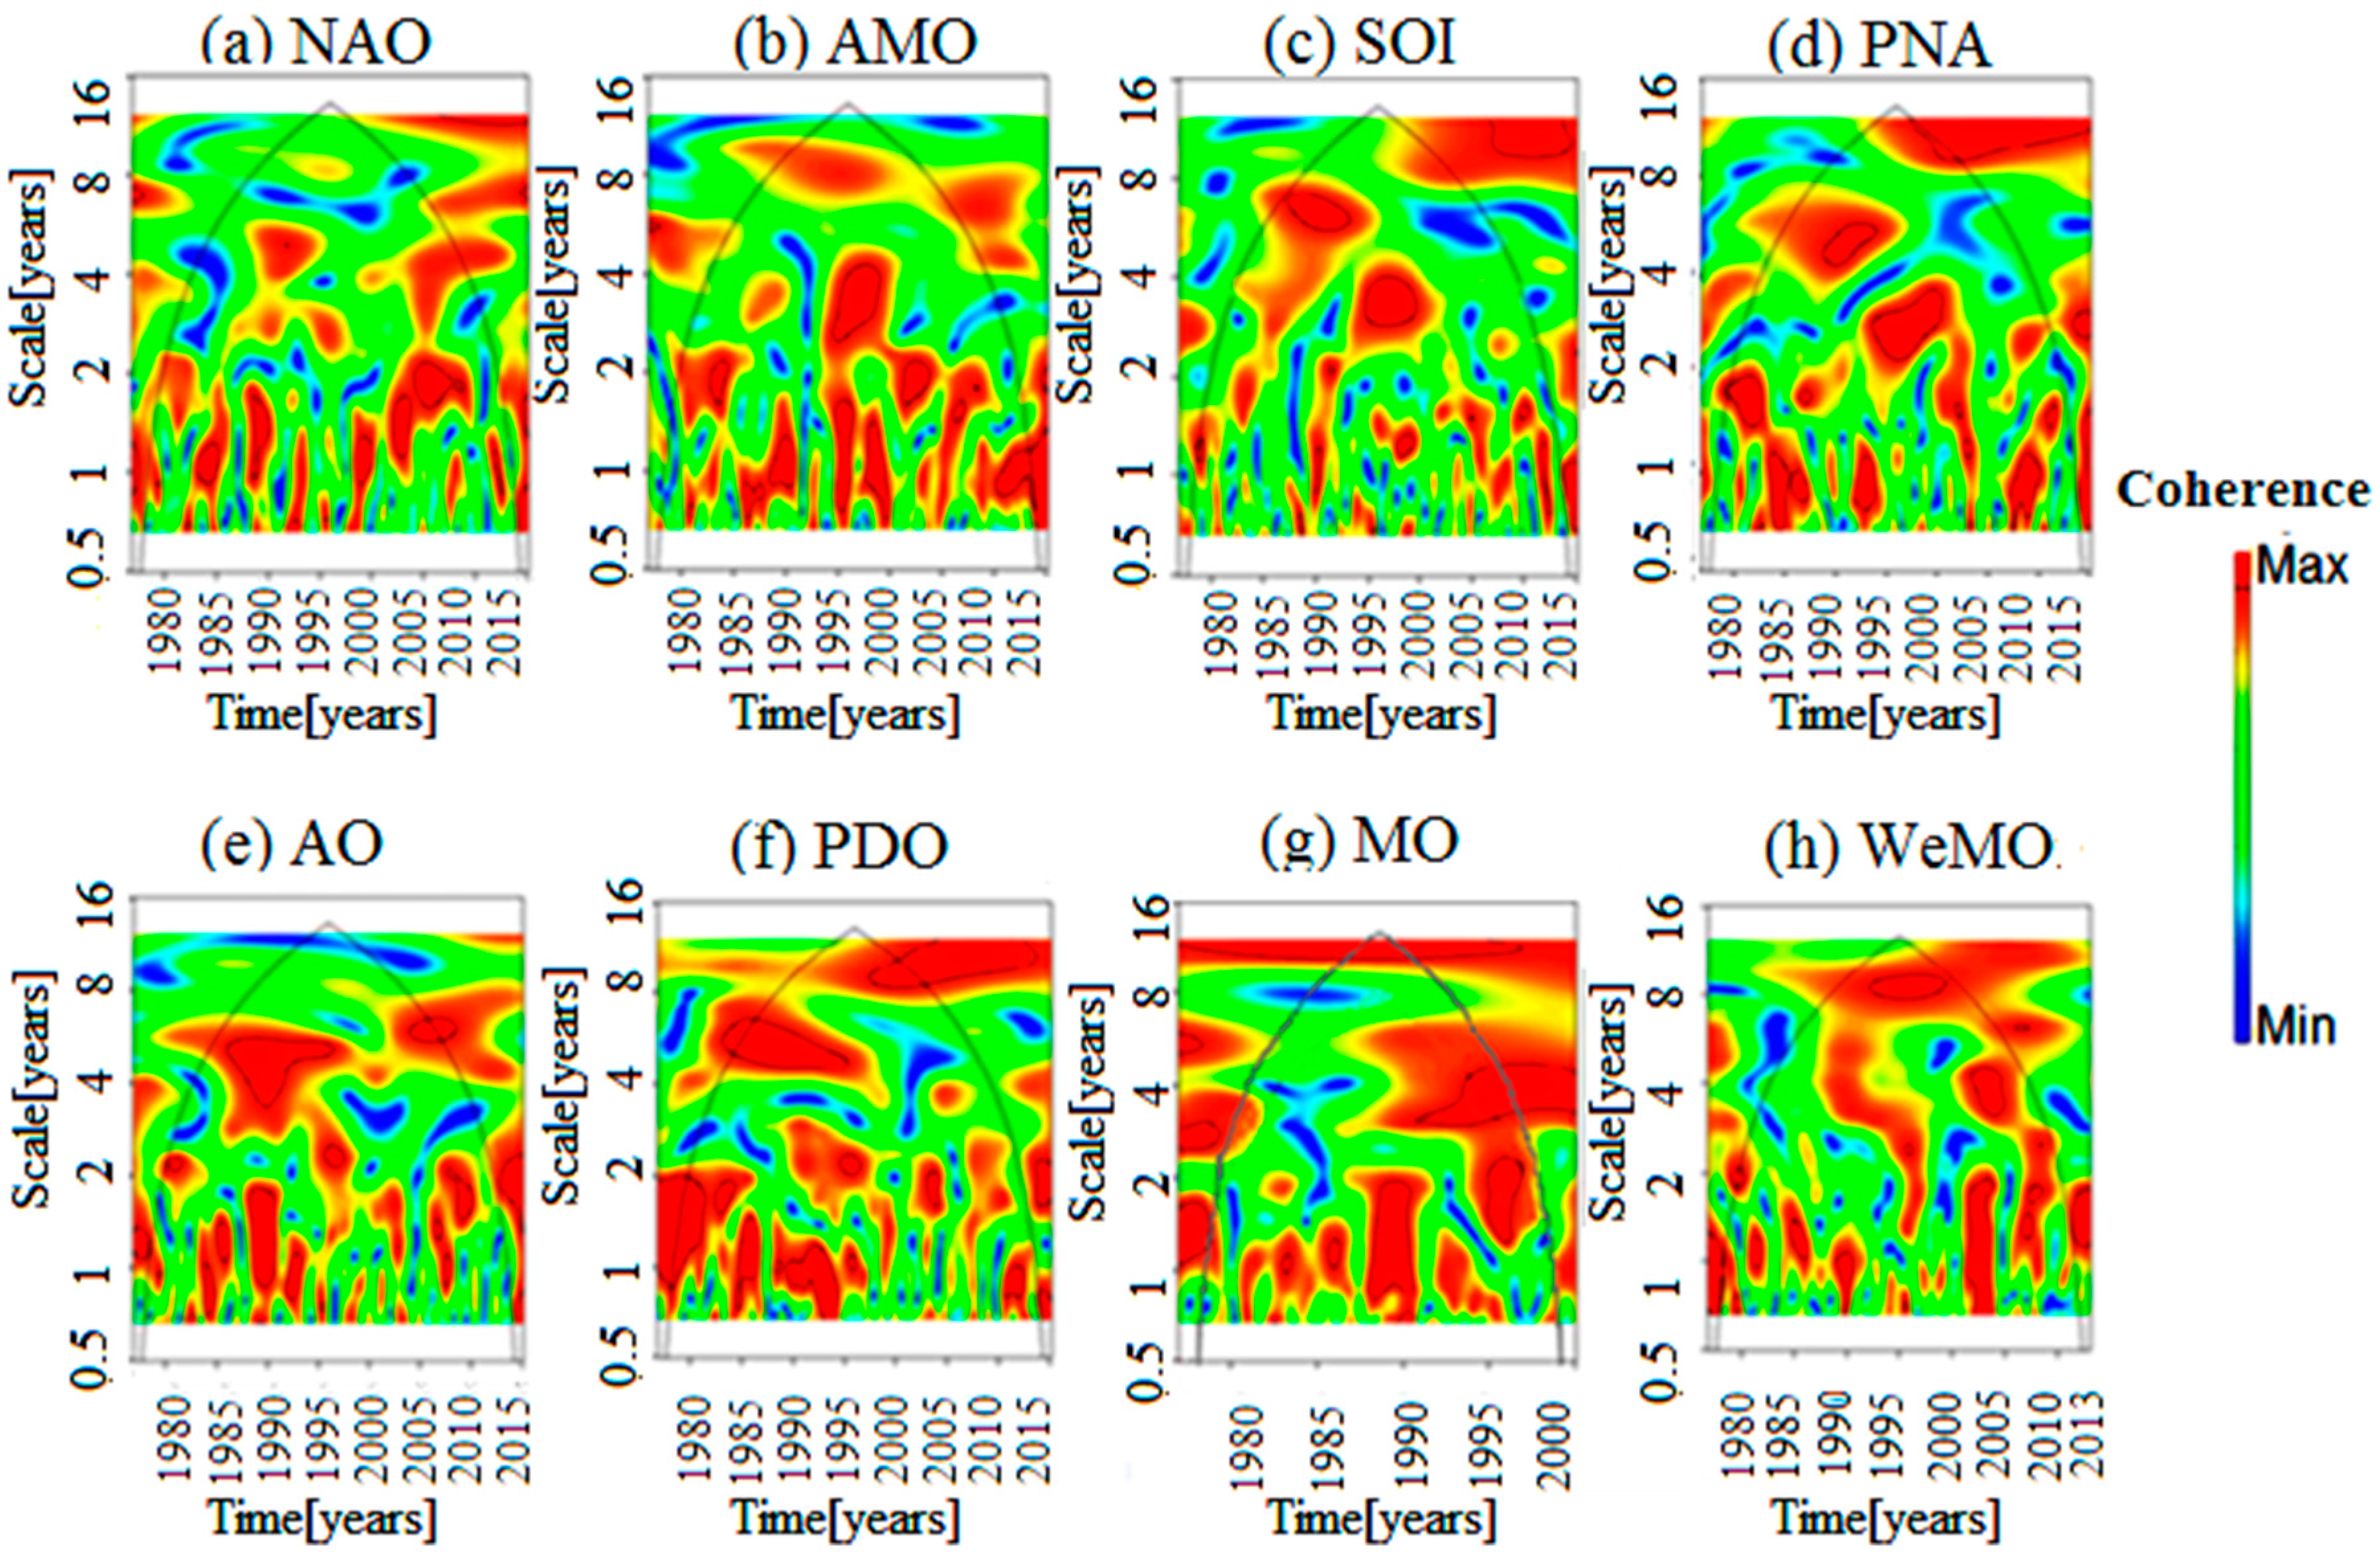
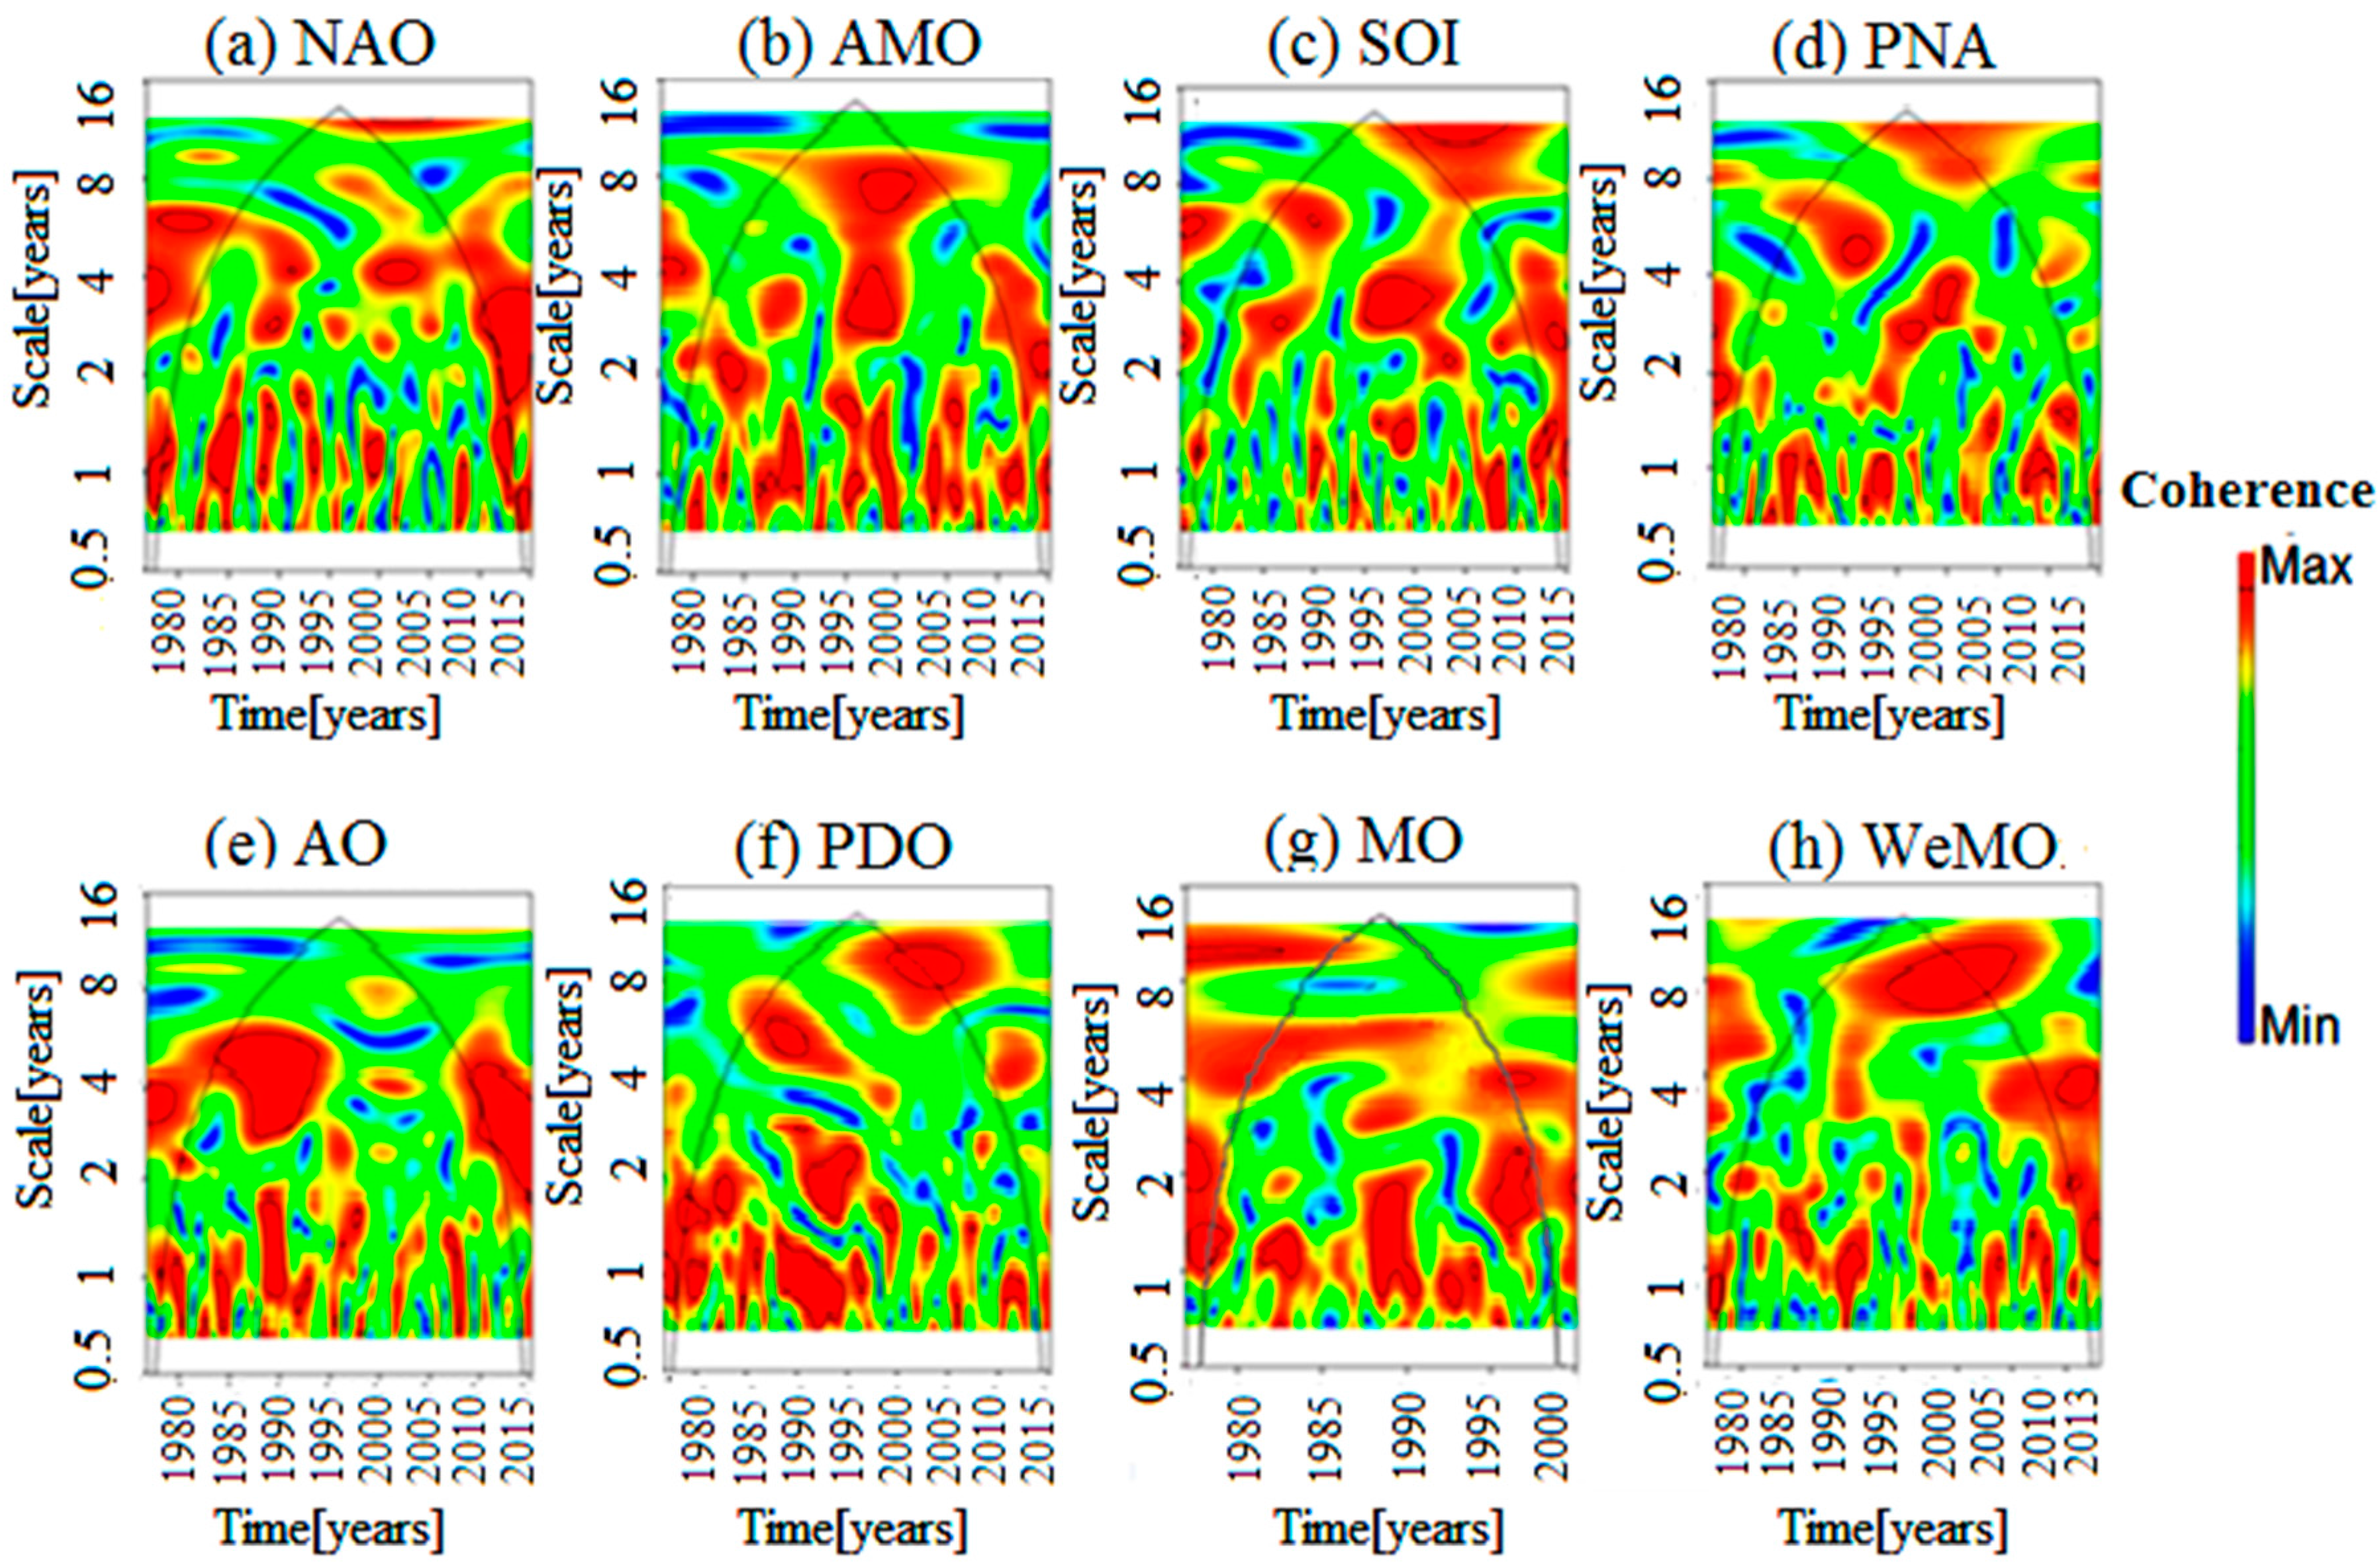
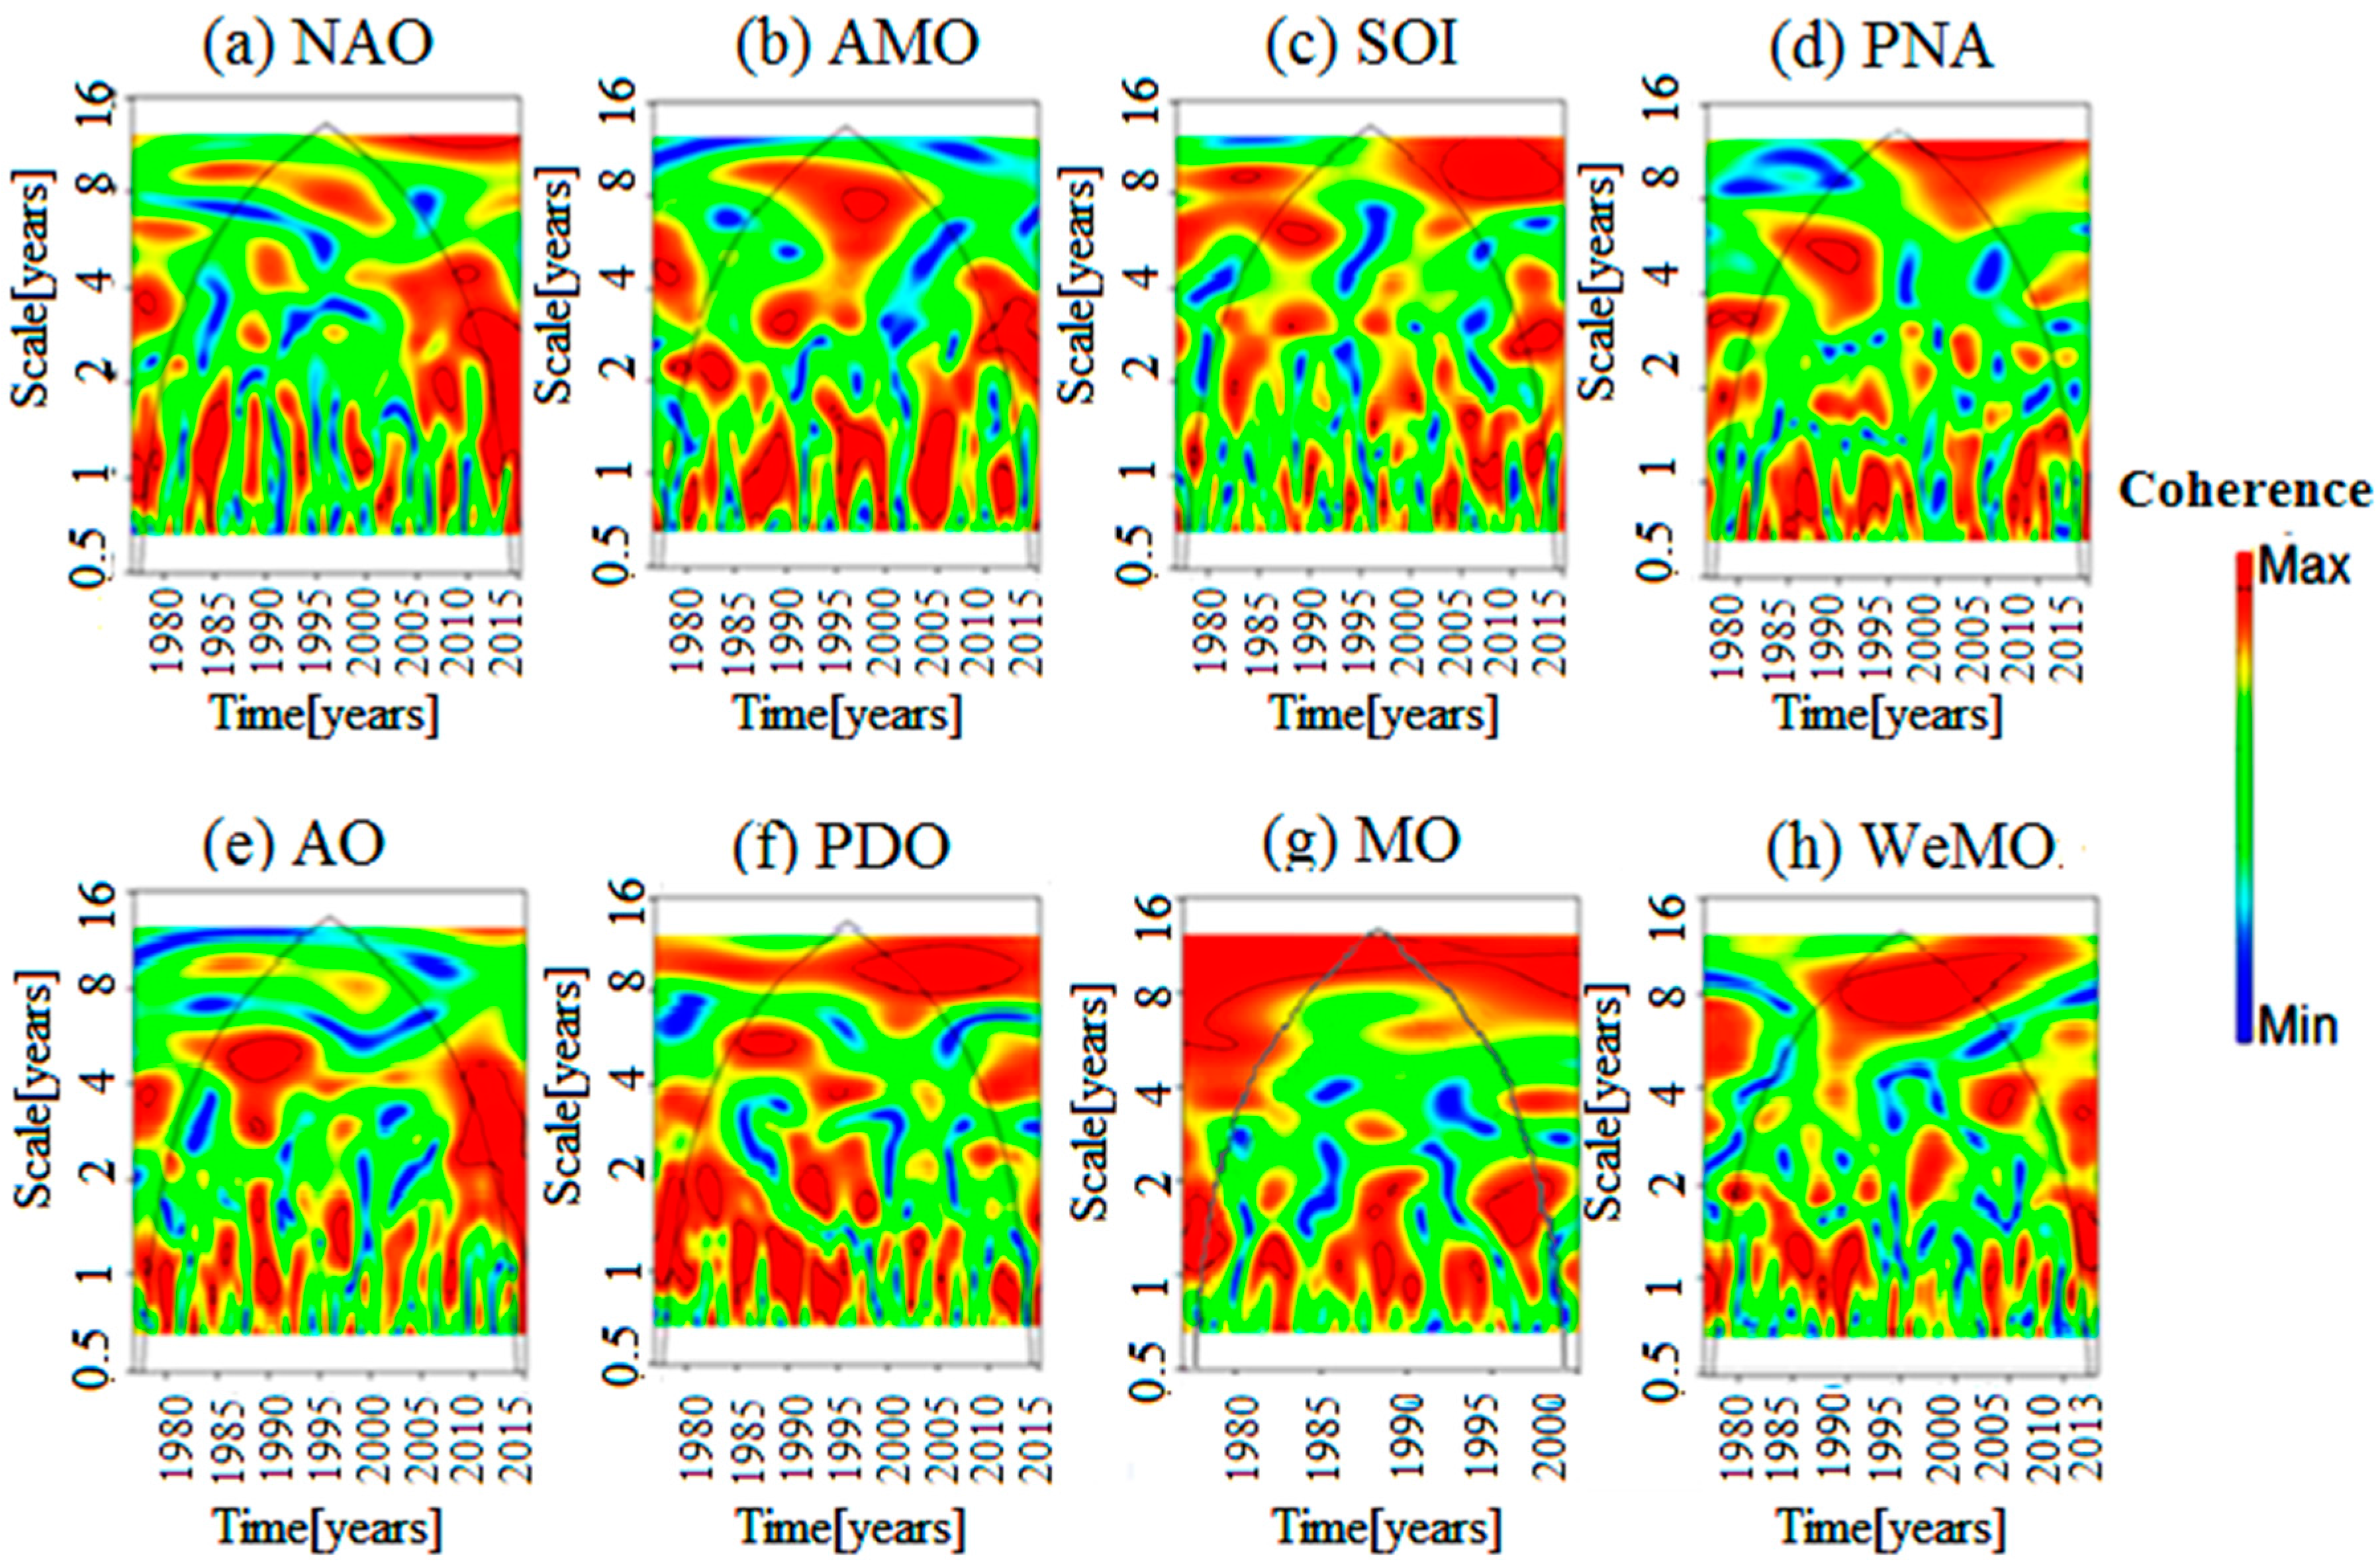
The origins of the variability of rainfall in Gabes Basin were sought by studying the potential links that may exist with global climatic fluctuations. In fact, determining the potential periodicities of rainfall is beneficial to the avoidance of meteorological hazards. Figure 5, Figure 6, Figure 7, Figure 8 and Figure 9 display the wavelet coherence analysis results between 8 climate indices and monthly precipitation data in the 5 studied stations in the basin.
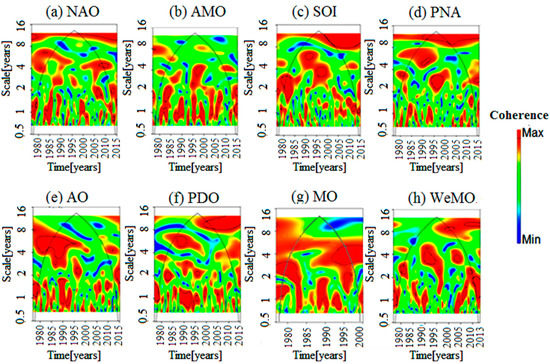
Figure 5.
Spectrum of Wavelet coherence for climate indices and precipitation in station 1. (a) NAO: North Atlantic Oscillation, (b) AMO: Atlantic Multidecadal Oscillation, (c) SOI: Southern Oscillation Index, (d) PNA: Pacific–North-America teleconnection, (e) AO: Arctic Oscillation, (f) PDO: Pacific Decadal Oscillation, (g) MO: Mediterranean Oscillation, (h) WeMO: West Mediterranean Oscillation.
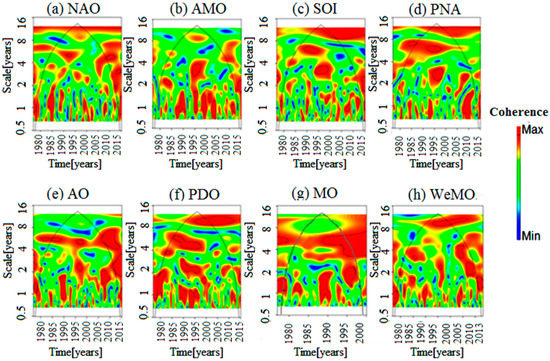
Figure 6.
Spectrum of Wavelet coherence for climate indices and precipitation in station 2. (a) NAO: North Atlantic Oscillation, (b) AMO: Atlantic Multidecadal Oscillation, (c) SOI: Southern Oscillation Index, (d) PNA: Pacific–North-America teleconnection, (e) AO: Arctic Oscillation, (f) PDO: Pacific Decadal Oscillation, (g) MO: Mediterranean Oscillation, (h) WeMO: West Mediterranean Oscillation.
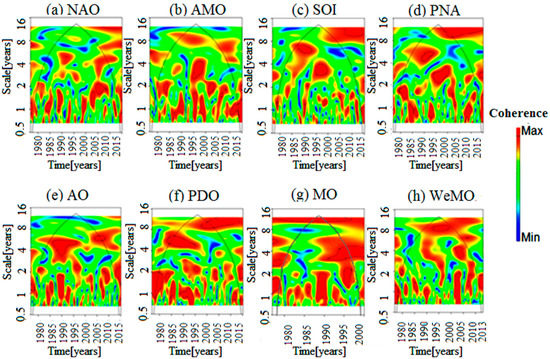
Figure 7.
Spectrum of Wavelet coherence for climate indices and precipitation in station 3. (a) NAO: North Atlantic Oscillation, (b) AMO: Atlantic Multidecadal Oscillation, (c) SOI: Southern Oscillation Index, (d) PNA: Pacific–North-America teleconnection, (e) AO: Arctic Oscillation, (f) PDO: Pacific Decadal Oscillation, (g) MO: Mediterranean Oscillation, (h) WeMO: West Mediterranean Oscillation.
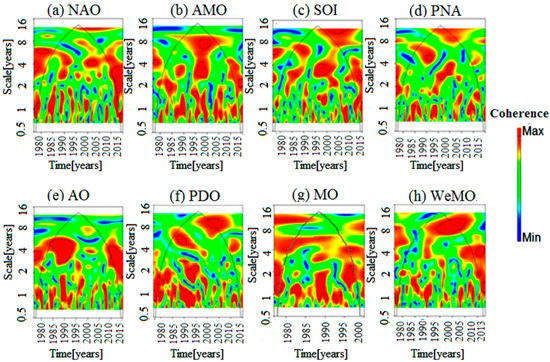
Figure 8.
Spectrum of Wavelet coherence for climate indices and precipitation in station 4. (a) NAO: North Atlantic Oscillation, (b) AMO: Atlantic Multidecadal Oscillation, (c) SOI: Southern Oscillation Index, (d) PNA: Pacific–North-America teleconnection, (e) AO: Arctic Oscillation, (f) PDO: Pacific Decadal Oscillation, (g) MO: Mediterranean Oscillation, (h) WeMO: West Mediterranean Oscillation.
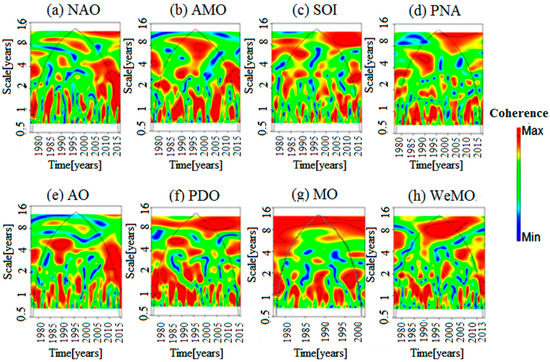
Figure 9.
Spectrum of Wavelet coherence for climate indices and precipitation in station 5. (a) NAO: North Atlantic Oscillation, (b) AMO: Atlantic Multidecadal Oscillation, (c) SOI: Southern Oscillation Index, (d) PNA: Pacific–North-America teleconnection, (e) AO: Arctic Oscillation, (f) PDO: Pacific Decadal Oscillation, (g) MO: Mediterranean Oscillation, (h) WeMO: West Mediterranean Oscillation.
Extensive high energy areas in the spectrum were depicted. Figure 5, Figure 6, Figure 7, Figure 8 and Figure 9 show large inter-annual and annual coherence scales. The most important oscillations per each station were studied. Interestingly, inter-annual coherence was essentially detected in energy bands (2–4, 4–8 and 8–12 years). For station 1, in the 2–4 year band, significant energy was visible between 1977 and 1983 and between 1993 and 2000 for MO and between 1990 and 1995 for WeMO. However, the 4–8 year band was observed from1985 to 1995 for AO and between 1995 and 2000 for MO. Thus, MO, AO and WeMO were detected as most important oscillations. For station 2, strong coherence was observed for the 8–12 year band for 1995–2010 WeMO and PDO indices. For 4–8 years, high energy was observed between 1990 and 1995 for MO, 1985–2000 for PDO, AO and WeMO, and between 2000 and 2005 for WeMO. The band 2–4 years was detected between 1995 and 2000 for SOI, AO, between 1990 and 2000 for PDO and between 2005 and 2010 for WeMO. Consequently, MO, AO, PDO and WeMO were the most frequent oscillations. Station 3 was an exception and had the most dominant climate indices. The band 2–4 years was affected between 1995 and 2000 by SOI and PNA. The 4–8 years was detected between 1985–1997 for SOI, AO and PDO, 1993–2000 for MO; 2000–2005 for WeMO, and 1990–1995 for PNA. The 8–12 years was observed between 2000 and 2015 for PNA and PDO, between 1977–1998 for MO and 1995–2000 for WeMO. Thus, WeMO, MO, AO, PDO, SOI, PNA, AMO were most frequent oscillations in station 3. For station 4, WeMO, AO, SOI and AMO were the most frequent indices. For 2–4 years, AMO, SOI, PNA were detected between 1995 and 2000. For 4–8 years, 1985–1995 were most important for AO and 1995–2000 for AMO and 1995–2008 for WeMO. The 8–12 years was observed except on PDO between 2000 and 2010 and WeMO between 1995 and 2005. For station 5, WeMO, MO, AO, SOI, and AMO were selected as dominant indices. For 8–12 years, MO was the most prevailing during the whole investigation period and WeMO from 1990 to 2008. The 4–8 years revealed the period 1995–2000 the most significant for AMO, 1985–1995 for AO and PDO and 2010–2015 for AO. For 2–4 years band, the 1980–1985–1990 periods were significant for AMO, and around 1990 for AMO, SOI, and AO.
As a synthesis, the most frequent oscillations were MO, WeMO and AO. However, Ouachani et al. [43] claimed that ENSO had the most important effect on precipitation. In fact, the influence of ENSO on precipitation is complex in the Mediterranean Basin. For this reason, the obtained results did not contain this index. On the other hand, Criado-Aldeanueva and Soto-Navarro [44] studied some basins in Mediterranean regions. According to them, all MO indices at decadal time scales displayed fairly comparable results. Our results support this hypothesis. It proves that MO influences the rainfall variability at 8–12 years in Gabes Basin. In the same Tunisian context, Jlassi et al. [42] showed a link between the precipitation at Medjerda and NAO. It was observed over 2–3 years from 1998 to 2003. They also found a high influence of MO on annual scale, which starts from 2003. In our study, the WeMO was found greatly better than the NAO to analyze the monthly variability in all stations. Zamrane et al. [19] showed that low frequency (>1–2 years) of rainfall variability in Morocco Basin maybe influenced by WeMO, SOI and global climatic fluctuations. High frequency variability (<1–2 years) was detected to be mainly caused by local conditions [19]. Similarly, Martin-Vide and Lopez-Bustins [45] found that WeMO controlled the variability of rainfall in the Iberian Peninsula. For them, the WeMO index governed rainfall Variability. To our knowledge, our findings are the first to prove this hypothesis. Dunkeloh and Jacobeit [46] studied the trend in west and central regions of the Mediterranean Basin. They confirmed that the registered trend is related to the increasing trend in the MO pattern. It is connected to the hemispheric circulation modes of the AO and NAO. Our work proves that the most frequent oscillations (MO, WeMO and AO) are probably the most important in Gabes basin. Particularly, the influence of regional circulation patterns MO and WeMO on precipitation and the major climate index of atmospheric circulation AO were found more influential in Gabes Watershed.
Mediterranean cyclogenesis activity is greatly linked to the MO index. This cyclogenesis is anomalously intense in the positive phase of MO. Despite that, it is atypically weak in the negative phase of MO [47]. WeMO helps to recognize that variability is caused by the cyclogenesis at the west of the Mediterranean Basin [45]. According to these works, rainfall is linked to Mediterranean systems (pressure and flows). In addition, the regional factors obviously affect the climate, considering the geographical factors (altitudes, etc.) as including the longitude and proximity to the Mediterranean Sea (east). The Mediterranean Basin is under the effect of a subtropical anticyclone. Later, in other research, the weak correlation between NAO and rainfall is the deduction of searching for WeMO. It is recognized as a variability pattern of a new low frequency. In our study, area, stations 1, 2 and 5 are coastal stations mostly affected by Mediterranean influence. Station 3 is governed by longitude. As for station 4, the topographic effect is most prominent.
The AO oscillation is a low-frequency derivative of NAO. It can be linked to the drought that prevailed in the Mediterranean Basin. It may be linked more principally to the drought periods that occurred in Tunisia [41]. The late 1980s and the early 2000s witnessed intense drought in a wider part of the Mediterranean region [48]. In other research, major droughts were registered in the late 1980s and 2000 in the south of Tunisia (Gabes Basin) [14].
According to the wavelet coherence analysis, the contribution of the climate indices to rainfall variability for each station was determined. It ranges between 48% for station 3 and 93% for station 5 at decadal scale (8–12 years) (Table 2). The contribution of climate indices was relatively important according to the modes of variability (Table 2). This analysis aimed at improving our understanding of the rainfall variability-climate relationship in south of Tunisia. At the inter-annual scales (2–4 and 4–8 years), the loss of coherence was detected. Zamrane et al [19] determined the rates of climate indices WeMO and SOI and rainfall. It varies between 50 and 60% at inter-annual scale (2–8 years). It fluctuates between 60 and 80% at decadal scale (8–16 years). It this study, investigation of MO on precipitation was found stronger at a decadal scale (8–12 years) for stations 4 and 5. It was notable at inter-annual scale (2–4 years) for stations 1 and 3. It was, also, distinguished at inter-annual scale (4–8 years) for all stations except station 3 (AO index). For inter-annual scale (2–4 years), we obtained heterogeneous results. AO, AMO, NAO and, SOI were detected for stations 4 and 5 and MO, AMO, PNA, WeMO for station 3, WeMO, MO, NAO for station 2 and MO, SOI, PNA, PDO for station 1. Thus, the wavelet coherence analysis showed that the variability could be linked to the influence of climate indices, which can vary in accordance with the distribution modes and temporal scales mode and the nature of localization of stations in Gabes Watershed. In this study, the most important oscillations in Gabes Basin are probably MO, WeMO and PDO for all stations except station 1. Consequently, the regional circulation patterns MO and WeMO can influence the rainfall variability in the arid Mediterranean region of Gabes Watershed.

Table 2.
Mean contribution of climate indices/precipitation wavelet coherence at different modes of variability at the stations in Gabes Watershed.
4. Conclusions
The evolution of rainfall in Gabes Basin evolved according to three different periods of alternating drought and humidity cycles. Since 2002, wetter climates recurred in spite of extreme variability with dry years. The continuous wavelet technique, applied to monthly series of precipitations, revealed an energy band with low and high frequencies. Results revealed four modes of variability: 1 year, 2–4, 4–8 and 8–12 years. The 4–8 year band, which reflects strong fluctuations, was detected from 1985 to 1990 in station 1 and over the period from 1990 to 1995 in station 2 and from 2005 to 2010 in station 3. A Major discontinuity was deduced in the studied stations occurring during the period extending from 1995 to 1997.
In order to define the origin of this variability, coherence wavelet analysis was used. Coherence was considered between the series of monthly precipitation and common climate indices (NAO, AMO, AO, SOI, PNA, PDO, MO, WeMO). Coherence between MO and precipitation described low frequencies (>1–2 years) with a total contribution of approximately 71%. However, the 8–12 year band presented a high contribution, reaching 93% for MO index (station 5). The results of the selected stations made it possible to show a strong relationship with the MO index at the annual mode around the years 1977, 1990 and 1995 and at inter-annual mode (2–4 years, 4–8 years and 8–12 years) for different periods for at each station. Moreover, a strong coherence of WeMO, AO and PDO was registered in our study Gabes Watershed for periods along inter-annual scales and each station.
These preliminary results would be more developed with a comparative study of variability of precipitation all over Tunisia, Algeria and Morocco to highlight specificities of the arid regions (its main modes of variability and its relationship with other climate indicators). More comprehensive investigations on scenarios of climate change on variability of precipitation are also recommended.
Acknowledgements
This work is the result of cooperation between the Department of Earth Sciences of the University of Sfax and Laboratory of modeling of geological and hydrological systems, Tunisia. Precipitation data employed in this study were collected by Tunisian Ministry of Agriculture and Water Resources. The authors also would like to thank the anonymous reviewers and the editors for their constructive comments. The authors would like to thank Nicolas MASSEI, Professor at the University of Rouen for his consistent support and his helpful suggestions. Regards are due to Kamel MAALOUL, translator and English Professor, for proofreading and language polishing services.
Author Contributions
S.J., M.E., H.A. examined data and achieved computation. S.J. prepared the manuscript. M.E. gave suggestions and technical support. S.J. and H.A. made contributions to the revision of the paper.
Conflicts of Interest
The authors declare no conflict of interest.
References
- Pachauri, R.K.; Allen, M.R.; Barros, V.R.; Broome, J.; Cramer, W.; Christ, R.; Church, J.A.; Clarke, L.; Dahe, Q.; Dasgupta, P.; et al. Climate Change 2014: Synthesis Report. In Contribution of Working Groups I, II and III to the Fifth Assessment Report of the Intergovernmental Panel on Climate Change; Pachauri, R.K., Meyer, L.A., Eds.; Intergovernmental Panel on Climate Change: Geneva, Switzerland, 2014; p. 151. [Google Scholar]
- Kendon, E.J.; Rowell, D.P.; Jones, R.G. Mechanisms and reliability of future projected changes in daily precipitation. Clim. Dyn. 2010, 35, 489–509. [Google Scholar] [CrossRef]
- Daniels, E.; Lenderink, G.; Hutjes, R.; Holtslag, A. Relative impacts of land use and climate change on summer precipitation in The Netherlands. Hydrol. Earth Syst. Sci. 2016, 20, 4129–4142. [Google Scholar] [CrossRef]
- Zhang, Q.; Singh, V.P.; Peng, J.; Chen, Y.D.; Li, J. Spatial-temporal changes of precipitation structure across the Pearl River Basin, China. J. Hydrol. 2012, 440, 113–122. [Google Scholar] [CrossRef]
- Mitchell, J.F.B.; Davis, R.A.; Ingram, W.A.; Senior, C.A. On surface temperatures, greenhouse gases and aerosols: models and observations. J. Clim. 1995, 10, 2364–2386. [Google Scholar] [CrossRef]
- Brunetti, M.; Maugeri, M.; Nanni, T. Changes in total precipitation, rainy days and extreme events in Northeastern Italy. Int. J. Climatol. 2001, 21, 861–871. [Google Scholar] [CrossRef]
- Warrick, R. Changes in Sea Level. In Climate Change 1995: The Science of Climate Change. Report of Assessment Report of the Intergovernmental Panel on Climate Change Working Group I; Houghton, J.T., Ding, Y., Griggs, D.J., Noguer, M., Van der Linden, P.J., Dai, X., Maskell, K., Johnson, C.A., Eds.; Cambridge University Press: Cambridge, UK, 1996; pp. 363–405. [Google Scholar]
- Callaghan, T.V.; Johansson, M.; Brown, R.D.; Groisman, P.Y.; Labba, N.; Radionov, V.; Bradley, R.S.; Blangy, S.; Bulygina, O.N.; Christensen, T.R.; et al. Multiple Effects of Changes in Arctic Snow Cover. AMBIO J. Hum. Environ. 2011, 40, 32–45. [Google Scholar] [CrossRef]
- Solomon, S.; Qin, D.; Manning, M.; Chen, Z.; Marquis, M.; Averyt, K.B.; Tignor, M.M.H.L.; Miller, H.L. The Physical Science Basis. In Contribution of Working Group I to the Fourth Assessment Report of the Intergovernmental Panel on Climate Change; Cambridge University Press: Cambridge, UK, 2007. [Google Scholar]
- Gocic, M.; Trajkovic, S. Analysis of precipitation and drought data in Serbia over the period 1980–2010. J. Hydrol. 2013, 494, 32–42. [Google Scholar] [CrossRef]
- Ampitiyawatta, A.; Guo, S. Precipitation trends in the Kalu Ganga basin in Sir Lanka. J. Agric. Sci. 2009, 4, 10–18. [Google Scholar]
- Ellouze, M.; Azri, C.; Abida, H. Spatial variability of monthly and annual rainfall data over Southern Tunisia. J. Atmos. Res. 2009, 93, 832–839. [Google Scholar] [CrossRef]
- Feki, H.; Slimani, M.; Cudennec, C. Incorporating elevation in rainfall interpolation in Tunisia using geostatistical methods. Hydrol. Sci. J. 2012, 57, 1294–1314. [Google Scholar] [CrossRef]
- Jemai, S.; Ellouze, M.; Agoubi, B.; Abida, H. Drought intensity and spatial variability in Gabes Watershed, south-eastern Tunisia. J. Water Land Dev. 2016, 31, 63–72. [Google Scholar] [CrossRef]
- Coulibaly, P. Spatial and temporal variability of Canadian seasonal precipitation (1900–2000). Adv. Water Resour. 2006, 29, 1846–1865. [Google Scholar] [CrossRef]
- Mishra, A.K.; Özger, M.; Singh, V.P. Wet and dry spell analysis of Global Climate Model generated precipitation using power laws and wavelet transforms. Stoch. Environ. Res. Risk Assess. 2011, 25, 517–535. [Google Scholar] [CrossRef]
- Rashid, M.M.; Beecham, M.; Chowdhury, R.K. Assessment of trends in point rainfall using continuous wavelet transforms. Adv. Water Res. 2015, 82, 1–15. [Google Scholar] [CrossRef]
- Joshi, N.; Gupta, D.; Suryavanshi, S.; Adamowski, J.; Madramootoo, C.A. Introduction Analysis of trends and dominant periodicities in drought variables in India: A wavelet transform based approach. Atmos. Res. 2016, 182, 200–220. [Google Scholar] [CrossRef]
- Zamrane, Z.; Laftouhi, N.; Mahé, G.; Laignel, B. Relationship between Climate Index (WMOI, SOI) and Variability of precipitation in Azib Soltane (Sebou basin Marocco). J. Environ. Earth Sci. 2016, 6, 34–42. [Google Scholar]
- Massei, N.; Laignel, B.; Deloffre, J.; Mesquita, J.; Motelay, A.; Lafite, R.; Durand, A. Long-term hydrological changes of the Seine River flow (France) and their relation to the North Atlantic Oscillation over the period 1950–2008. Int. J. Climatol. 2009, 30, 2146–2154. [Google Scholar] [CrossRef]
- Rampelotto, P.H.; Rigozo, M.R.; daRosa, M.B.; Prestes, A.; Frigo, E.; SouzaEcher, M.P.; Nordemann, D.J.R. Variability of rainfall and temperature (1912–2008) parameters measured from Santa Maria (29°41′ S, 53°48′ W) and their connections. J. Atmos. Sol. Terr. Phys. 2012, 77, 152–160. [Google Scholar] [CrossRef]
- Hermida, L. Hailfall in southwest France: Relationship with precipitation, trends and wavelet analysis. Atmos. Res. 2015, 156, 174–188. [Google Scholar] [CrossRef]
- Jobin, T.; Prasannakumar, V. Temporal analysis of rainfall (1871–2012) and drought characteristics over a tropical monsoon-dominated State (Kerala) of India. J. Hydrol. 2016, 534, 266–280. [Google Scholar]
- Saghafian, B.; Haghnegahdar, A.; Dehghani, M. Effect of ENSO on annual maximum floods and volume over threshold in the southwestern region of Iran. Hydrol. Sci. J. 2017, 62, 1039–1049. [Google Scholar] [CrossRef]
- Churchill, O. An Advanced Review of the Relationships between Sahel Precipitation and Climate Indices: A Wavelet Approach. Int. J. Atmos. Sci. 2014, 2014, 75906. [Google Scholar]
- Turki, I.; Laignel, B.; Chevalier, L.; Costa, S.; Massei, N. On the Investigation of the Sea-Level Variability in Coastal Zones Using SWOT Satellite Mission: Example of the Eastern English Channel (Western France). J. Sel. Top. Appl. Earth Obs. Remote Sens. 2015, 8, 1564–1569. [Google Scholar] [CrossRef]
- General Department of Water Resources (DGRE). Variability of Precipitation Reports in Tunisia; Tunisian Ministry of Agriculture and Water Resources: Tunis, Tunisia, 2015.
- R Core Team. R: A Language and Environment for Statistical Computing; R Foundation for Statistical Computing: Vienna, Austria, 2009. Available online: http://www.r-project.org/ (accessed on 10 December 2016).
- Maraun, D. SOWAS: Software for Wavelet Spectral Analysis and Synthesis. Available online: http://tocsy.agnld.uni-potsdam.de/wavelets (accessed on 10 December 2016).
- Maraun, D.; Kurths, J. Cross wavelet analysis. Significance testing and pitfalls. Nonlinear Proc. Geophys. 2004, 11, 505–514. [Google Scholar] [CrossRef]
- Maraun, D.; Kurths, J.; Holschneider, M. Non stationary Gaussian processes in wavelet domain: Synthesis, estimation and significance testing. Phys. Rev. 2007, E75, 016707. [Google Scholar]
- Torrence, C.; Compo, G.P. A practical guide to wavelet analysis. Bull. Am. Meteorol. Soc. 1998, 79, 61–78. [Google Scholar] [CrossRef]
- Schneider, K.; Farge, M. Wavelets: Mathematical Theory Encyclopedia of Mathematical Physics; Françoise, J.P., Naber, G., Tsun, T.S., Eds.; Elsevier: Amsterdam, The Netherlands, 2006; Volume 5, pp. 426–438. [Google Scholar]
- Labat, D. Recent advances in wavelet analyses: Part 1. A review of concepts. J. Hydrol. 2005, 314, 275–288. [Google Scholar] [CrossRef]
- Massei, N.; Durand, A.; Deloffre, J.; Dupont, J.P.; Valdes, D.; Laignel, B. Investigating possible links between the North Atlantic Oscillation and rainfall variability in northwestern France over the past 35 years. J. Geophys. Res. Atmos. 2007, 112, D9. [Google Scholar] [CrossRef]
- Grinsted, A.; Moore, J.C.; Jevrejeva, S. Application of the cross wavelet transform and wavelet coherence to geophysical time series. Nonlinear Proc. Geophys. 2004, 11, 561–566. [Google Scholar] [CrossRef]
- Schaefli, B.; Maraun, D.; Holschneider, M. Review what drives high flow events in the Swiss Alps? Recent developments in wavelet spectral analysis and their application to hydrology. Adv. Water Resour. 2007, 30, 2511–2525. [Google Scholar] [CrossRef]
- Fritier, N.; Massei, N.; Laignel, B.; Durand, A.; Dieppois, B.; Deloffre, J. Links between NAO fluctuations and inter-annual variability of winter-months precipitation in the Seine River watershed (north-western France). CR. Geosci. 2012, 344, 396–405. [Google Scholar] [CrossRef]
- Nouaceur, Z.; Laignel, B.; Imen, T.; Jemai, H. Climate change in Northen Africa: Towards a return of rainfall on the southern Mediterranean basin. In Proceedings of the Air and Water Components of the Environment, Cluj Napoca, Romania, 21–22 March 2014; pp. 48–55. [Google Scholar]
- Nouaceur, Z.; Murărescu, O. Variability of precipitation and Trend Analysis of Annual Rainfall in North Africa. Int. J. Atmos. Sci. 2016, 2016, ID7230450. [Google Scholar]
- Laignel, B.; Nouaceur, Z.; Laignel, B.; Turki, I.; Jemai, H.; Abida, H.; Ellouze, M. North Atlantic oscillation and variability of precipitation of the southern coast of the Mediterranean. In Proceedings of the Air and Water Components of the Environment, Cluj Napoca, Romania, 21–22 March 2014; pp. 203–210. [Google Scholar]
- Jlassi, A.; Gaaloul, N.; Laignel, B.; Turki, I. Caractérisation hydrologique de l’Oued Medjerda (Tunisie) dans le cadre de la future mission spatiale SWOT. In Proceedings of the Conférence Internationale sur l'Hydrologie des Grands Bassins Fluviaux de l’Afrique, Hammamet, Tunisie, 26–30 October 2015; pp. 1–8. [Google Scholar]
- Ouachani, R.; Bargaoui, Z.; Ouarda, T. Power of teleconnection patterns on precipitation and streamflow variability of upper Medjerda Basin. Int. J. Clim. 2013, 33, 58–76. [Google Scholar] [CrossRef]
- Criado-Aldeanueva, F.; Javier Soto-Navarro, F. The Mediterranean Oscillation Teleconnection Index: Station-Based versus Principal Component Paradigms. Adv. Meteorol. 2013, 2013, 1–10. [Google Scholar] [CrossRef]
- Martin-Vide, J.; Lopez-Bustins, J.A. The western Mediterranean oscillation and rainfall in the Iberian Peninsula. Int. J. Climatol. 2006, 26, 1455–1475. [Google Scholar] [CrossRef]
- Dunkeloh, A.; Jacobeit, J. Circulation dynamics of Mediterranean precipitation 1948–98. Int. J. Climatol. 2003, 23, 1843–1866. [Google Scholar] [CrossRef]
- Sušelj, K.; Bergant, K. Mediterranean Oscillation Index. Geophys. Res. Abstr. 2006, 8, 1–2. [Google Scholar]
- Kutiel, H.; Maheras, P.; Guika, S. Circulation and extreme rainfall conditions in the eastern Mediterranean during the last century. Int. J. Clim. 1996, 16, 73–92. [Google Scholar] [CrossRef]
© 2017 by the authors. Licensee MDPI, Basel, Switzerland. This article is an open access article distributed under the terms and conditions of the Creative Commons Attribution (CC BY) license (http://creativecommons.org/licenses/by/4.0/).

