3.1. Spatiotemporal Distribution Features of HCHO throughout Beijing-Tianjin-Hebei
Although uncertainties have been largely reduced in HCHO products, it is possible that other systematic errors have not been eliminated entirely. Regarding the potential instrumental error, HCHO over the remote Pacific Ocean has been taken into consideration. As reported, HCHO over the western Pacific Ocean (i.e., the HCHO background area) was used to validate corresponding satellite-based measurements, and no trend was found [
33,
34]. Linear least squares regression adopted in this study is the approach to infer the potential trends exhibited in HCHO images. Given that, eleven-year average columns and corresponding trends over two remote Pacific areas (i.e., tropical Pacific (180°–160° W 0–20° N) and mid-latitude north Pacific (160°–180° E, 33°–43° N)) were used as the reference and potential impact of instrument uncertainty. The remote tropical Pacific (with an average VCD of 3.8 × 10
15 molecules/cm
2 and a deviation of 3 × 10
14 molecules/cm
2) is the broadly adopted background area, and the mid-latitude north Pacific (with an average VCD of 3.9 × 10
15 molecules/cm
2 and a deviation of 5 × 10
14 molecules/cm
2) used in this study is located in almost the same latitudinal zone compared with Beijing-Tianjin-Hebei. Over the mid-latitude north Pacific, the average trend of HCHO VCDs is 3.00 × 10
12 molecules/cm
2·month
−1 compared with 2.70 × 10
11 molecules/cm
2·month
−1 over the tropical Pacific area. Therefore, the average column (i.e., 3.9 × 10
15 molecules/cm
2) and trend (i.e., 3.00 × 10
12 molecules/cm
2·month
−1) over mid-latitude north Pacific Ocean were considered as impact potentially imposed by noise.
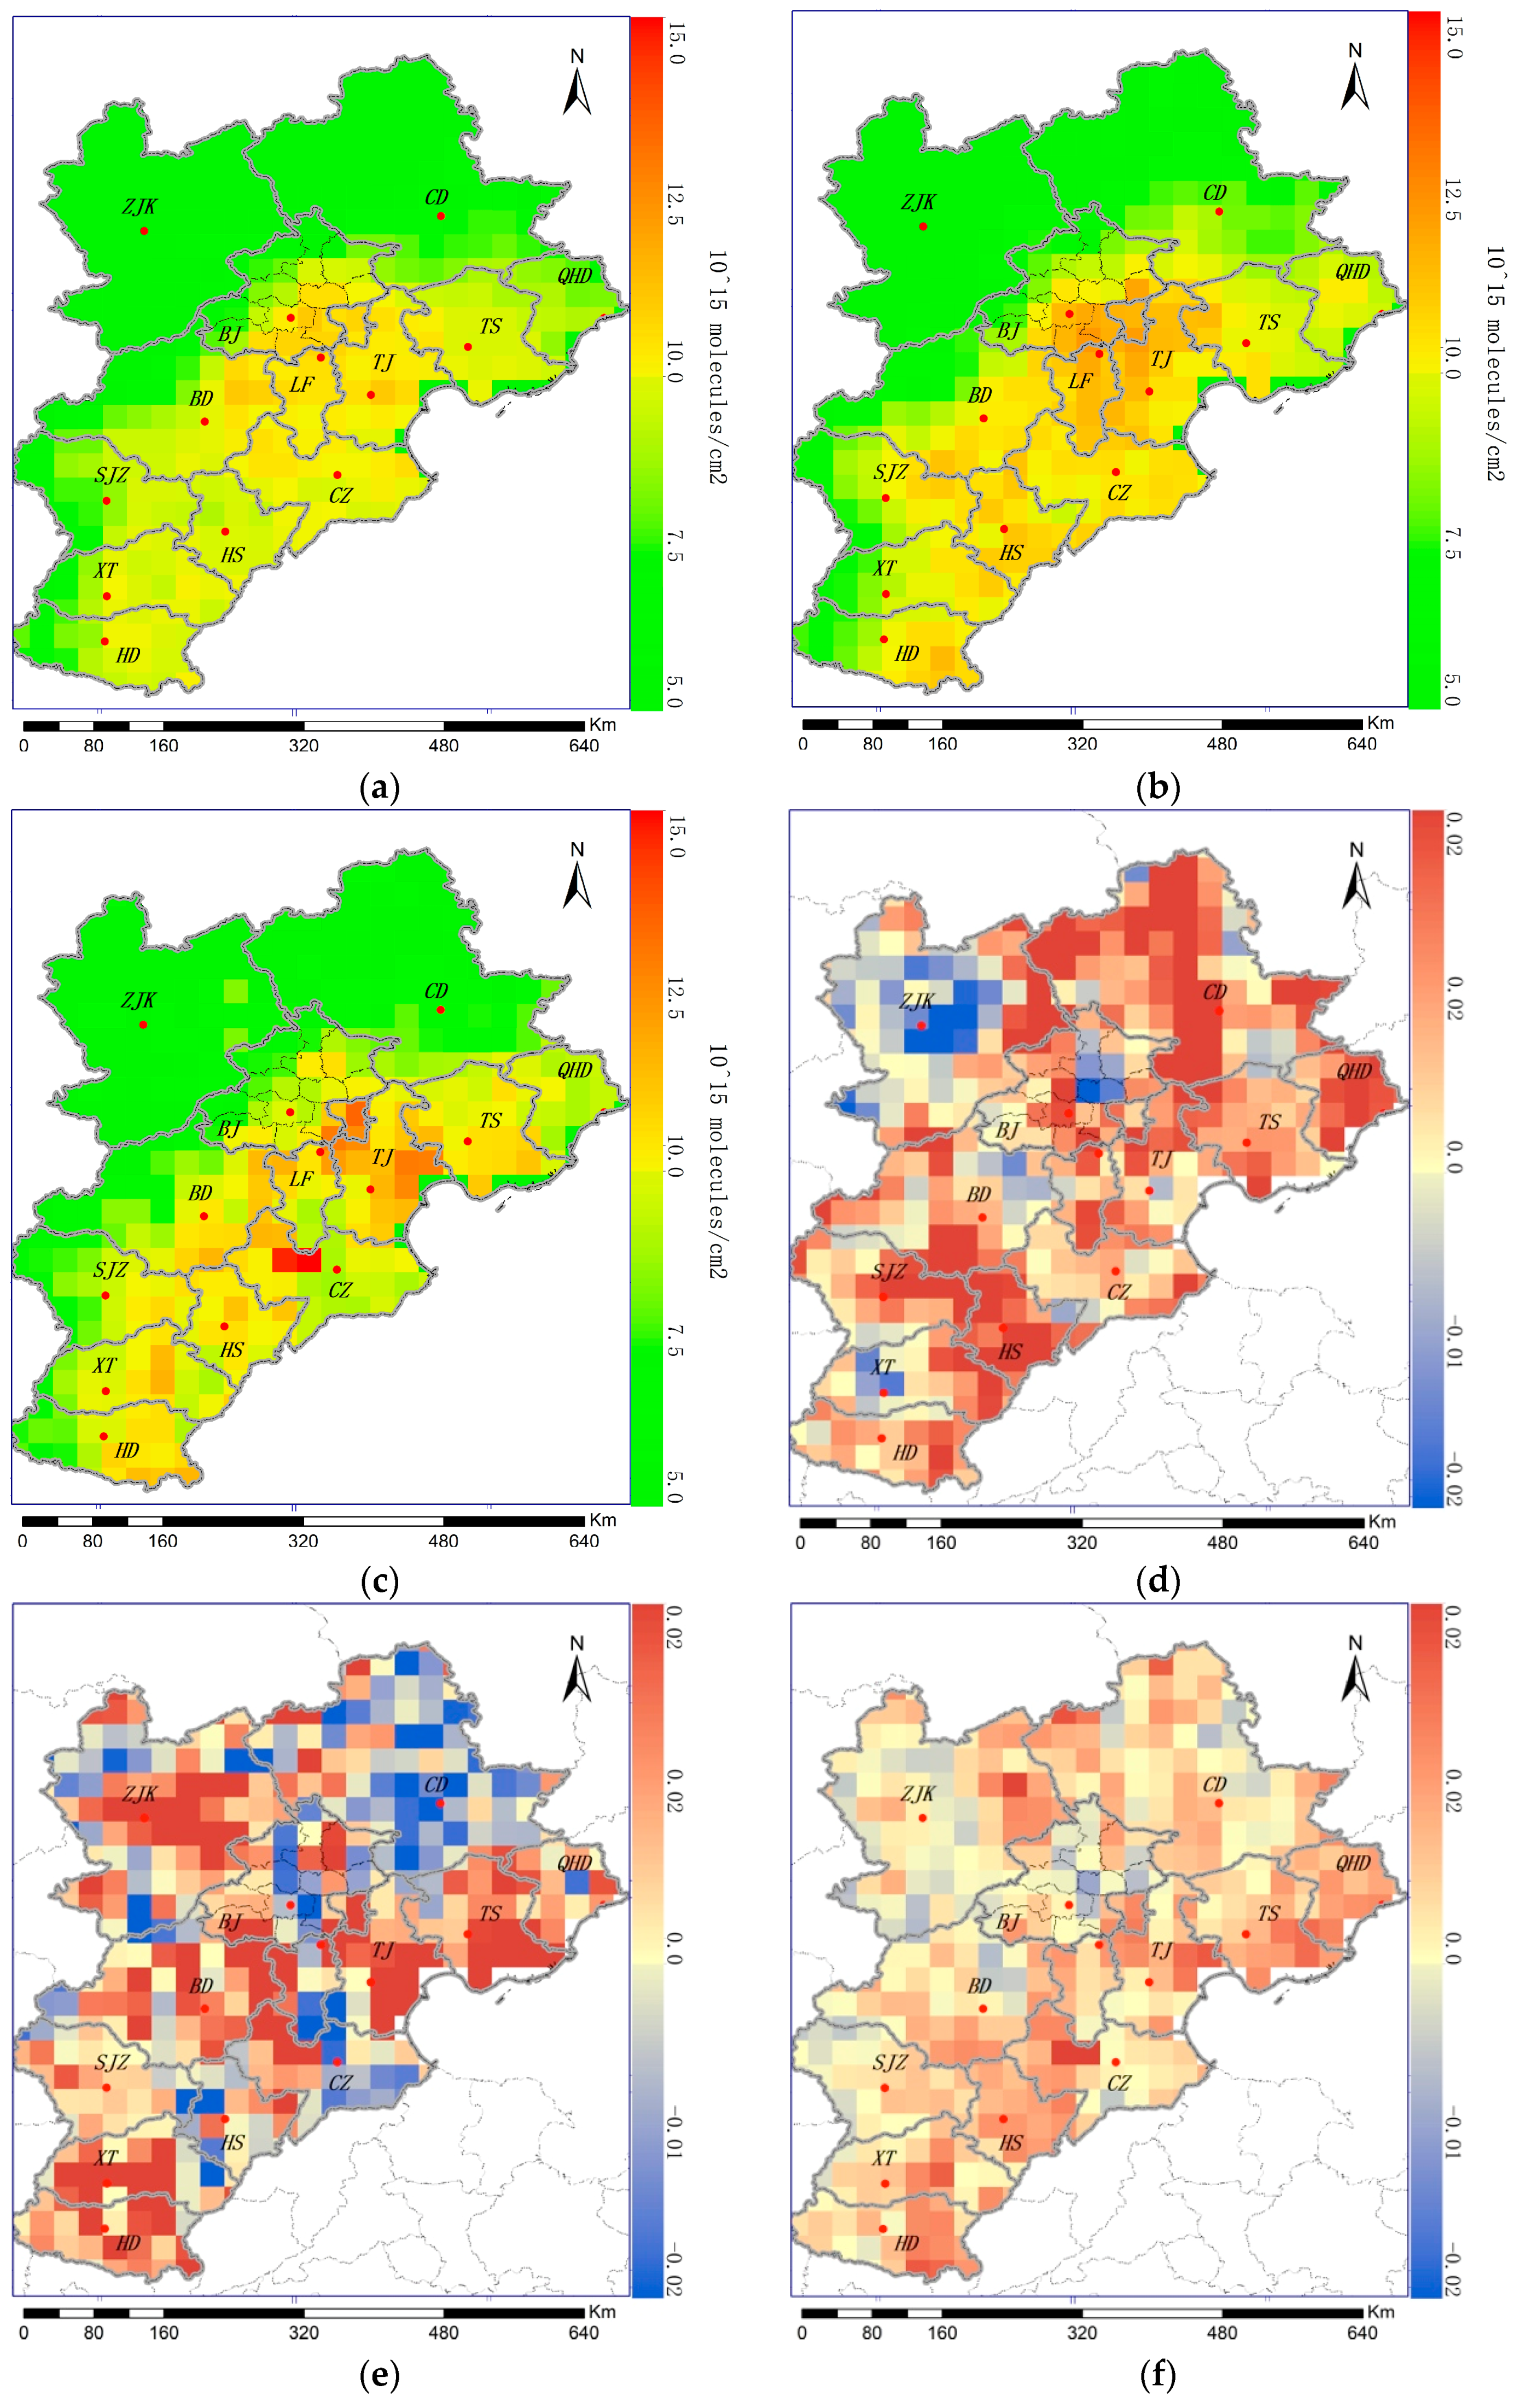
Figure 2a–c show the yearly average values of the tropospheric HCHO VCD in 2005, 2010 and 2015, respectively. The eleven-year average HCHO VCD of the whole Beijing-Tianjin-Hebei region is 7.6 × 10
15 molecules/cm
2 and the standard deviation is 2.5 × 10
15 molecules/cm
2. The HCHO distribution exhibits significant and evident discrepancies toward the east and west. For example, the average HCHO VCD is approximately 10 × 10
15 molecules/cm
2 toward the south and east, while the VCD is only approximately 5 × 10
15 molecules/cm
2 in the other sectors (
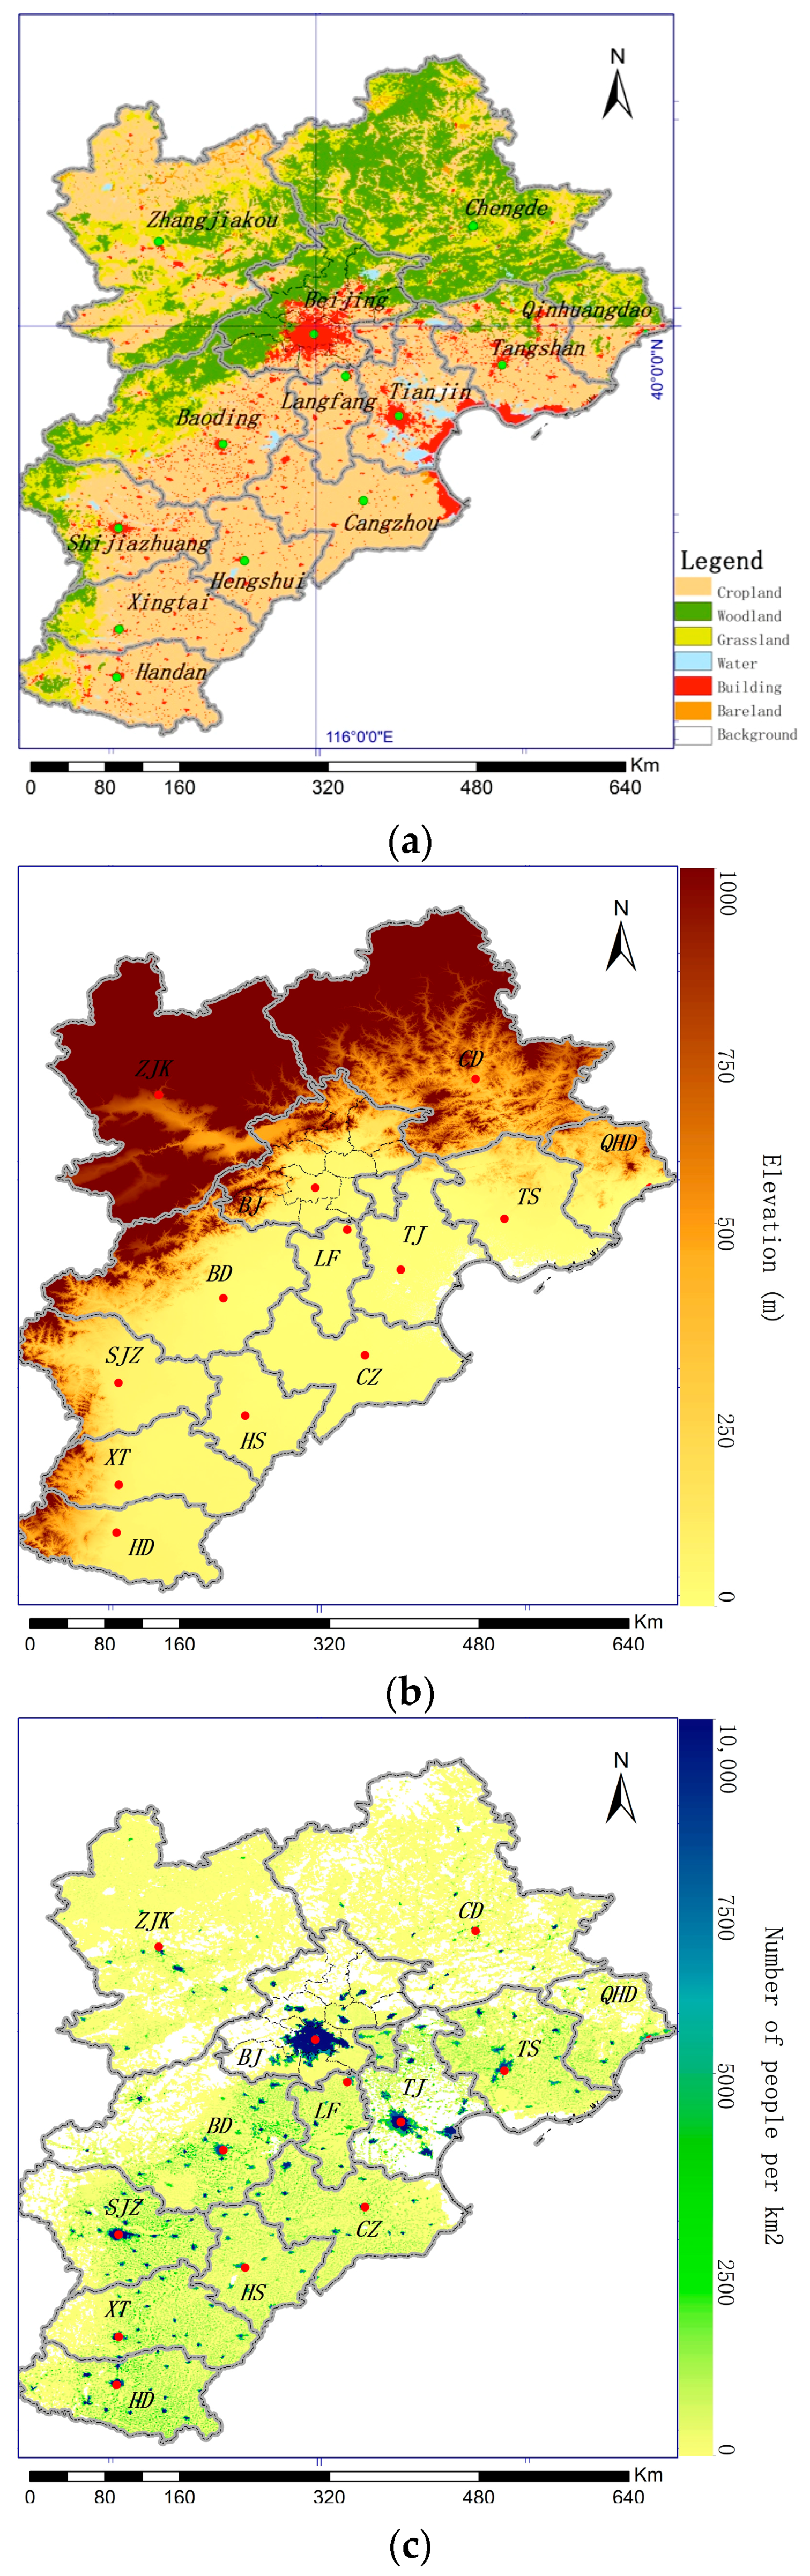
Figure 2b). Higher HCHO VCDs are more easily observed over the densely populated plains (e.g., the southern and eastern sector) shown in
Figure 1. In contrast, most of the regions with lower HCHO VCDs are mountainous with a smaller population. The widespread distribution of HCHO is more homogenous than those of other gaseous pollutants (e.g., NO
2), and no HCHO concentration center is observed within the satellite images.
From 2005 to 2010 (
Figure 2d), the HCHO concentration increased throughout most of Beijing-Tianjin-Hebei except for a selected few locations. The largest increase was observed in Chengde (i.e., the trend is 1.40 × 10
13 molecules/cm
2·month
−1 with an RMSE about 2.6 × 10
15 molecules/cm
2). This might be due to the rapidity of urbanization and industrial development in China, including within the Beijing-Tianjin-Hebei region, which is accompanied by vast quantities of emissions that can cause serious air problems.
Figure 2e shows the changes in HCHO VCDs through 2010 to 2015, which possibly reflect the strict reduction policies regarding VOCs that became public during that interval. Evident downward trends were found in Beijing, Cangzhou and Langfang at −7.39 × 10
12 molecules/cm
2·month
−1, −1.80 × 10
13 molecules/cm
2·month
−1, and −7.83 × 10
12 molecules/cm
2·month
−1, respectively, especially in the heavily urbanized areas. HCHO columns in Chengde were largely reduced by about 17% during that period, although a VCD increase was observed therein between 2005 and 2010. In contrast, Zhangjiakou exhibited a distinct increase from 2010 to 2015, and about 35% in urban areas. This increase is likely due to the recent development of western Beijing-Tianjin-Hebei. In addition, although decreases were observed in northern sectors (e.g., Chengde) from 2010 to 2015, to gather a general picture in both periods, Beijing-Tianjin-Hebei, on average as suggested in
Figure 2f, demonstrates an overall upward trend (5.20 × 10
13 molecules/cm
2·month
−1 with a deviation of 3.6 × 10
15 molecules/cm
2) from 2005 to 2015. The findings are generally consistent with previous work, for instance, De Smedt et al. identified increasing HCHO columns in China [
16]. Temporal and spatial discrepancies in HCHO distribution are complicated in mega-cities like Beijing [
35]. Therefore, more specific analyses will be discussed later.
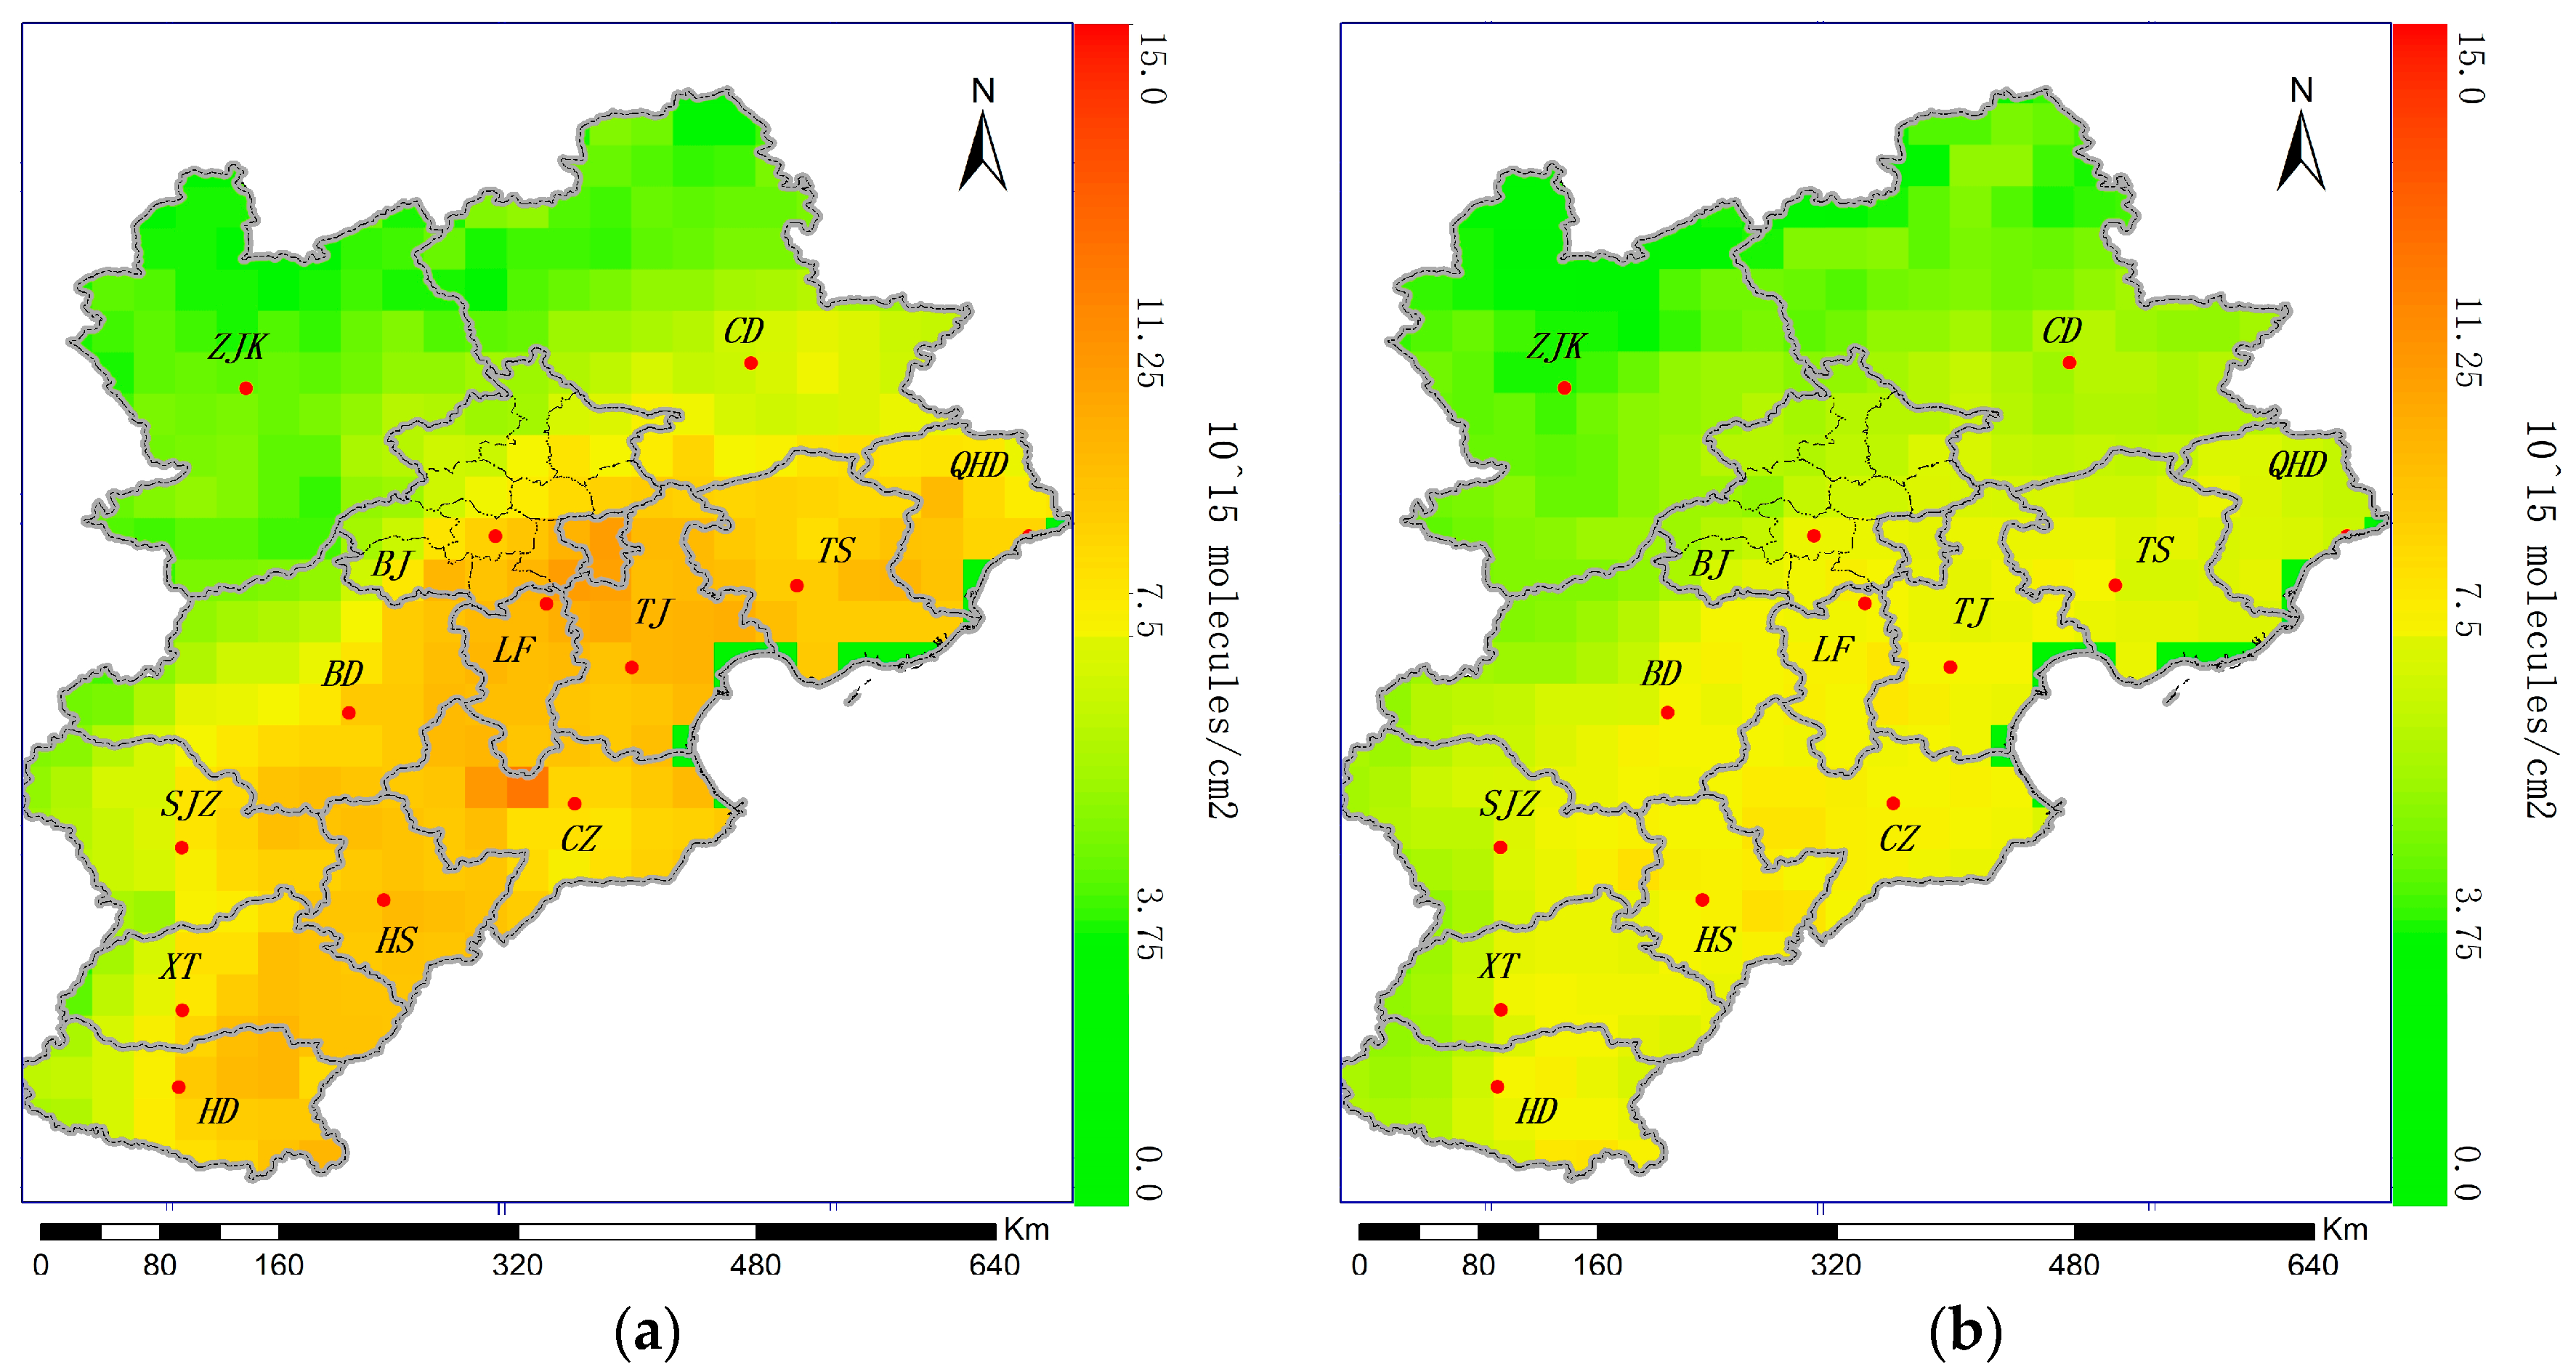
The seasonal features and patterns of the HCHO distribution are discernable for every year between 2005 and 2015.
Figure 3 demonstrates the average seasonal tropospheric HCHO VCDs.
Figure 3a shows the HCHO VCD distribution during the autumn season. The average VCD in autumn is 6.8 × 10
15 molecules/cm
2 and the standard deviation is 2.9 × 10
15 molecules/cm
2. High contiguous HCHO concentrations were observed primarily within the Beijing-Tianjin-Tangshan industrial area. Some high VCDs were also observed in the southern parts of the study area.
Figure 3b depicts the HCHO VCD distribution during the wintertime with an average of 5.79 × 10
15 molecules/cm
2 and a deviation of 1.5 × 10
15 molecules/cm
2. Emissions during the winter season (e.g., in Beijing) are primarily derived from anthropogenic sources, as emissions from deciduous trees are enormously diminished [
36]. Consequently, biogenic VOC photolysis is relatively inactive, and the distribution of HCHO is decreased substantially.
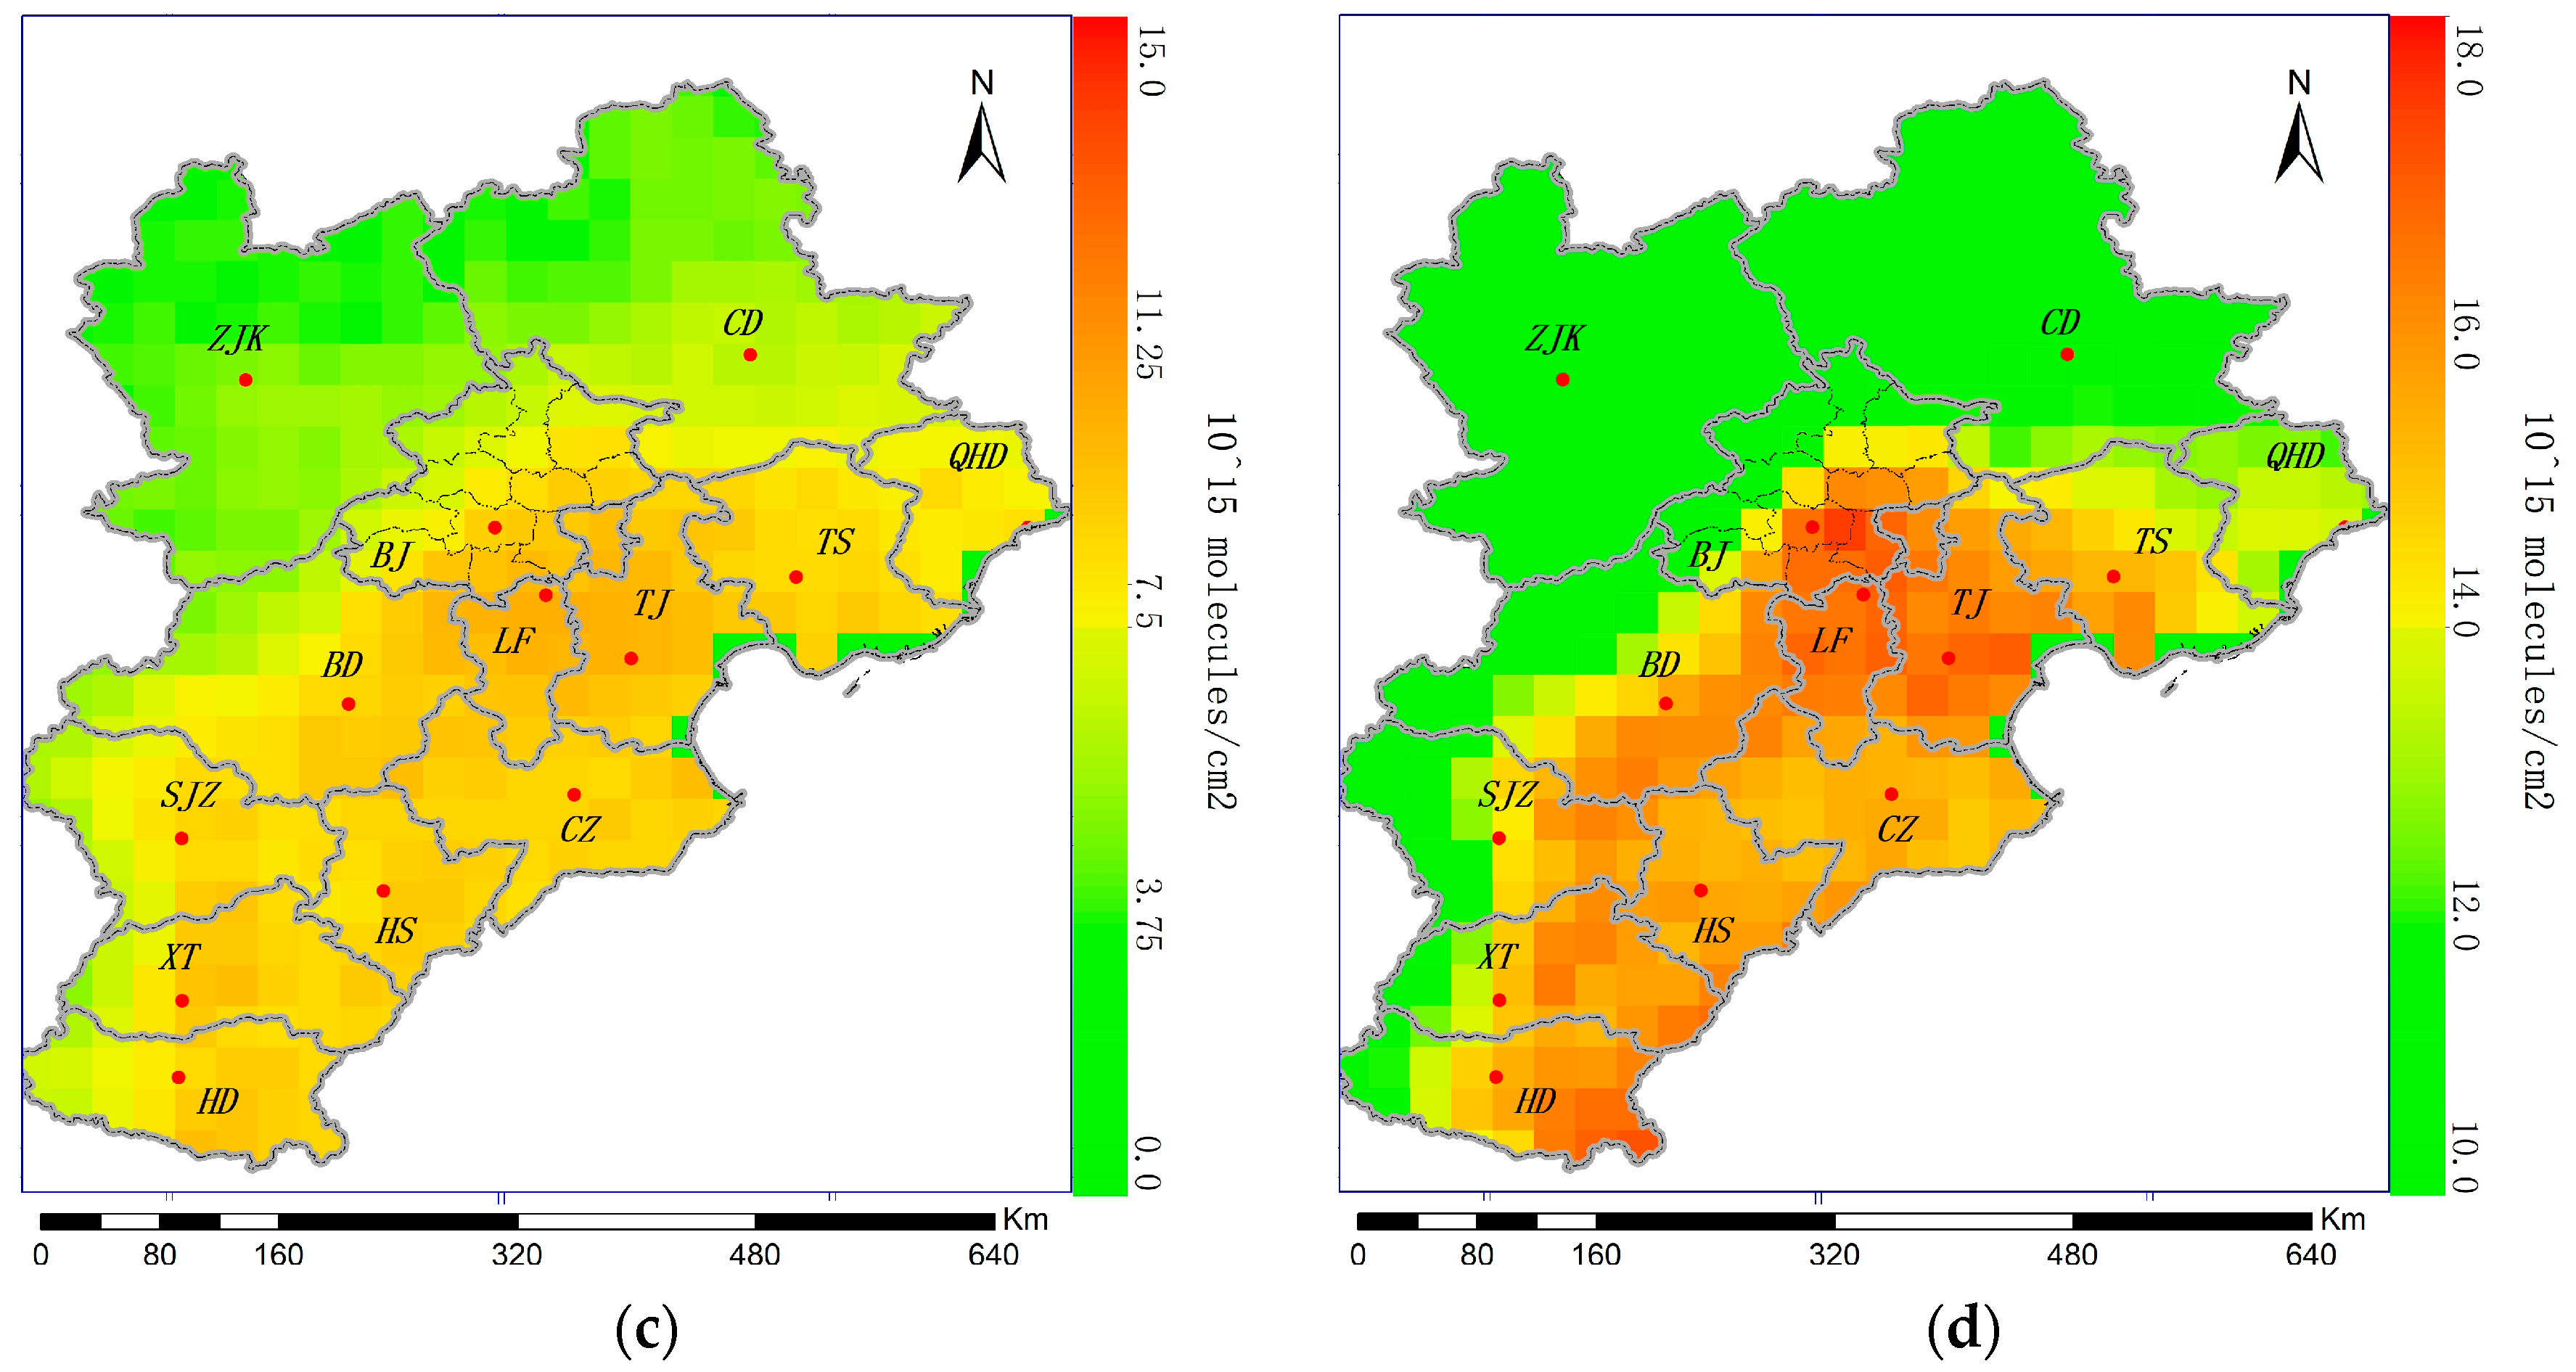
Figure 3c illustrates the HCHO distribution during the spring. Compared to that in the winter season, the coverage and VCD of the HCHO distribution in spring barely changes; however, a large zone of high HCHO concentrations appears in Beijing-Tianjin-Langfang. In spring, HCHO distribution is similar to that in autumn with an average of 6.7 × 10
15 molecules/cm
2 and a deviation of 2.1 × 10
15 molecules/cm
2.
Figure 3d shows the HCHO distribution in summer, during which both the vegetation activity (e.g., isoprene) and sunlight intensity reach their peaks. The entire southern and eastern Beijing-Tianjin-Hebei region exhibits a very high HCHO concentration at 11.1 × 10
15 molecules/cm
2 with a standard deviation of 4.3 × 10
15 molecules/cm
2. The highest HCHO concentration was observed over southeast Beijing and surrounding areas (e.g., 16.6 × 10
15 molecules/cm
2 in Langfang). In addition, urban areas demonstrate relatively higher HCHO columns. For example, in southeast Beijing, a highly urbanized area, the average VCD is 12.9 × 10
15 molecules/cm
2 while the average VCD of the whole Beijing is 10.8 × 10
15 molecules/cm
2.
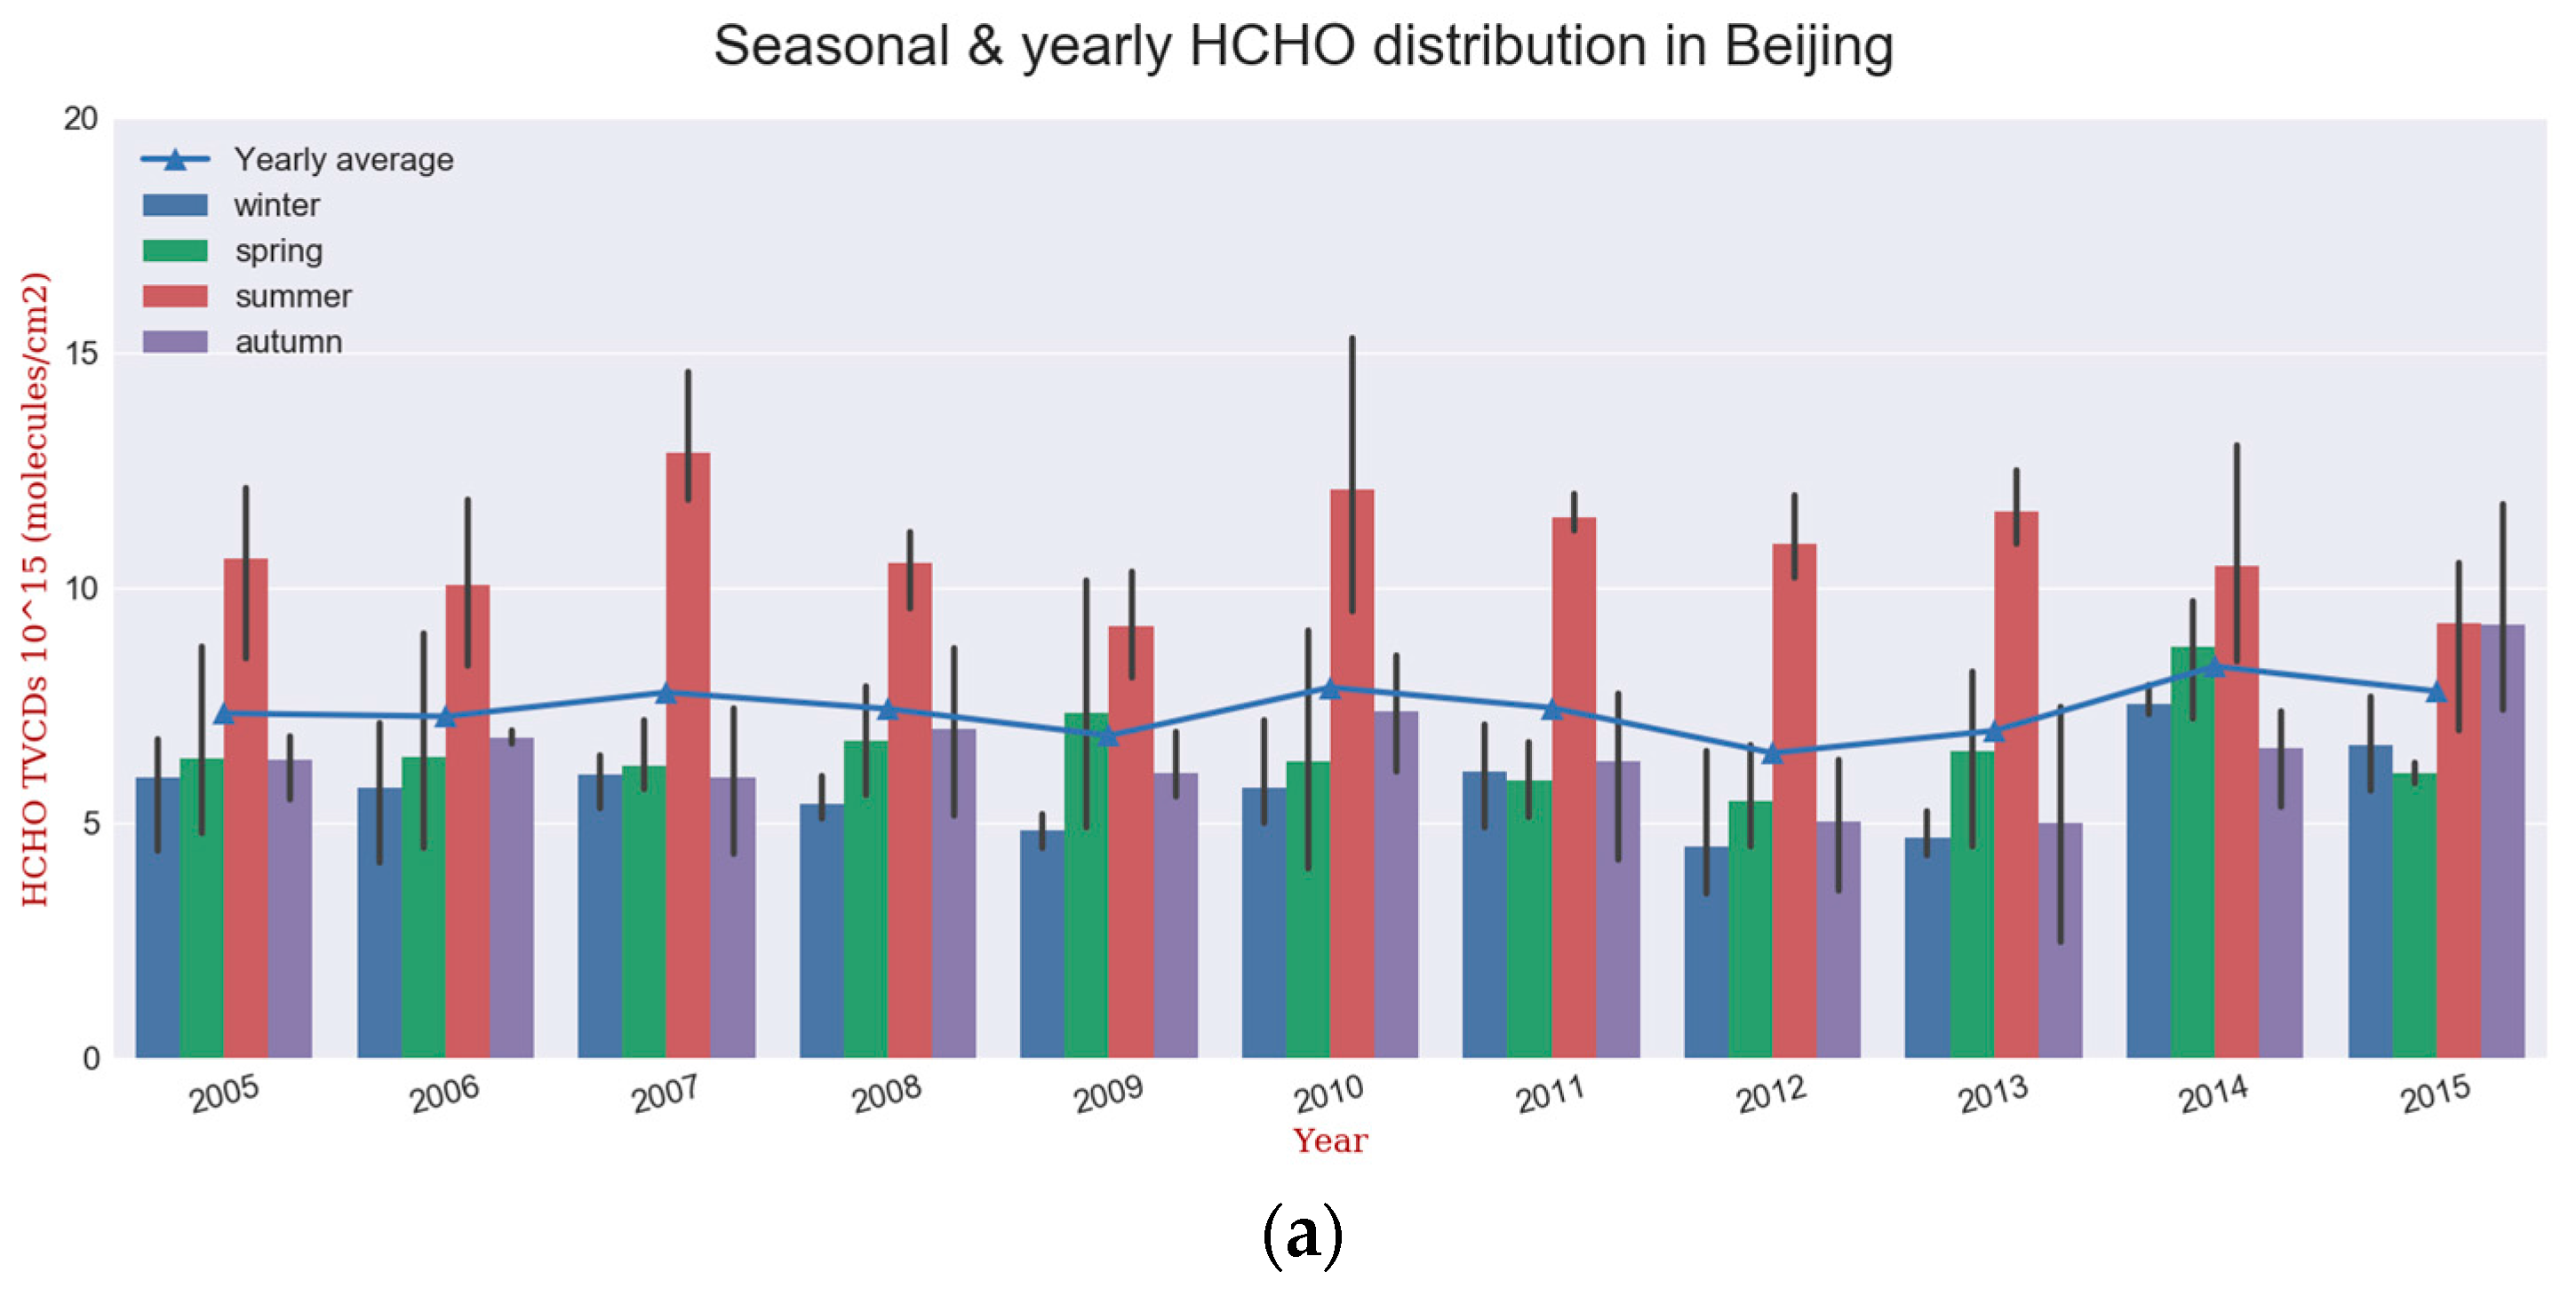
Furthermore, long-term datasets of HCHO VCDs for these regions were analyzed. As shown in
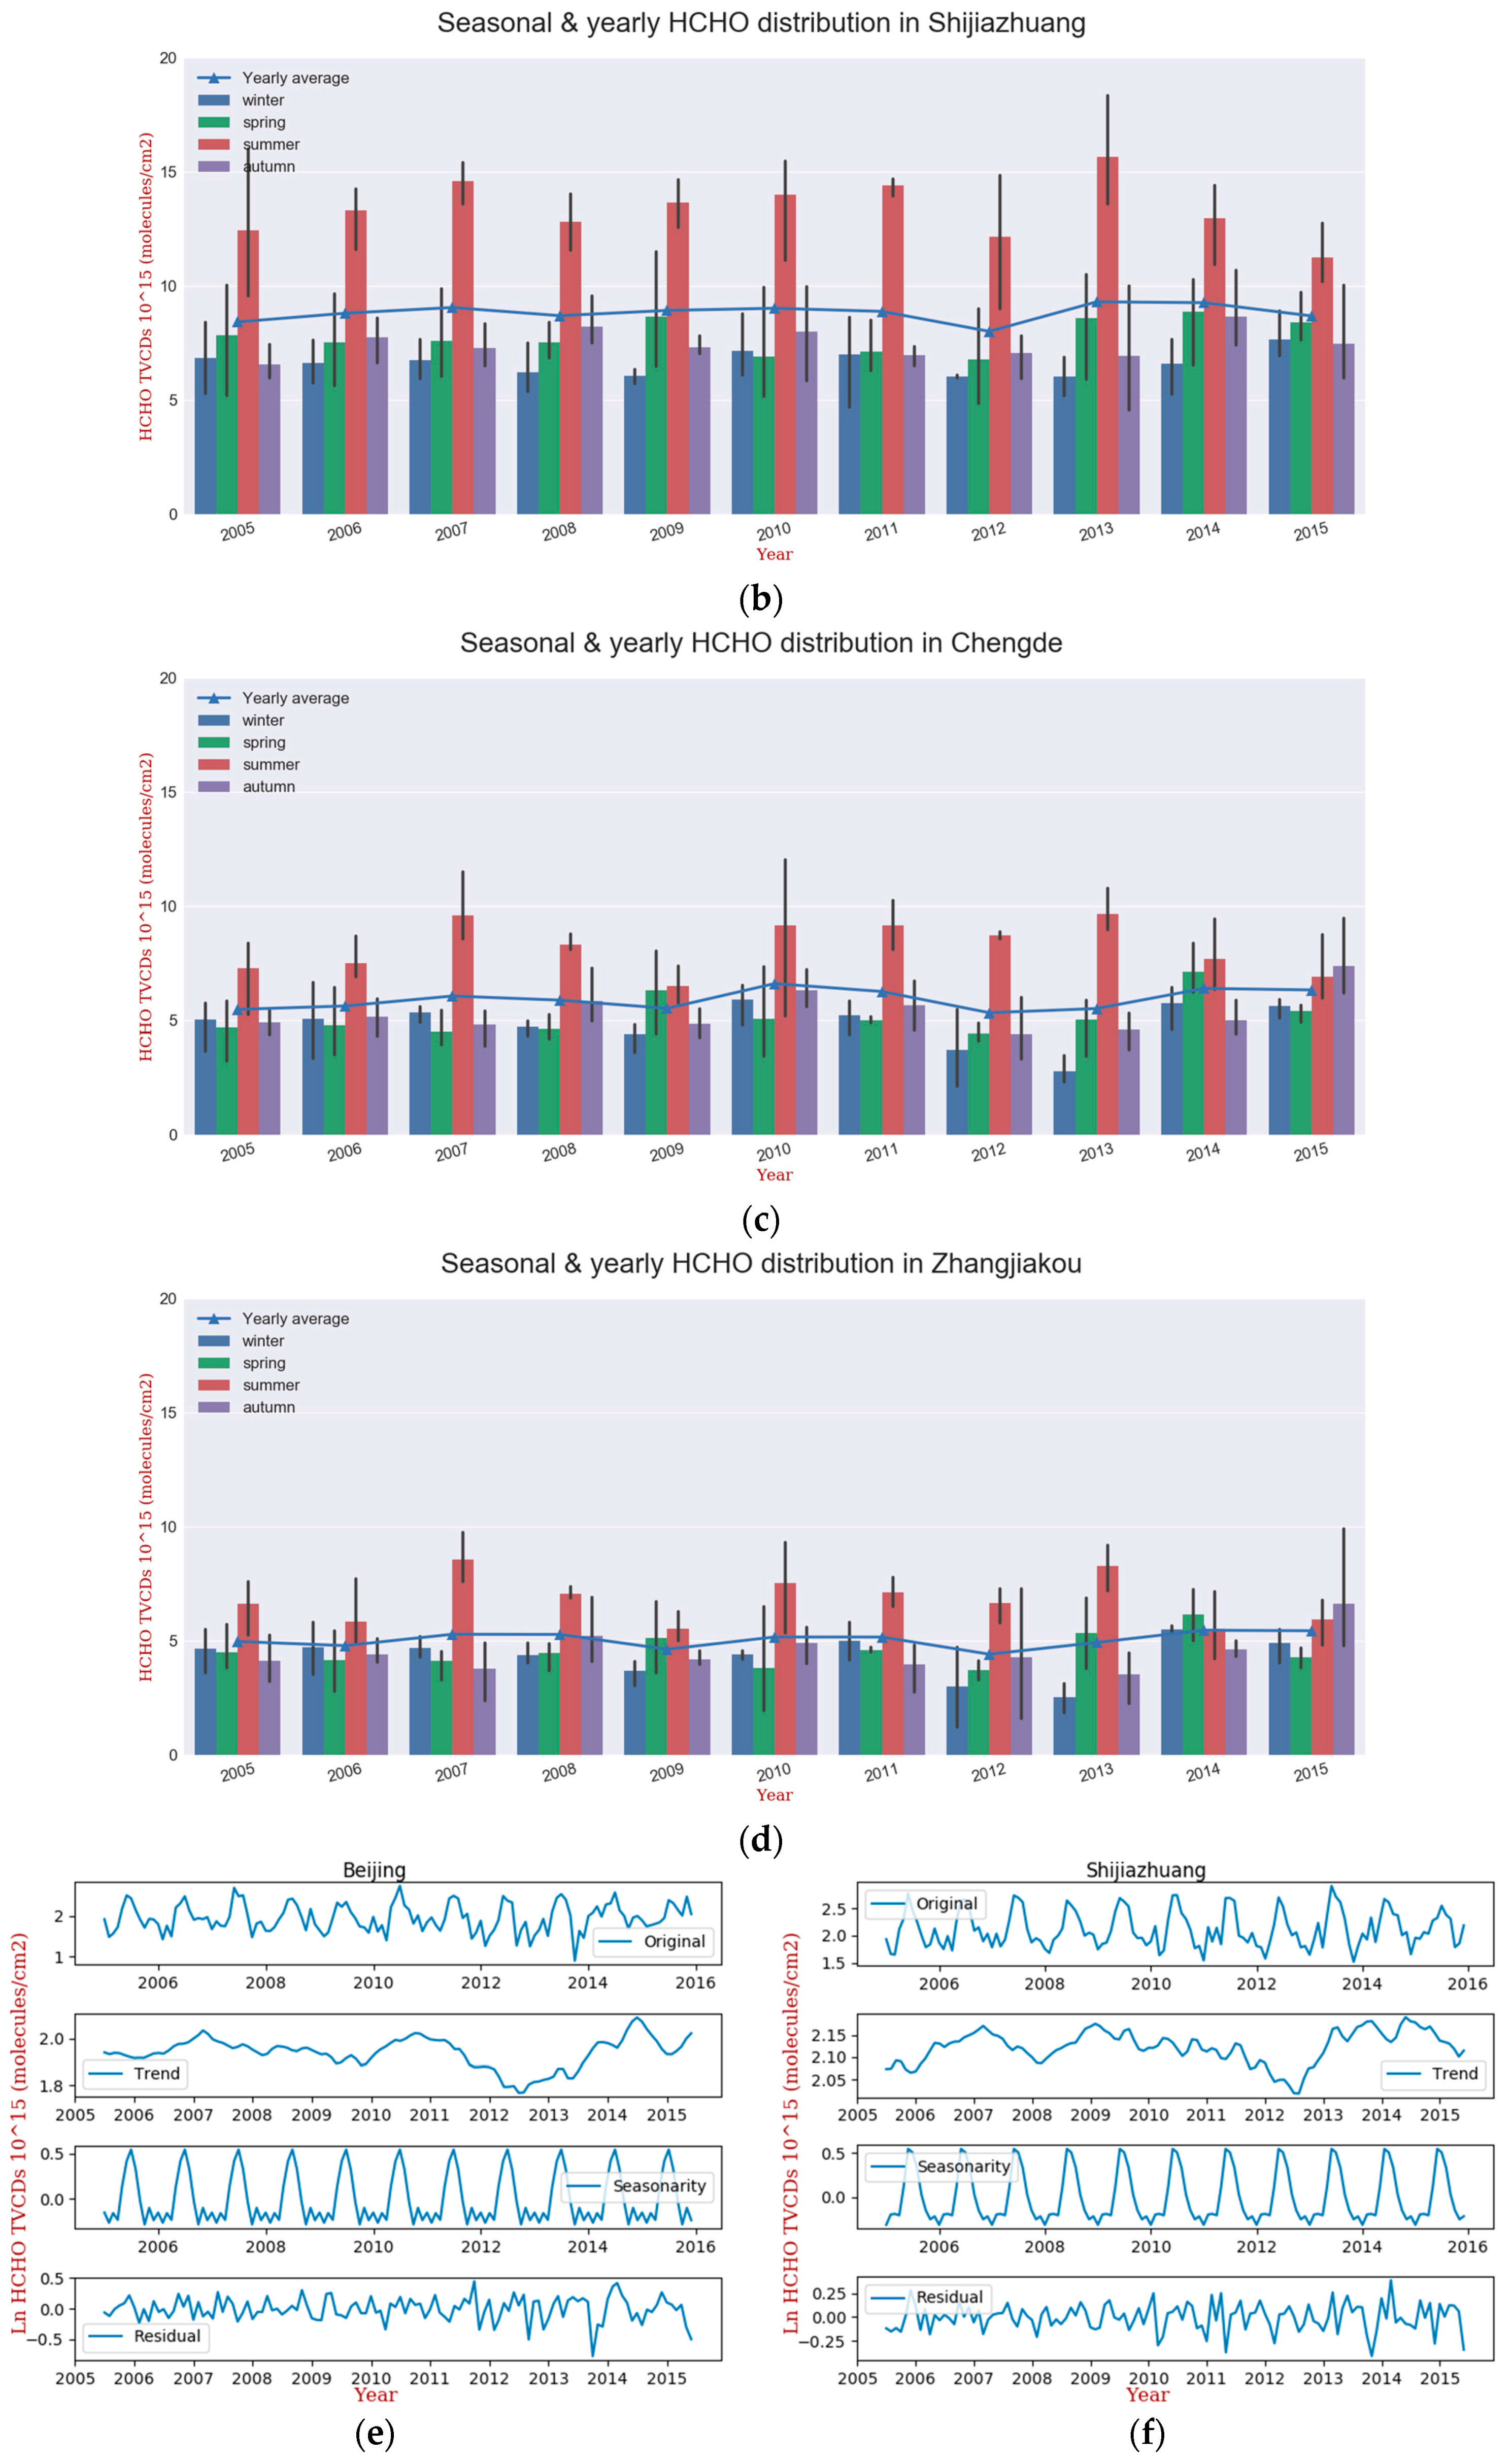
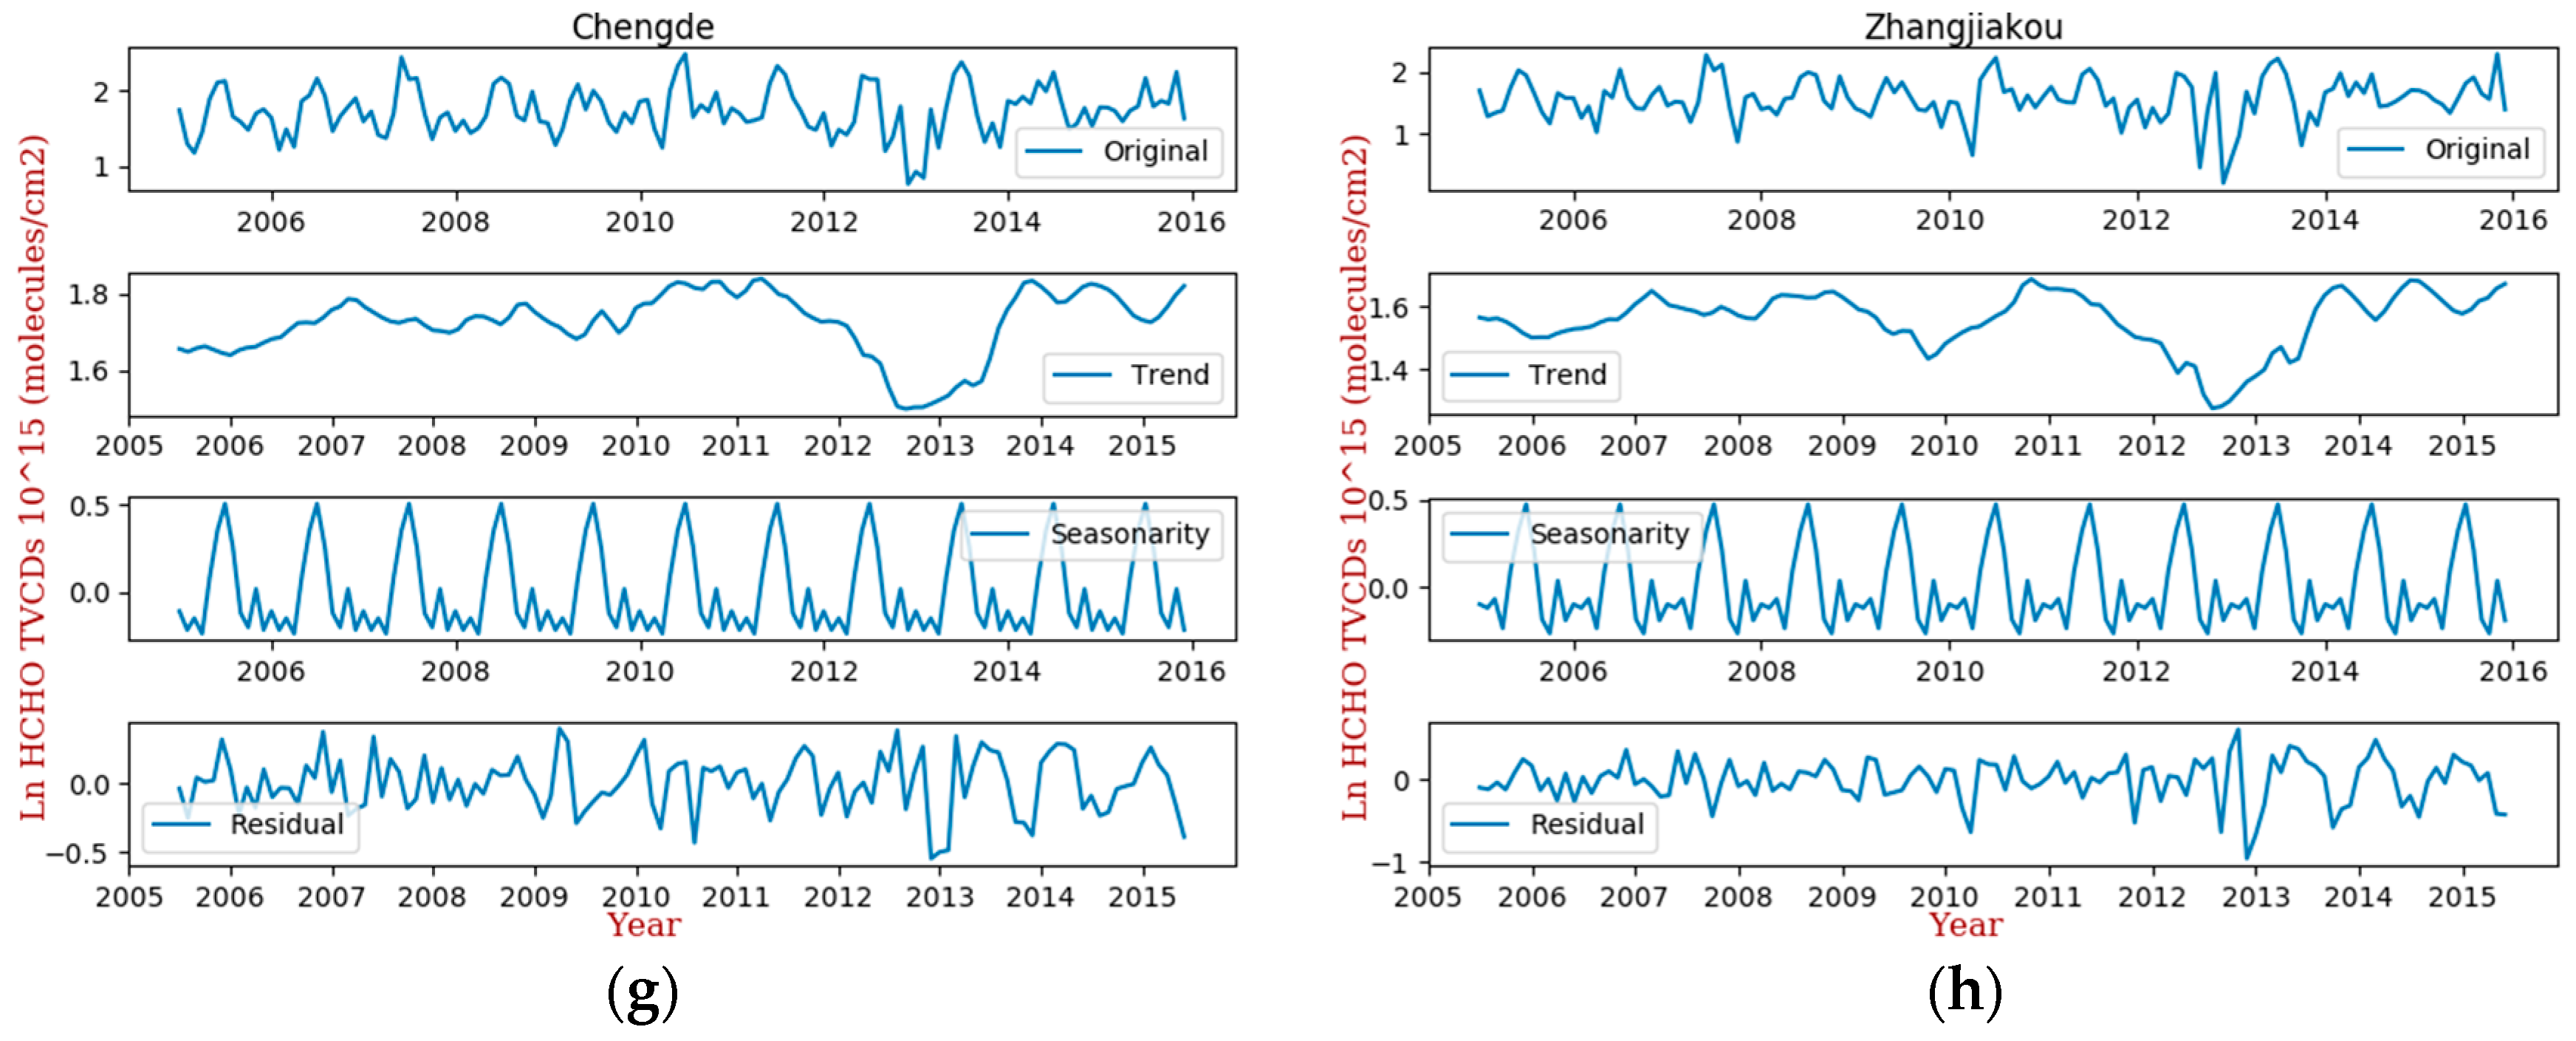
Figure 4, the prefecture-level-cities of Zhangjiakou, Chengde, Beijing and Shijiazhuang are the most representative of the characteristics in western, northern, central and southern Beijing-Tianjin-Hebei, respectively. Each upper sub-plot of
Figure 4 depicts the yearly and seasonal averages of the HCHO VCD throughout the whole administrative region. Most of the cases have the highest HCHO concentration during the summer, and the differences in the VCDs between the summer and the other seasons decreased rapidly following 2013 since when stricter policies enacted.
Additionally, the more industrialized cities show higher summertime columns, but a regional disparity was observed as well. The eleven-year averages over the whole prefecture-level-cities of Beijing and Shijiazhuang are 7.4 × 10¹⁵ molecules/cm2 and 8.8 × 10¹⁵ molecules/cm2, respectively. In contrast, the annual VCD averages in Chengde and Zhangjiakou are lower, i.e., approximately 5.9 × 10¹⁵ molecules/cm2 and 5.1 × 10¹⁵ molecules/cm2, respectively. The annually averaged VCD is relatively higher in urbanized areas, which are possibly characterized by more intense human activity. For example, the eleven-year averages in urban areas of Chengde and Zhangjiakou are 6.5 × 10¹⁵ molecules/cm2 and 5.0 × 10¹⁵ molecules/cm2, respectively.
The moving average technique and time series decomposition are beneficial for differentiating trends and extracting cyclical patterns [
33,
37,
38]. The lower sub-plots demonstrate the results of time series decomposition (i.e., the trend component, seasonal component and the residual component). The
p-values of the first-order-difference series are 3.90 × 10
−15, 1.43 × 10
−13, 9.68 × 10
−19 and 6.85 × 10
−12 in Beijing, Shijiazhuang, Chengde and Zhangjiakou, respectively. The first-order-difference series was calculated based on the logarithms to original series, and the small
p-values indicate that the results of decomposition are reliable. Except for the similar seasonal patterns, the trend components might reveal valuable details. As suggested, annual HCHO columns decreased since 2010 and significant upwards were found after 2012. Compared with corresponding summertime downward trends since 2013, the contributions from the other three seasons might have increased. Thus, inventories discussed in the next section are entirely possible to provide meaningful information.
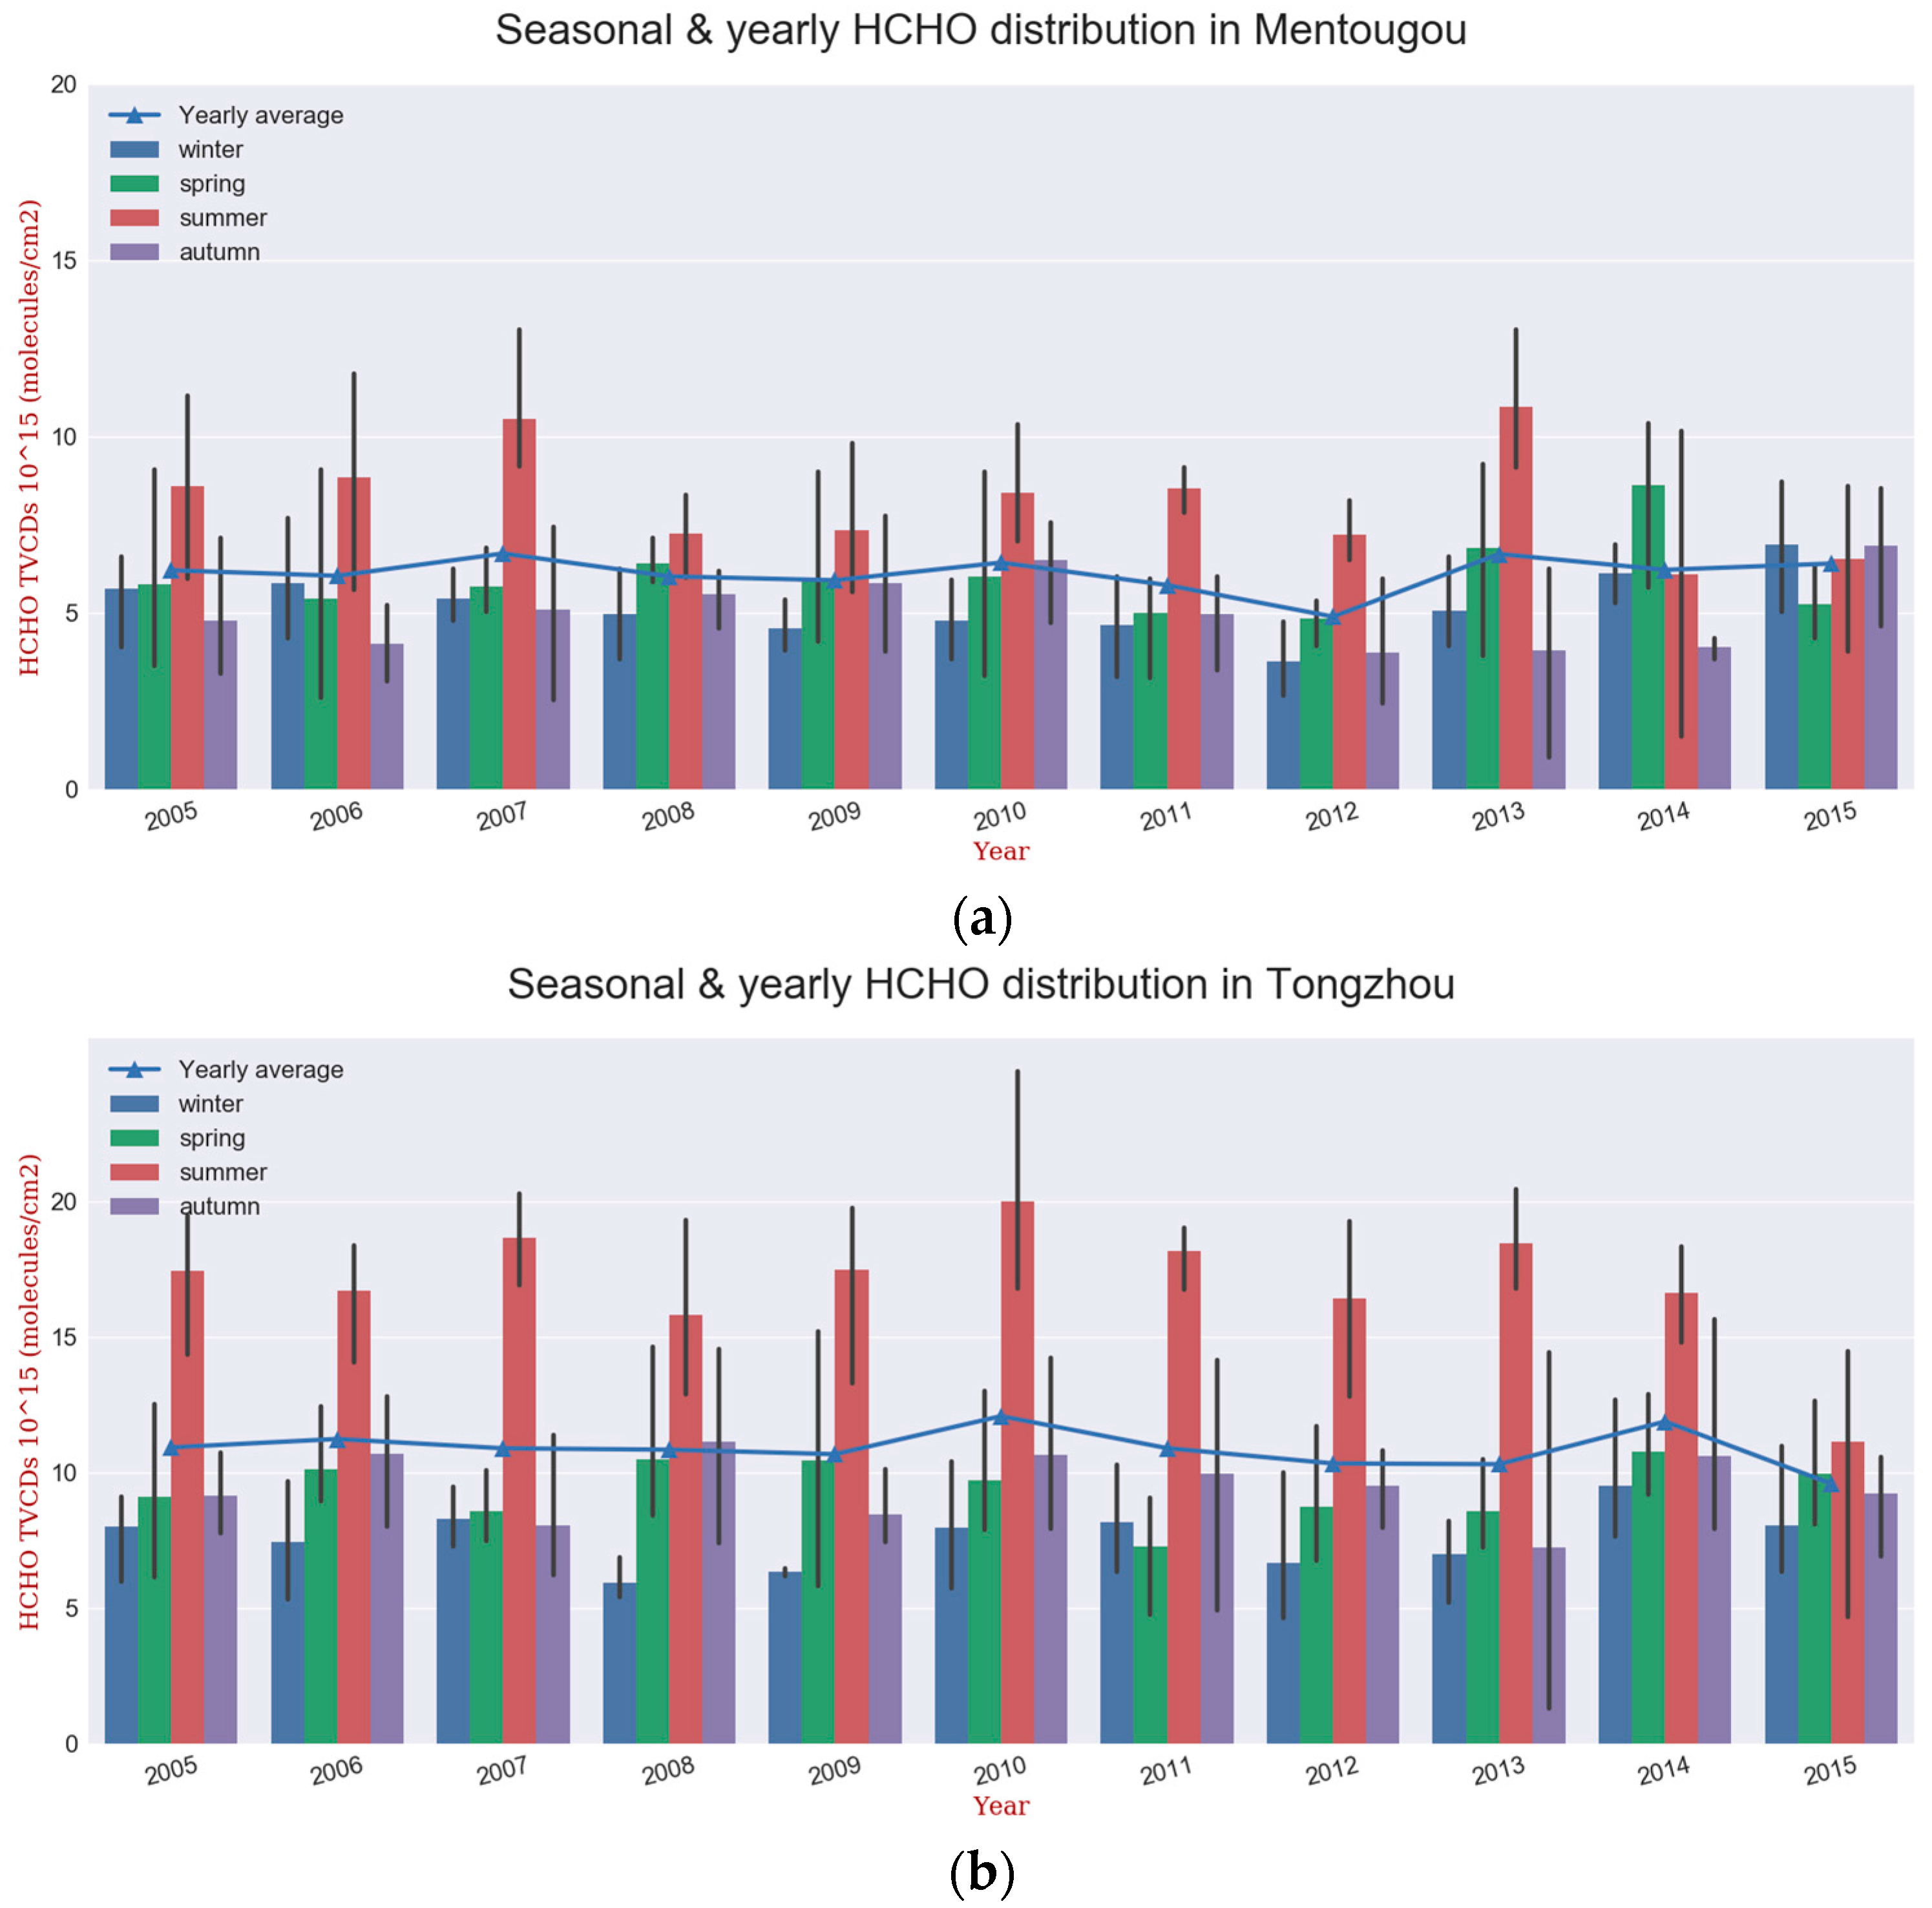
Given this regional disparity, it is likely that some information might not be revealed from average values at the prefecture-level-city scale.
Figure 5 shows the HCHO VCDs from 2005 to 2015 for two districts of Beijing. Beijing is well known as a megacity, and the levels of development among the different districts are unbalanced. Tongzhou District, an industrialized district in eastern Beijing, is more developed than Mengtougou District, which is a more rural district of western Beijing. Tongzhou clearly demonstrates a higher annually averaged HCHO VCD than Mengtougou (10.9 × 10
15 molecules/cm
2 and 6.1 × 10
15 molecules/cm
2, respectively), and the differences in the HCHO VCD during the summertime compared with those during the other seasons are larger in Tongzhou than in Mentougou. The HCHO VCDs over Tongzhou increased discontinuously from 2005 to 2010 at 1.30 × 10
13 molecules/cm
2·month
−1, after which they decreased discontinuously from 2010 to 2015 at −4.41 × 10
12 molecules/cm
2·month
−1. In contrast, the HCHO VCDs in Mentougou did not change distinctly from 2005 to 2010 (i.e., the rate is 5.08 × 10
11 molecules/cm
2·month
−1 and it could all be noise) and increased from 2010 to 2015 at 6.00 × 10
12 molecules/cm
2·month
−1. This result is likely because of a greater degree of development in the western areas that lagged behind those of the eastern areas.
Errors in OMI HCHO columns are mainly caused by the row anomalies (i.e., errors caused by blockage effects, wavelength shifts, and stray light) and other instrumental degradation problems. From 2007 onwards, certain rows of OMI’s CCD detector were unavailable [
39,
40]. Due to the uncertainties in the sensor, inverse algorithm and in the gridding method, although systematic errors have been largely reduced, the impacts from these errors might still exist in results exhibited before. As reported in a previous study, meta data (i.e., XTrackQualityFlags) and a 0.15° × 0.15° Gaussian smooth filter of 1σ width were adopted and the median uncertainties of the HCHO gridded columns were reduced into 6% [
40]. Additionally, spatial average and moving average methods were employed as discussed before to reduce systematic errors. Even so, it is undeniable that the potential instrumental errors might still impose an impact on the HCHO columns, and further deeper work will be conducted in the future.
3.2. Analyses of Potential Factors for the HCHO Summertime Concentrations
In the continental boundary layer, HCHO as a high yield intermediate reaction product of the VOC oxidation and the smallest and most abundant aldehyde of oxygenated VOCs, is mainly generated from the oxidation of short-lived biogenic and anthropogenic NMVOCs [
41]. In this section, we will discuss biogenic and anthropogenic sources of HCHO, and whether direct HCHO emissions constitute a substantial contribution to pollution will be determined.
Figure 6 shows the Moran’s I values for the tropospheric HCHO columns in the summer of 2010. Moran’s I is a measure of the spatial autocorrelation of data employed for geographical information science purposes, and it is characterized by the correlation of a pixel with its surrounding pixels [
42,
43]. The values of Moran’s I, which indicates the spatial autocorrelation of singular variables, reveal that the HCHO distribution is less correlated.
Table 1 provides the Moran’s I for urban areas of the whole Beijing-Tianjin-Hebei region. The average Moran’s I of Beijing-Tianjin-Hebei throughout eleven years is 0.04. In each year, the Moran’s I value of almost every urban area throughout Beijing-Tianjin-Hebei was less than 0.3 (e.g., the highest was 0.28 in 2014, Zhangjiakou), which essentially represents the lack of correlation and suggests the absence of cluster centers. The short lifetime and low Moran’s I values of HCHO strongly imply that high HCHO VCDs might not originate from direct primary sources of emission because short-lived gases from direct emissions (e.g., anthropogenic NO
2) would concentrate around their emission sources. Therefore, these results suggest that the summertime HCHO VCDs might be generated from secondary sources (i.e., VOC photolysis).
Isoprene is found to be responsible for about 30% of the HCHO formed on the global scale [
44]. As discussed in
Section 3.1, the summertime concentration of HCHO demonstrated an obvious seasonal pattern that corresponded to periods of enhanced vegetation activity. This pattern repeated itself among all the years from 2005 to 2015. For example, the HCHO distribution in Beijing was observed to have a higher VCD in the summertime than during the winter, and photochemical reactions during the summer are the major source of HCHO emissions [
18]. Isoprene emissions from deciduous trees in Beijing were also observed to be a substantial source of HCHO [
45]. In addition, the areas with high HCHO VCDs to the south and east are croplands except for some smaller areas of residential buildings. Biogenic emissions are more active than those of anthropogenic VOCs, and the large quantities of emissions in the southern sector are highly influential and consequently affected the results of the long-term series [
46,
47]. Duncan et al. noted that BVOC emissions are exponentially correlated with the temperature and that BVOC emissions peak over the North China Plain in August [
48,
49]. Furthermore,
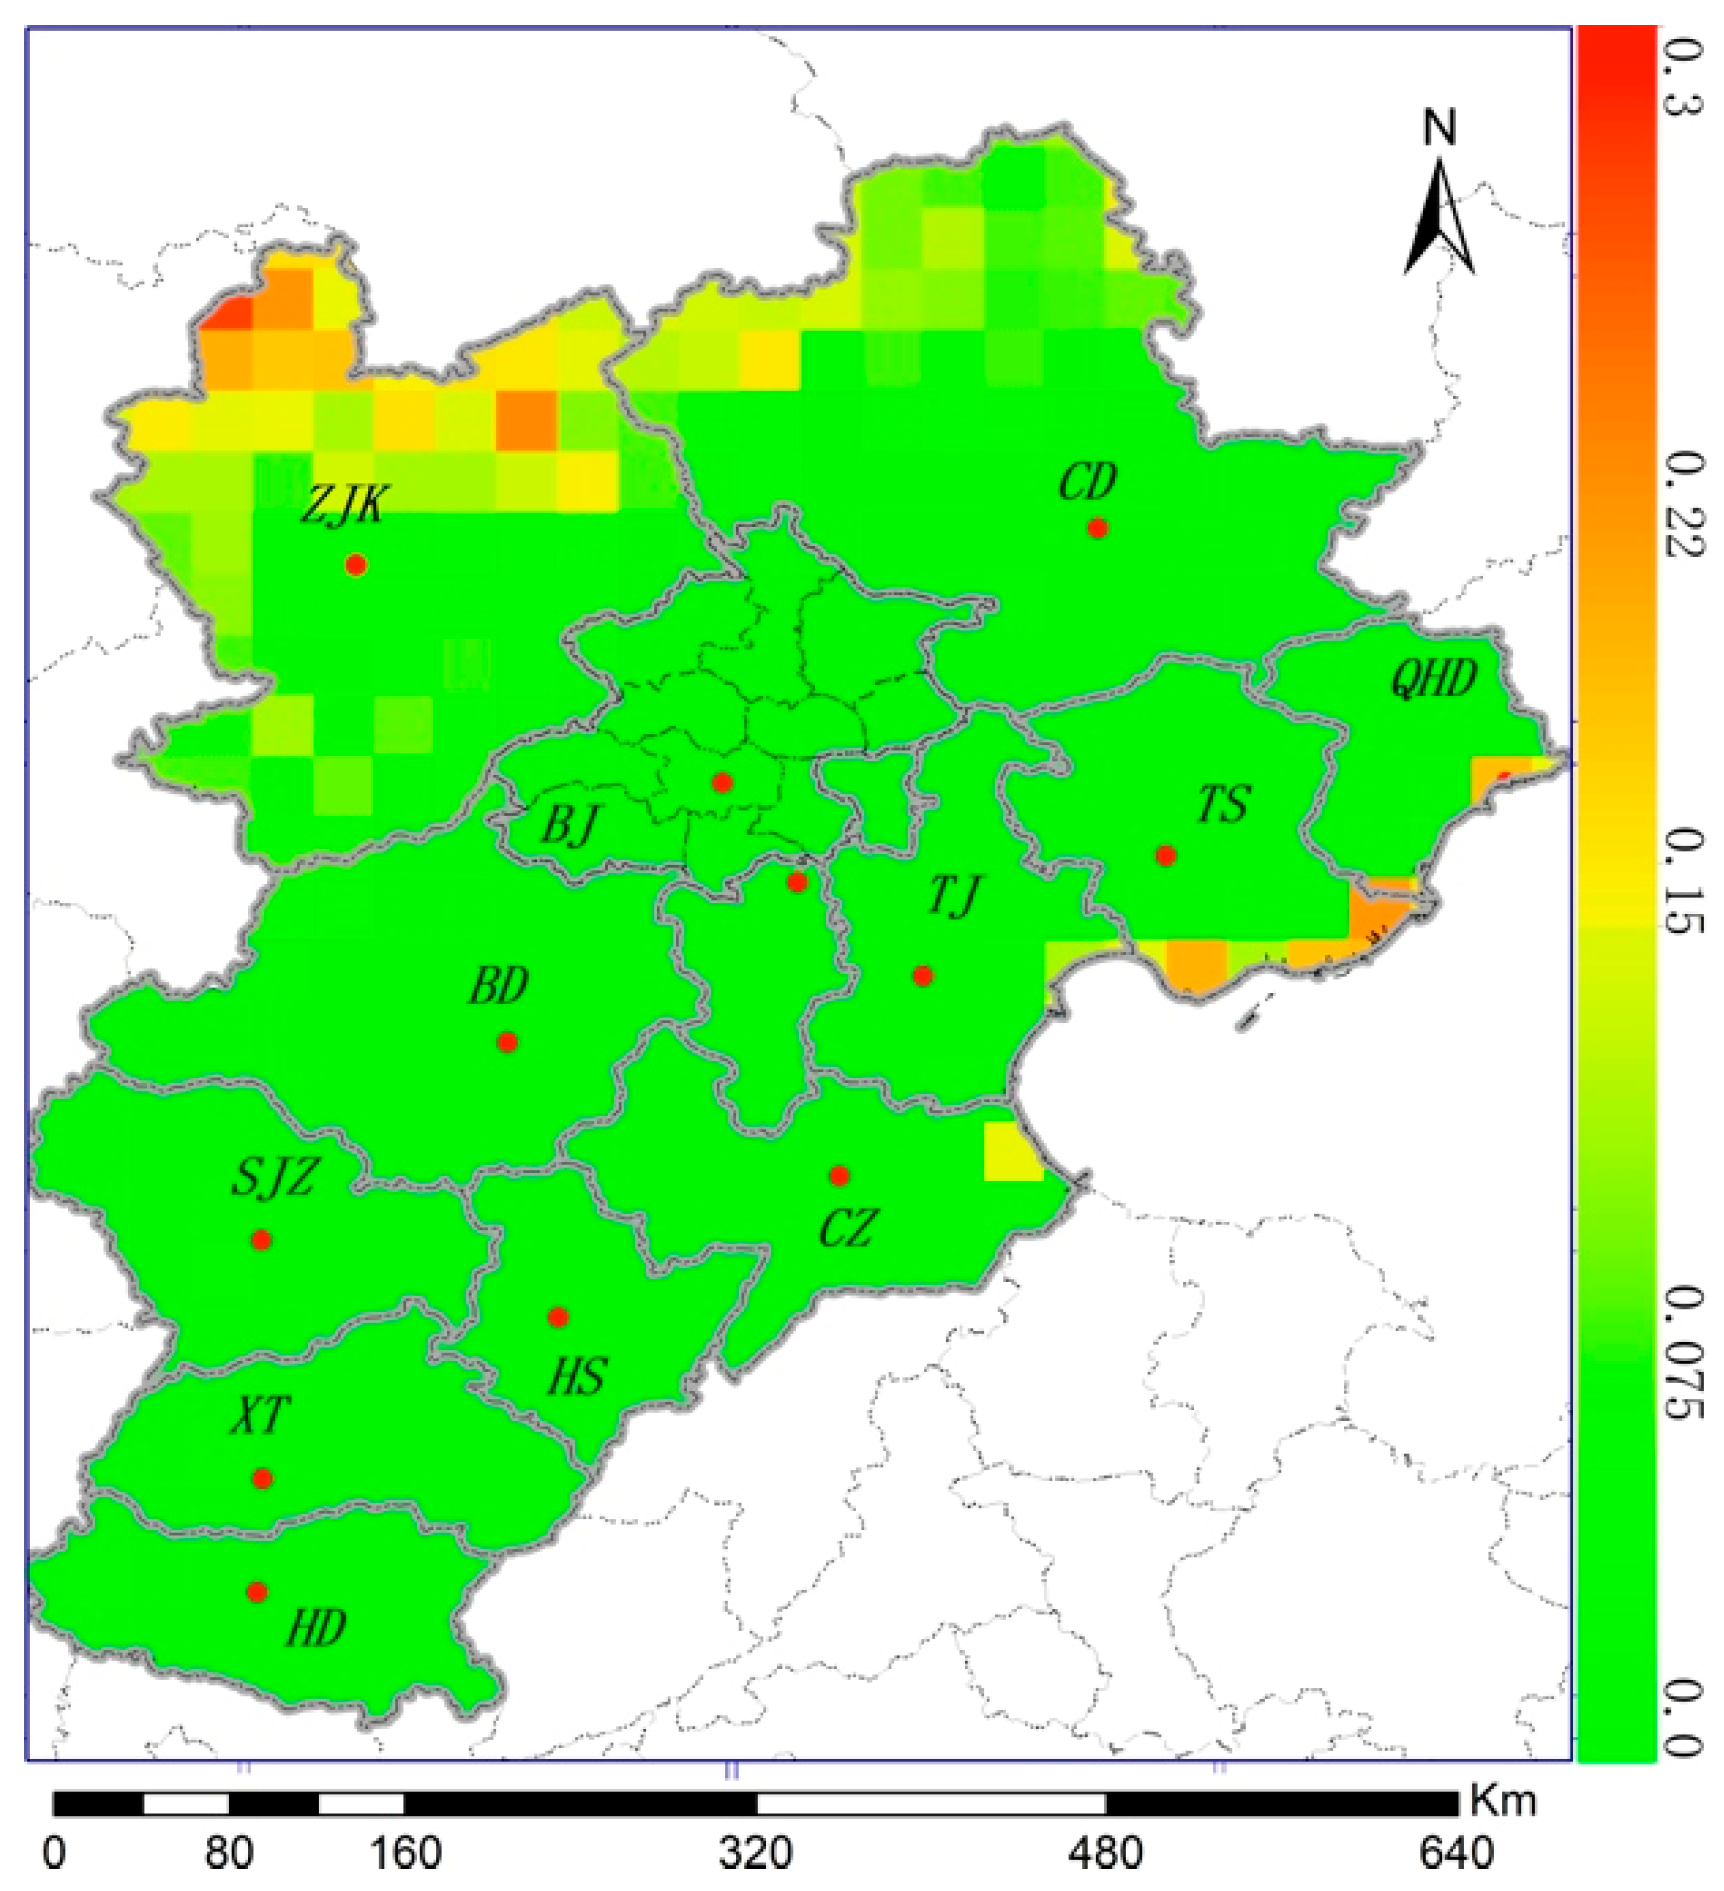
Figure 7 shows the PCCs of both normalized HCHO VCDs and the NDVI for eleven years throughout Beijing-Tianjin-Hebei. The PPCs are higher in the southern and eastern sectors of Beijing-Tianjin-Hebei, which demonstrates higher HCHO VCDs.
Table 2 and
Table 3 provide the PCCs for three sample pixels in the southern and eastern areas and average PCCs for prefecture-level-cities and corresponding urban areas, respectively. The PCCs in southern and eastern sectors are higher than 0.6, especially in the northern parts (e.g., Beijing, Tianjin and Tangshan). In contrast, the PCCs are comparatively lower in northwestern Beijing-Tianjin-Hebei. Generally, PCCs in urban areas are higher than in the whole prefecture-level-cities. Combined with
Figure 3d, it appears that the prefecture-level-cities with higher HCHO VCDs have higher PCCs, which might imply that vegetation could represent a substantial contributor.
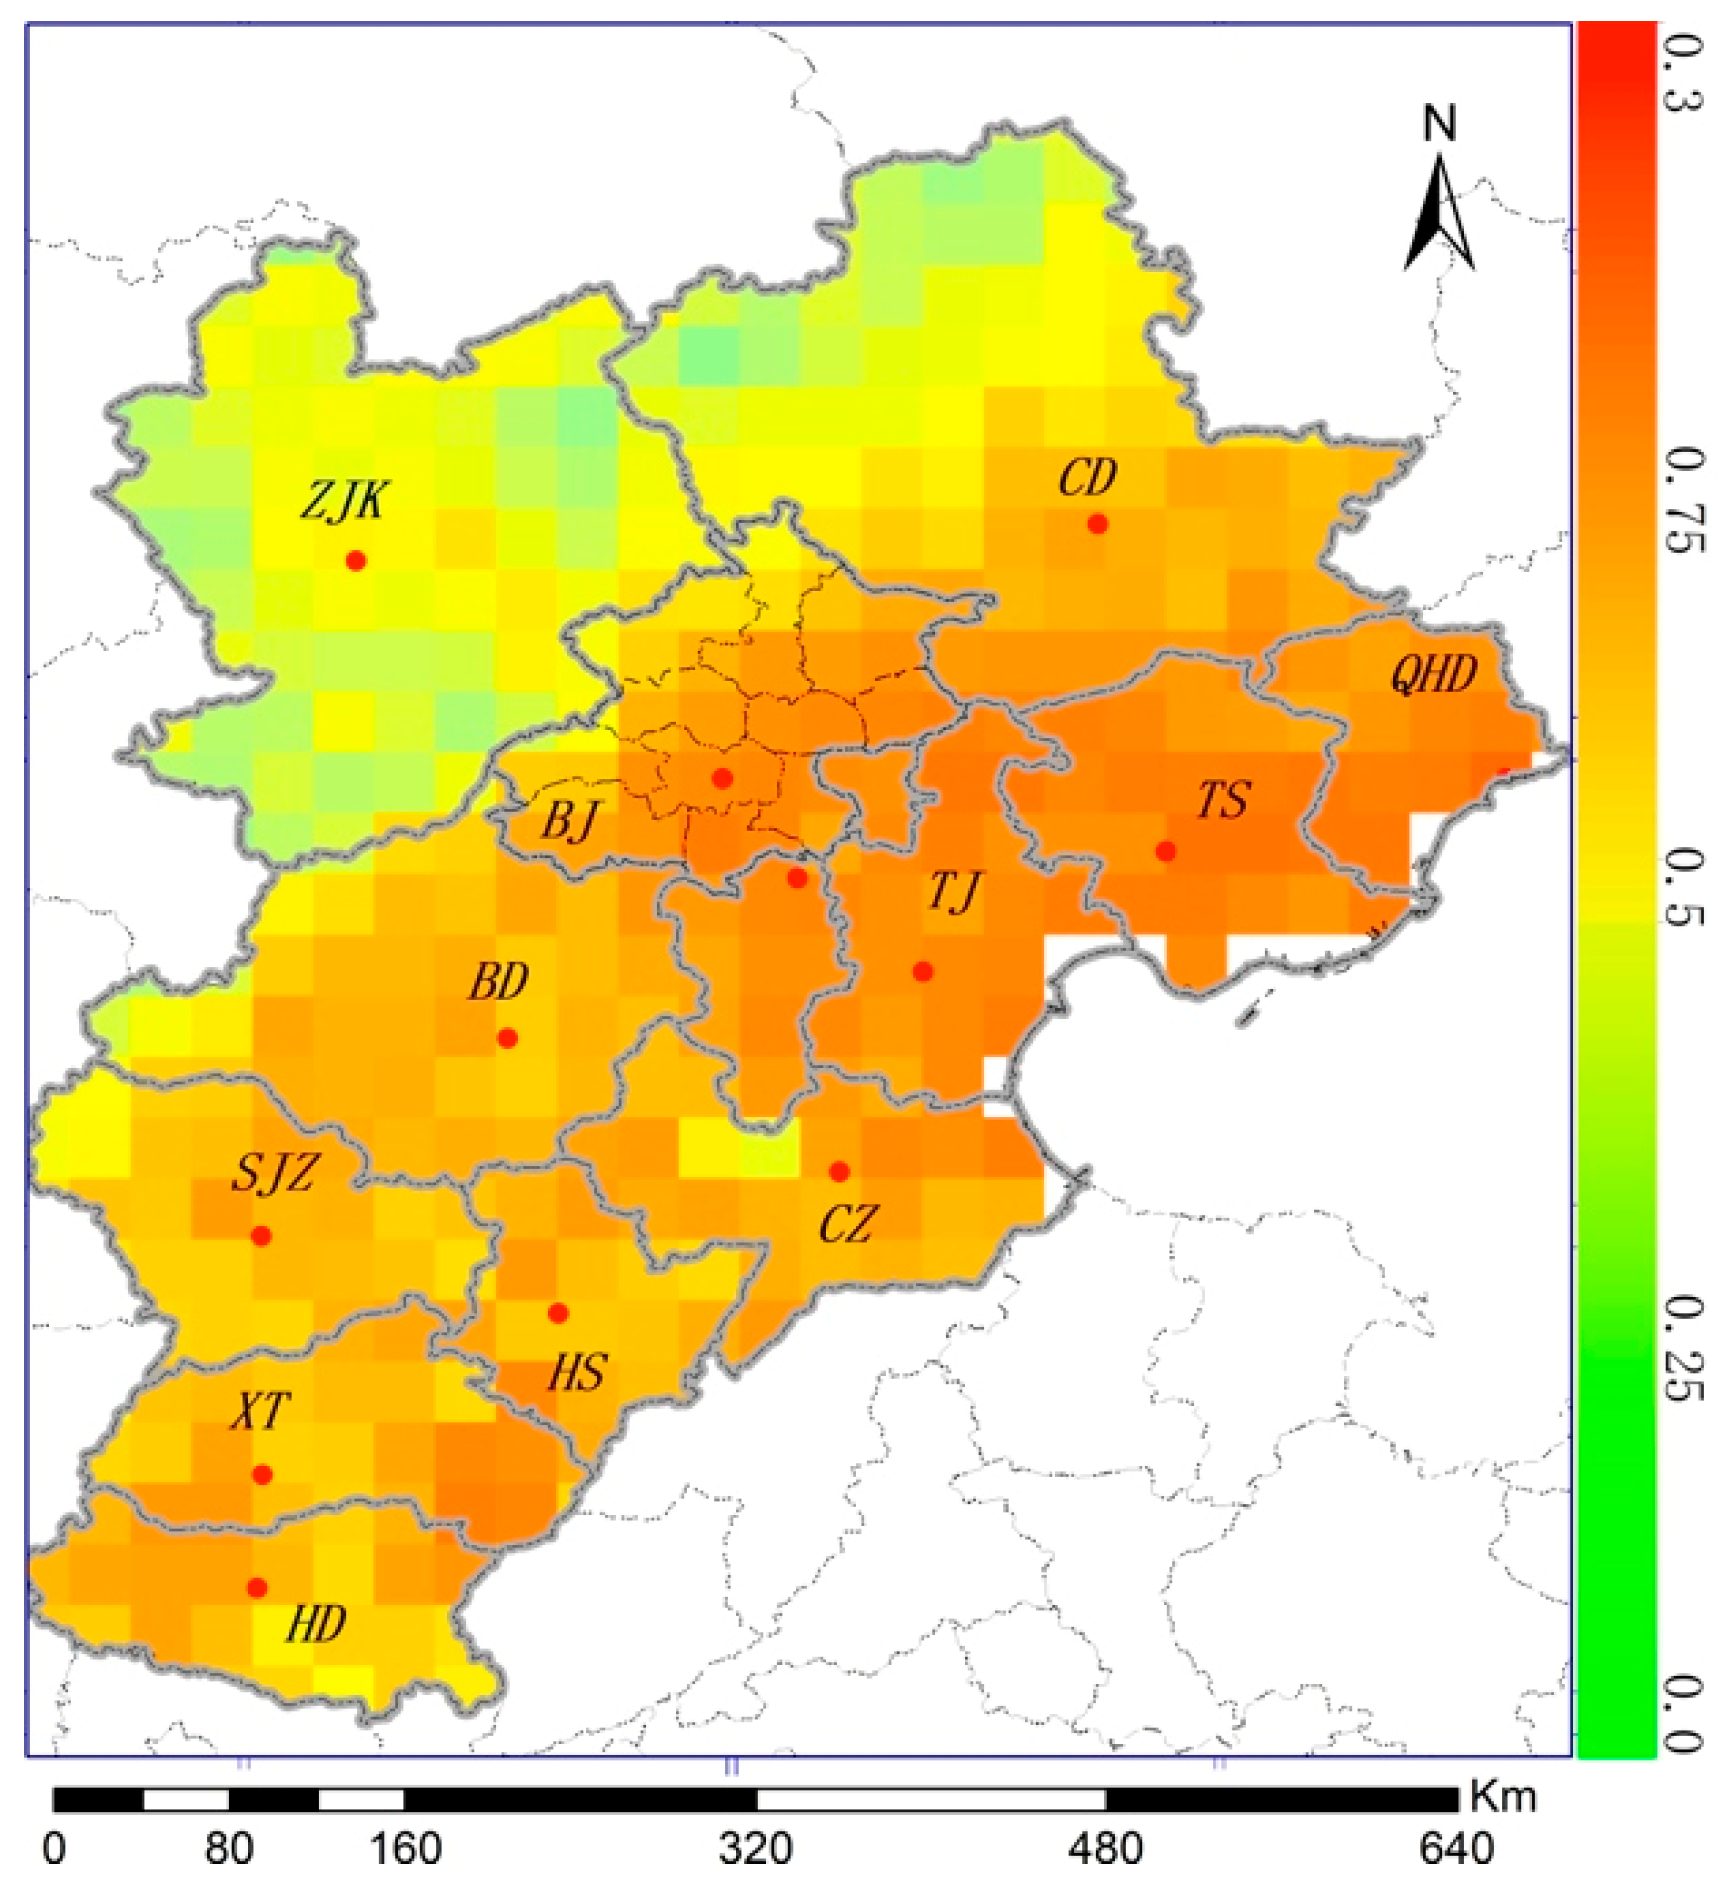
Although the correlation between HCHO and vegetation (i.e., the NDVI) is relatively high, the factors of summertime HCHO concentrations are more complicated than expected. The PCCs are higher in urban areas, and relatively higher VCDs are mainly distributed throughout the southeastern sectors that are more industrialized and have a larger population. In addition, the spatial PCC between HCHO VCDs and NDVI in summertime is 0.012 with 2-tailed p-value as 0.87, and this suggests the spatial correlation between HCHO VCDs and vegetation activities is not as good as assumed. The p-value is widely used to quantify the statistical significance. If the p-value is smaller than 0.05 then it is significant and the correlation is obvious. It is noteworthy that to decrease the uncertainty, the calculation of spatial PCCs was conducted among the county-level averaged values rather than singular pixels. These observations might suggest anthropogenic sources as a substantial contributor.
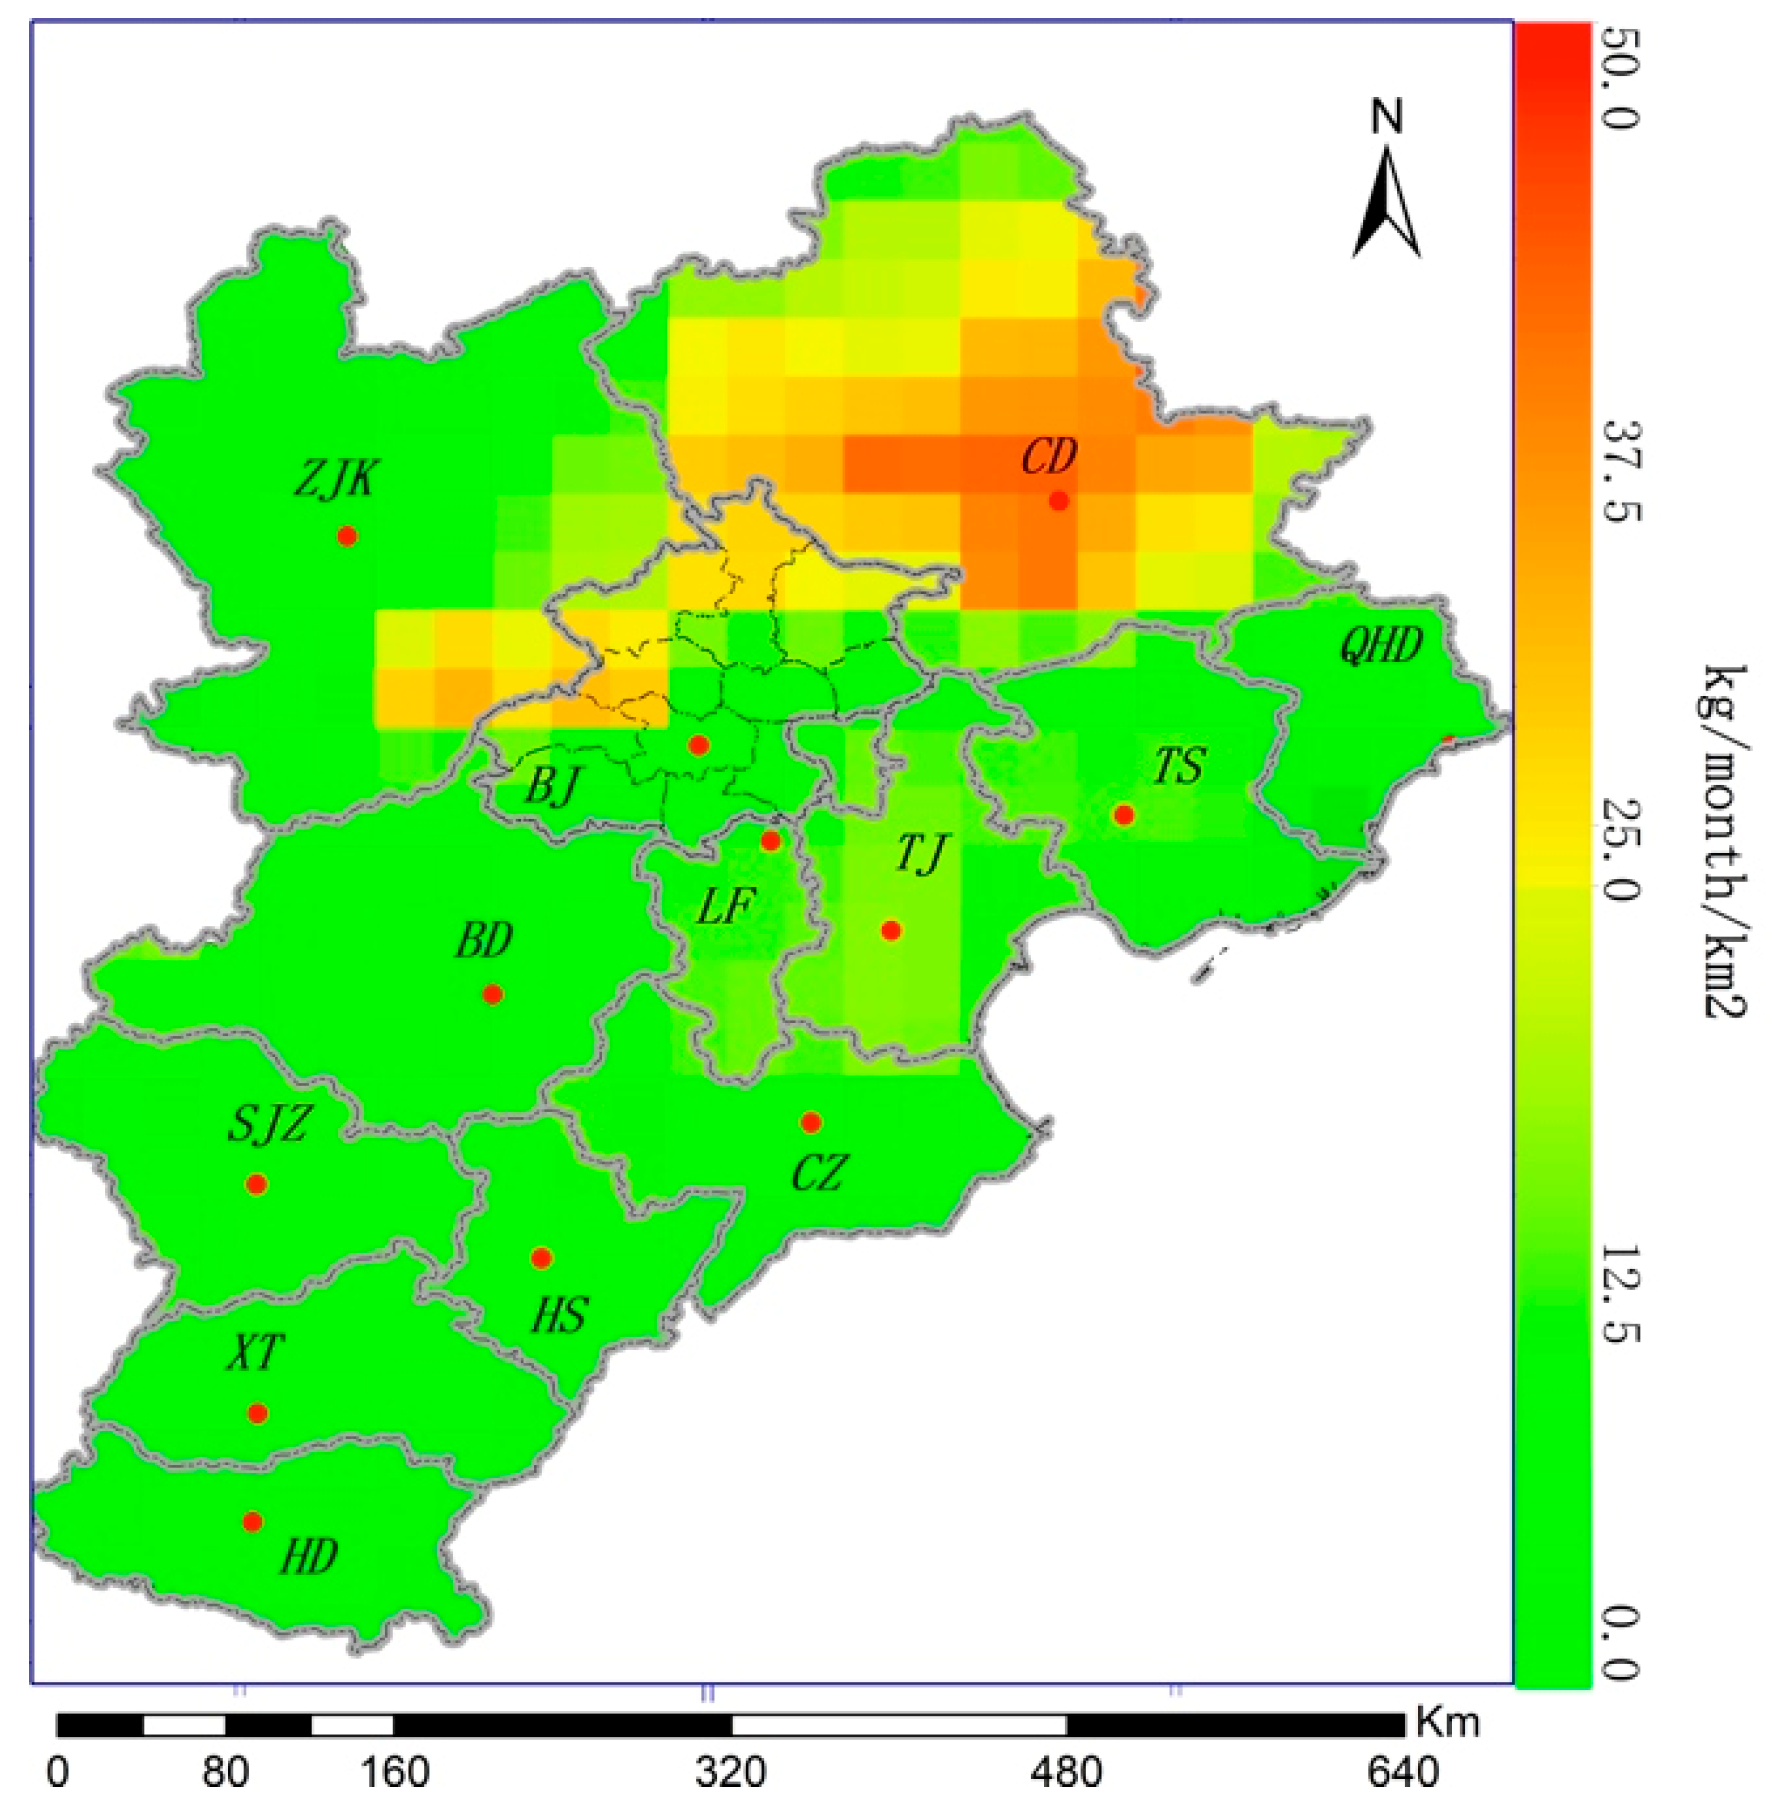
Figure 8 shows the distribution of isoprene emissions in 2010 that was derived from the MEGAN model. The distribution patterns of isoprene (i.e., the precursor of secondary biogenic HCHO) were found to be opposite to the satellite-based HCHO distribution. Biogenic HCHO emissions in the northern areas of Beijing-Tianjin-Hebei (e.g., about 19.42 kg/month/km
2 in Chengde) are higher than in the southern and eastern area (the average is 7.92 kg/month/km
2), and the spatial PCC between HCHO VCDs and isoprene emissions is −0.21 with a 2-tailed
p-value of 0.006. Additionally, isoprene is primarily generated from deciduous trees, which are common throughout northern Beijing-Tianjin-Hebei; however, the land-use types in southeastern sectors with high HCHO VODs are mainly cropland. Over China, isoprene fluxes were found to decrease from 8.6 Tg in 2007 to 6.5 Tg in 2012, and a significant emission decline was found after 2007 (−25% in 5 years) by using formaldehyde as a proxy for VOC emissions [
44].
Although the seasonal HCHO patterns correspond with the periodic characteristics of vegetation activity, anthropogenic VOC emissions might be an influential contributor for the relatively high columns in southeastern Beijing-Tianjin-Hebei. Anthropogenic emissions are a major source of VOCs in China, and Beijing-Tianjin-Hebei is an important industrial zone in the north. Thus, the observed HCHO VCDs could have possibly originated from anthropogenic sources [
6]. Meanwhile, HCHO is mainly concentrated within the more densely populated parts of Beijing-Tianjin-Hebei, in which emissions from industries and vehicles cannot be neglected. Consequently, it is entirely possible that the high levels of HCHO in the summertime are caused by anthropogenic sources. To shed light on that, an accurate inventory is essential for air-quality simulations and policy making, but available anthropogenic inventory data are insufficient [
50]. Therefore, inventories provided by MEIC are important and valuable.
In this manuscript, yearly averaged MEIC inventories were used to evaluate anthropogenic emissions over Beijing-Tianjin-Hebei region. For each emission sector (i.e., industrial, power-based, residential and transportation), the monthly distribution range barely changed from 2008 to 2012 with 36-month averaged spatial PCCs of 0.97, 0.97, 0.94 and 0.96, respectively. The corresponding standard deviations of monthly spatial PCCs for four sectors are 0.02, 0.02, 0.03 and 0.03, respectively. In addition, all corresponding p-values of the spatial PCCs are smaller than 1 × 10−50, indicating the results are reliable. The three-year averaged change rates were used to represent temporal variations of four sectors. The change rates are 0.64, 0.03, −0.49 and −0.03 kg/month/km2 per month for industrial, power-based, residential and transportation sectors. The corresponding standard deviations are 0.33, 5.9 × 10⁻⁴, 0.20, 0.03 kg/month/km2 per month, respectively. The monthly change of each anthropogenic source is relatively small in each year and the yearly averaged emissions adopted in this study are relatively plausible.
Anthropogenic VOC emissions contribute more than 40% to the total reactive NMVOC emissions (i.e., VOCs would produce HCHO) in China, while biogenic activities and biomass burning contribute about 50% and 6%, respectively [
6].
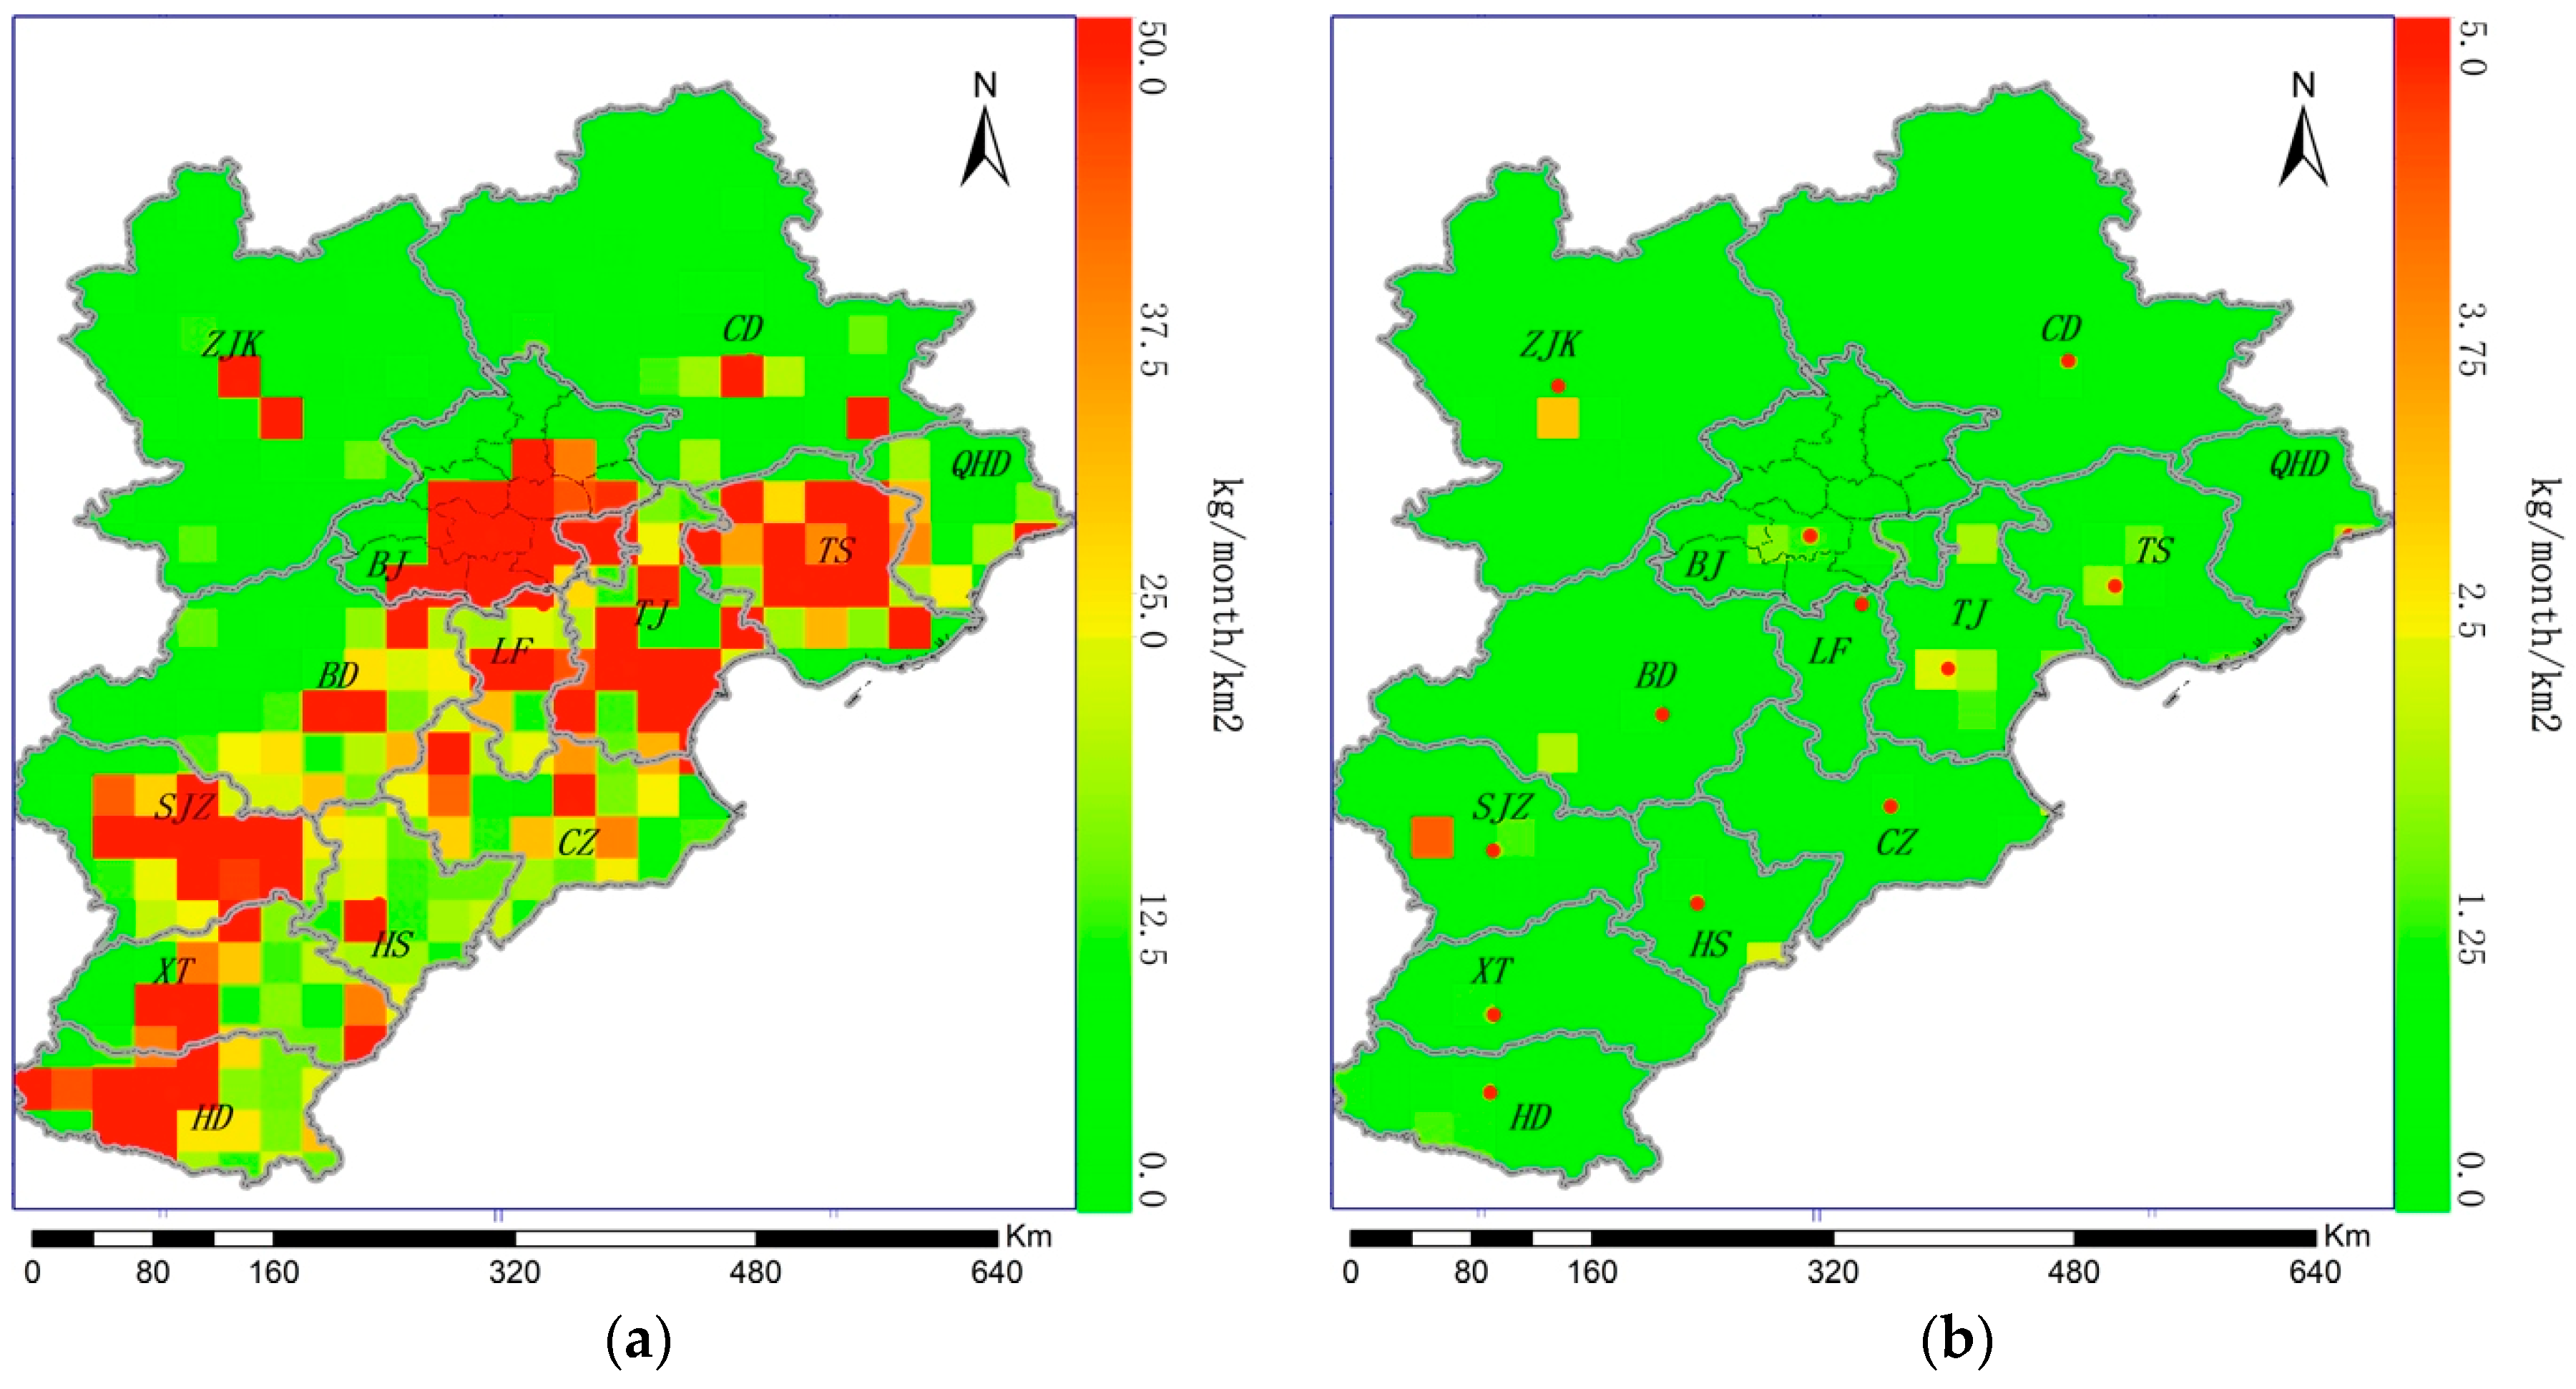
Figure 9 shows the MEIC anthropogenic VOC inventories for Beijing-Tianjin-Hebei during the summer of 2010. Compared with those of BVOCs, anthropogenic VOC emissions change little from June to August [
35]. According to the MEIC, agricultural sources did not constitute any VOC emissions in Beijing-Tianjin-Hebei.
Figure 9a displays the industrial VOC emission rates. Compared with isoprene emissions of 9.44 kg/month/km
2 with a standard deviation of 8.03 kg/month/km
2, the industrial VOC emission rates are much higher at 22.25 kg/month/km
2 but with a lager deviation at 54.22 kg/month/km
2 as well.
Table 4 provides the spatial PCCs between HCHO VCDs and anthropogenic VOC emissions and corresponding
p-values. Evidently, the distribution of industrial VOC emissions corresponds with that of HCHO columns more than isoprene with an average spatial PCC about 0.30.
Figure 9b shows the power-based VOC emission rates. Compared with the industrial sources, power-based emissions maintain lower rates of approximately 0.09 kg/month/km
2 with a standard deviation of 0.35 kg/month/km
2 and are discretely distributed throughout suburban areas. Additionally, spatial PCCs between power-based VOC emissions and HCHO VCDs are also comparatively low, and a downward trend has been observed.
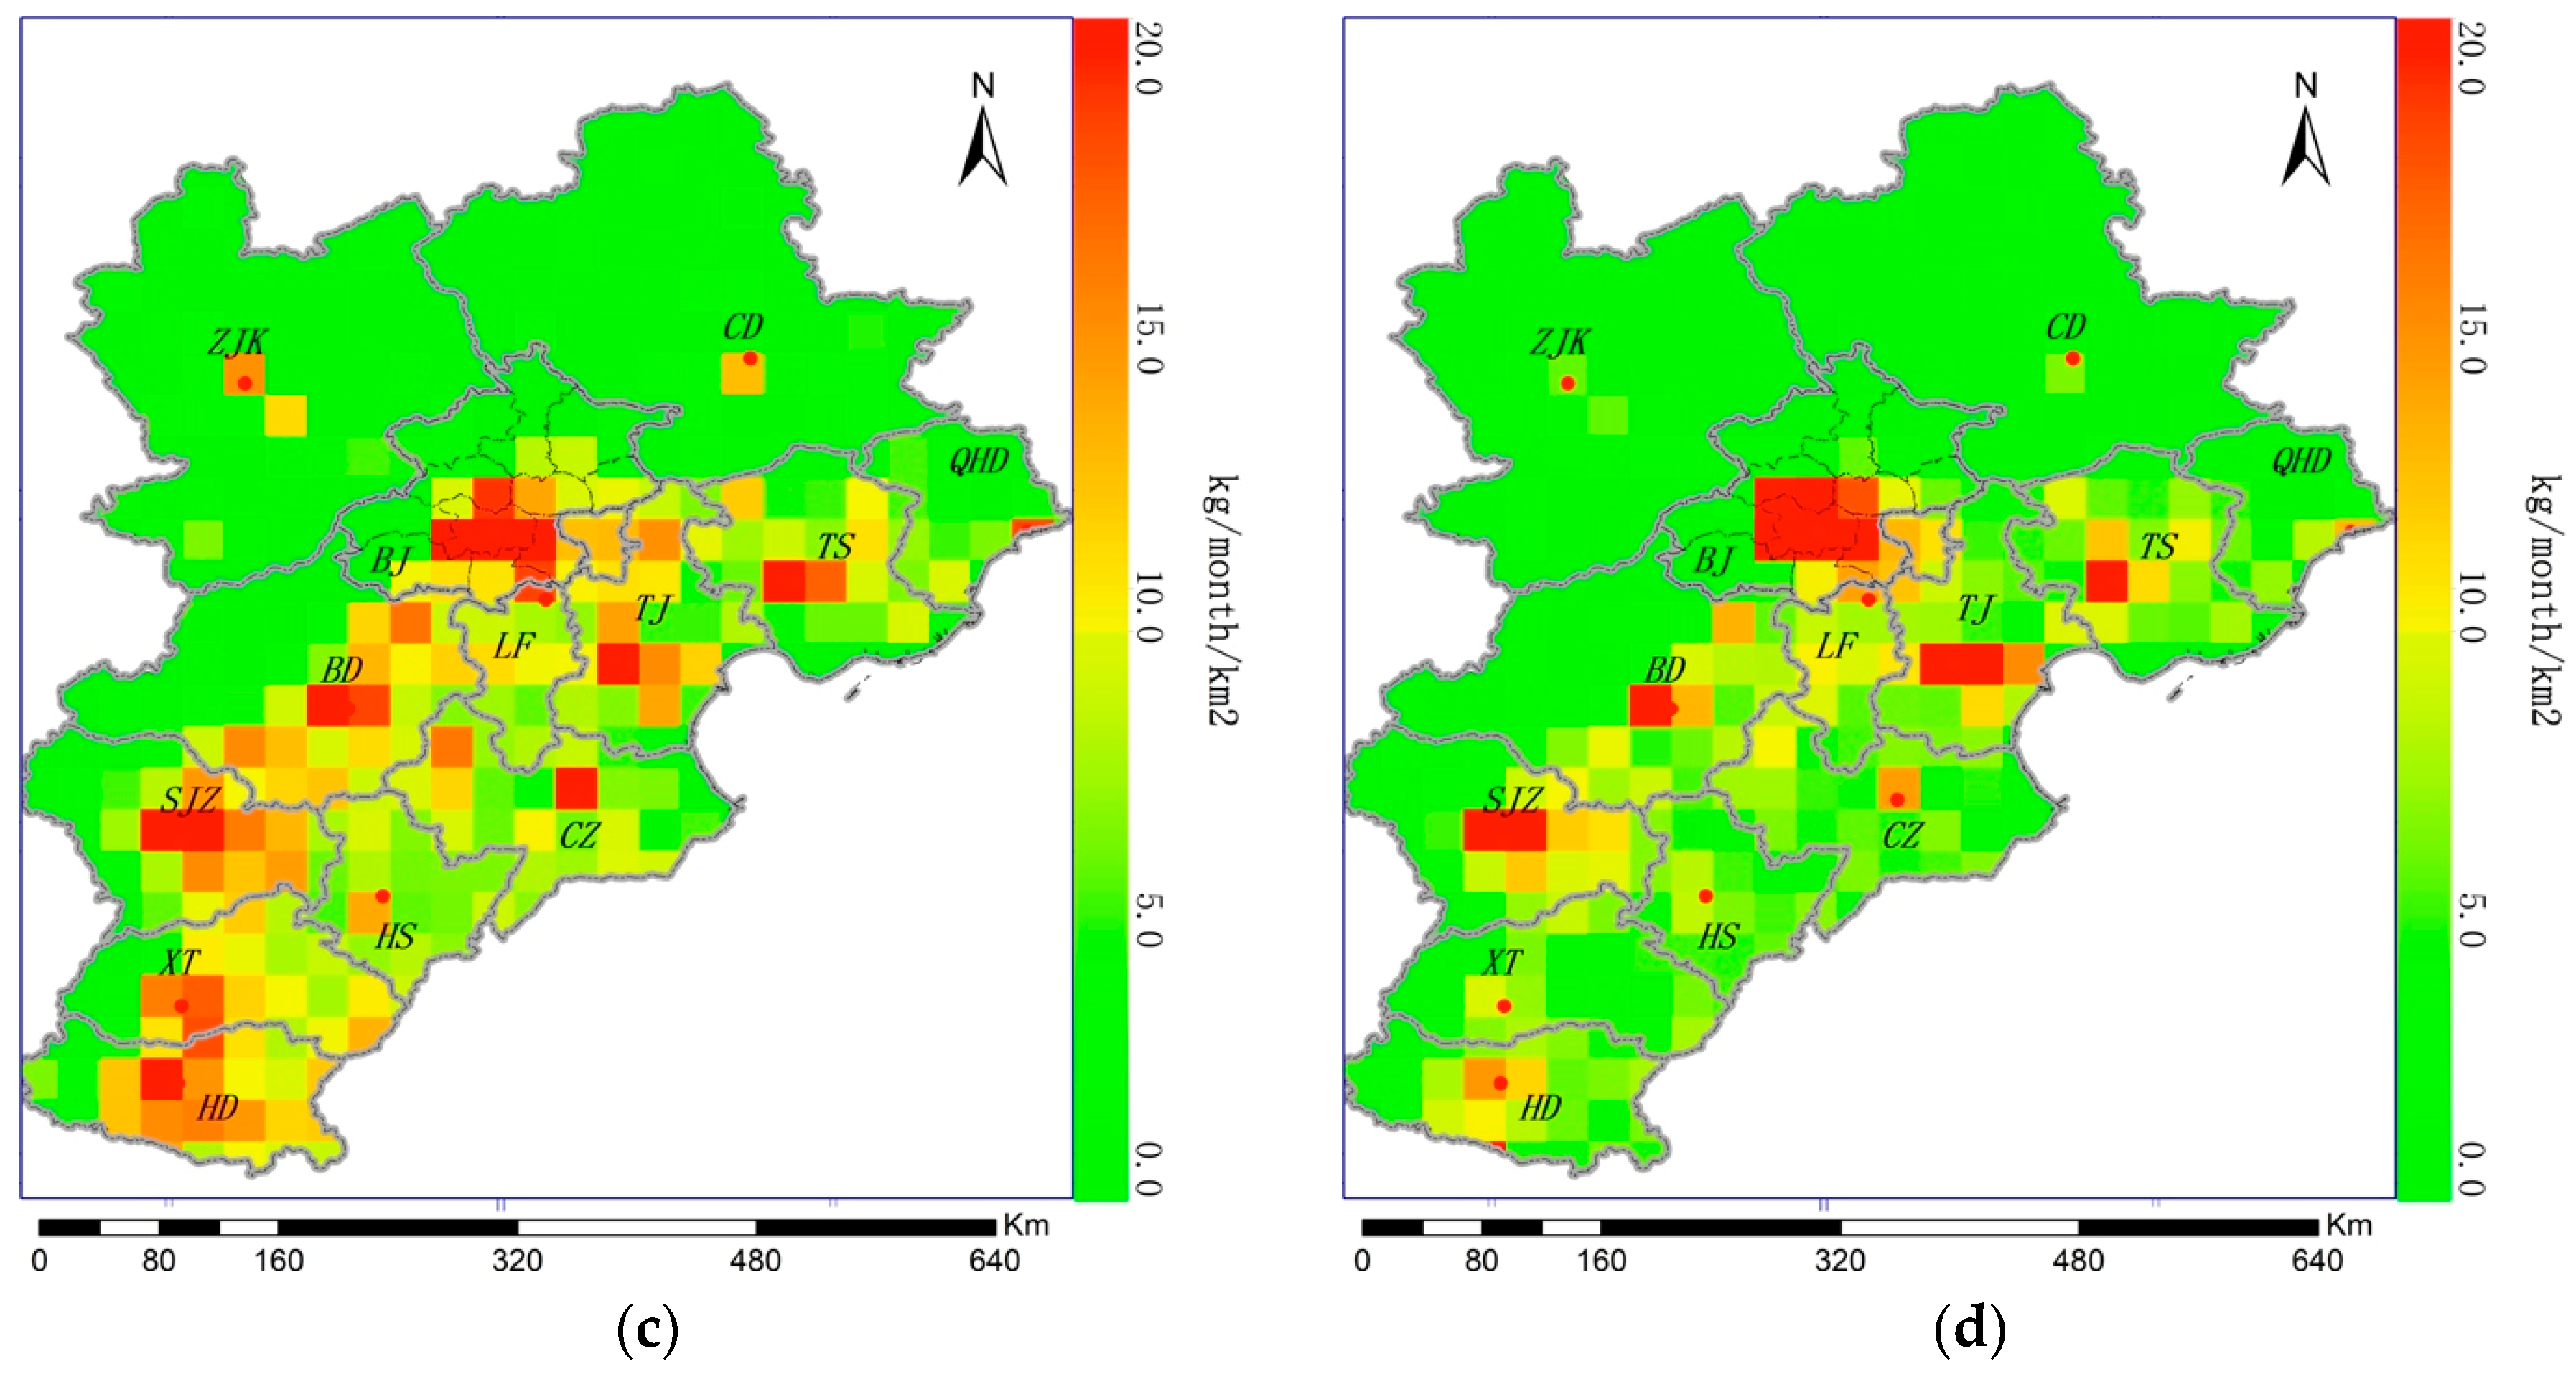
The residential sources as depicted in
Figure 9c have a very similar distribution as the industrial sources but with much lower emission rates. The average residential emission rate is 4.61 kg/month/km
2 with a standard deviation of 6.78 kg/month/km
2, and the emissions are mostly concentrated in urban areas. However, the spatial PCC between HCHO VCDs and residential sources is the largest, indicating that residential sources are a potentially important contributor even though their emission rate is quite smaller than industrial and biogenic ones. As shown in
Figure 9d, the transportation sources are sparsely located among the urban areas. The average is 3.79 kg/month/km
2 and the standard deviation is 9.61 kg/month/km
2. The spatial PCC of transportation is the second largest and no continuous trend was observed. This is possibly related to annual registered vehicle amounts and the control policies on gasoline quality.
Table 5 gives average anthropogenic emission rates in each prefecture-level city throughout the Beijing-Tianjin-Hebei region. Among all regions, the industrial sources are the most substantial, i.e., more than 70% in almost all cities (e.g., 75.16% in Beijing, 71.84% in Shijiazhuang, 73.60% in Chengde and 72.88% in Zhangjiakou). Southeastern sectors demonstrate higher industrial emissions than other sectors. For example, emissions in Langfang were approximately an order of magnitude higher than in Chengde in 2012. In addition, industrial emissions increased largely from 2008 to 2012, suggesting a close connection to the rapid industry development. Tangshan exhibits the largest increment at 49.15% and Shijiazhuang exhibits the smallest at 28.57%. In each year, on average, power-based sources contribute a very small fraction of VOC emissions in all cities (e.g., 0.17% in Beijing and 1.78% in Zhangjiakou).
Residential and transportation sources contribute in the same order of magnitude. Residential emissions demonstrate upward trends from 2008 to 2012 in almost every city. The largest and smallest were observed in Zhangjiakou and Tianjin with 14.34% and 5.27%, respectively. The increasing amplitude is smaller than that of industrial sources. In contrast to residential sources, transportation emissions decreased from 2008 to 2012. Beijing, Zhangjiakou and Langfang decreased the largest at 49.73%, 49.10% and 44.76%, respectively. The residential and transportation emissions constitute approximately 10% of the total, and larger cities have relatively higher transportation emissions. For example, in 2010, Beijing had a higher transportation contribution than the residential one with 15.23 to 9.44%. One the contrary, in Chengde, the ratio was 8.70 to 17.08%. The sizes and values of the residential and transportation sources are possibly dependent on many factors (e.g., the city size and the vehicle number).
Table 6 provides the anthropogenic VOC statistics corresponding to
Table 5 but in urban areas. Compared with the averages in prefecture-level-cities, averages in urban areas are more related to human activities. Obviously, average industrial emissions in industrialized urban areas (e.g., Beijing and Tianjin) are much higher than in the whole prefecture-level-cities. Specifically, considering the three-year average, the average urban emission is about 3.37 times higher than that in the whole Beijing and in Tianjin the ratio is 7.23. On the contrary, less industrialized urban emissions (e.g., Chengde) are lower than those of the whole prefecture-level-cities because the locations of factories are influential. Trends are more complicated in urban areas, for example, in Beijing and Cangzhou, industrial emissions increased about 139.36% and 270.58% from 2008 to 2012, respectively. However, decreases were observed in Langfang and Qinhuangdao, i.e., −11.27% and −5.79%. The changes of industrial emissions in urban areas might be more dependent on local factors (e.g., implementation of reduction policies). It is likely that industrial VOC emissions worsen in cities like Beijing, especially in urban areas, and contribute more to HCHO pollution. Power-based VOC emissions account for a relatively small fraction, but it is noteworthy that they increased about 124.48% and 420.89% in urban Beijing and Shijiazhuang, and this might be influential in the future.
Residential and transportation emissions in urban areas are also higher than the prefecture-level-cities. For example, the ratio of urban emissions to prefecture-level-city ones is 2.22 for residential and 3.72 for transportation in Beijing. In addition, comparatively large cities have ratios larger than 1 (e.g., ratios in Tianjin and Shijiazhuang are all larger than 3.0). In relatively small cities, the ratio varies, and this might depend on many specific local factors. For residential sources, the emissions in urban areas increased in almost all cities with higher rates than emissions in prefecture-level-cities (e.g., 29.43% and 9.79% in Cangzhou, respectively). Meanwhile, transportation emissions decreased in almost all urban areas. Compared with residential sources, the difference of decreasing rates between urban areas and prefecture-level-cities varies more, suggesting that local factors might be important (e.g., city size, population and transportation conditions).
Isoprene is a well-known HCHO precursor, and its photochemical reactions are the predominant reason accounting for HCHO-induced air issues and subsequent surface O
3 formation. Globally speaking, high-level HCHO columns in equatorial areas (e.g., tropical forests) have been observed via satellite-based platforms. The widespread summertime HCHO in Beijing-Tianjin-Hebei (i.e., locating in relative high latitudes) is unexpected. In this region, HCHO is mainly distributed in southeastern sectors, and the land-use types are not deciduous trees, which would emit isoprene, but cropland. Therefore, the sources of HCHO might be more complicated than expected. In this region, isoprene is mainly distributed in northern sectors (e.g., Chengde), and its distribution is opposite to that of HCHO. However, isoprene is still one major reason accounting for high-level HCHO columns because it is more active than anthropogenic VOCs. Further, anthropogenic VOCs might impose substantial impacts as well [
20]. As reported, a continuous growth trend of China’s historical NMVOCs emissions was found during the period of 1980–2005, with the emission increasing by 4.2 times at an annual average rate of 10.6%; populous cities, covering merely 4.5% of China’s territory, accounted for 24.9% of the national emissions [
51]. Additionally, results from the widely adopted MEIC inventories also suggest a similar consequence.
In this manuscript, potential contributions have been discussed as thoroughly as possible. The opposite distributions of HCHO columns and isoprene suggest that isoprene might not be the only reason accounting for high-level HCHO. The anthropogenic contribution was inferred from the relatively strong connection between HCHO columns and human activities in urbanized areas. In addition, the spatial PCCs of HCHO VCDs with anthropogenic VOCs are much higher than those of HCHO with isoprene, that is, the HCHO’s distribution is more similar to anthropogenic VOC distribution. In addition, active anthropogenic NMVOCs were observed with a larger amount than isoprene. Accordingly, anthropogenic sources cannot be neglected and might be substantially influential in the summertime HCHO concentration over southeastern Beijing-Tianjin-Hebei.
Nevertheless, the specific contributions in terms of VOC species (e.g., alkanes, aromatics, alkenes and alkynes, carbonyls) are still complicated. Currently, available inventories only provide VOC amounts for public use, and more detailed data are very limited [
50]. Accordingly, quantitative determination of exact species-based VOC contribution is very difficult. At present, based on the MEIC inventories, industrial VOCs account for a relatively large amount of the total, and the residential sources exhibit the most similar distribution to that of HCHO columns. Therefore, anthropogenic emissions regarding industrial and residential sources might need to be taken into consideration with more concern. These results correspond with previous studies that suggest industry was the single largest anthropogenic sources and residential was the second largest in North China Plain [
6]. In addition, Souri et al. suggested predominant anthropogenic VOC emissions account for high HCHO levels in urban regions, and mostly increasing HCHO columns were found [
20].
In addition to biogenic and anthropogenic sources, pyrogenic sources also contribute to VOC emissions. As suggested, agricultural residue burning might impose influential impacts on HCHO contribution in June [
52]. Bauwens et al., used a long record of OMI HCHO observations to infer emissions from pyrogenic and biogenic sources on the global scale, suggesting that isoprene fluxes in China are reduced and the pyrogenic emissions are regionally low [
53]. Additionally, as discussed before, the contribution from pyrogenic sources accounts for 6% of the total active VOCs. Therefore, due to the lack of accurate pyrogenic data and the large discrepancies in different biomass emissions inventories, the detailed analysis regarding biomass burning is beyond the scope of this study. However, in the future, long-term pyrogenic VOC emission records (e.g., inventories like GFAS and FINN v 1.5) will also be incorporated to conduct a more comprehensive analysis.


