Author Contributions
Conceptualization, G.Z., A.B., P.H., and J.L..; methodology, G.Z., A.B., P.H., and C.C.; formal analysis, G.Z.; data curation, G.Z. and C.C.; writing—original draft preparation, G.Z.; writing—review and editing, A.B., P.H., C.C., and J.L.; supervision, J.L.; funding acquisition, A.B.
Figure 1.
Land–sea mask and elevation in meters above/below sea level for the 12-km simulation domain over the Eastern Mediterranean Basin (left panel) and division in rainfall classes for the 2001–2002 hydrologic year (Class 1: 0–100 mm/yr, Class 2: 100–500 mm/yr, Class 3: 500–1000 mm/yr, Class 4: greater than 1000 mm/yr), as defined in
Section 2.4 (right panel). The locations of six stations used for comparison are also indicated.
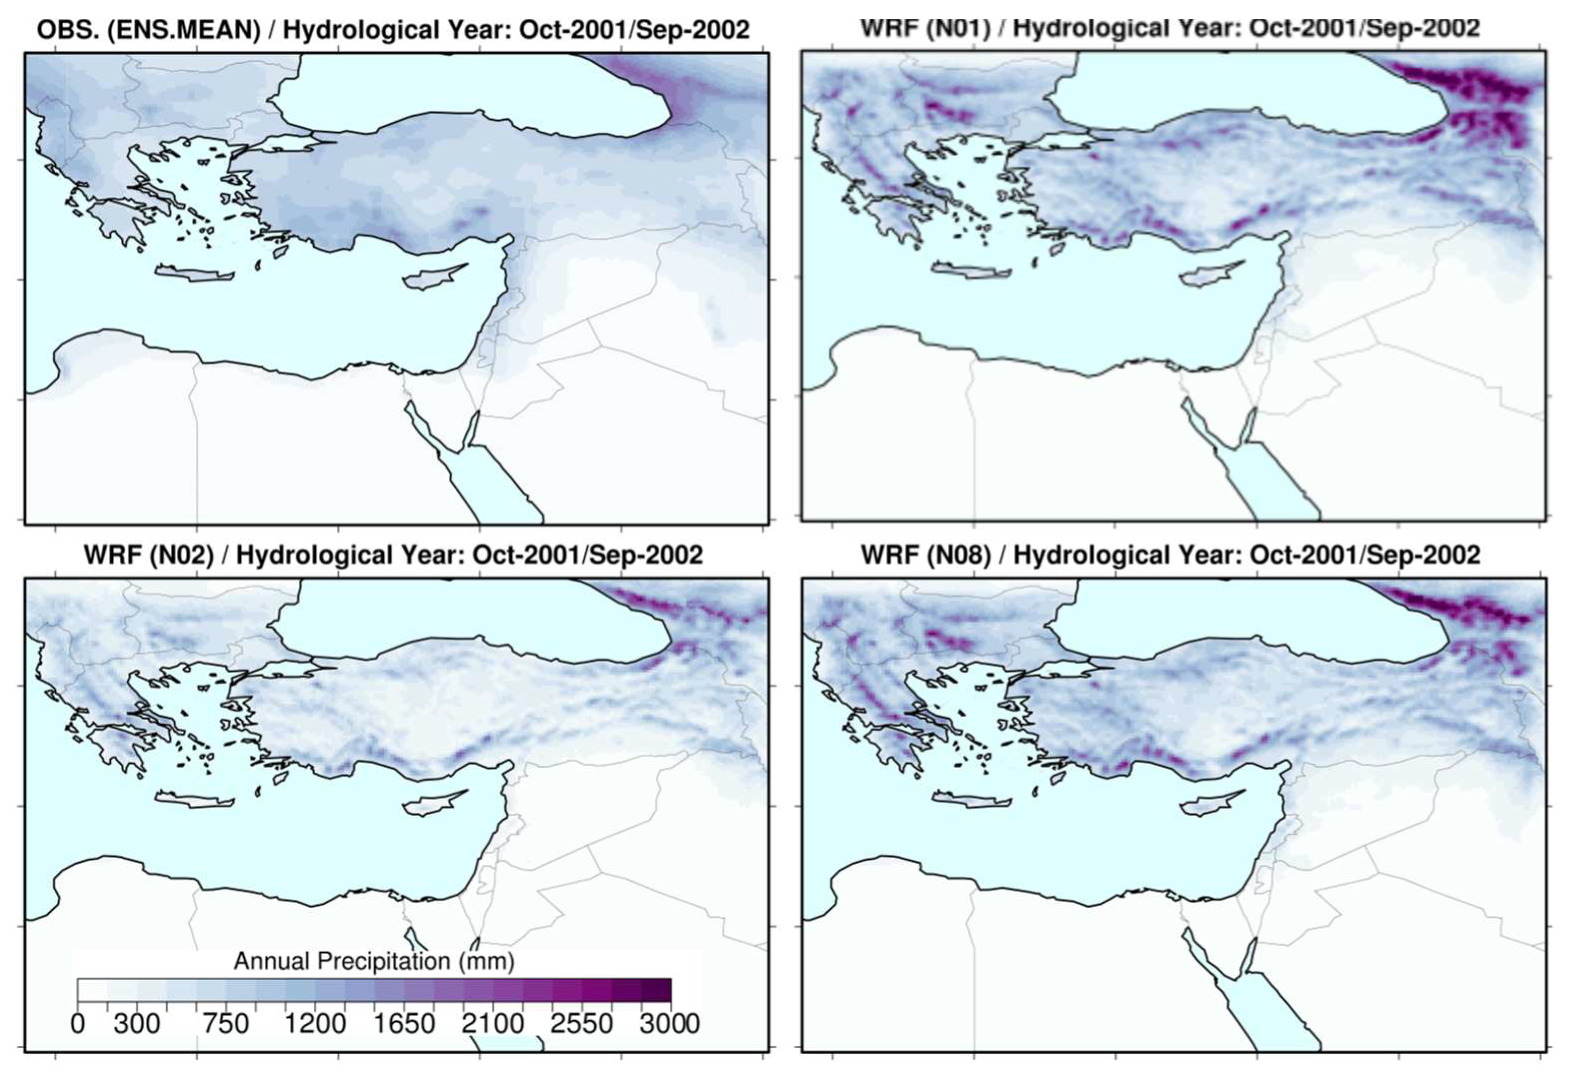
Figure 2.
Precipitation sum (mm/annum) of the hydrological year October 2001–September 2002 for the ensemble mean of gridded observations (top left), the reference no-nudge (top right), the default analysis nudging (bottom left), and the default spectral nudging simulations (bottom right).
Figure 2.
Precipitation sum (mm/annum) of the hydrological year October 2001–September 2002 for the ensemble mean of gridded observations (top left), the reference no-nudge (top right), the default analysis nudging (bottom left), and the default spectral nudging simulations (bottom right).
Figure 3.
Mean total column precipitable water (TCPW), in mm, for the period December 2001–October 2002 derived from the ERA-Interim (ERA-I) reanalysis (left panel) and NASA’s Water Vapor Project (NVAP-M) observations (tight panel).
Figure 3.
Mean total column precipitable water (TCPW), in mm, for the period December 2001–October 2002 derived from the ERA-Interim (ERA-I) reanalysis (left panel) and NASA’s Water Vapor Project (NVAP-M) observations (tight panel).
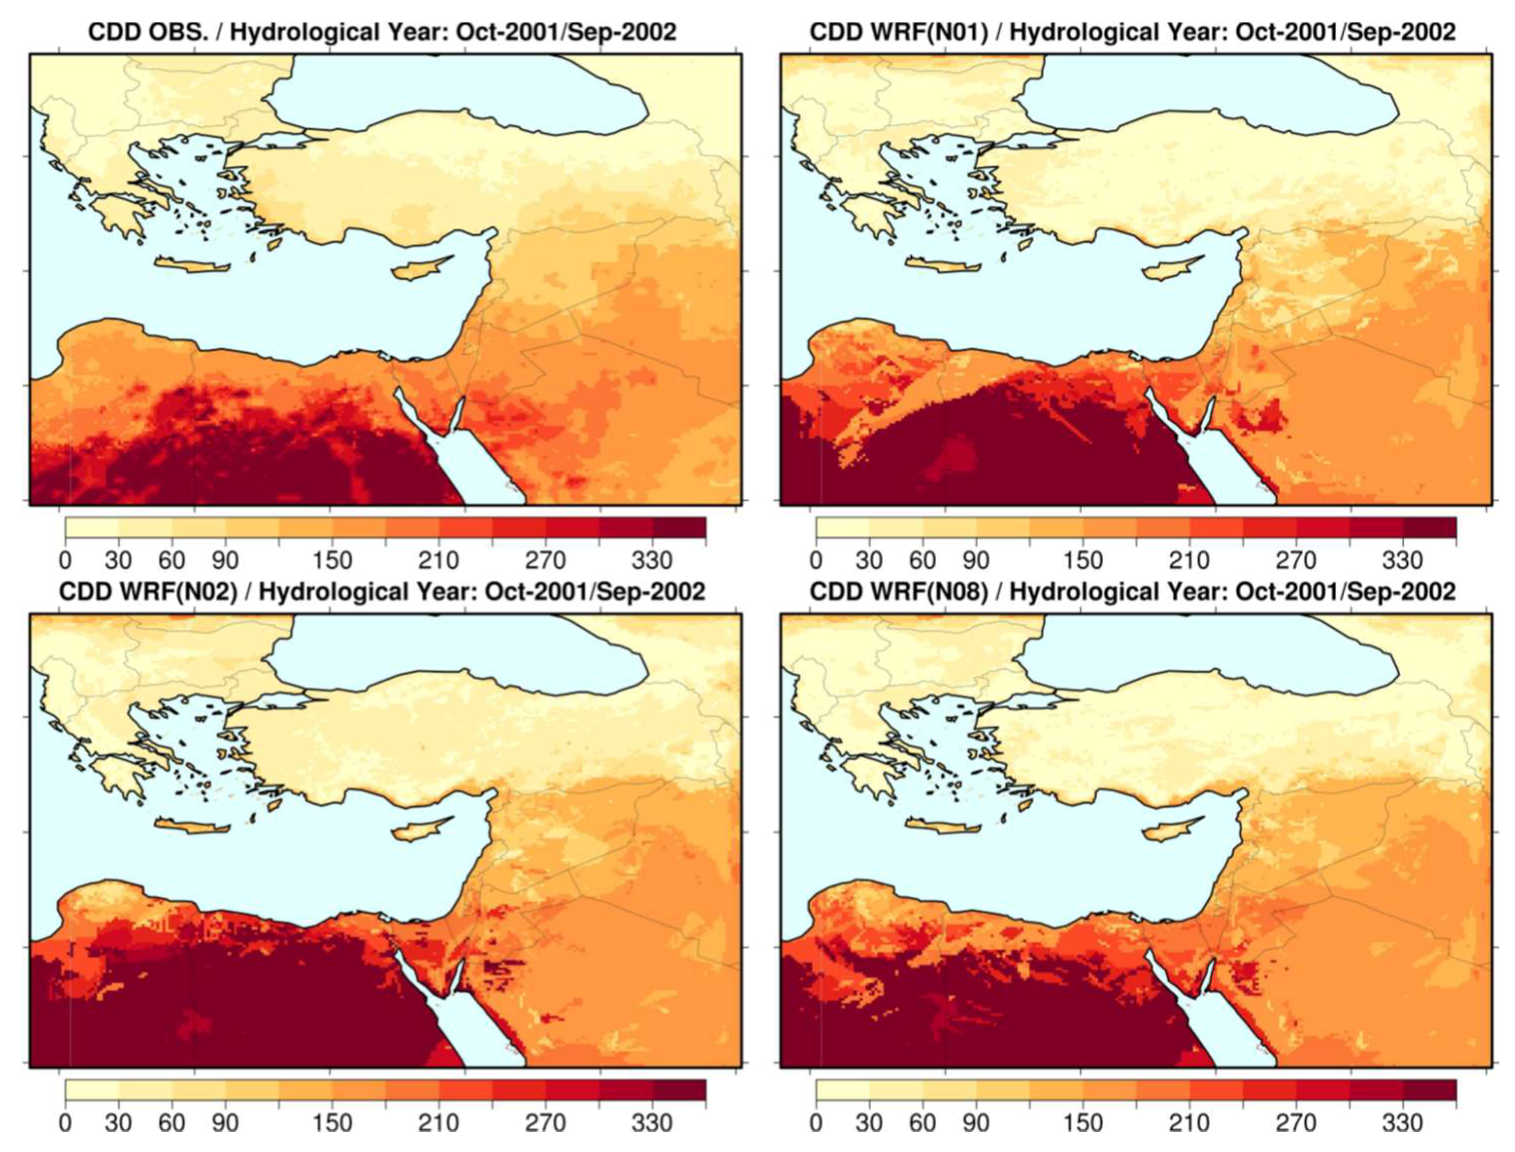
Figure 4.
Maximum number of consecutive dry days per year for the period October 2001–September 2002 for the ensemble mean of gridded observations (top left), the reference no-nudge (top right), the default analysis nudging (bottom left), and the default spectral nudging simulations (bottom right).
Figure 4.
Maximum number of consecutive dry days per year for the period October 2001–September 2002 for the ensemble mean of gridded observations (top left), the reference no-nudge (top right), the default analysis nudging (bottom left), and the default spectral nudging simulations (bottom right).
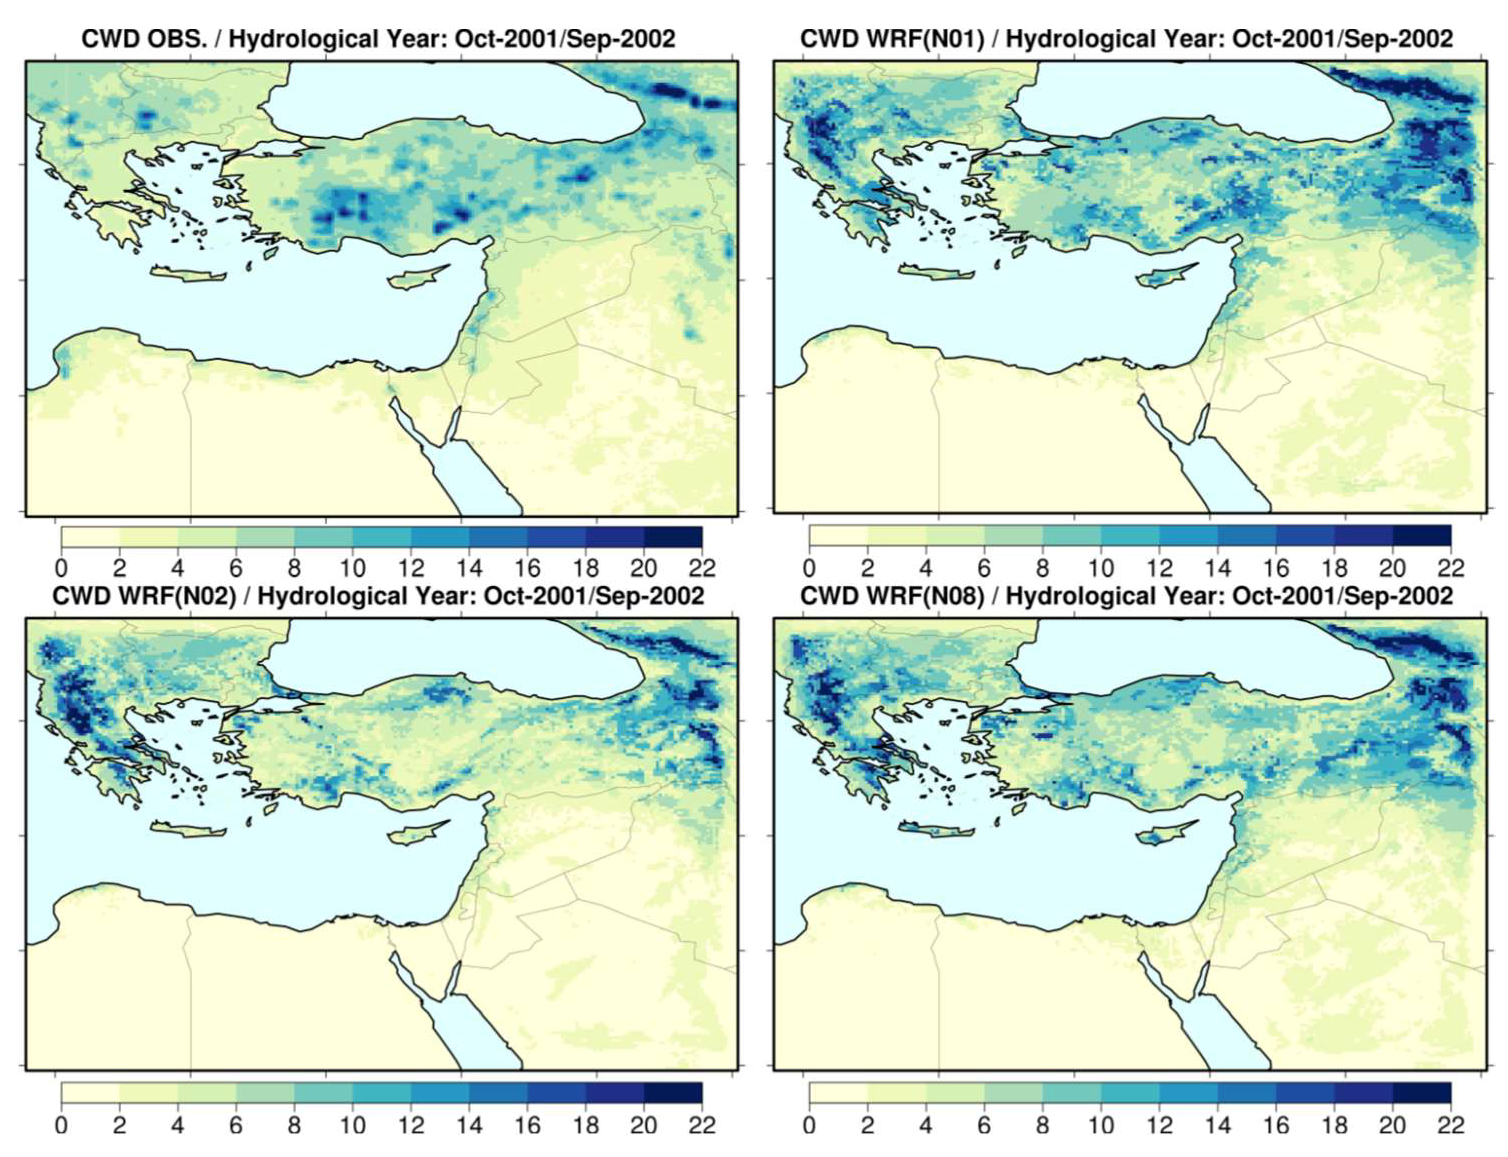
Figure 5.
Maximum number of consecutive wet days per year for the period October 2001–September 2002 for the ensemble mean of gridded observations (top left), the reference no-nudge (top right), the default analysis nudging (bottom left), and the default spectral nudging simulations (bottom right).
Figure 5.
Maximum number of consecutive wet days per year for the period October 2001–September 2002 for the ensemble mean of gridded observations (top left), the reference no-nudge (top right), the default analysis nudging (bottom left), and the default spectral nudging simulations (bottom right).
Figure 6.
Count of rainy days for the period October 2001–September 2002 for the ensemble mean of gridded observations (top left), the reference no-nudge (top right), the default analysis nudging (bottom left), and the default spectral nudging simulations (bottom right).
Figure 6.
Count of rainy days for the period October 2001–September 2002 for the ensemble mean of gridded observations (top left), the reference no-nudge (top right), the default analysis nudging (bottom left), and the default spectral nudging simulations (bottom right).
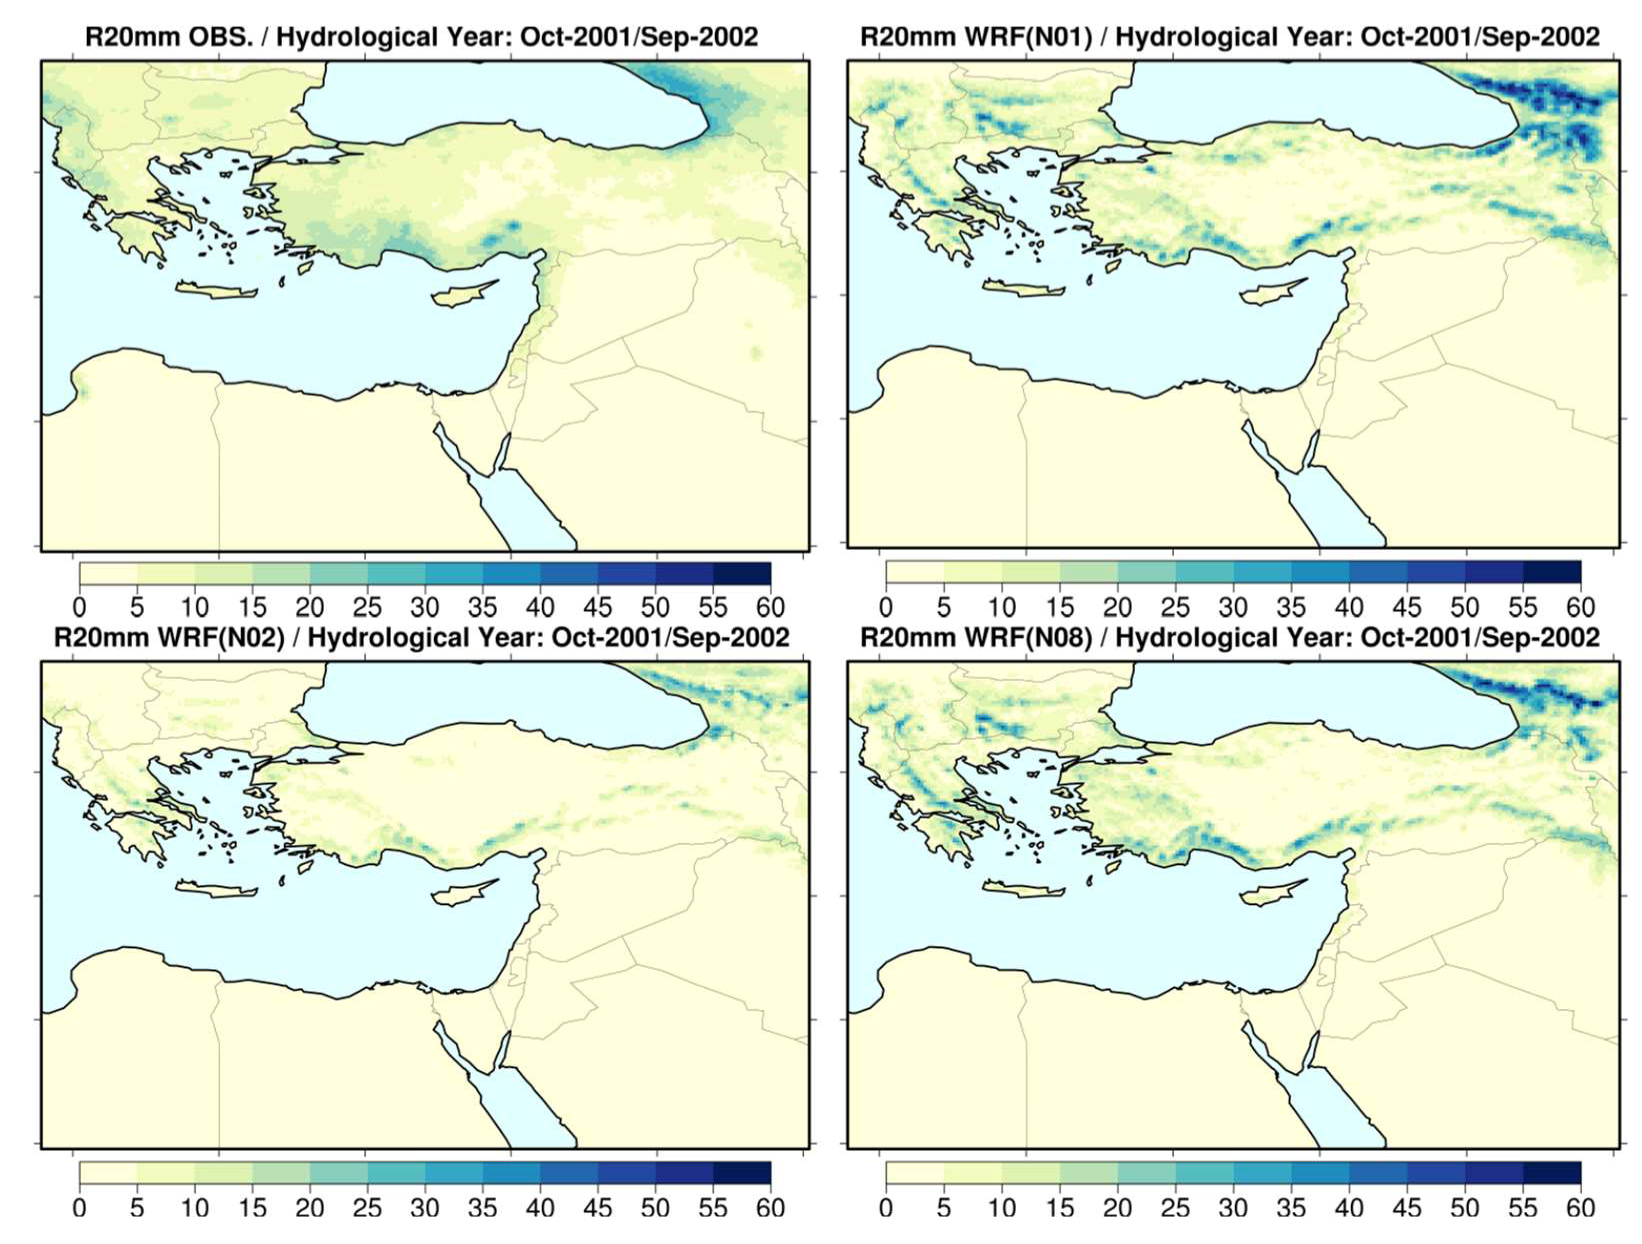
Figure 7.
Count of days with precipitation larger than 20 mm for the ensemble mean of gridded observations (top left), the reference no-nudge (top right), the default analysis nudging (bottom left), and the default spectral nudging simulations (bottom right).
Figure 7.
Count of days with precipitation larger than 20 mm for the ensemble mean of gridded observations (top left), the reference no-nudge (top right), the default analysis nudging (bottom left), and the default spectral nudging simulations (bottom right).
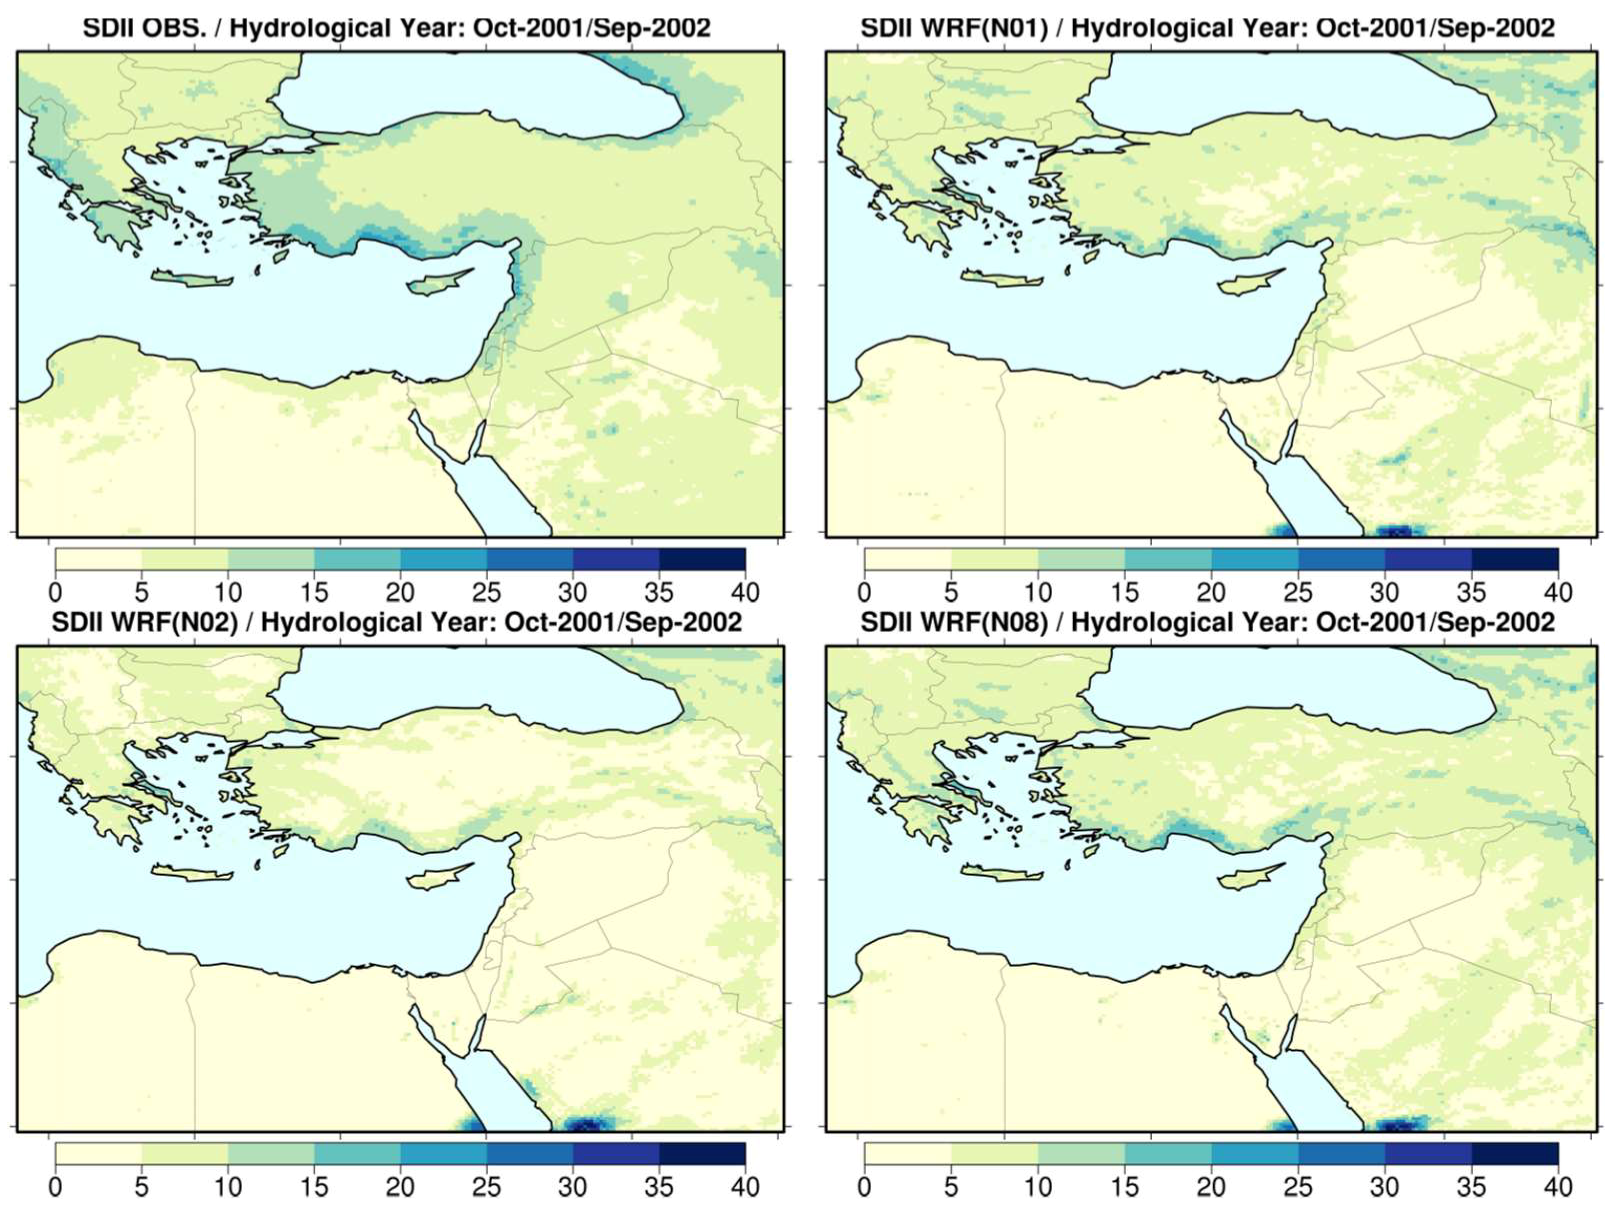
Figure 8.
Simple precipitation intensity index (in mm per rainy day) for the ensemble mean of gridded observations (top left), the reference no-nudge (top right), the default analysis nudging (bottom left), and the default spectral nudging simulations (bottom right).
Figure 8.
Simple precipitation intensity index (in mm per rainy day) for the ensemble mean of gridded observations (top left), the reference no-nudge (top right), the default analysis nudging (bottom left), and the default spectral nudging simulations (bottom right).
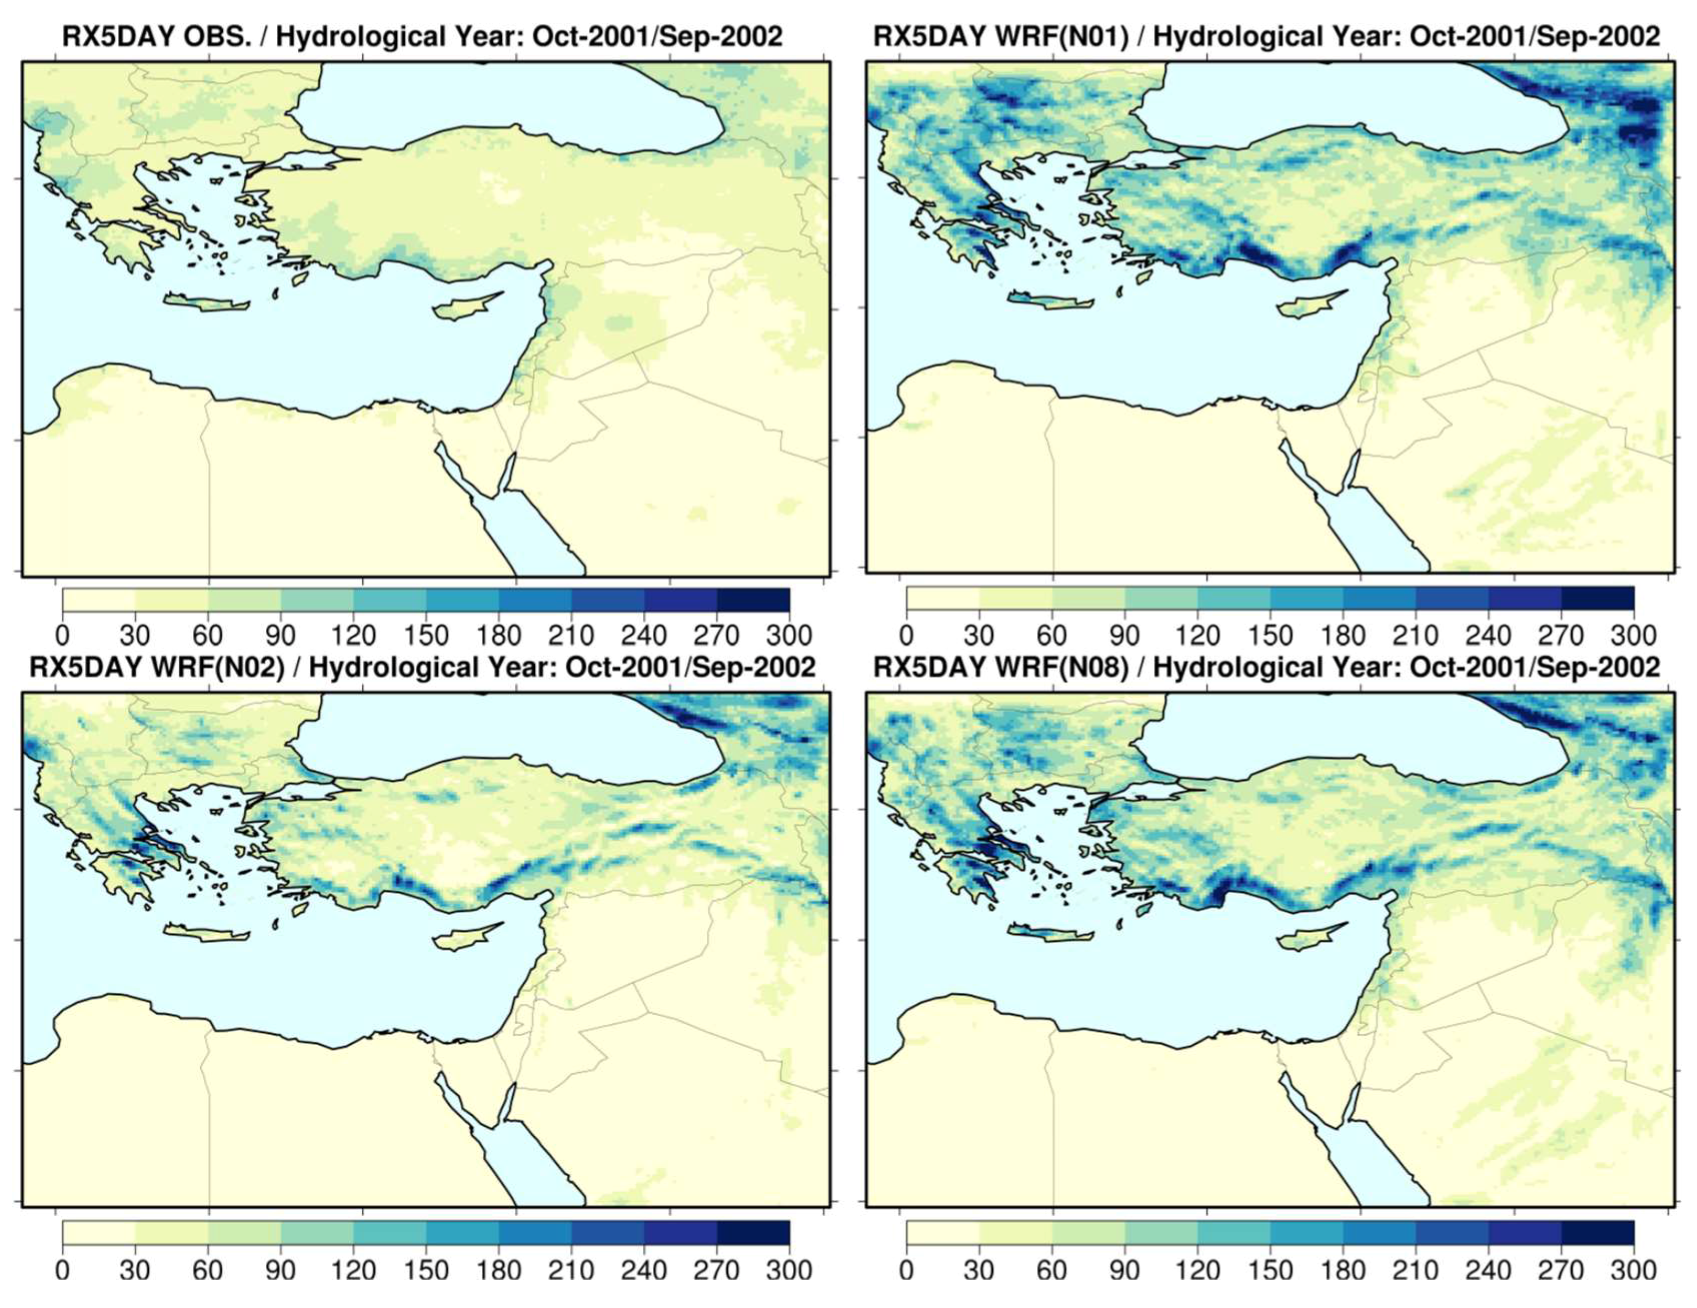
Figure 9.
Highest five-day precipitation amount (in mm) for the period October 2001–September 2002 for the ensemble mean of gridded observations (top left), the reference no-nudge (top right), the default analysis nudging (bottom left), and the default spectral nudging simulations (bottom right).
Figure 9.
Highest five-day precipitation amount (in mm) for the period October 2001–September 2002 for the ensemble mean of gridded observations (top left), the reference no-nudge (top right), the default analysis nudging (bottom left), and the default spectral nudging simulations (bottom right).
Figure 10.
Monthly precipitation comparison between station measurements (purple diamonds), gridded observational datasets (brown curve and dots), and WRF simulations (colored curves) for six station locations. The vertical brown segments indicate the range of the gridded observations.
Figure 10.
Monthly precipitation comparison between station measurements (purple diamonds), gridded observational datasets (brown curve and dots), and WRF simulations (colored curves) for six station locations. The vertical brown segments indicate the range of the gridded observations.
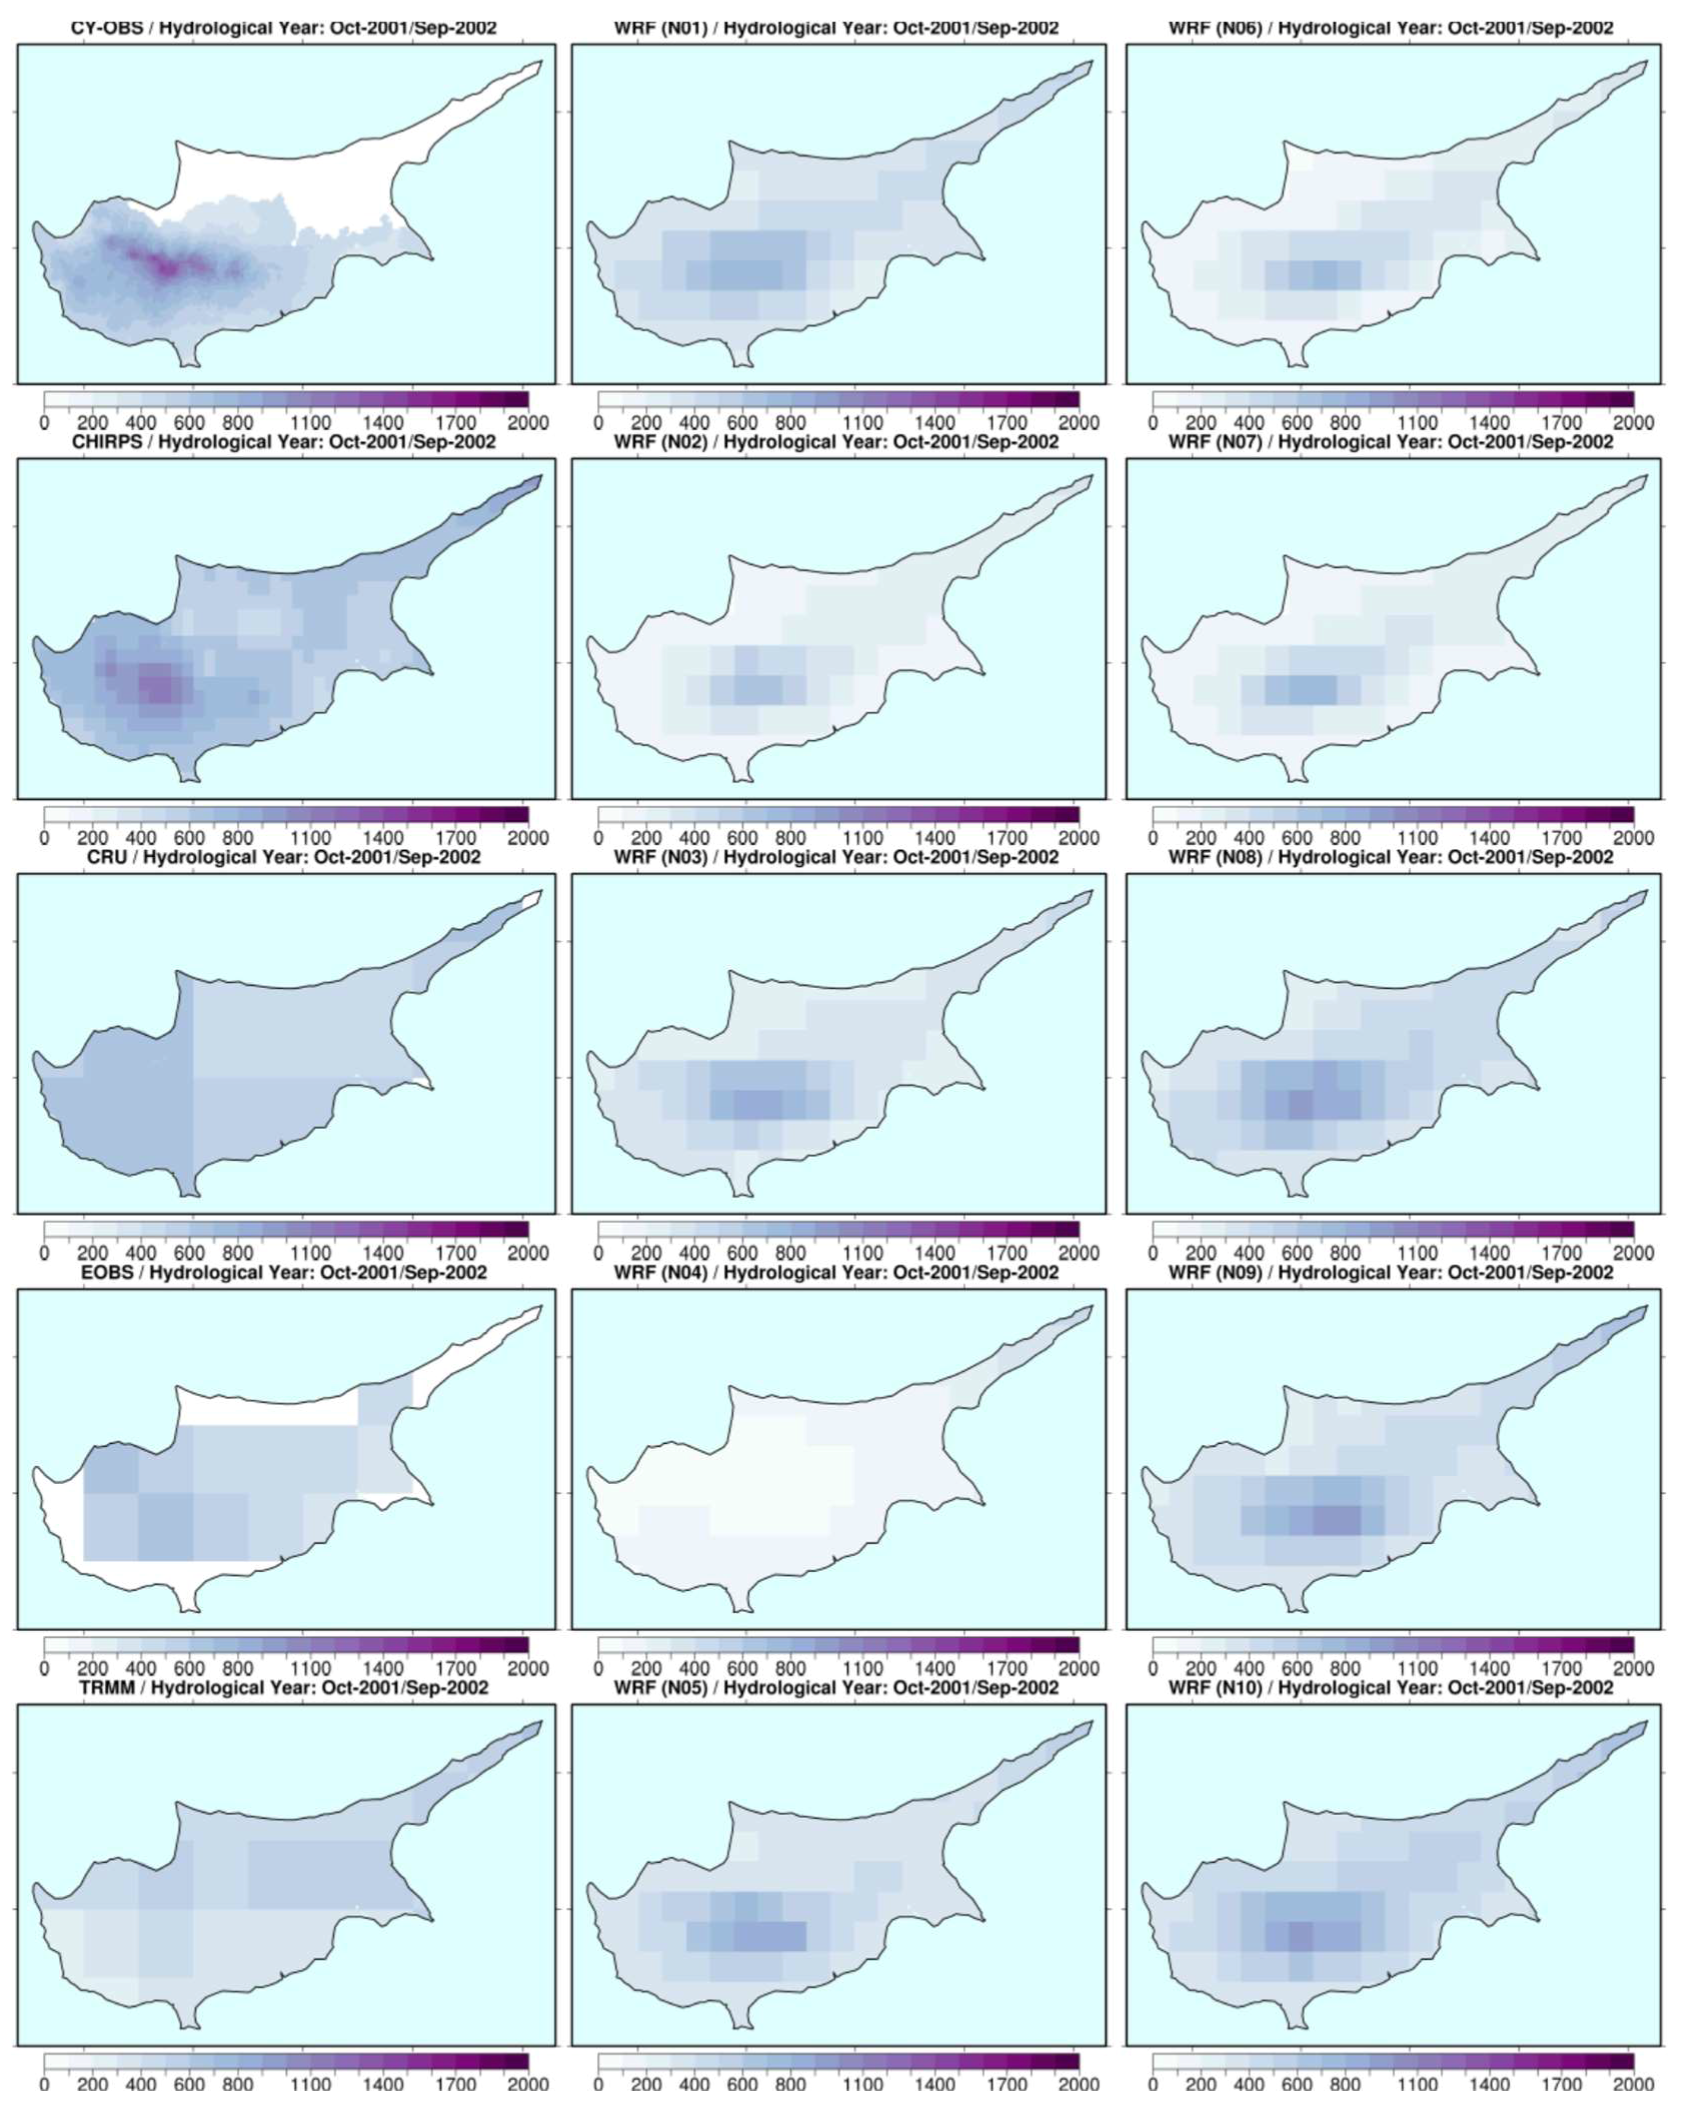
Figure 11.
Precipitation sum (mm/yr) over Cyprus for the hydrological year October 2001–September 2002 for five observational datasets (left panels) and simulations WRF-01–WRF-10 (middle and right panels).
Figure 11.
Precipitation sum (mm/yr) over Cyprus for the hydrological year October 2001–September 2002 for five observational datasets (left panels) and simulations WRF-01–WRF-10 (middle and right panels).
Table 1.
Description of nudging experiments.
Table 1.
Description of nudging experiments.
| ID: | Nudging Type | Nudging Interval (min) | Nudging Coefficients (sec−1) | Spectral Wavenumber | PBL Nudging |
|---|
| Potential Temp. | U, V Wind Components | Water Vapor Mix. Ratio | Geopot. Height | X | Y | |
|---|
| WRF-01 | No nudge | 360 | — | — | — | — | — | — | NO |
| WRF-02 | Analysis | 360 | 3 × 10⁻⁴ | 3 × 10⁻⁴ | 3 × 10⁻⁴ | — | — | — | NO |
| WRF-03 | Analysis | 360 | 5 × 10⁻⁵ | 5 × 10⁻⁵ | 5 × 10⁻⁶ | — | — | — | NO |
| WRF-04 | Analysis | 360 | 3 × 10⁻⁴ | 3 × 10⁻⁴ | 3 × 10⁻⁴ | — | — | — | YES |
| WRF-05 | Analysis | 360 | 3 × 10⁻⁴ | 3 × 10⁻⁴ | — | — | — | — | NO |
| WRF-06 | Analysis | 1440 | 3 × 10⁻⁴ | 3 × 10⁻⁴ | 3 × 10⁻⁴ | — | — | — | NO |
| WRF-07 | Analysis | 720 | 3 × 10⁻⁴ | 3 × 10⁻⁴ | 3 × 10⁻⁴ | — | — | — | NO |
| WRF-08 | Spectral | 360 | 3 × 10⁻⁴ | 3 × 10⁻⁴ | — | 3 × 10⁻⁴ | 3 | 2 | NO |
| WRF-09 | Spectral | 360 | 3 × 10⁻⁴ | 3 × 10⁻⁴ | — | 3 × 10⁻⁴ | 3 | 2 | YES |
| WRF-10 | Spectral | 360 | 3 × 10⁻⁴ | 3 × 10⁻⁴ | — | 3 × 10⁻⁴ | 5 | 4 | NO |
Table 2.
Description of gridded observational datasets selected for comparison.
Table 2.
Description of gridded observational datasets selected for comparison.
| Dataset | Version | Grid Spacing | Temporal Resolution | Institution | Reference |
|---|
| CRU | 3.24.01 | 0.5° | Monthly (1901–Now) | Climate Research Unit, University of East Anglia | Harris et al., 2014 [31] |
| CHIRPS | 2.0 | 0.05° | Daily (1981–Now) | Climate Hazards Group | Funk et al., 2015 [32] |
| E-OBS | 15.0 | 0.25° | Daily (1950–Now) | ENSEMBLES (EU FP6 project) | Haylock et al., 2008 [33] |
| TRMM | 3B42RT | 0.5° | Daily (1979–Now) | National Aeronautics and Space Administration (NASA) | Huffman et al., 2007 [34] |
| CY-OBS | | 1 km | Daily (1980–2010) | The Cyprus Institute | Camera et al., 2014 [35] |
Table 3.
Description of meteorological stations selected for comparison.
Table 3.
Description of meteorological stations selected for comparison.
| Station | Country | Longitude | Latitude | Elevation | Model Elevation | Model Land Use |
|---|
| Benghazi | Libya | 20.269° E | 32.097° N | 132 m | 82 m | Barren/Sparsely vegetated |
| Larissa | Greece | 22.466° E | 39.950° N | 73.5 m | 113 m | Croplands |
| Athalassa | Cyprus | 33.400° E | 35.150° N | 161 m | 206 m | Open shrubland |
| Zefat | Israel | 35.500° E | 32.967° N | 934 m | 363 m | Open shrubland |
| Diyiarbakir | Turkey | 40.201° E | 37.894° N | 686 m | 473 m | Croplands |
| Alanya | Turkey | 32.000° E | 36.550° N | 6 m | 313 m | Urban/Built-up |
Table 4.
Observed annual precipitation total (in mm/year) and biases of the ERA-I reanalyses and each Weather Research and Forecasting (WRF) simulation, averaged over four rainfall regimes (Class 1: 0–100 mm/year, Class 2: 100–500 mm/year, Class 3: 500–1000 mm/year, Class 4: greater than 1000 mm/year). The percent coverage of grid points for each precipitation class over the Eastern Mediterranean domain is indicated. The lowest model biases (i.e., best performing simulations) are highlighted in bold.
| | OBS | ERA-I | WRF01 | WRF02 | WRF03 | WRF04 | WRF05 | WRF06 | WRF07 | WRF08 | WRF09 | WRF10 |
|---|
| Class 1 (43.9%) | 36 | −9 | −11 | −23 | −14 | −28 | −13 | −19 | −21 | −11 | −18 | 12 |
| Class 2 (16.5%) | 298 | −6 | −147 | −233 | −177 | −233 | −166 | −223 | −229 | −155 | −161 | −159 |
| Class 3 (33.6%) | 710 | −64 | 162 | −230 | 50 | −334 | 61 | −161 | −193 | 64 | −16 | 40 |
| Class 4 (5.9%) | 1242 | −293 | 386 | 249 | 161 | −445 | 209 | −104 | −194 | 155 | 9 | 134 |
Table 5.
Observed values for six rainfall indices and biases for each WRF simulation, averaged over four precipitation regimes (Class 1: 0–100 mm/year, Class 2: 100–500 mm/year, Class 3: 500–1000 mm/year, Class 4: greater than 1000 mm/year). (CDD: Consecutive dry days, CWD: Consecutive wet days, RR1: Annual count of rainy days, R20: Annual count of days with precipitation larger than 20 mm, RX5D: Highest five-day precipitation amount for one year, SDII: Simple precipitation intensity index). The lowest model biases are highlighted in bold.
| | | OBS | WRF01 | WRF02 | WRF03 | WRF04 | WRF05 | WRF06 | WRF07 | WRF08 | WRF09 | WRF10 |
|---|
| CDD | Class 1 | 225.5 | 13.4 | 33.3 | 24.4 | 51.4 | 20.4 | 23.8 | 30.8 | 18.6 | 27.5 | 21.0 |
| Class 2 | 129.9 | 4.8 | 22.3 | 14.1 | 46.7 | 13.4 | 11.7 | 19.2 | 20.0 | 22.1 | 21.8 |
| Class 3 | 51.9 | −18.7 | −4.4 | −14.2 | 9.1 | −15.4 | −4.2 | −5.5 | −13.0 | −10.5 | −11.3 |
| Class 4 | 33.4 | −11.6 | −3.0 | −9.0 | 5.1 | −9.6 | −4.6 | −4.5 | −7.8 | −7.9 | −6.8 |
| CWD | Class 1 | 1.5 | −0.1 | −0.4 | −0.2 | −0.7 | −0.2 | −0.2 | −0.4 | −0.1 | −0.3 | −0.2 |
| Class 2 | 4.6 | −0.7 | −1.9 | −1.1 | −2.3 | −0.9 | −1.4 | −1.8 | −0.7 | −0.9 | −0.7 |
| Class 3 | 6.7 | 2.5 | 0.5 | 1.7 | −1.7 | 1.7 | 2.1 | 1.1 | 2.0 | 1.3 | 1.7 |
| Class 4 | 9.7 | 3.6 | 1.2 | 2.6 | −3.0 | 3.2 | 3.2 | 1.8 | 2.6 | 1.2 | 2.1 |
| RR1 | Class 1 | 7.2 | −1.9 | −3.8 | −2.6 | −5.4 | −2.2 | −3.0 | −3.5 | −2.1 | −3.3 | −2.3 |
| Class 2 | 38.1 | −9.9 | −22.5 | −14.3 | −25.3 | −12.2 | −19.9 | −21.9 | −11.5 | −12.9 | −11.9 |
| Class 3 | 79.3 | 31.6 | 4.8 | 24.2 | −22.5 | 25.8 | 15.6 | 10.5 | 24.4 | 16.3 | 21.0 |
| Class 4 | 113.9 | 35.8 | 8.7 | 25.3 | −24.8 | 28.0 | 19.3 | 13.3 | 23.4 | 17.7 | 20.6 |
| R20 | Class 1 | 0.1 | 0.0 | −0.1 | 0.0 | −0.1 | 0.0 | −0.1 | −0.1 | 0.0 | 0.0 | 0.0 |
| Class 2 | 2.7 | −1.9 | −2.5 | −2.1 | −2.4 | −2.1 | −2.5 | −2.5 | −2.0 | −2.0 | −2.0 |
| Class 3 | 7.9 | 0.7 | −4.8 | −1.0 | −5.0 | −1.1 | −4.4 | −4.6 | −0.8 | −1.7 | −0.9 |
| Class 4 | 17.7 | 4.5 | −7.6 | 0.3 | −8.2 | 0.7 | −5.5 | −6.8 | 0.4 | −2.0 | 0.1 |
| SDII | Class 1 | 3.9 | −1.1 | −1.9 | −1.3 | −1.8 | −1.4 | −1.8 | −1.9 | −1.2 | −1.3 | −1.1 |
| Class 2 | 7.4 | −3.0 | −4.2 | −3.3 | −3.5 | −3.3 | −4.1 | −4.1 | −2.9 | −3.0 | −3.0 |
| Class 3 | 9.6 | −1.9 | −4.1 | −2.5 | −3.2 | −2.5 | −4.0 | −4.1 | −2.3 | −2.5 | −2.3 |
| Class 4 | 12.7 | −2.1 | −4.8 | −2.8 | −3.9 | −2.7 | −4.4 | −4.7 | −2.6 | −3.3 | −2.6 |
| RX5D | Class 1 | 9 | 1.3 | −3.3 | 0.6 | −4.3 | 0.4 | −1.8 | −2.8 | 1.2 | −0.6 | 1.1 |
| Class 2 | 35.8 | −4.8 | −19.5 | −8.3 | −16.5 | −8.9 | −17.6 | −18.6 | −4.7 | −6.5 | −5.9 |
| Class 3 | 51.3 | 44.9 | 10.5 | 35.6 | 8.7 | 33.3 | 14.1 | 12.0 | 34.8 | 28.8 | 34.6 |
| Class 4 | 74.1 | 87.4 | 30.8 | 64.1 | 25.5 | 60.7 | 43.0 | 33.2 | 60.1 | 47.2 | 60.5 |
Table 6.
Statistical metrics (COR: correlation coefficient, MAE: mean absolute error (mm/mo), MIA: modified index of agreement, TS: threat score) between the observed monthly precipitation (ensemble mean of gridded data) and WRF simulations. Results are averaged for each precipitation class and for all grid points (average).
| | | WRF01 | WRF02 | WRF03 | WRF04 | WRF05 | WRF06 | WRF07 | WRF08 | WRF09 | WRF10 |
|---|
| COR | Class 1 | 0.50 | 0.49 | 0.52 | 0.56 | 0.48 | 0.4 | 0.47 | 0.52 | 0.52 | 0.53 |
| Class 2 | 0.81 | 0.76 | 0.83 | 0.76 | 0.82 | 0.72 | 0.75 | 0.84 | 0.84 | 0.84 |
| Class 3 | 0.71 | 0.71 | 0.74 | 0.76 | 0.73 | 0.65 | 0.68 | 0.76 | 0.78 | 0.77 |
| Class 4 | 0.56 | 0.56 | 0.55 | 0.55 | 0.55 | 0.5 | 0.56 | 0.56 | 0.56 | 0.56 |
| MAE | Class 1 | 2.1 | 2.1 | 2.1 | 2.1 | 2.1 | 2.3 | 2.1 | 2.1 | 2.0 | 2.2 |
| Class 2 | 10.1 | 12.6 | 10.1 | 12.4 | 9.9 | 12.6 | 12.5 | 9.6 | 9.5 | 9.7 |
| Class 3 | 35.6 | 28.7 | 31.0 | 31.0 | 30.8 | 28.8 | 28.6 | 30.2 | 26.3 | 29.5 |
| Class 4 | 70.9 | 48.9 | 61.3 | 52.5 | 62.7 | 54.1 | 49.4 | 59.2 | 52.6 | 60.0 |
| MIA | Class 1 | 0.43 | 0.31 | 0.39 | 0.22 | 0.42 | 0.32 | 0.31 | 0.42 | 0.37 | 0.41 |
| Class 2 | 0.58 | 0.35 | 0.54 | 0.34 | 0.56 | 0.37 | 0.36 | 0.6 | 0.58 | 0.59 |
| Class 3 | 0.59 | 0.52 | 0.6 | 0.48 | 0.61 | 0.52 | 0.52 | 0.62 | 0.64 | 0.62 |
| Class 4 | 0.54 | 0.49 | 0.53 | 0.44 | 0.52 | 0.48 | 0.49 | 0.53 | 0.53 | 0.52 |
| TS | Class 1 | 0.79 | 0.64 | 0.75 | 0.52 | 0.8 | 0.68 | 0.63 | 0.78 | 0.77 | 0.77 |
| Class 2 | 0.37 | 0.08 | 0.29 | 0.08 | 0.31 | 0.11 | 0.1 | 0.35 | 0.29 | 0.31 |
| Class 3 | 0.55 | 0.36 | 0.57 | 0.18 | 0.57 | 0.45 | 0.41 | 0.59 | 0.61 | 0.58 |
| Class 4 | 0.28 | 0.38 | 0.33 | 0.23 | 0.33 | 0.43 | 0.4 | 0.33 | 0.38 | 0.33 |

 ,
, 


