Impact of Atmospheric Circulation on the Occurrence of Hot Nights in Central Europe


Department of Climatology, Adam Mickiewicz University in Poznań, Krygowskiego 10, 61–680 Poznań, Poland
Atmosphere 2018, 9(12), 474; https://doi.org/10.3390/atmos9120474
Submission received: 21 October 2018
/
Revised: 15 November 2018
/
Accepted: 30 November 2018
/
Published: 3 December 2018
(This article belongs to the Section Biometeorology)
Abstract
:The main goal of the study is to determine the pressure conditions that cause waves of hot nights in Central Europe. The goal was implemented on the basis of data from 1966 to 2015, made available by the Institute of Meteorology and Water Management—National Research Institute, Deutscher Wetterdienst and the National Center for Environmental Prediction/National Center for Atmospheric Research (NCEP/NCAR). A hot night was defined as a day with the minimum air temperature above 18 °C. In the analysed years, an increase in the number of hot nights was found, which was predominantly statistically significant within the studied area. The study shows that the occurrence of waves of hot nights in Central Europe was associated on average with the ridge of high pressure, within which a local high-pressure area developed. During the waves of hot nights, there were positive anomalies of heights of isobaric surfaces over the study area with a maximum in the upper troposphere.
1. Introduction
The global warming observed today is primarily characterized by an increase in air temperature [1]. One manifestation of these changes is the increasingly frequent occurrence of heat waves [2,3], which will not only be more numerous in the decades to come, but also be longer and more intense [4,5,6,7]. The consequence of unfavourable thermal conditions during heat waves, high air temperature not only during the day, but also during the night, is an increase in the number of deaths, in particular among the elderly [8,9]. The most aggravating weather situations include the so-called tropical days and nights when the maximum temperature exceeds 30 °C, and the minimum night temperature is 20 °C [10]. This situation hinders human body regeneration at night and contributes to an excessive load on the body’s performance [11]. The increase in the level of medical care observed in recent years and the change in people’s behaviour influence the gradual decrease in mortality related to high air temperature [12].
Relatively few studies in climatological literature are devoted to the occurrence of characteristic nights in Poland and neighbouring countries and their circulation conditions. According to Bielec-Bąkowska and Piotrowicz [13], this is due to their relatively rare occurrence. One of the first studies on the nights from the analysed area was Chełchowski’s work [14] on the occurrence of tropical nights in Poland and the work of Chełchowski et al. [15] on tropical nights in Poland and Czechoslovakia in the years 1951–1965. In the first of his works, the author pointed to the unique summer of 1963, during which the first nights in the post-war period were recorded in Warszawa. Hot nights in that summer were also recorded in other regions of the country, particularly at the end of July and in the beginning of August. Bielec-Bąkowska and Piotrowicz [13] presented a more extensive description of the occurrence of hot nights in Poland, based on data from the period 1951–2006. According to the authors, the number of such nights since the 1980s has been gradually increasing. They do not occur every year, but are considerably more frequent than in the 1950s, 1960s, and 1970s. In turn, other studies describe the occurrence of hot or tropical nights, among others, in Krakow [16,17], Warszawa [18], Lublin [19], as well as in Northwestern Poland [20] and on the coast of the Baltic Sea [21]. On the other hand, Kundzewicz and Huang [22] conducted a detailed analysis of the occurrence of characteristic days and nights in Potsdam.
The occurrence of extreme air temperature values should be discussed in the context of circulation conditions because atmospheric circulation is considered one of the most important factors influencing weather and climate conditions in moderate latitudes [23,24]. It has been repeatedly pointed out that extreme values of air temperature, including heat and frost waves, occur with anticyclonic circulation. Of particular importance here are strong highs blocking the zonal circulation [2,3,25], which in recent decades have been increasingly occurring over Europe [26,27,28].
Bearing in mind the increasing frequency of high air temperatures, as well as a high risk to human health and life that is associated with the occurrence of hot nights, and in particular waves of hot nights, the presented results may be useful for a wide and diverse group of readers. Therefore, it seems reasonable to adopt the following research objectives:
- determining the temporal and spatial variability of hot nights in Central Europe in 1966–2015;
- determining the circulation conditions of the occurrence of waves of hot nights by analysing the pressure conditions in the troposphere during their occurrence as well as in the days preceding their occurrence.
2. Data and Research Methods
The basis of the study were the daily values of the minimum air temperature (Tmin) for 40 stations located in Germany and Poland from the period 1966–2016 (in two stations—Kassel, and Elbląg; the available data included data for the multi-year period 1966–2013) (Figure 1). The data were provided by the Institute of Meteorology and Water Management—National Research Institute and Deutscher Wetterdienst.
On the basis of the aforementioned data, hot nights were determined, from which sequences of at least 3 hot nights, in other words, waves of hot nights, were established next. The literature on the subject distinguishes several categories of nights defined on the basis of thermal conditions, e.g., warm (Tmin > 15 °C [22]), very warm (Tmin > 18 °C [18,20,21]) and tropical nights (Tmin > 20 °C [21,29,30]). In this paper, for the sake of simplicity, a hot night was defined as a day with the minimum air temperature above 18 °C.
The trends of changes concerning hot nights were determined using the non-parametric Mann-Kendall test applied to analyse the data from the non-normal distribution, and their statistical significance was evaluated by the Sen’s method at the level of α = 0.05.
The next stage involved the analysis of the pressure conditions causing the occurrence of hot nights in the studied period. In order to eliminate individual cases occurring in the few stations, only sequences of at least 3 hot nights were selected, which occurred at least in 20% of the stations.
The analysis of pressure conditions used daily values of atmospheric pressure at the sea level, with the following isobaric surfaces (1000, 925, 850, 700, 600, 500, 400, 300, 250, 200, 150, and 70 hPa) and air temperatures at the indicated levels. Data from 2.5° × 2.5° grid points for the 25–75° N and 35° W–65° E area were taken from the National Center for Environmental Prediction/National Center for Atmospheric Research (NCEP/NCAR) Reanalysis [31], which are available in the archives of the NOAA Earth System Research Laboratory’s Physical Science Division (ESRL PSD).
Based on the aforementioned data, cross-sections through the troposphere (from 1000 hPa to 70 hPa) were plotted with anomalies of geopotential heights and air temperatures along three meridians (10, 15, and 20° E) and one parallel (52.5° N). Subsequently, the maps of mean sea level pressure (SLP) and isobaric surface of 300 hPa (z300 hPa) and anomaly maps for the above-mentioned parameters and air temperature at the isobaric surface of 850 hPa (T850) were plotted for all waves of hot nights. In the next stage, the circulation types were established by grouping individual waves of hot nights in terms of SLP, using the minimum variance method, known as the Ward’s method [32]. This method is based on Euclidean distances, and its essence is merging the pair of clusters A and B, which, after merging, provides the minimum of the sum of squares of all objects’ deviations from the newly created cluster’s centre of gravity [32]. In order to achieve this, the standardised SLP values were used. The standardisation was made to deseasonalize the observations, simultaneously keeping the intensity of pressure field [33]. The grouping methods, among others, Ward’s method, are often applied in climatology, e.g., with distinguishing seasons and climatic regions, and identifying weather types [2,34]. For the determined types, there were mean SLP, z300 hPa and T850 maps drawn, together with the maps of anomalies. Then, SLP, z300, T850 and anomalies maps, averaged for the distinguished types, were plotted on the days preceding the occurrence of hot nights. All anomalies were calculated as a difference between a given day’s average value for SLP, isobaric surface heights and the air temperature at such levels on the one hand, and on the other hand the average value of the aforementioned elements on a given day in the studied multi-annual period.
3. Results
In the years 1966–2015, a large spatial variation in the occurrence of hot nights was found in the studied area. Their average number in the season ranged from less than 1 in Hof to 7 in Zielona Góra. The number of hot nights was characterized by high year-to-year variability. In a large area, the variability was similar, as evidenced by the value of standard deviation ranging from 1 to 2 days. Among the years with the highest number of hot nights, we should distinguish the summer seasons of 2010 (mainly the area of Poland), 2015 (the southern regions of Germany and Poland) and 1994 (mainly the area of Germany) (Figure 2). In 2010, the analysed nights were most frequent in Warszawa (22 cases), while not one night was recorded only in Bamberg. The conducted research showed an increase in the number of hot nights in the analysed multi-year period, and these changes were statistically significant in over 60% of stations. The largest increase in hot nights occurred in Frankfurt (1.9 nights/10 years). An equally high increase (>1 night/10 years) was found in Central Poland. A clear increase in the frequency of hot nights was visible from the beginning of the 21st century, and in as many as 70% of stations, their maximum number was recorded in the seasons after 2000.
In the analysed multi-year period, hot nights occurred every month of the summer season (Figure 3). In most stations (in 35 of the 40 stations), the most of the considered nights occurred in July. At individual stations, these nights constituted from 41% (Racibórz) to 66% (Kielce) of all hot nights. At four stations (Arkona, Hof, Rzeszów, and Świnoujście), the most hot nights were recorded in August, while in one station (Schleswig), the nights occurred with the same frequency in July and August.
Hot nights were most often recorded as individual cases, and their number ranged from 10 in Hof to 120 in Elbląg (Figure 4). The single nights constituted from 24% in Arkona to 71% in Hof of all hot nights recorded. The sequences of several nights in a row were much less frequent. At as many as 30% of the stations, there were waves lasting 7 nights or longer recorded. The longest wave occurred in Arkona and lasted for 22 nights, from August 7 to August 28, 1997. Apart from the seaside station, equally long waves (>10 nights) were found in Zielona Góra (24 July–7 August, 1994) and in Frankfurt (3–14 August, 2003).
The maximum Tmin values in the analysed period were very diverse in the studied area (Figure 5). Only in one station, the highest Tmin value was <20 °C and it was 19.9 °C in Hof (7 August, 2015). In other stations, Tmin was higher and its maximum was 24.4 °C in Hamburg (28 July, 1994). In 70% of stations, the highest Tmin occurred in July, and in 25% of stations, the highest Tmin occurred in August. Among the years in which the highest Tmin was recorded the most frequently, one should mention the summer seasons of 1994 (Northern Germany), 2007 (Southeastern Poland) and 2010 (Northern Poland, and Central Germany).
Over the majority of the continent, during the occurrence of waves of hot nights, a higher settlement of isobaric levels was noted. The largest anomalies of geopotential heights occurred at the level of 250 hPa, with the maximum along the meridian of 20° E (>180 m) (Figure 6). The centre of these anomalies covered the northern regions of Poland. In the air column below the centre of the positive geopotential anomalies, with slight shift to the south, positive air temperature anomalies were recorded, which affected the majority of the continent. The centre of the highest anomalies occurred over an area stretching between 50 and 55° N and 13 and 23° E, with a maximum at the lowest isobaric levels, 1000–850 hPa, where they exceeded a maximum of 6 °C. In turn, in the upper troposphere (above the level of 250 hPa), there were negative air temperature anomalies. At the centre of these anomalies, the air temperature was lower by more than 4 °C. Such distribution of anomalies is characteristic of the circulation of air masses within the high-pressure area. The horizontal convergence of the air masses in the upper part of the high-pressure area causes adiabatic cooling and results in negative air temperature anomalies, while the positive anomalies in its lower part are a consequence of settlement of the air masses activating adiabatic heating.
The occurrence of waves of hot nights in Central Europe was associated on average with an extensive ridge of high pressure lying across the Euro-Atlantic sector, and associated with the Azores High. Within the indicated system, a local high-pressure area was developed with its centre located northeast of the studied area (>1017 hPa) (Figure 7). The SLP was higher than the average over the majority of Central, Northern and Eastern Europe in the analysed days. The centre of positive anomalies was located over the Gulf of Finland (>4 hPa). At the same time, the majority of Western and Southern Europe remained within the range of the SLP negative anomalies. Over the analysed area, anomalies ranged from <−1 hPa in the west to >2 hPa in the north-east. Contour lines of isobaric surface of 300 hPa over Central Europe bent northward which indicates its clear elevation. In the analysed cases, z300 hPa surface over the aforementioned area settled at a height of >160 m at maximum. Higher settlement of 300 hPa indicates the presence of warm air masses, which is also confirmed by the T850 anomalies. At the centre of these anomalies, located over Central Poland, the temperature was higher by more than 6 °C.
The above-mentioned description of the pressure conditions applies only to the situation averaged for all analysed cases. Further research showed that the occurrence of the waves of hot nights in Central Europe was associated with two types of circulation (Figure 8). In both separate types, the occurrence of the analysed nights was related to high-pressure systems. In type 1 (58% of cases) over Central and Eastern Europe, there was a local high-pressure area (>1016 hPa), developed within the ridge of high pressure stretching from the Azores High. In the analysed type, the SLP anomaly field was significantly diversified; over Eastern Europe, the centre of positive anomalies (>3 hPa) could be found, and the centre of negative anomalies was over the Atlantic Ocean (<−4 hPa). Over the study area, the anomalies ranged from <−1 hPa in the western regions of the studied area to 2 hPa in the eastern regions. On the other hand, in type 2 (42% of cases), over the majority of the area, there was a high-pressure area with its centre over Northern Europe (>1019 hPa), which, with the ridge of Azores High, created an area of higher pressure over Northern and Western Europe. In the centre of the system, SLP was higher by more than 7 hPa. Over the research area, the anomalies ranged from <−2 hPa in the south of Germany to 3 hPa in Northeastern Poland. In both types, the 300 hPa contour lines were clearly bent northwards over Central Europe, and the area under study was in the range of positive anomalies. In type 2, anomalies of z300 hPa were larger than in type 1, towards which they were shifted north. The described types of circulation caused the advection of warm air masses over Central Europe. In both types 1 and 2, the T850 anomaly centre (>6 °C) settled over Poland, although it settled over the south-western and northern regions of Poland for these two types, respectively.
The distinguished circulation types differed not only in pressure systems during the occurrence of waves of hot nights, but also in the preceding days. In type 1, the beginning of anomaly formation at the isobaric level of 300 hPa was recorded on average 9 days before the occurrence of waves of hot nights in the studied area (Figure 9). Their formation was recorded over the Atlantic Ocean, which is to the south of the Azores Islands. In the following days, the centre of the anomalies shifted towards the south-east, while getting stronger. The day before the start of the waves, the centre was located over Eastern Germany (>160 m), and on the first day of the waves over Northwestern Poland (>180 m). At the same time, over the Atlantic Ocean, these were centres of negative anomalies which also covered western regions of the continent. Similarly, at the sea level, two anomaly systems were recorded. A clear centre of positive anomalies over Central Europe began to form about 5 days before the start of the waves. In turn, over the western regions of the continent and the ocean, there were negative anomalies. On the first day of the waves of hot nights, the centre of positive anomalies was located in Northeast Poland (>5 hPa), and the centre of negative ones was located over the Atlantic, in Southwest Ireland (<−5 hPa). The described pressure situation generated the advection of warm air masses from the south-west sector, as indicated by the pattern of movement of T850 anomalies. On the first day of the waves, in the centre of the anomalies, located over Eastern Germany, the air temperature was higher by more than 7.0 °C.
In type 2, z300 hPa anomalies, on average, formed approximately 6 days before the occurrence of waves of hot nights in Central Europe (Figure 10). As in type 1, they developed over the Atlantic Ocean, although the source area was shifted north, over 50° N. In the following days, the anomaly centre moved to the east and then to the north-east. Approximately 3 days before the start of the waves, the centre of the anomalies was located in the region of the Baltic Sea and Scandinavia, where it was intensively strengthening. On the first day of the waves, the anomalies of z300 hPa in the centre of the system were >220 m and settled over the Baltic Sea. Simultaneously, the southern and western regions of the continent were within the range of small negative anomalies. At the sea level, similarly, the system of anomalies moved from the west. The SLP anomaly’s pattern of movement was similar to z300 hPa anomaly’s pattern, although the entire system was shifted to the east. On the first day of the waves, the centre of the SLP anomaly was located over the Gulf of Finland (>9 hPa). The research area (apart from Southwest Germany) was covered by SLP positive anomalies, which were at most over 6 hPa over Northeastern Poland. The system of T850 positive anomalies, which strengthened with the additional advection of air masses from the south-west and south-east, moved from over the ocean. On the first day of the waves, the centre of the anomalies settled over Northern Poland and the Southern Baltic Sea (>6 °C).
4. Discussion and Summary
The increase in air temperature demonstrated in earlier studies [2,22,35,36] has translated into the more frequent occurrence of hot nights. In most stations, the recorded changes were statistically significant. A clear increase in the hot nights took place in the 21st century, a manifestation of which was the occurrence of the maximum seasonal number of hot nights after 2000 over the majority of the area. The increase in the number of hot nights has been also indicated in previous surveys conducted in selected regions of Poland [16,20,21]. A similar trend of changes was also found in Germany [22], Romania [37], Latvia [38] and the Carpathian Basin [39]. Based on forecasts of air temperature changes [40] in the following decades, one can expect a further increase in the frequency of hot nights.
The research carried out showed that the occurrence of waves of hot nights in Central Europe was associated on average with a ridge of high pressure, within which a local high-pressure area developed. According to detailed analysis, there were two types of circulation during the occurrence of the discussed waves, resulting in the advection of warm air masses over the research area. As Ustrnul et al. [41] indicated, the occurrence of the highest temperatures in Poland is connected to the anticyclone situation with no clear advection, and a blurred pressure field often occurring over Poland. Numerous studies on circulation determinants of heat waves in Central Europe or Poland have pointed to the presence of high-pressure systems blocking the zonal circulation, over the research area or the Scandinavian Peninsula [2,3,36,42]. Additionally, in other regions of Europe, it was shown that extreme air temperature values were caused by the presence of strong high-pressure systems [43,44,45]. According to Bednorz et al. [46], the anomalies of the daily Tmax and Tmin in Poland values are positively correlated with the values of SLP and z500 hPa over Central and Western Europe. Tmin values, however, are less dependent on the pressure fields than the maximum daily values. This suggests that the daily minimum temperature is less associated with the regional circulation patterns than the daily maximum temperature and more influenced by the local factors, instead.
The described pressure situations caused the advection of warm air masses primarily from the south-west sector, which made the air temperature during the waves of hot nights higher than the average temperature. The obtained results coincide with earlier studies, in which the occurrence of hot nights was found with not only the advection of mainly tropical, but also polar air [13,20,21].
During the occurrence of waves of hot nights, the largest anomalies of geopotential heights were recorded in the upper troposphere. The presented results are consistent with the results of research on circulation conditions of heat waves in China and Western Eurasia [47,48,49], in which the maximum anomalies of heights of isobaric surfaces in the upper troposphere were also indicated. The time of formation of anomalies and their pattern of movement were different for separate types of circulation. In type 1, z300 hPa anomalies on average formed 9 days before the occurrence of waves in Central Europe, and in type 2, it forms 6 days before the occurrence of waves. Similarly, Qian et al. [47] proved that formation of disturbances in the upper troposphere begins approximately 9 days before the occurrence of heat waves in Eastern China.
Funding
This work was supported by the Polish National Science Centre under grant number: UMO–2017/24/C/ST10/00109.
Conflicts of Interest
The author declares no conflicts of interest.
References
- IPCC. Climate Change 2013: The Physical Science Basis. Contribution of Working Group I to the Fifth Assessment Report of the Intergovernmental Panel in Climate Change; Cambridge University Press: Cambridge, UK, 2013. [Google Scholar]
- Tomczyk, A.M.; Bednorz, E. Heat waves in Central Europe and their circulation conditions. Int. J. Climatol. 2016, 36, 770–782. [Google Scholar] [CrossRef]
- Wibig, J. Heat waves in Poland in the period 1951–2015: Trends, patterns and driving factors. Meteorol. Hydrol. Water Manag. 2018, 6, 37–45. [Google Scholar] [CrossRef]
- Koffi, B.; Koffi, E. Heat waves across Europe by the end of the 21st century: Multiregional climate simulations. Clim. Res. 2008, 36, 153–168. [Google Scholar] [CrossRef]
- Pongrácz, R.; Bartholy, J.; Bartha, E.B. Analysis of projected changes in the occurrence of heat waves in Hungary. Adv. Geosci. 2013, 35, 115–122. [Google Scholar] [CrossRef] [Green Version]
- Zacharias, S.; Koppe, C.; Mücke, H.-G. Climate change effects on heat waves and future heat wave-associated IHD mortality in Germany. Climate 2015, 3, 100–117. [Google Scholar] [CrossRef]
- Muthers, S.; Laschewski, G.; Matzarakis, A. The Summers 2003 and 2015 in South-West Germany: Heat Waves and Heat-Related Mortality in the Context of Climate Change. Atmosphere 2017, 8, 224. [Google Scholar] [CrossRef]
- Anderson, B.G.; Bell, M.L. Weather-related mortality: How heat, cold, and heat waves affect mortality in the United States. Epidemiology 2009, 20, 205–213. [Google Scholar] [CrossRef]
- Gasparrini, A.; Armstrong, B. The impact of heat waves on mortality. Epidemiology 2012, 22, 68–73. [Google Scholar] [CrossRef]
- Twardosz, R. Fale niezwykłych upałów w Europie na początku XXI wieku. Prz. Geofiz. 2009, 54, 3–4. [Google Scholar]
- Hajat, S.; Kovats, R.S.; Atkinson, R.W.; Haines, A. Impact of hot temperatures on death in London: A time series approach. J. Epidemiol. Community Health 2002, 56, 367–372. [Google Scholar] [CrossRef]
- Miron, I.J.; Linares, C.; Montero, J.C.; Cradio-Alvarez, J.J.; Diaz, J. Changes in cause-specific mortality during heat waves in central Spain, 1975–2008. Int. J. Biometeorol. 2015, 59, 1213–1222. [Google Scholar] [CrossRef]
- Bielec-Bąkowska, Z.; Piotrowicz, K. Extreme temperatures in Poland 1951–2006. Prz. Geogr. 2013, 132, 59–98. [Google Scholar]
- Chełchowski, W. Jeszcze o nocach gorących w Polsce. Gaz. Obs. IMGW 1967, 9, 3–6. [Google Scholar]
- Chełchowski, W.; Coufal, L.; Valovič, Š. Noce gorące w Czechosłowacji i Polsce na tle cyrkulacji atmosferycznej i charakteru podłoża. Prace PIHM 1970, 100, 185–193. [Google Scholar]
- Piotrowicz, K. Wieloletnie zróżnicowanie nocy gorących w Krakowie. In Wahania Klimatu w Różnych Skalach Przestrzennych i Czasowych; Piotrowicz, K., Twardosz, R., Eds.; IGiGPUJ: Kraków, Poland, 2007; pp. 279–286. [Google Scholar]
- Matuszko, D.; Piotrowicz, K. Long-term variability of meteotropic situations in Kraków. Prz. Geogr. 2012, 84, 413–422. [Google Scholar] [CrossRef]
- Kossowska-Cezak, U. Zmiany wieloletnie liczby termicznych dni charakterystycznych w Warszawie (1951–2010). Prace Geogr. 2014, 136, 9–30. [Google Scholar]
- Bartoszek, K.; Węgrzyn, A.; Sienkiewicz, E. Częstość występowania i uwarunkowania cyrkulacyjne nocy ciepłych, bardzo ciepłych oraz gorących w okolicach Lublina i Nałęczowa. Prz. Nauk. Inż. Kształt. Śr. 2014, 66, 410–420. [Google Scholar]
- Więcław, M. Bardzo ciepłe i gorące noce w północno-zachodniej Polsce. J. Educ. Health Sport 2015, 5, 31–40. [Google Scholar]
- Tomczyk, A.M. Very warm nights in Polish coastal area of the Baltic Sea. Geogr. Pol. 2015, 88, 493–502. [Google Scholar] [CrossRef]
- Kundzewicz, Z.W.; Huang, S. Seasonal temperature extremes in Potsdam. Acta Geophys. 2010, 58, 1115–1133. [Google Scholar] [CrossRef]
- Niedźwiedź, T. Sytuacje Synoptyczne i ich Wpływ na Zróznicowanie Przestrzenne Wybranych Elementów Klimatu w Dorzeczu Górnej Wisły; Series No. 58; Rozprawy Habilitacyjne Uniwersytetu Jagiellońskiego: Kraków, Poland, 1981. [Google Scholar]
- Yarnal, B. Synoptic Climatology in Environmental Analysis; Belhaven Press: London, UK, 1993. [Google Scholar]
- Porębska, M.; Zdune, M. Analysis of extreme temperature events in Central Europe related to high pressure blocking situations in 2001–2011. Meteorol. Z. 2013, 22, 533–540. [Google Scholar] [CrossRef]
- Leckebusch, G.C.; Ulbrich, U. On the relationship between cyclones and extreme windstorms over Europe under climate change. Glob. Planet. Chang. 2004, 44, 181–193. [Google Scholar] [CrossRef]
- Leckebusch, G.C.; Weimer, A.; Pinto, J.G.; Reyers, M.; Speth, P. Extreme wind storms over Europe in present and future climate: A cluster analysis approach. Meteorol. Z. 2008, 17, 67–82. [Google Scholar] [CrossRef]
- Bielec-Bąkowska, Z. Strong anticyclones over Europe (1951–2010). In Proceedings of the IGU 2014 Regional Conference, Kraków, Poland, 18–22 August 2014. [Google Scholar]
- Zaninovic, K.; Matzarakis, A. The biometeorological leaflet as a means conveying climatological information to tourists and the tourism industry. Int. J. Biometeorol. 2009, 53, 369–374. [Google Scholar] [CrossRef] [PubMed]
- Gabriel, K.M.A.; Endlicher, W.R. Urban and rural mortality rates during heat waves in Berlin and Brandenburg, Germany. Environ. Pollut. 2011, 159, 2044–2050. [Google Scholar] [CrossRef] [PubMed]
- Kalnay, E.; Kanamistu, M.; Kistler, R.; Collins, W.; Deaven, D.; Gandin, L.; Iredell, M.; Saha, S.; White, G.; Woollen, J.; et al. The NMC/NCAR 40—Year Reanalysis Project. Bull. Am. Meteorol. Soc. 1996, 77, 437–471. [Google Scholar] [CrossRef]
- Ward, J.H. Hierarchical grouping to optimize an objective function. J. Am. Stat. Assoc. 1963, 58, 236–244. [Google Scholar] [CrossRef]
- Esteban, P.; Jones, P.D.; Martin-Vide, J.; Mases, M. Atmospheric circulation patterns related to heavy snowfall days in Andorra, Pyrenees. Int. J. Climatol. 2005, 25, 319–329. [Google Scholar] [CrossRef] [Green Version]
- Bednorz, E. Synoptic conditions of snow occurrence in Budapest. Meteorol. Z. 2008, 17, 39–45. [Google Scholar] [CrossRef]
- Owczarek, M.; Filipiak, J. Contemporary changes of thermal conditions in Poland, 1951–2015. Bull. Geogr. Phys. Geogr. Ser. 2016, 10, 31–50. [Google Scholar] [CrossRef]
- Tomczyk, A.M.; Sulikowska, A. Heat waves in lowland Germany and their circulation-related conditions. Meteorol. Atmos. Phys. 2018, 130, 499–515. [Google Scholar] [CrossRef]
- Croitoru, A.E.; Piticar, A. Changes in daily extreme temperatures in the extra-Carpathians regions of Romania. Int. J. Climatol. 2013, 33, 1987–2001. [Google Scholar] [CrossRef]
- Avotniece, Z.; Klavins, M.; Rodinov, V. Changes of extreme climate events in Latvia. Environ. Clim. Technol. 2013, 9, 4–11. [Google Scholar] [CrossRef]
- Bartholy, J.; Pongrácz, R. Regional analysis of extreme temperature and precipitation indices for the Carpathian Basin from 1946 to 2001. Glob. Planet. Chang. 2007, 57, 83–95. [Google Scholar] [CrossRef]
- Piniewski, M.; Mezghani, A.; Szcześniak, M.; Kundzewicz, Z. Regional projections of temperature and precipitation changes: Robustness and uncertainty aspects. Meteorol. Z. 2017, 26, 223–234. [Google Scholar] [CrossRef]
- Ustrnul, Z.; Czekierda, D.; Wypych, A. Extreme values of air temperature in Poland according to different atmospheric circulation classifications. Phys. Chem. Earth 2010, 35, 429–436. [Google Scholar] [CrossRef]
- Bartoszek, K.; Krzyżewska, A. The atmospheric circulation conditions of the occurrence of heatwaves in Lublin, southeast Poland. Weather 2017, 72, 176–180. [Google Scholar] [CrossRef]
- Founda, D.; Giannakopoulos, C. The exceptionally hot summer of 2007 in Athens, Greece—A typical summer in the future climate? Glob. Planet. Chang. 2009, 67, 227–236. [Google Scholar] [CrossRef]
- Unkašević, M.; Tošić, I. Seasonal analysis of cold and heat waves in Serbia during the period 1949–2012. Theor. Appl. Climatol. 2015, 120, 29–40. [Google Scholar] [CrossRef]
- Tomczyk, A.M.; Półrolniczak, M.; Bednorz, E. Circulation Conditions’ Effect on the Occurrence of Heat Waves in Western and Southwestern Europe. Atmosphere 2017, 8, 31. [Google Scholar] [CrossRef]
- Bednorz, E.; Czernecki, B.; Tomczyk, A.M.; Półrolniczak, M. If not NAO then what?—Regional circulation patterns governing summer air temperatures in Poland. Theor. Appl. Climatol. 2018, 1–13. [Google Scholar] [CrossRef]
- Qian, W.H.; Yu, T.T.; Du, J. A unified approach to trace surface heat and cold events by using height anomaly. Clim. Dyn. 2016, 46, 1647–1664. [Google Scholar] [CrossRef]
- Qian, W.; Wu, K.; Cheuk-Hin Leung, J. Three-dimensional structure and long-term trend of heat wave events in western Eurasia revealed with an anomaly-based approach. Int. J. Climatol. 2016, 36, 4315–4326. [Google Scholar] [CrossRef]
- Chen, Y.; Hu, Q.; Yang, Y.; Qian, W. Anomaly based analysis of extreme heat waves in Eastern China during 1981–2013. Int. J. Climatol. 2016. [Google Scholar] [CrossRef]
Figure 1.
Location of meteorological stations.
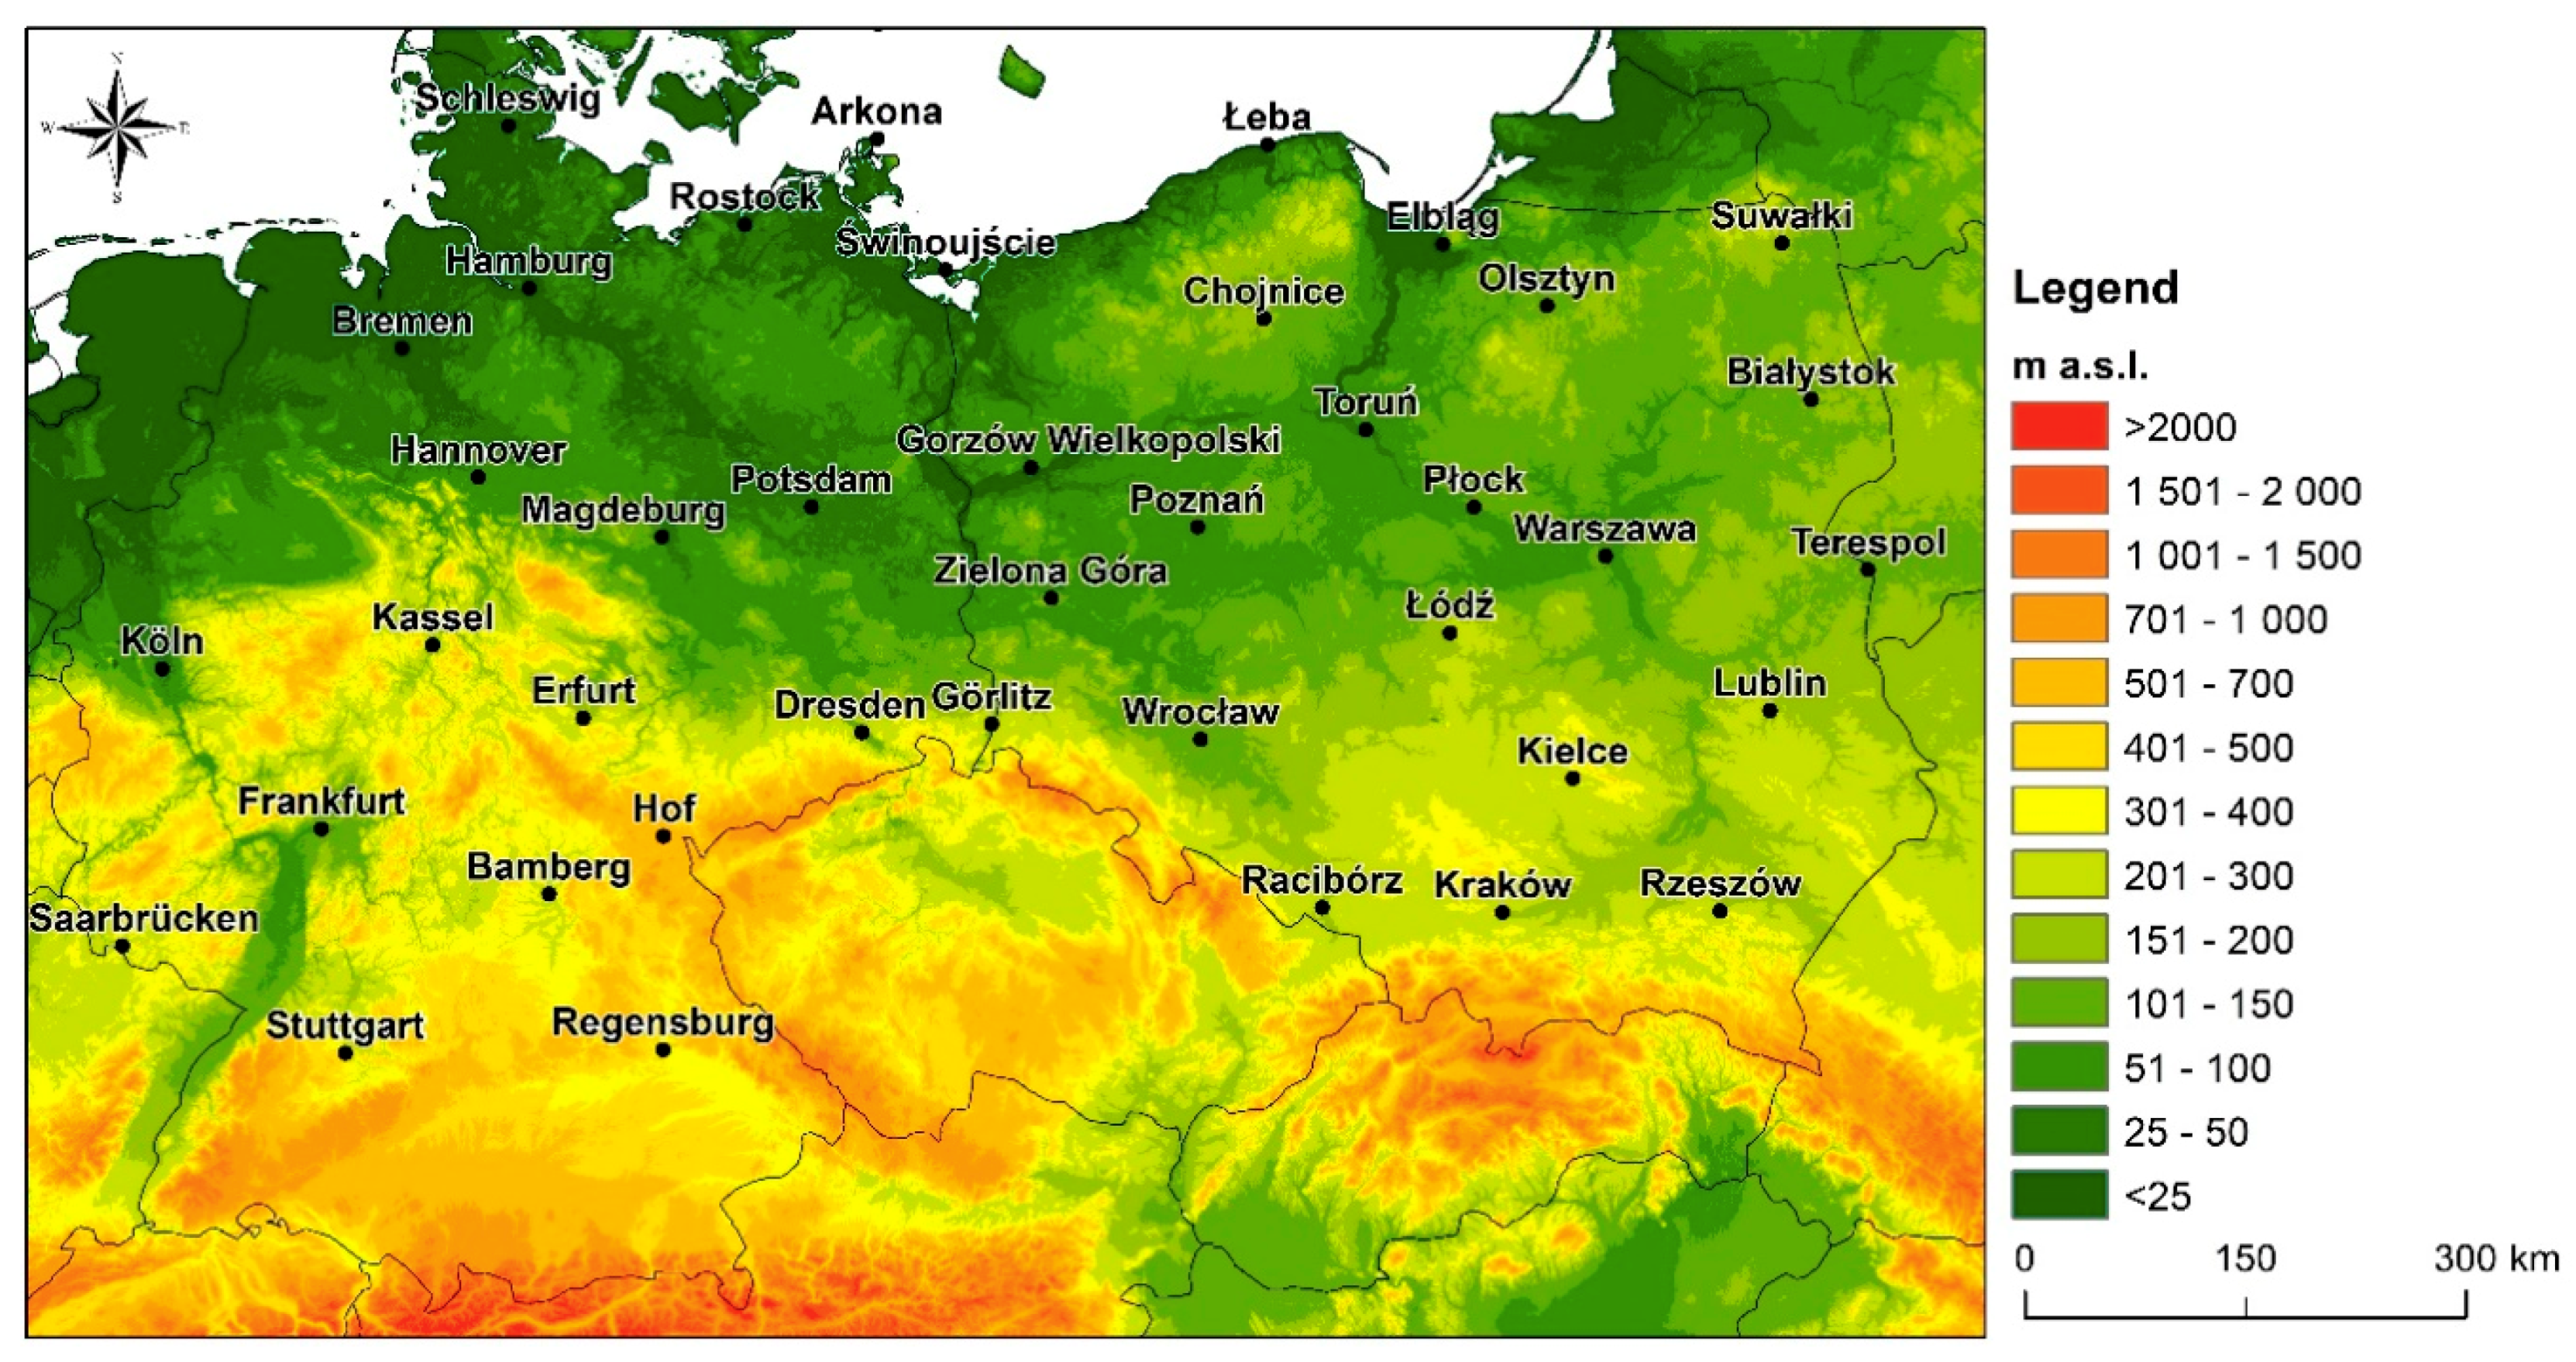
Figure 2.
Number of hot nights in the summer in the period 1966–2015 in selected stations.

Figure 3.
Number of hot nights by month of occurrence in the summers (June–August) 1966–2015 (* stations with a shorter measurement series 1966–2013).
Figure 3.
Number of hot nights by month of occurrence in the summers (June–August) 1966–2015 (* stations with a shorter measurement series 1966–2013).

Figure 4.
Number of hot nights by duration in the summers (June–August) 1966–2015 (* stations with a shorter measurement series 1966–2013).
Figure 4.
Number of hot nights by duration in the summers (June–August) 1966–2015 (* stations with a shorter measurement series 1966–2013).

Figure 5.
Highest daily Tmin recorded during (June–August) hot nights in the summers 1966–2015 with the date of its occurrence.
Figure 5.
Highest daily Tmin recorded during (June–August) hot nights in the summers 1966–2015 with the date of its occurrence.

Figure 6.
Vertical cross-sections through the troposphere with mean anomalies of heights of isobaric surfaces (black lines) and air temperatures (colour scale) along meridians 10, 15, and 20° E (a–c) and a circle of latitude 52.5° N; (d) during the analysed waves of hot nights.
Figure 6.
Vertical cross-sections through the troposphere with mean anomalies of heights of isobaric surfaces (black lines) and air temperatures (colour scale) along meridians 10, 15, and 20° E (a–c) and a circle of latitude 52.5° N; (d) during the analysed waves of hot nights.

Figure 7.
Mean SLP (black lines) and z300 hPa (colour shades) (a); anomalies of SLP (black lines) and z300 hPa (colour shades) (b); and anomalies of T850 (colour shades) (c) during the analysed waves of hot nights.
Figure 7.
Mean SLP (black lines) and z300 hPa (colour shades) (a); anomalies of SLP (black lines) and z300 hPa (colour shades) (b); and anomalies of T850 (colour shades) (c) during the analysed waves of hot nights.

Figure 8.
Mean SLP (black lines) and z300 hPa (colour shades) (a); anomalies of SLP (black lines) and z300 hPa (colour shades) (b); and anomalies of T850 (colour shades) (c) during the analysed waves of hot nights for types 1 and 2.
Figure 8.
Mean SLP (black lines) and z300 hPa (colour shades) (a); anomalies of SLP (black lines) and z300 hPa (colour shades) (b); and anomalies of T850 (colour shades) (c) during the analysed waves of hot nights for types 1 and 2.

Figure 9.
Mean anomalies of z300 hPa (colour shades) and SLP (black lines) (left column) and mean anomalies of T850 (colour shades) (right column) on days preceding the commencement of waves of hot nights over Central Europe and on their first day ((a): 9 days before the commencement of the waves; (b): 7 days before; (c): 5 days before; (d): 3 days before; (e): 1 day of waves of hot nights) for type 1.

Figure 10.
Mean anomalies of z300 hPa (colour shades) and SLP (black lines) (left column) and mean anomalies of T850 (colour shades) (right column) on days preceding the commencement of waves of hot nights over Central Europe and on their first day ((a): 6 days before the commencement of the waves; (b) 4 days before; (c) 2 days before; (d) 1 day of waves of hot nights) for type 2.

© 2018 by the author. Licensee MDPI, Basel, Switzerland. This article is an open access article distributed under the terms and conditions of the Creative Commons Attribution (CC BY) license (http://creativecommons.org/licenses/by/4.0/).
Share and Cite
MDPI and ACS Style
Tomczyk, A.M. Impact of Atmospheric Circulation on the Occurrence of Hot Nights in Central Europe. Atmosphere 2018, 9, 474. https://doi.org/10.3390/atmos9120474
AMA Style
Tomczyk AM. Impact of Atmospheric Circulation on the Occurrence of Hot Nights in Central Europe. Atmosphere. 2018; 9(12):474. https://doi.org/10.3390/atmos9120474
Chicago/Turabian StyleTomczyk, Arkadiusz Marek. 2018. "Impact of Atmospheric Circulation on the Occurrence of Hot Nights in Central Europe" Atmosphere 9, no. 12: 474. https://doi.org/10.3390/atmos9120474
Note that from the first issue of 2016, this journal uses article numbers instead of page numbers. See further details here.