Abstract
The paper investigates the distribution properties of measurement series of river water temperatures for the lowland River Noteć and its tributaries (Western Poland), as well as air temperatures at different data time resolution levels (1987–2013). The aspect of distribution normality was examined in quantile plots, the series’ stationarity was assessed with an augmented Dickey-Fuller test, while autocorrelation was studied using an Autoregressive Integrated Moving Average (ARIMA) model. It was demonstrated that distributions of river water and air temperature series at different levels of analyses are generally close to normal but also display a certain skewness. Both daily temperature measurement series are stationary series. The periodic component accounts for about 93% (water temperature) and 77% (air temperature) of the daily variability of the variable, while the random factor equals 6–7% and 22%, respectively. The Autoregressive Integrated Moving Average (ARIMA) model confirmed a clear annual seasonality in temperature distribution and indicated the long memory of the autoregressive process AR (2–4). The temperature prediction performed on the basis of a 4th-order Fourier series is consistent with the course of historical data. In the multiannual period 1987–2013, particularly high maximum temperatures were recorded for the Upper Noteć in the summer half-years (28.4 °C); these are related to anthropogenic factors and increase the threat to the existence of cyprinids and salmonids. The thermal anomalies identified in the River Noteć clearly point to the necessity of intensifying the monitoring of its waters.
1. Introduction
Similar to all other features of the river regime, the temperature of water is shaped under the influence of the climate and the natural environment, undergoing daily, seasonal, annual and multiannual changes. Its seasonal changes, similar to those of flow, are the natural consequence of the climatic conditions predominant in a given geographical zone, whereas multiannual changes may point to environmental changes occurring on a wider scale. River flow and water temperature are indicators of changes in the hydrological cycle [1,2]. In rivers of the Northern Hemisphere functioning in the moderate climate zone, we are observing the effects of the seasonality of the hydrological cycle, which manifest themselves in the occurrence of phases of freshets and low waters that differ in terms of river supply conditions and the scope of variability of extreme states and the quantity of river run-off [3]. The effects of the seasonal occurrence of floods and droughts constitute a potential threat. A measurable index of seasonality indicates changes in the thermal conditions of waters. Low water temperatures contribute to the appearance of ice phenomena on rivers. In the Northern Hemisphere, the effects of ice phenomena (icing of rivers, freezing and thawing) are observed in more than 60% of rivers, whereas the course and duration thereof are dependent on air temperature and water temperature [4]. Embacles and the floods that they cause, which occur in the winter and spring seasons, result in enormous economic losses and constitute a threat to human life. High positive temperatures of river waters in summer, accompanied by a limited rainfall supply and high evaporation, contribute to unfavourable geophysical and chemical changes in river waters, and speed up the process of eutrophication of waters. Seasonal changes in the hydrological and thermal characteristics of rivers also impact the ecological state of waters and environmental conditions. The variability of hydrometeorological factors impacts the river regime, but is also an element that shapes the dynamics of outflow of biogenes (nitrogen and phosphorus) from the catchment area, which are also characterised by a clear seasonal diversity [5,6,7,8]. The conditions under which a watercourse is supplied and the exchange of waters and biogenic substances takes place impact changes in the physical and chemical properties of waters, and in consequence the ecological state of waters [9]. In the moderate climate zone, the largest biogene loads reach rivers and lakes in the winter half-year period, with smaller ones in the summer half-year period, which also reflects changes in the thermal conditions of river waters [10].
The run-off regime and thermal conditions of river waters are influenced both by atmospheric precipitation and air temperature, the values of which point to a significant dependence on macroscale types of atmospheric circulation [3,11]. The importance of this change depends on the susceptibility of individual features of the regime to the changing climate [12]. Change tendencies in series of river run-offs and climatic data show that trends for annual run-off are frequently the result of changes in the value of atmospheric precipitation, whereas trends for seasonal and extreme run-offs are determined by changes in air temperature [13,14]. For the majority of the European continent, average annual air temperature increased in the 20th century by 0.8 °C [15]. Usually, a greater increase in temperature was observed in winter, not in summer, and this has translated into an increase in the temperature of river waters, thus leading to a limitation of the appearance of ice phenomena on rivers in the winter season. Research into river run-offs, which takes into consideration forecast changes in air temperature, has confirmed tendencies of change in the regime type and its stability under the impact of air temperature [12,16,17,18]. Changing climatic conditions may lead to a destabilisation of characteristics of the run-off regime and the thermal conditions of river waters, causing them to transform into a different type of regime, with clearly different regularities concerning the seasonality of high and low waters and their temperatures [1]. This would result in the disruption of both determined hydrological and thermal conditions of rivers, and the utilisation of water. Significant and permanent changes in reference characteristics of water run-off and temperature are also caused by various forms of anthropogenic activity in catchment areas [6,19,20].
Of particular importance for assessing the structure and functioning of water ecosystems are the statistical distribution characteristics of water temperature, which are analysed on different time resolution levels and provide information concerning the maintenance or disruption of a watercourse’s thermal stability. Time series of river water temperatures [21,22] constitute the basis for identifying among others the normality of distribution of data series, stationarity (or non-stationarity), and autocorrelation [23]. The decomposition of time series characteristics into a systematic (trend, constant component, periodical fluctuations) and random component, of which the latter is related to the occurrence of a random factor, is a crucial element of research into thermal regime regularity. Long-term fluctuations of flowing water temperature are an identifier of the impact of climatic conditions and the seasonality of processes of river recharge and discharge on its temporal variability [24,25].
The temperature of flowing water is a good indicator of climate change; however, there are often no homogeneous measurement series, which to some extent limits the possibility of analysing its multiannual variation. Random occurrences and measurement series values which are atypical of the river water thermal regime appear due to various disturbances of its course. Usually, anthropogenic factors operating within a catchment, connected with the transformation and improper utilisation of the natural environment, have no more than an incidental impact. Changes in river water temperature are the result of, for example, the inflow of sewage, thermal pollutants, or hydromorphological changes occurring within the watercourse’s bed and valley [26,27,28]. River water temperature is also strongly modified by activities related to a catchment’s usage and river valley development [21,29]. The thermal regimes of river are also affected by changes in their thermal balance and in the thermal capacity of river bed systems. Many investigators have used the range of thermal variations as the most sensitive index of anthropogenic impact on river water [28,30].
In the analysis of river ecosystems and research into their dynamics, use is made of river water temperature fluctuation models, which are developed taking into consideration air temperature, recharge components, and environmental factors [31,32,33]. Assessments of relations between flowing water temperature, air temperature, and a river system’s thermal balance utilise stochastic and deterministic regression models [34,35]. For the purpose of predicting river water temperature, deterministic models use the energy balance, whereas the remaining two models are based on air temperature data [29,36]. Spatial analyses of river systems employ geostatic models [37] and regional neural networks [38], whereas for assessing the regularity of river thermal regime characteristics, use is made among others of the equilibrium temperature concept [39,40] and regional interrelations affected by latitude [41]. Spatial and temporal autocorrelation can cause estimation problems, which are confirmed by the research [26,34,42].
Water temperature is also considered as an important abiotic factor co-determining the optimal conditions for the existence and growth of organisms, and the retention of the ecological function of watercourses [26,42,43]. The thermal parameters of waters are an indicator of controlling processes occurring in aquatic systems, particularly those of freshwater fishes [44,45,46], and they also determine the risk level for the functioning of species sensitive to changes in water temperature [47,48]. Every increase in temperature can have serious consequences for the structure, functions and services of water ecosystems. The potential effects of a rise in river water temperature include a reduction in habitat for cold-water aquatic species, changes in ichthyofauna species, the increased sensitivity of certain organisms to toxins, a greater frequency of algal bloom, and the acceleration or deceleration of the self-purification of waters [44,49]. Prediction results are used in ecological indication. This means that the thermal conditions of waters and water temperature distribution characteristics may be indirectly used to provide information on the ecological condition of ecosystems, which is shaped under the influence of natural factors, and further modified by the impact of anthropogenic pressure. Under different thermal conditions of waters, and consequently in different development environments, there occurs differentiation of organisms of common origin, which indicates a different degree of their adaptation to the changing conditions of life (adaptive radiation) or occupying new ecospace thereby (evolutionary radiation). Identification models and river water temperature simulations are elaborated for fisheries management and also for managing streams and their watersheds [50].
This research involved analysis of the distribution of the measurement series of river water temperature on different time resolution levels: daily, monthly and annual in the multiannual period 1987–2013. The structure of water temperature time series and their properties, i.e., distribution normality, as well as stationarity and autocorrelation, have been presented in the example of the lowland River Noteć (3 measurement stations) and its two primary tributaries: the Drawa and the Gwda, which drain the area of Western Poland (the northern part of the Greater Poland Lowlands). The same distribution characteristics were elaborated for the air temperature time series which are measured at the Piła forecasting station, located in the Noteć catchment. The aim was to determine the types of air and flowing water temperature distributions, and their degree of similarity at selected measurement stations located on rivers. Further, the series were decomposed into additive components: the trend, the periodic factor, and the random factor, with an indication of the dominant element in the data series. The autoregressive Autoregressive Integrated Moving Average (ARIMA) model applied, with a seasonal component in the form of a Fourier series (the first four terms were included), made it possible to carry out a prediction of data for water and air thermals taking into account the cyclical character of temperature changes.
The information obtained can serve as a basis for interpreting the influence of water temperature on the formation of ice phenomena in the winter season, and for interpreting biological and biogeochemical processes taking place in rivers in the summer months. It may prove useful, for example, for determining thermal tolerance thresholds and assessing the risk of exceeding maximum values decisive for the existence of aquatic life in river ecosystems; this has been emphasised by others [38,48,51,52].
2. Materials and the Study Area
The degree of similarity in the distribution of the water temperature measurement series of the Noteć and its tributaries, and also their stationarity and autocorrelation characteristics, were determined at gauging points of the observation network of the Institute of Meteorology and Water Management—National Research Institute (IMGW-PIB Warsaw, Poland). Three water temperature measurement stations situated on the Noteć were selected: Pakość (upper reaches), Ujście (medium reaches), and Nowe Drezdenko (lower reaches), as well as stations located on two of its tributaries: Gwda (Piła) and Drawa (Drawiny), for which an uninterrupted daily observation series was available for the period 1987–2013 (Figure 1). Use was also made of daily air temperature data (1987–2013) obtained from the Piła forecasting station (IMGW-PIB).

Figure 1.
Location of the Noteć catchment and distribution of river water temperature and air temperature measurement stations in the study area: (1) catchment boundary, (2) river, (3) lake, (4) water measurement station, (5) air measurement station, (6) the Tomisławice lignite exposure owned by the Konin coal mine (outside the research area).
The Noteć (391.3 km long) is the largest tributary of the Warta River (second order) and empties into the Odra (first order), which drains waters from the territory of Poland into the Baltic. In accordance with the physico-geographical division of Poland [53], the Noteć catchment is located in the following macroregions: the Toruń-Eberswald proglacial stream valley, through which runs the main bed of the river, and the South Pomeranian Lakelands, through which flow the right-bank tributaries of the Noteć. The catchment is situated within the range of two climatic regions: the Greater-Poland Western and the Greater-Poland Eastern [54], in which the mean annual air temperature equals 8.3 °C and 8.0 °C, respectively.
The characteristic feature of the Upper Noteć is the presence of numerous lakes along its reach and near the tributaries, which occupy as much as 4% of the catchment area [55]. In its medium reaches, the river is canalised and accessible for ships, while its water levels are regulated by a sluice system. The maximum span of water level fluctuations in the lower reaches is about 3.5 m. The mean annual unit discharge for the Noteć catchment is 90–100 mm (according to IMGW-PIB data). Noteć and its tributaries are characterised by a snow-rainfall recharge type. The highest flows usually occur in March and April (130–180% of annual discharge), and the lowest from July through September (source: IMGW-PIB). The Noteć and the Drawa are characterised by the longest low water durations: 75 (the Noteć) and 97 days (the Drawa). The mean daily water temperature in the lower reaches of the Noteć changes seasonally from 3.6 °C in winter (November–March) to 15.7 °C in summer (April–October), reaching 18.8 °C in July [55]. The temperature of flowing waters is sometimes increased by inflowing pollution (thermal pollution, municipal and industrial-origin sewage), particularly in the upper and medium reaches.
On the basis of abiotic and biotic categories, and also taking into consideration the macrobenthic and phytobenthic type, the Noteć has been classified in the category of “lowland large-river systems” [31]. The Noteć River, Gwda and Drawa rivers meet the requirements specified for categories of watercourse stretches that are of special significance for preserving morphological continuity, and also functions as primary migration corridors for fish. The Noteć Valley, due to its high natural values, has been designated for conservation. The following Natura 2000 areas have been created: “The Noteć Valley” and “The Valley of the Middle Noteć and the Bydgoszcz Canal” [56]. The area is characterised by a rich mosaic of habitats with priority riparian forests. It overlaps spatially with an important bird refugium of European renown (E-33), which is also a critical corridor of international importance. Natura 2000 is a network of sites selected (under the Habitats and Birds Directives) to ensure the long-term survival of Europe’s most valuable and threatened species and habitats [57].
3. Methods
The analysis of the distribution of river water and air temperature measurement series was conducted for the Noteć catchment for the period 1987–2013 on different time resolution levels: daily, monthly, semi-annual, annual and multiannual. Daily water and air temperature distributions were analysed using a set of data developed on the basis of a hydrological year, which under the Polish conditions, covers the months of November–October. Distribution of air temperate series in the individual half-year periods was also taken into account: the cool (winter) half-year period, covering the months November–April and the warm (summer) half-year period, covering the months May—October. Under Polish conditions, a majority of characteristics of the water regime, including the thermal or icing regime, is considered on the basis of a hydrological year. Calculations were performed in the R calculation environment, version 3.3.2 (31 October 2016). The R suite (GNU R) software is used for data analysis, and also functions as a programming platform [58].
The distribution normality of data series was assessed, and the series were also analysed in terms of the occurrence of stationarity and autocorrelation. Due to the considerable number of observations, the distributions of daily river water temperature and air temperature were analysed graphically using a quantile plot showing the relations between expected quantile values (assuming normality of distribution) and empirical quantiles. Time series stationarity was inspected by means of an augmented Dickey-Fuller test, ADF [59]. In the ADF test, series’ stationarity was determined for the case when the test p-value was lower than the adopted significance level, which meant discarding the hypothesis of the so-called unit root and assuming time series stationarity. The results of the significance test applied were evaluated in relation to the accepted level of α = 0.05. Wherever a different significance level was adopted, such information was included next to the calculation results. For the decomposition of the series into components (the trend, the periodical factor, and the random factor), an additive model was used. It applies to a time series in which the observed values of the variable being predicted are the sum of components of the series, and thus the trend value is decreased or increased by constant values of the seasonality factor [60].
The examination of the autocorrelation of daily river water temperature and air temperature time series was performed using an autoregressive Autoregressive Integrated Moving Average Model (ARIMA model) with the capability of determining a prediction. For this approach it was assumed that the value of a series is dependent on current and previous disturbances. The model consists of three elements: an autoregressive (AR) process, degree of integration I (Integrated), and the moving averages (MA) process. In the autoregressive process, each value is a linear combination of preceding values, and thus process memory is utilised.
For the AR (2) and AR (3) processes, the following equations are applied, respectively:
where:
yt = φ1yt−1 + φ2yt−2 + εt
yt = φ1yt−1 + φ2yt−2 + φ3yt−3 + εt
- yt—series value at time t
- yt−1—series value at time t − 1, etc.
- εt—random component, disturbance from time t
- t—successive days
- φ—a parameter defining the strength of impact of the preceding value in the process (or successive ones, incrementally older) on the current value
Additionally, in order to enable proper modelling of the clear annual seasonality, a seasonal component was added; this was modelled using a fourth-order Fourier series with a prediction. For a stationary process, the canonical expansion is the form of the Fourier transform (Equation (3)):
where: (αksin(2πkt/365) + βkcos(2πkt/365))—the Fourier transform for k = 1, 2, 3, 4. The remaining symbols are explained in Equations (1) and (2).
yt = [αksin(2πkt/365) + βkcos(2πkt/365)] + φyt−1 + εt
Daily river water temperature data were modelled as an ARIMA (2, 0, 0) process for the Noteć in Pakość and Nowe Drezdenko, and for the Drawa in Drawiny. A third-order ARIMA (3, 0, 0) process was used to model the water temperature of the Noteć at the Ujście profile. For the Gwda River in Piła, autocorrelation analyses were conducted using a fourth-order autoregressive ARIMA (4, 0, 0) model. On the basis of an analysis of daily autocorrelations of air temperatures measured in Piła, it was decided to use a second-order autoregressive model with a second-order moving average process, the so-called ARIMA (2, 0, 2) model. Finally, daily water temperature measurements for the Noteć, the Drawa and the Gwda, as well as air temperatures at the Piła station, can be approximated using Equations (4)–(9):
Noteć-Pakość (tw):
where: α1 = −9.80; α2 = 0.40; α3 = −0.45; α4 = 0.27; β1 = −2.24; β2 = −0.55; β3 = −0.50; β4 = 0.21.
Noteć-Ujście (tw):
where: α1 = −9.98; α2 = 0.58; α3 = −0.37; α4 = 0.10; β1 = −2.17; β2 = −0.51; β3 = −0.31; β4 = 0.32.
Noteć-Nowe Drezdenko (tw):
where: α1 = −9.98; α2 = 0.58; α3 = −0.37; α4 = 0.10; β1 = −2.17; β2 = −0.51; β3 = −0.31; β4 = 0.32.
Drawa-Drawiny (tw):
where: α1 = −8.62; α2 = 0.34; α3 = −0.34; α4 = 0.12; β1 = −1.65; β2 = −0.39; β3 = −0.25; β4 = 0.25.
Gwda-Piła (tw):
where: α1 = −8.72; α2 = 0.41; α3 = −0.20; α4 = 0.10; β1 = −2.04; β2 = −0.31; β3 = −0.45; β4 = 0.3.
Piła (Ta):
where: α1 = −9.73; α2 = 0.04; α3 = 0.10; α4 = 0.03; β1 = −2.45; β2 = −0.22; β3 = −0.35; β4 = 0.39.
And yt—series value at time t, yt−1—series value at time t − 1, etc., et—random component, disturbance from time t, k—process order, t—successive days, α—coefficient of components of the Fourier transform, which determines the weight of the sinusoidal component; the β—coefficient of components of the Fourier transform, which determines the weight of the cosinusoidal component.
The classical procedure of selecting the appropriate ARIMA model was developed by Box and Jenkins (1976) [61]. It consists of three steps: identification, estimation, and diagnosis. For the identification of the model’s parameters, information criteria were used. The number of the model’s parameters was determined on the basis of time series plots of water temperature and air temperature, as well as autocorrelation (ACF) and partial autocorrelation (PACF). The analysis of autocorrelation plots and functions was helpful in the preliminary determination of the following parameters: autoregression (AR), degree of series integration (I), and the moving average parameter (MA). Autocorrelation as a function assigns the Pearson correlation coefficient value to the natural argument k between a time series and the same series shifted back by k units of time. Partial autocorrelation PACF is a measure analogous to partial correlation and determines autocorrelations of series values with a delayed value, without accounting for autocorrelation resulting from intermediate values. At the stage of diagnosing the model, the independence of remainders (the random factor) was examined using the Box-Pierce test.
4. Results
Quantile plots elaborated for daily series of water temperatures of the Noteć and its tributaries demonstrated that these distributions are bimodal throughout the entire multiannual period, which is the result of the seasonality connected with the occurrence of a cool and warm half-year (Figure 2). The distribution of daily air temperatures (the Piła station) for the whole multiannual period is close to normal, being characterised only by slight negative skewness related to a negligible overrepresentation of lower air temperatures.
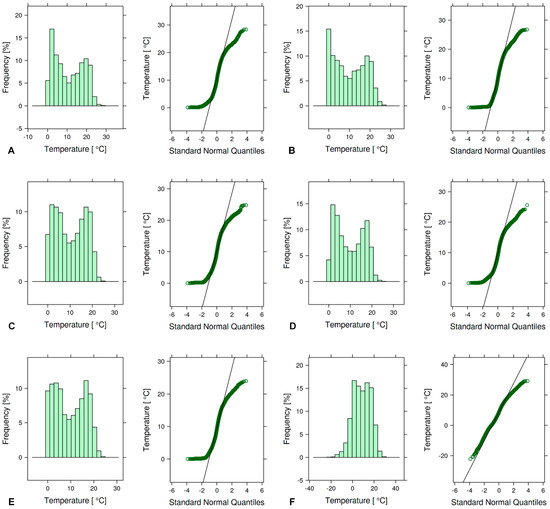
Figure 2.
Frequency histograms and quantile plots of the distribution of daily water temperature series for the Noteć and its tributaries, and of air temperature (1987–2013): (A) Noteć–Pakość, (B) Noteć–Ujście, (C) Noteć–Nowe Drezdenko, (D) Drawa–Drawiny, (E) Gwda–Piła, (F) Piła (weather station).
Water temperature distributions for both half-years are not perfectly normal; they are skewed to some degree (Figure 3). As regards air temperature, the distribution of series for the cool half-year is also characterised by a slight negative skewness, while their distribution for the warm half-year is approximately normal. This means that a negligible overrepresentation of lower values in the cool half-year was the cause of the negative skewness of the distribution for the entire multiannual period, without a division into half-years.

Figure 3.
Frequency histograms and quantile plots of the distribution of semi-annual water temperature series for the Noteć and its tributaries, and of air temperature (1987–2013): (A) Noteć–Pakość, (B) Noteć–Ujście, (C) Noteć–Nowe Drezdenko, (D) Drawa–Drawiny, (E) Gwda–Piła, (F) Piła (weather station).
Thermal river water data are similar when viewed at the level of individual years. The higher time resolution makes it possible to notice certain annual fluctuations—years and half-years characterised by varying degrees of overrepresentation of extremely low or high water temperatures of the Noteć and its tributaries. Additionally, distributions for different years have different shapes, not always symmetrical and unimodal. Moreover, the distributions are almost never approximately normal. Air temperature series distributions for Piła for individual years in the analysed period (1987–2013) are generally approximately normal. There are, however, individual exceptions to this rule in the form of distributions with a slightly negative or positive skewness. A similar effect has also been observed at the level of individual decades in the cool and warm half-year systems.
For the analysed period, the mean annual water temperature of the Noteć in its upper reaches equalled approximately 10.9 °C (Noteć-Pakość), and 10.1–10.2 °C in the river’s medium and lower reaches (Table 1). River water temperatures were higher than the air temperature in Piła by about 1.5–2.0 °C. In the winter half-year, when under the conditions prevalent in Poland mean flowing water temperature values fluctuate at around 2.0 °C, the mean water temperature of the Noteć in Pakość and Nowe Drezdenko for the 1987–2013 multiannual period reached 4.4 °C and was slightly higher than the water temperature measured in Ujście. During this period, the waters of its tributaries—the Gwda and the Drawa—were cooler than those of the Noteć (Table 1).

Table 1.
Descriptive statistics of the distribution of river water temperature “tw” (°C) and air temperature “ta” (°C) in the Noteć catchment on the multi-year and half-year levels (1987–2013).
Higher river water temperatures in the winter season (above 2.0 °C) usually signify that pollution (thermal pollution, municipal and industrial origin sewage) is present in a river. For many years, the Noteć has been collecting pollution through the River Pichna (a right tributary, not inspected by the IMGW-PIB), this originating from the Tomisławice lignite exposure owned by the Konin Lignite Mine. These are mainly mine wastewaters with a substantial quantity of suspended matter. Furthermore, the Provincial Inspectorate for Environmental Protection (source: WIOŚ Konin) carried out a phytobenthic and macrophytic test and established a deterioration of biological water quality.
Compared to measurements taken in Ujście and Nowe Drezdenko, the waters of the Noteć in Pakość are also characterised by a higher mean temperature in the summer half-year (Table 1). In the summer season, the maximum water temperatures of the Noteć and its tributaries exceeded 21.5 °C (Figure 4), which is the threshold value permitted for a natural salmonid habitat [62]. In turn, a river water temperature of approximately 28.0 °C (the maximum temperature in the summer in Pakość is 28.4 °C) is the threshold value permitted for a natural cyprinid habitat. The Noteć, due to its natural qualities, has been classified amongst inland waters constituting natural fish habitats, for which it is necessary to respect thermal requirement guidelines conducive to the proper development and maintenance of ichthyofauna.
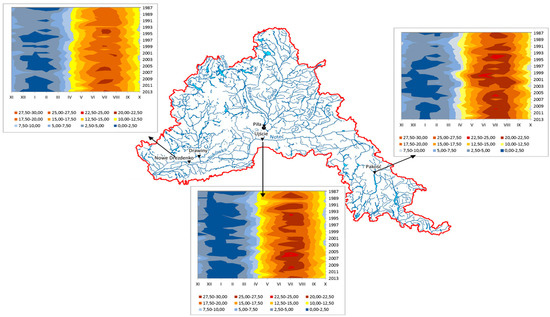
Figure 4.
Distribution of the measurement series of Noteć water temperature (Pakość, Ujście, Nowe Drezdenko) on daily time levels (°C).
At the level of individual months, distributions of water temperature data series for the Noteć and its tributaries are approximately normal, or at least relatively symmetrical (Figure 5). This shows that monthly river water temperatures were relatively stable throughout the entire analysed period. Only for the Noteć in Pakość (upper reaches) is the distribution for April pronouncedly more positively skewed than for other months.
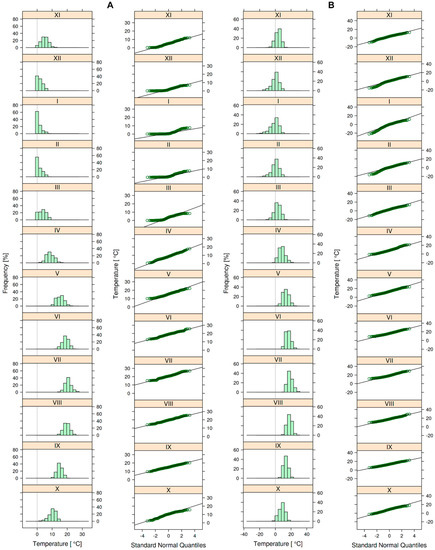
Figure 5.
Frequency histograms and quantile plots of the distribution of monthly water temperature series for the Noteć in Pakość (A), and air temperature in Piła (B) (1987–2013).
The considerable difference between the minimum and maximum temperatures (approximately 22 °C) in the month of April was due to the watercourse being fed by meltwater (spring melt rise), as well as groundwater with varying temperatures [26,35,55]. Additional sources of recharge for the Noteć in this season are precipitation, which enters the watercourse through surface runoff, and also pollution discharged into rivers. A greater diversity of the Noteć’s monthly water temperatures can be observed in the summer and summer-autumn seasons (Figure 6). In these periods, there is an increased recharge of rivers by groundwater, which has a lower temperature than river water. In turn, the highest data variability range for monthly air temperatures occurs in the winter season, mainly in January and February.
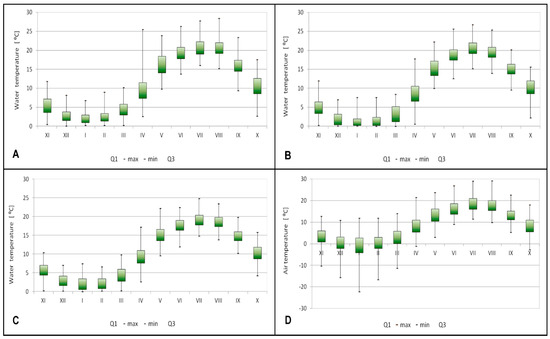
Figure 6.
The variability range (min.–max.) for monthly water temperature series of the Noteć in Pakość (A), Ujście (B) and Nowe Drezdenko (C), and air temperature in Piła (D) (1987–2013).
At the Ujście station, meanwhile, the period from December to March is characterised by clearly positively skewed river water temperature distributions. For the lower stretch of the Noteć (Nowe Drezdenko), the water temperature distribution for January, February and March is characterised by not completely correct (positive) skewness (Figure 6). For the Drawa in Drawiny and the Gwda in Piła (except for distributions for December, January, February and March), the water temperature distributions in individual months are close to normal, or at least relatively symmetrical, and this shows that during the entire analysed period under study, monthly temperatures were relatively stable. Monthly distributions of air temperatures in Piła are also approximately normal. Only the distributions for December, January and February are slightly negatively skewed (Figure 6).
For measurement series of the water temperature of the Noteć and its tributaries, and also of air temperature (Piła), the augmented Dickey-Fuller test ADF [39] showed that the daily temperature series are stationary (Table 2).
Table 2.
Results of an augmented Dickey-Fuller test from a daily water “tw” and air temperature “ta” measurement series (1987–2013).
The decomposition of daily water temperature series into additive components revealed that they are dominated by a periodic component which accounts for approximately 92.6–93.4% of variability (Table 3). A seasonal component plot indicated that it is necessary to include this component in the general formula describing the analysed time series (Figure 7). In the case of river water temperature, seasonal fluctuations are caused primarily by climatic factors, mainly by changes in air temperature and processes such as snow and ice cover melts, underground river recharge, and evapotranspiration drainage occurring within the area impacted by the river valley. The modifying impact of groundwater on the thermal river regime has been confirmed among others by Kanno et al. [52], and Westhoff and Paukert [63]. Seasonal fluctuations in combination with this trend (Table 3), they may in future may lead to steadily greater periodical fluctuations (from year to year), proportionately to the scale of the phenomenon.
Table 3.
The decomposition of daily water and air temperature time series into additive components.
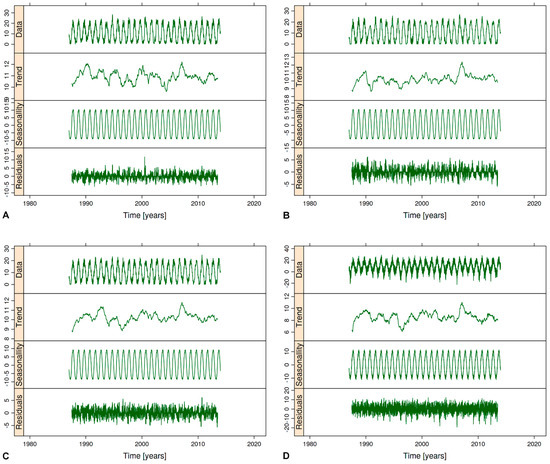
Figure 7.
The trend, periodical fluctuations and random fluctuations in water and air temperature time series (1987–2013): Noteć-Pakość (A), Noteć-Ujście (B), Noteć-Nowe Drezdenko (C) and Piła-air temperature (D).
Apart from the periodic component, there was also present a negligible trend responsible for 0.4–0.6% of temperature variability in the analysed period. Random fluctuations accounted for approximately 6.0–7.0% of river water temperature variances (Table 3). Data presented in the random fluctuations plot (Figure 7) allow us to conclude that fluctuations of this type occur in a series and affect the observed phenomenon; indeed, in some years the range of random fluctuations was very broad. As regards the decomposition of daily air temperature series in Piła, the periodical component was demonstrated to be dominant (Table 3). The trend component is 1.0% and is practically negligible, while the share of random fluctuations accounts for 22.0% of air temperature variability in the analysed period. Compared to daily river water temperature series, the share of the random component is more than three times greater. The share of the periodic component has in turn decreased.
The research into the autocorrelation of the time series of river water and air temperatures was conducted on the basis of autoregressive ARIMA models. In this approach it was assumed that the value of a series is dependent on currently existing and previous disturbances. The selected models ensured a good reflection of past data, thus confirming the validity of the analysis being conducted (Figure 8). The remainders of the constructed model were independent, which was demonstrated by a Box-Pierce test, while the error variance was relatively uniform. Only the distribution of remainders deviated from normality; however, it was still symmetrical.
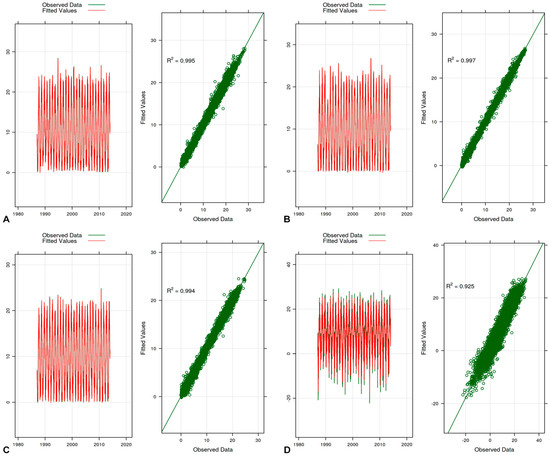
Figure 8.
Prognostic models of river water and air temperatures elaborated on the basis of the ARIMA model: (A) Noteć-Pakość, (B) Noteć-Ujście, (C) Noteć-Nowe Drezdenko, (D) Piła-air temperature.
The models developed for the time series of water temperature of the Noteć and its tributaries, and also for air temperature values, further demonstrated a satisfactory prognostic capability. A data prediction elaborated on the basis of the model confirmed that it correctly reproduces the cyclical character of temperature changes. The quality of the model’s prediction is reflected by the high square of the correlation coefficient between the observed and predicted values (Figure 8). The described process was explained by the model with 99% accuracy.
In order to ensure a proper interpretation of the clear annual seasonality, a seasonal component was added, which was modelled using the first four terms of the Fourier series (Figure 9). The Fourier analysis is one of the basic tools for investigating stationary processes, the characteristics of which were identified for daily time series of river water and air temperatures in the Noteć catchment.
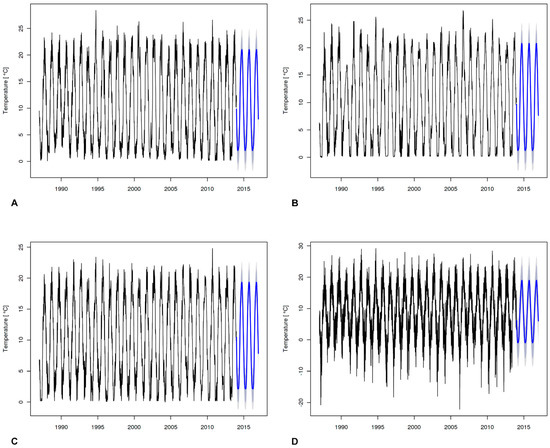
Figure 9.
Modelling of the seasonality of annual temperature of river water and air using a fourth-order Fourier series with a prediction: (A) Noteć–Pakość, (B) Noteć–Ujście, (C) Noteć–Nowe Drezdenko, (D) Piła (air temperature). The blue colour it is the predicted data.
The temperature prediction elaborated on the basis of the model appears to be sufficiently consistent with the series for historical data, which constitutes additional proof of the adequacy of the applied model. This prediction plays an important role in water and biotic resources management in the Noteć catchment.
5. Discussion
The consistency of the distribution of measurement series of river water (the Noteć and its tributaries) and air (the Piła station) temperatures for the period 1987–2013 with normal distribution was observed at all of the stations at the level of daily, semi-annual and decadal data, and to a lesser extent at the level of monthly data. The asymmetry of distribution of monthly data in the winter season, mainly in January and February, may have been affected to a large extent by increased river water temperatures in this period. Relative to the average maximum temperatures, typical of lowland rivers, this extent was about 1.0–1.9 °C (approximately 2.0 °C). Such a situation was observed for the Noteć in the years 1988–1990, 1992–1993, 1994–1996, and also in 1999–2002 and 2007.
Changes in river water temperature are for the most part a consequence of changes in air temperature and heat instability in a river bed, with the latter factor being among others a function of heat transfer from groundwater and its exchange in the hyporheic zone. The major part of heat energy exchange occurs at the air-water level and is less pronounced at the river bed-water level [26,46]. River water recharge is connected with the transformation of precipitation into runoff, and also with snow cover melt in the spring season. The distribution of precipitation shows signs of asymmetry, often with a positive skewness [24], and this is reflected in the distribution of the incidence of low groundwater levels in immediate contact with the hydrographic network. The recharge of the Noteć and its tributaries originates in 75% from groundwaters. While researching the hydrological structure of Poland, Gutry–Korycka [64] determined that the distribution of groundwater depths is approximately normal. Research conducted by Graf [65] in the region of the Greater Poland Lowlands (1961–2000) confirmed for the majority of measurement stations, including those located in the Upper Noteć catchment, an asymmetry of distribution of mean annual shallow groundwater levels drained by the river.
In the medium and lower reaches of the rivers, and also in rivers flowing through industrial and urbanised areas, water temperatures are most often higher than air temperature, on average by 2.0 °C. At times, this increase amounts to as much as 5.0 °C, in most cases being the result of the inflow of pollution [27,66,67]. The temperature of the Noteć’s waters recorded in Pakość (the upper reaches of the river) is definitely higher than that in its medium and lower reaches. The mean annual temperatures calculated for the period 1987–2013 exceeded the multiannual mean in 13 annual projections. Disturbances in the time series structure of river water temperatures are evidence of the influence of factors interfering with the analysed properties [68,69]. This translates into the specific thermals of the Noteć along its course, which are divergent from the adopted rule. For rivers, an increase in the distance from their sources causes the water temperature to rise and noticeably approach the mean air temperature (thermal equilibrium) [41]. A slight cooling of the Noteć along its course may be evidence of the impact of additional local factors, e.g., it may be the effect of the river being recharged by its tributaries, the Drawa and the Gwda, whose mean water temperature is about 0.5–1.0 °C lower than that of the Noteć (Table 1). The lack of normality of measurement series distribution may also be influenced by natural and anthropogenic modifications of the heat balance, which include changes in land use, forestry, the removal of cover, flow regulation, and the appearance of heated effluents [52].
The mean daily water temperature of the Noteć increases in its upper reaches as a result of the inflow of polluted mine water from the Tomisławice exposure (Konin Brown Coal Mine). That is, mostly mine wastewater with a substantial quantity of suspensions with higher river water temperatures in the winter season (above 2.0 °C) is usually a sign of pollution presence in the river. Waters from the mine are first discharged through a canal to the River Pichna, then they flow for approximately 8.5 km to the River Noteć and further, for approximately 2.5 km—together with the waters of the Noteć—to the Lake Gopło. This results in an increase of the temperature of the mine waters due to their mixing with warmer waters of the River Pichna and their warming due to the impact of air temperature. The Noteć in Pakość also reached high maximum temperatures in both half-years: in the winter one, 25.5 °C (median 3.6 °C) and the summer one, 28.4 °C (median 18.0 °C). The maximum river water temperature in Pakość in the cool half-year is about 7.0 °C higher than that in the Noteć waters in the Ujście and Nowe Drezdenko profiles (according to IMGW-PIB data). An inspection conducted by the Konin Local Office of the Voivodeship Inspectorate for Environmental Protection (WIOŚ Konin) in August of 2014 (2014 does not cover the period of water thermals studies) confirmed the poor quality of the Noteć’s waters, which is above the permissible limit of normal suspensions in water.
The water cooling rate of the river along its course, with the limited supply of pollution in its medium and lower reaches, will be dependent on the weather conditions and river flow. The process of cooling of waters as a function of the flow and length of the river (in particular with the inflow of heated water) occurs most often at the 13–30 km stretch in winter, and at the 30–70 km stretch in summer. The recorded differences in the water temperatures of the Noteć between its upper reaches and the medium and lower reaches may have a critical impact on habitat conditions for living organisms.
The thermal regime of rivers is strongly modified by anthropogenic activity within a watercourse’s bed and valley. In the case of lowland rivers such as the Noteć, these are usually engineering works and impoundment structures, which bring about changes in river bed morphology and the artificial control of river water flow and levels. The Noteć has barrages in its upper and—partially—medium reaches, and these also impact the discharge conditions of water and its thermal regime. The degraded morphology of river stretches with barrages or canals is one of the major causes of undesirable changes in the temperature of flowing water. River bed engineering, aiming to expand its width and reduce the depth, may result in the change of the thermal conditions of waters and an increase of their daily temperature. Similar changes of the thermal conditions of river waters are observed after the removal of trees along river banks. Rivers with transformed hydromorphological conditions may experience alterations of physico-chemical and biological elements that serve as references for determining their ecological condition [70]. The erection of barrages on rivers or their stretches and the artificial control of water flow by means of canals are commonly considered as factors impeding the restoration of the historical thermal regime of watercourses [22,26,71,72]. Under such circumstances, the time series of thermal data may be devoid of homogeneity, which is equated with non-stationarity. Stationary series are considered homogeneous if we can completely exclude the impact of interfering factors and ones randomly affecting the statistical properties of a measurement series [65]. The stationarity of a daily water temperature measurement series was demonstrated for all stations located on the Noteć and its tributaries, the Gwda and the Drawa. A specific feature of the analysed measurement series is its highly pronounced and very regular periodicity, as well as the negligible role of the trend and the small role of the random component (noise), the share of which is greater in the structure of the time series of air temperatures. The random component hinders the identification of a phenomenon’s structure. Air temperature undergoes natural change over time, i.e., daily, seasonal, annual and multiannual fluctuations, as well as anthropogenic modifications resulting from an increased content of dust and greenhouse gases in the atmosphere, and also other forms of human activity [73]. Climate change brought about by human impact is characterised by a constant linear trend of change [74].
The distribution asymmetry of a measurement series is specific to most natural features and phenomena. Besides the amplitude and standard deviation, the skewness of air temperature distribution is the principal statistical indicator characterising its variability over the course of the year [75]. Distribution asymmetry was also demonstrated by means of effective air temperature sums in Poland for the years 1951–2006 during the vegetative period. According to [76], this is a positive asymmetry in most of Poland, being negative only in the north-eastern part of the country. A particularly interesting distribution of air temperature variability indicators occurs in the autumn months. The relatively high negative value of the skewness index is in this case the result of specific weather conditions that bring about cold nights (frosts)—even though the maximum absolute temperature in these months is also at times very high. Another interesting phenomenon is the positive value of the skewness index in July, which points to a manifestation of continental features in the Polish climate in the summer season. May frosts, albeit mild, are one of the phenomena that find reflection in the negative value of the skewness index.
Research into air temperature variability, conducted in Poland for the period 1951–2000 [77,78] and in the Greater Poland region for the period 1966–2006 [79], disclosed a statistically significant increase in its mean value. During the decade 2001–2010, a substantial area of Poland was some 0.4–1.0 °C warmer relative to the entire multiannual period, and this is partially confirmed by air temperature measurement results at the Piła station. In the decade 2001–2010 there was recorded an increase in the mean annual air temperature in Piła, this totalling approximately 0.5 °C relative to the period 1991–2000. As regards the water temperatures of the Noteć, the difference between the decades indicated did not exceed 0.3 °C (Nowe Drezdenko—upper reaches) and 0.4 °C (Ujście—medium reaches). In Pakość (the upper reaches), an increase in the mean water temperature of the Noteć—0.1 °C relative to the mean for the decade 2001–2010—was observed for the decade 1990–2000. This information additionally confirms the influence of factors acting independently of the impact of air temperature on the temperature distribution of flowing waters.
A characteristic feature of water temperature time series in rivers of the temperate climatic zone is a clear annual seasonality of data distribution, which has been confirmed by the applied ARIMA models. An analysis of the autocorrelation of daily of river water and air temperature series unequivocally disclosed a long memory of the process (AR (2)–AR (4)). The defined models achieved a very good data match (Figure 8). The data prediction for the Noteć and its tributaries based on the ARIMA model shows that it correctly represents the cyclical character of river water and air temperature changes. By isolating the effect of seasonal fluctuations on the thermal regime of the waters of the Noteć and its tributaries, as well as the air temperature, more detailed predictions can be obtained.
Research into the thermal water regimes of major European rivers has shown that their temperatures have increased by about 1–3 °C during the last century [15]. Climate change projections for Europe with a prediction until the end of the 21st century assume air temperature changes related to increases therein, which may contribute to the generation of greater numbers of extreme phenomena. In addition, they can also modify of the basic features pertaining to the ecological condition of waters, for example, changes in the physico-chemical parameters of waters or water temperature increases relative to reference periods.
6. Conclusions
The characteristic of the distribution of river water temperature at different data resolution levels reflects the impact of natural conditions and anthropogenic factors, acting in a quasi-continuous or periodical manner in the formation of river thermal regimes. In the case of the Noteć and its tributaries, the periodic component affects water temperature variance more than 90%, while the share of the random factor, which may confirm the influence of anthropogenic factors on changes in the water thermal regime, amounts to 6–7%. Water temperature as a predicted variable is also dependent on its values in previous periods, and this was confirmed by ARIMA models. The direction of changes in river water and air temperatures in the Noteć catchment, indicated for the period 1987–2013, is not a permanent phenomenon. In the analysed period there were observed half-years with extreme maximum water temperatures, reaching 28.4 °C in the summer. At all of the measurement stations located on the Noteć and its tributaries, the maximum water temperature recorded for the summer half-year reached or exceeded 24.0 °C (the thermal threshold for salmonids is 21.5 °C). The results obtained have a special significance for identifying the characteristics of the thermal regime, and also as regards the ecological classification of the waters of the Noteć, which is a representative of the so-called “lowland large-river systems”, typified by a high natural value. These are significant among others for interpreting the frequency and duration of ice phenomena on the analysed rivers (the pertinent research is currently being conducted by the author), and may be utilised to indicate climate change or used as a sensitive indicator of the impact of anthropogenic factors on river waters. The differences in the thermal regime of the Noteć identified in the catchment’s spatial configuration indicate a need to intensify the monitoring of its waters in terms of pollution inflow registration, and undertake protective measures—not only within NATURA 2000 areas, but also along the entire Noteć Valley, and the river’s tributaries.
Acknowledgments
The present paper is the result of research on thermal river water statistical methods, carried out as part of statutory research at the Department of Hydrology and Water Management of the Adam Mickiewicz University in Poznań, Poland. The author would like to thank Szymon Talaga for his help in performing the statistical analyses. The author would also like to thank the editor and anonymous reviewers for their helpful and constructive comments, which greatly contributed to improving the quality of the paper.
Conflicts of Interest
The author declares no conflicts of interest.
References
- Huntington, T.G. Climate warming-induced intensification of the hydrologic cycle: A review of the published record and assessment of the potential impacts on agriculture. Adv. Agron. 2010, 109, 1–53. [Google Scholar]
- Arismendi, I.; Safeeq, M.; Dunham, J.B.; Johnson, S.L. Can air temperature be used to project influences of climate change on stream temperature? Environ. Res. Lett. 2014, 9, 084015. [Google Scholar] [CrossRef]
- Piotrowski, P. Spatial and temporal variability of atmospheric circulation in the area of Poland. Prz. Geofiz. 2017, 1–2, 45–54. (In Polish) [Google Scholar]
- Beltaos, S.; Prowse, T. River-ice hydrology in a shrinking cryosphere. Hydrol. Process. 2009, 23, 122–144. [Google Scholar] [CrossRef]
- Hirt, U.; Hamman, T.; Meyer, B.C. Mesoscalic estimation of nitrogen discharge via drainage systems. Limnol.–Ecol. Manag. Inland Waters 2005, 35, 206–219. [Google Scholar] [CrossRef]
- Hernandez-Ramirez, G.; Brouder, S.M.; Ruark, M.D.; Turco, R.F. Nitrate, phosphate, and ammonium loads at subsurface drains: Agroecosystems and nitrogen management. J. Environ. Qual. 2011, 40, 1229–1240. [Google Scholar] [CrossRef] [PubMed]
- Popek, Z.; Wasilewicz, M.; Bańkowska, A.; Boczoń, A. The Seasonal Variation of the Runoff of Water and Biogenic Matter from the Wielka Struga River Basin to the Zadworskie Lake, Poland. Available online: http://ziw.sggw.pl/zaklad/Tom%202,%2028.%20Popek%20i%20in.pdf (accessed on 13 February 2018).
- Stow, C.A.; Cha, Y.; Johnson, L.T.; Confesor, R.; Richards, R.P. Long-term and seasonal trend decomposition of Maumee River nutrient inputs to western Lake Erie. Environ. Sci. Technol. 2015, 49, 3392–3400. [Google Scholar] [CrossRef] [PubMed]
- Bilotta, G.; Brazier, R.E. Understanding the influence of suspended solids on water quality and aquatic biota. Water Res. 2008, 42, 2849–2861. [Google Scholar] [CrossRef] [PubMed]
- Hejduk, A.; Banasik, K. Suspended sediment concentration and yield in snowmelt flood events in a small lowland river. Ann. Wars. Univ. Life Sci.—SGGW Land Reclam. 2010, 42, 61–68. [Google Scholar] [CrossRef]
- Wibig, J. Impact of the Atmospheric Circulation on Spatial Distributions of Air Temperature and Precipitation Anomalies in Europe; Łódź University Press: Łódź, Poland, 2001; p. 208. (In Polish) [Google Scholar]
- Krasovskaia, I.; Gottschalk, L. River flow regimes in a changing climate. Hydrol. Sci. J. 2002, 47, 597–609. [Google Scholar] [CrossRef]
- Wenger, S.J.; Isaak, D.J.; Luce, C.H.; Neville, H.M.; Fausch, K.D.; Dun-ham, J.B.; Dauwalter, D.C.; Young, M.K.; Elsner, M.M.; Rieman, B.E.; et al. Flow regime, temperature, and biotic interactions drive differential declines of trout species under climate change. Proc. Natl. Acad. Sci. USA 2011, 108, 14175–14180. [Google Scholar] [CrossRef] [PubMed]
- Arismendi, I.; Safeeq, M.; Johnson, S.L.; Dunham, J.B.; Haggerty, R. Evaluating recent changes in timing and synchrony of extreme annual hydro-climatic events in streams. Hydrobiologia 2013, 712, 61–70. [Google Scholar] [CrossRef]
- EEA Report No 12/2012 “Climate Change, Impacts and Vulnerability in Europe 2012en”. Available online: http://www.eea.europa.eu/publications (accessed on 20 February2017).
- Tesař, M.; Šír, M.; Pražák, J.; Lichner, L. Instability driven flow and runoff formation in a small catchment. Geol. Acta 2004, 2, 147–156. [Google Scholar]
- Gallice, A.; Schaefli, B.; Lehning, M.; Parlange, M.P.; Huwald, H. Stream temperature prediction in ungauged basins: Review of recent approaches and description of a new physically-based analytical model. Hydrol. Earth Syst. Sci. 2015, 19, 3727–3753. [Google Scholar] [CrossRef]
- Toffolon, M.; Piccolroaz, S. A hybrid model for river water temperature as a function of air temperature and discharge. Environ. Res. Lett. 2015, 10, 114011. [Google Scholar] [CrossRef]
- Younus, M.; Hondzo, M.; Engel, B.A. Stream temperature dynamics in upland agricultural watersheds. J. Environ. Eng. 2000, 126, 518–526. [Google Scholar] [CrossRef]
- Rhazi, L.; Grillas, P.; Toure, A.M.; Ham, L.T. Impact of land use in catchment and human activities on water, sediment and vegetation of Mediterranean temporary pools. C. R. Acad. Sci. Ser. III 2001, 324, 165–177. [Google Scholar] [CrossRef]
- Langan, S.J.; Johnston, L.; Donaghy, M.J.; Youngson, A.F.; Hay, D.W.; Soulsby, C. Variation in river water temperatures in an upland stream over a 30-year period. Sci. Total Environ. 2001, 265, 195–207. [Google Scholar] [CrossRef]
- Liu, B.; Yang, D.; Ye, B.; Berezovskaya, S. Long-term open-water season stream temperature variations and changes over Lena River Basin in Siberia. Glob. Planet. Chang. 2005, 48, 96–111. [Google Scholar] [CrossRef]
- Benyahya, L.; Caissie, D.; St-Hilaire, A.; Ouarda, T.B.M.; Bobée, B. A review of statistical water temperature models. Can. Water Resour. J. 2007, 32, 179–192. [Google Scholar] [CrossRef]
- Koutsoyiannis, D.; Montanari, A. Statistical analysis of hydroclimatic time series: Uncertainty and insights. Water Resour. Res. 2007, 43, 245–252. [Google Scholar] [CrossRef]
- Goulden, M.; Conway, D.; Persechino, A. Adaptation to climate change in international river basins in Africa. Hydrol. Sci. J. 2009, 54, 805–828. [Google Scholar] [CrossRef]
- Caissie, D. The thermal regime of rivers: A review. Freshw. Biol. 2006, 51, 1389–1406. [Google Scholar] [CrossRef]
- Graf, R. Variations of the thermal conditions of the Warta in the profile connecting the Urstromal and gorge sections of the valley (Nowa Wieś Podgórna-Śrem–Poznań). In Novel Methods and Solutions in Hydrology and Water Management; Absalon, D., Matysik, M., Ruman, M., Eds.; Hydrological Committee PTG, PTG Department: Katowice, Poland, 2015; pp. 177–194. (In Polish) [Google Scholar]
- Rice, K.C.; Jastram, J.D. Rising air and stream-water temperatures in Chesapeake Bay region, USA. Clim. Chang. 2015, 128, 127–138. [Google Scholar] [CrossRef]
- Caissie, D.; St-Hilaire, A.; El-Jabi, N. Prediction of water temperatures using regression and stochastic models. In Proceedings of the 57th Canadian Water Resources Association Annual Congress, Montreal, QC, Canada, 16–18 June 2004; Canadian Water Resources Association: Ottawa, ON, Canada, 2004. [Google Scholar]
- Kaushal, S.S.; Likens, G.E.; Jaworski, N.A.; Pace, M.L.; Sides, A.M.; Seekell, D.; Belt, K.T.; Secor, D.H.; Wingate, R.L. Rising stream and river temperatures in the United States. Front. Ecol. Environ. 2010, 8, 461–466. [Google Scholar] [CrossRef]
- Erickson, T.R.; Stefan, H.G. Linear air/water temperature correlations for streams during open water periods. J. Hydrol. Eng. 2000, 5, 317–322. [Google Scholar] [CrossRef]
- Gardner, B.; Sullivan, P.J.; Lembo, A.J. Predicting stream temperatures: Geostatistical model comparison using alternative distance metrics. Can. J. Fish. Aquat. Sci. 2003, 60, 344–351. [Google Scholar] [CrossRef]
- Morrill, J.C.; Bales, R.C.; Conklin, M.H. Estimating stream temperature from air temperature: Implications for future water quality. J. Environ. Eng. 2005, 131, 139–146. [Google Scholar] [CrossRef]
- Benyahya, L.; St-Hilaire, A.; Ouarda, T.B.M.J.; Bobée, B.; Dumas, J. Comparison of non-parametric and parametric water temperature models on the Nivelle River, France. Hydrol. Sci. J. 2008, 53, 640–655. [Google Scholar] [CrossRef]
- Hilderbrand, R.H.; Kashiwagi, M.T.; Prochaska, A.P. Regional and local scale modeling of stream temperatures and spatio-temporal variation in thermal sensitivities. Environ. Manag. 2014, 54, 14–22. [Google Scholar] [CrossRef] [PubMed]
- Li, H.; Deng, X.; Kim, D.-Y.; Smith, E.P. Modeling maximum daily temperature using a varying coefficient regression model. Water Resour. Res. 2014, 50, 3073–3087. [Google Scholar] [CrossRef]
- Gelman, A.; Hill, J. Data Analysis Using Regression and Multilevel/Hierarchical Models; Cambridge University Press: Cambridge, UK, 2006; p. 695. [Google Scholar]
- DeWeber, J.T.; Wagner, T. A regional neural network ensemble for predicting mean daily river water temperature. J. Hydrol. 2014, 517, 187–200. [Google Scholar] [CrossRef]
- Bogan, T.; Mohseni, O.; Stefan, H.G. Stream temperature—Equilibrium temperature relationship. Water Resour. Res. 2003, 39, 1245–1256. [Google Scholar] [CrossRef]
- Caissie, D.; Satish, M.G.; El-Jabi, N. Predicting river water temperatures using the equilibrium temperature concept with application on the Miramichi River catchments (New Brunswick, Canada). Hydrol. Process. 2005, 19, 2137–2159. [Google Scholar] [CrossRef]
- Mohseni, O.; Stefan, H.G. Stream temperature/air temperature relationship: A physical interpretation. J. Hydrol. 1999, 218, 128–141. [Google Scholar] [CrossRef]
- Eby, L.; Helmy, O.; Holsinger, L.M.; Young, M.K. Evidence of climate-induced range contractions in bull trout salvelinus confluentus in a rocky mountain watershed, USA. PLoS ONE 2014, 9, e98812. [Google Scholar] [CrossRef] [PubMed]
- Allan, J.D.; Castillo, M.M. Stream Ecology: Structure and Function of Running Waters, 2nd ed.; Chapman and Hall: New York, NY, USA, 2007; p. 388. [Google Scholar]
- Conlan, K.; Lane, S.; Ormerod, S.; Wade, T. Preparing for Climate Change Impacts on Freshwater Ecosystems (PRINCE); Environment Agency: Bristol, UK, 2005.
- Padilla, A.; Rasouli, K.; Déry, S.J. Impacts of variability and trends in runoff and water temperature on salmon migration in the Fraser River Basin, Canada. Hydrol. Sci. J. 2015, 60, 523–533. [Google Scholar] [CrossRef]
- Jackson, M.C.; Loewen, C.J.G.; Vinebrooke, R.D.; Chimimba, C.T. Net effects of multiple stressors in freshwater ecosystems: A meta-analysis. Glob. Chang. Biol. 2016, 22, 180–189. [Google Scholar] [CrossRef] [PubMed]
- Olden, J.D.; Naiman, R.J. Incorporating thermal regimes into environmental flows assessments: Modifying dam operations to restore freshwater ecosystem integrity. Freshw. Biol. 2010, 55, 86–107. [Google Scholar] [CrossRef]
- Letcher, B.H.; Hocking, D.J.; O’Neil, K.; Whiteley, A.R.; Nislow, K.H.; O’Donnel, M.J. A hierarchical model of daily stream temperature using air-water temperature synchronization, autocorrelation, and time lags. Peer J. 2016, 4, e1727. [Google Scholar] [CrossRef] [PubMed]
- Hannah, D.M.; Malcolm, I.A.; Soulsby, C.; Youngson, A.F. Heat exchanges and temperatures within a salmon spawning stream in the Cairngorms, Scotland: Seasonal and subseasonal dynamics. River Res. Appl. 2004, 20, 635–652. [Google Scholar] [CrossRef]
- Beauchene, M.; Becker, M.; Bellucci, C.J.; Hagstrom, N.; Kanno, Y. Summer thermal thresholds of fish community transitions in connecticut streams. N. Am. J. Fish. Manag. 2014, 34, 119–131. [Google Scholar] [CrossRef]
- ETC/ICM, European Freshwater Ecosystem Assessment: Cross-Walk between the Water Framework Directive and Habitats Directive Types, Status and Pressures. Available online: http://ecologic.eu/12451 (accessed on 10 February 2017).
- Kanno, Y.; Vokoun, J.C.; Letcher, B.H. Paired stream-air temperature measurements reveal fine-scale thermal heterogeneity within headwater brook trout stream networks. River Res. Appl. 2014, 30, 745–755. [Google Scholar] [CrossRef]
- Kondracki, J. Regional Geography of Poland; Scientific Publishing House PWN: Warsaw, Poland, 2008; p. 441. (In Polish) [Google Scholar]
- Woś, A. The Climate of Poland in the Second Half of the 20th Century; Scientific Publishing House UAM: Poznan, Poland, 2010; p. 490. (In Polish) [Google Scholar]
- Borowicz, J. An Analysis of River Ice Formation in the Noteć and Its Right-Bank Tributaries in the Years 1982–2011. Master’s Thesis, Adam Mickiewicz University Poznan, Poznan, Poland, 2016. (In Polish). [Google Scholar]
- Council Directive 92/43/EEC of 21 May 1992 on the Conservation of Natural Habitats and of Wild Fauna and Flora—The Habitats Directive. Available online: http://eur-lex.europa.eu/legal-content/EN/ALL/?uri=CELEX: 62011CJ0046 (accessed on 15 February 2016).
- Birds Directive—Directive 2009/147/EC of the European Parliament and of the Council of 30 November 2009 on the Conservation of Wild Birds. Available online: http://forestportal.efi.int/view.php (accessed on 15 February 2017).
- R Core Team. R: A Language and Environment for Statistical Computing; R Foundation for Statistical Computing: Vienna, Austria, 2013; Available online: http://www.R-project.org (accessed on 15 February 2017).
- Dickey, D.A.; Fuller, W.A. Likelihood ratio statistics for autoregressive time series with a unit root. Econometrica 1981, 49, 1057–1072. [Google Scholar] [CrossRef]
- Ghysels, E.; Osborn, D.R. The Econometric Analysis of Seasonal Time Series; Cambridge University Press: Cambridge, UK, 2001; p. 228. [Google Scholar]
- Box, G.E.P.; Jenkins, G.M. Time series analysis: Forecasting and control. Oper. Res. Q. (1970–1977) 1971, 22, 199–201. [Google Scholar]
- Regulation 2002—Regulation of the Minister of the Environment of 4 October 2002 on the Requirements to be Met by Inland Waters Which Are a Fish Living Environment in Natural Conditions, Dz.U. nr 176. poz. 1455. Available online: http://isap.sejm.gov.pl (accessed on 20 February 2017). (In Polish)
- Westhoff, J.T.; Paukert, C.P. Climate change simulations predict altered biotic response in a thermally heterogeneous stream system. PLoS ONE 2014, 9, e111438. [Google Scholar] [CrossRef] [PubMed]
- Gutry-Korycka, M. The Analysis and the Models of Hydrological Structure of Poland; Discussion of Warsaw University; The Publishing House of Warsaw University: Warsaw, Poland, 1984; p. 218. (In Polish) [Google Scholar]
- Graf, R. Analysis of the frequency of annual groundwater levels in the Wielkopolska Lowland in the period of 1961–2000. In Water in the Geographical Researches; Ciupa, T., Suligowski, R., Eds.; Jan Kochanowski University Kielce: Kielce, Poland, 2010; pp. 179–192. (In Polish) [Google Scholar]
- Lowney, C.L. Stream temperature variation in regulated rivers: Evidence for a spatial pattern in daily minimum and maximum magnitudes. Water Resour. Res. 2000, 36, 2947–2955. [Google Scholar] [CrossRef]
- Takács, K.; Nagy, B.; Kern, Z. Human Impacts on River Ice Regime in the Carpathian Basin. Available online: http://meetingorganizer.copernicus.org/EGU2014/EGU2014-981.pdf (accessed on 14 February 2017).
- Webb, B.W.; Nobilis, F. Long-term changes in river temperature and the influence of climatic and hydrological factors. Hydrol. Sci. 2007, 52, 74–85. [Google Scholar] [CrossRef]
- Dripps, W.; Granger, S.R. The impact of artificially impounded, residential head-water lakes on downstream water temperature. Environ. Earth Sci. 2013, 68, 2399–2407. [Google Scholar] [CrossRef]
- Water Framework Directive WFD, Directive 2000/60/EC of the European Parliament and of the Council Establishing a Framework for the Community Action in the Field of Water Policy. Available online: http://ec.europa.eu/environment/water/water-framework (accessed on 10 February 2017).
- Sinokrot, B.A.; Stefan, H.G. Stream water temperature sensitivity to weather and bed parameters. J. Hydraul. Eng. 1994, 120, 722–736. [Google Scholar] [CrossRef]
- Basarin, B.; Lukić, T.; Pavić, D.; Wilby, R.L. Trends and multi-annual variability of water temperatures in the river Danube, Serbia. Hydrol. Process. 2016, 30, 3315–3329. [Google Scholar] [CrossRef]
- Boryczka, J.; Stopa-Boryczka, M. Cyclic temperature and precipitation fluctuations in Poland in 19th–21st century. Acta Agrophys. 2004, 3, 21–33. (In Polish) [Google Scholar]
- Michalska, B. Variability of air temperature in north western Poland. In Environmental Aspects of Climate Change; Szwejkowski, Z., Ed.; University of Warmia and Mazury in Olsztyn: Olsztyn, Poland, 2009; pp. 89–107. [Google Scholar]
- Łykowski, B.; Gołaszewski, D.; Kleniewska, M. Variability of thermal and precipitation annual courses in Warsaw. Sci. Rev. Eng. Environ. Sci. 2004, 2, 154–161. [Google Scholar]
- Żmudzka, E. On the variability of precipitation in lowland Poland in the 2nd half of the 20th century. Inst. Meteorol. Water Manag. Messages 2002, 25, 23–38. (In Polish) [Google Scholar]
- Kożuchowski, K.; Żmudzka, E. Assessment of relations between the normalised difference vegetation index (NDVI), frequency of forest fires, air temperature, sunshine, precipitation in Poland. Geogr. Pol. 2001, 74, 29–40. [Google Scholar]
- Kundzewicz, Z.W.; Przymusińska, I. Changes in air temperature in Poland in the period 1961–2000. Facts and interpretation. Message IMGW 2002, 4, 63–72. (In Polish) [Google Scholar]
- Kasprowicz, T.; Mager, P. Climatically tendencies observed on Wielkopolska Lowland. In Proceedings of the 1-st Polish Conference ADAGIO, Poznan, Poland, 24 April 2007. (In Polish). [Google Scholar]


© 2018 by the author. Licensee MDPI, Basel, Switzerland. This article is an open access article distributed under the terms and conditions of the Creative Commons Attribution (CC BY) license (http://creativecommons.org/licenses/by/4.0/).