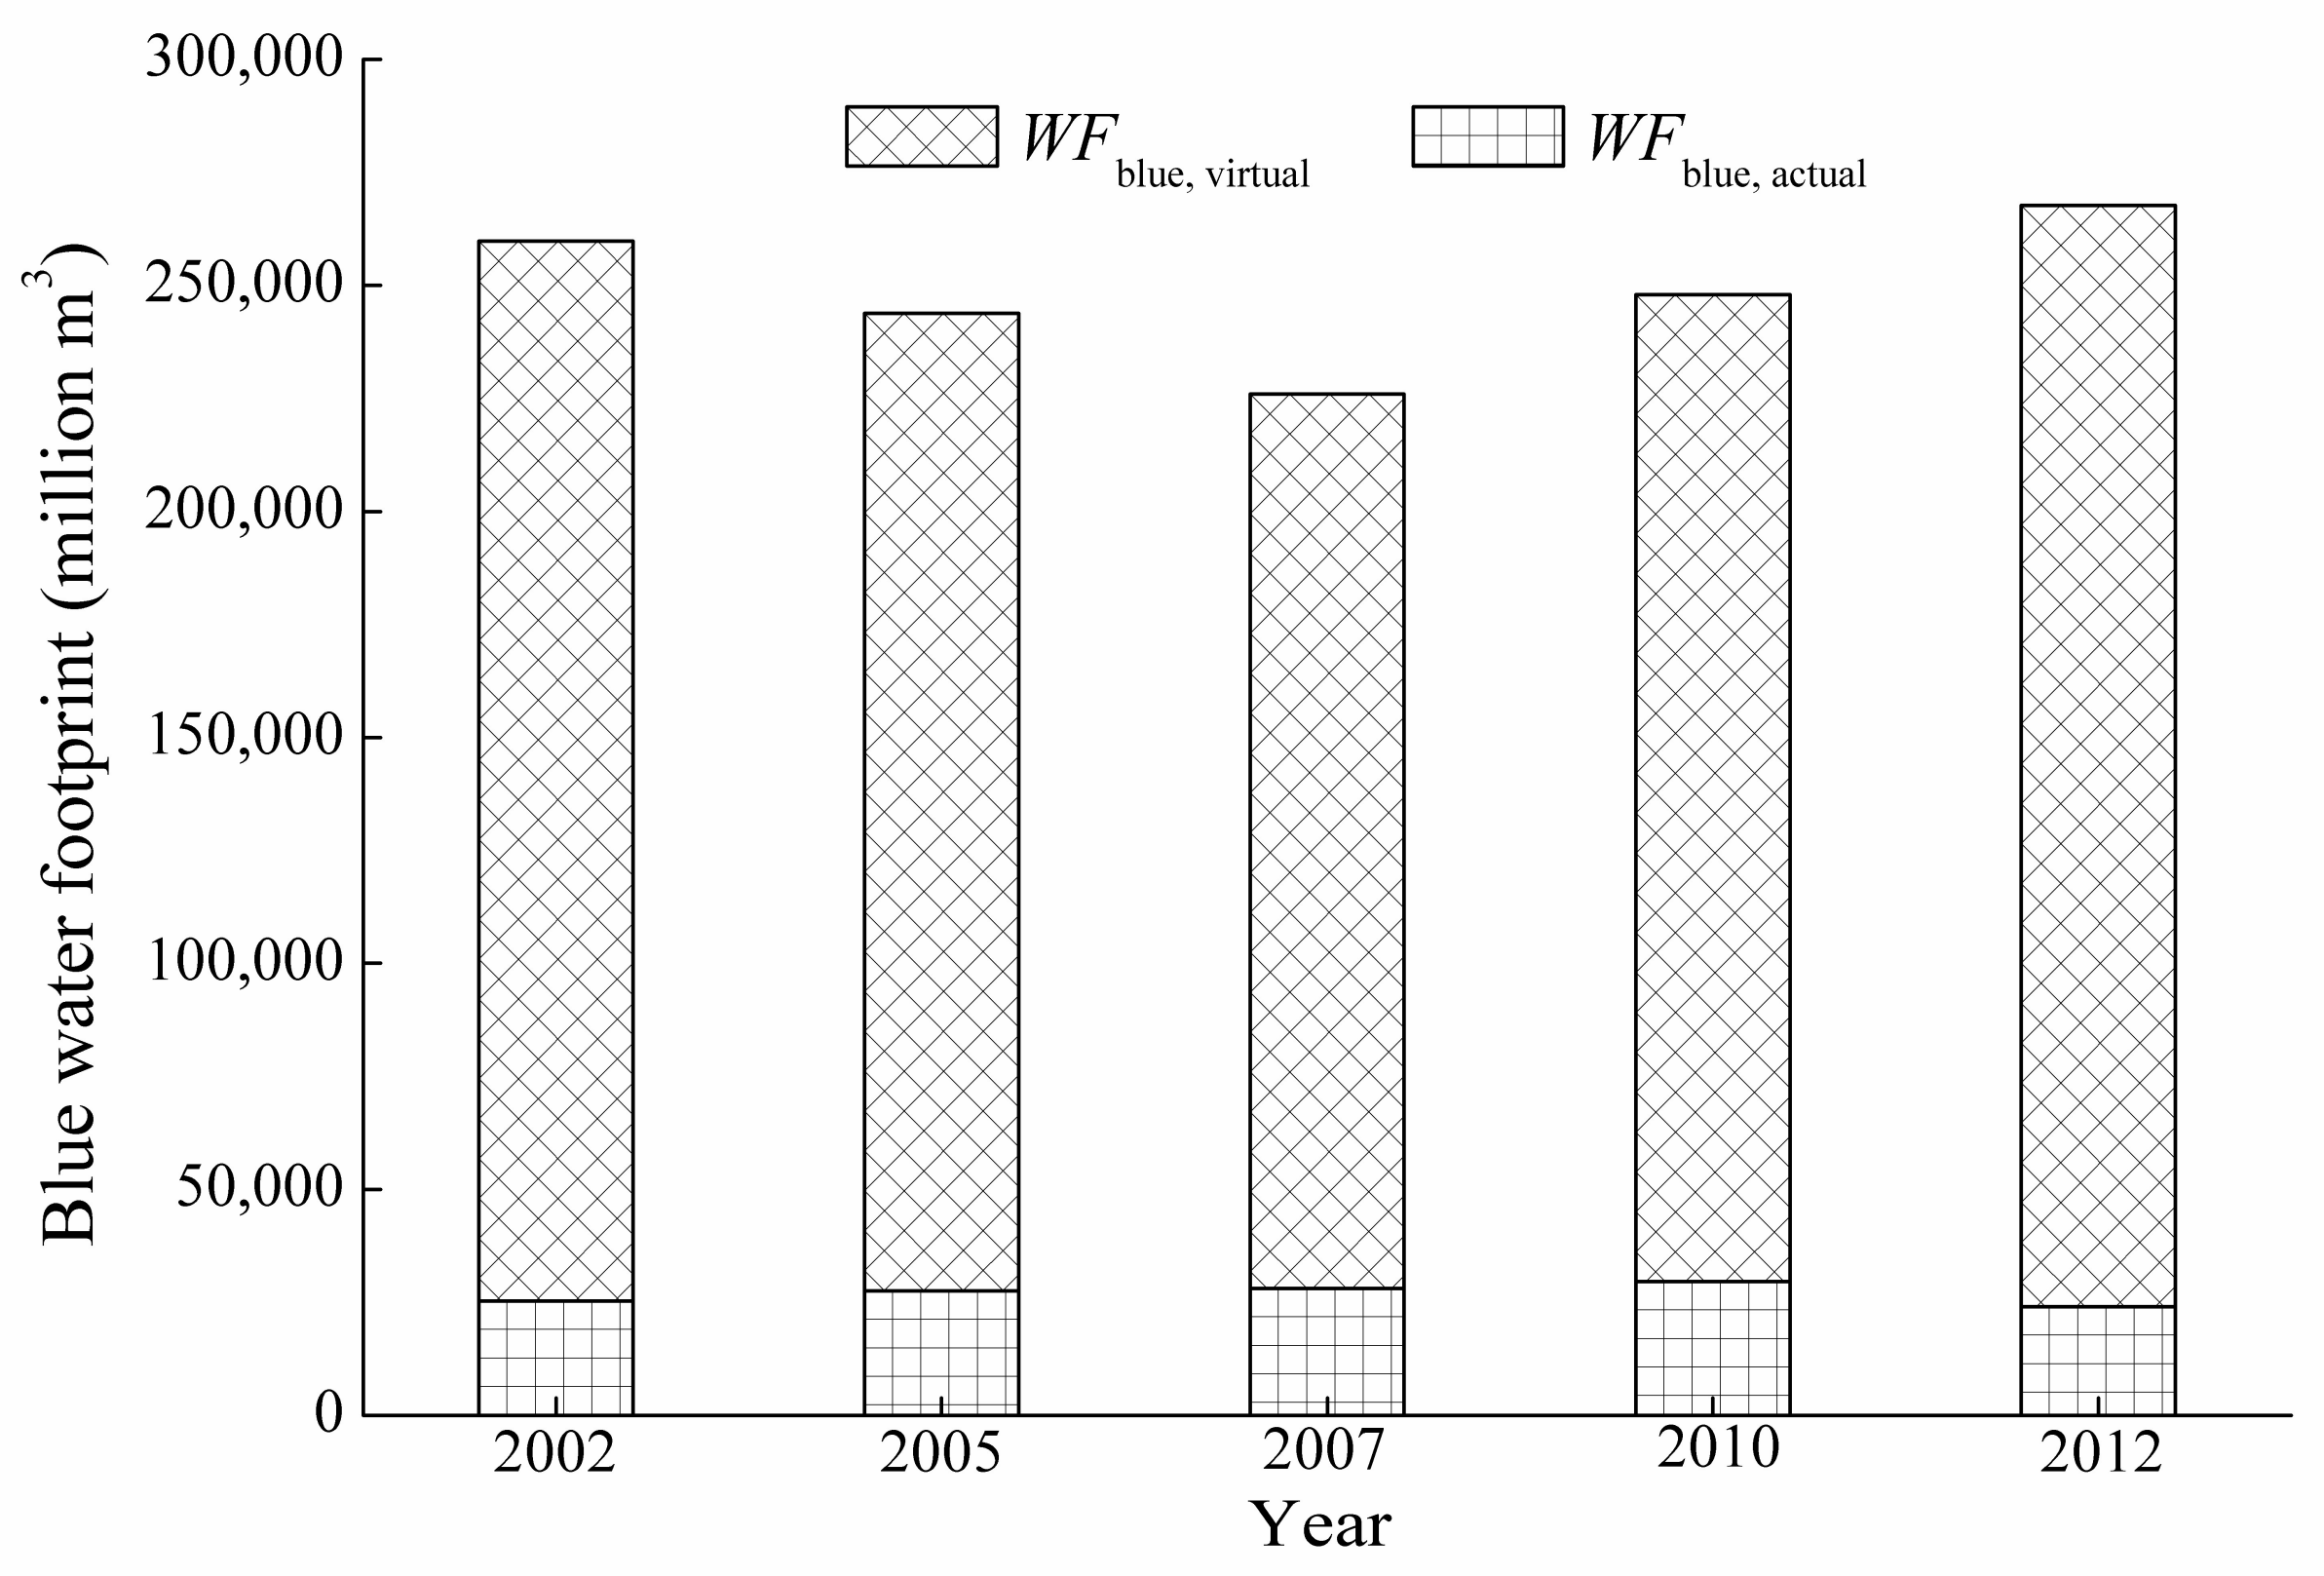
3.2. The Consumption Structure of Blue Water Footprint
From 2002 to 2012, the annual average of
was 0.03 trillion m
3, and the annual average of
was 0.22 trillion m
3; virtual blue water footprint occupied a large proportion (89%) of the blue water footprint, while the proportion of actual water consumption was almost negligible, indicating that the consumption of goods and services for final use was the major way to produce blue water footprint.
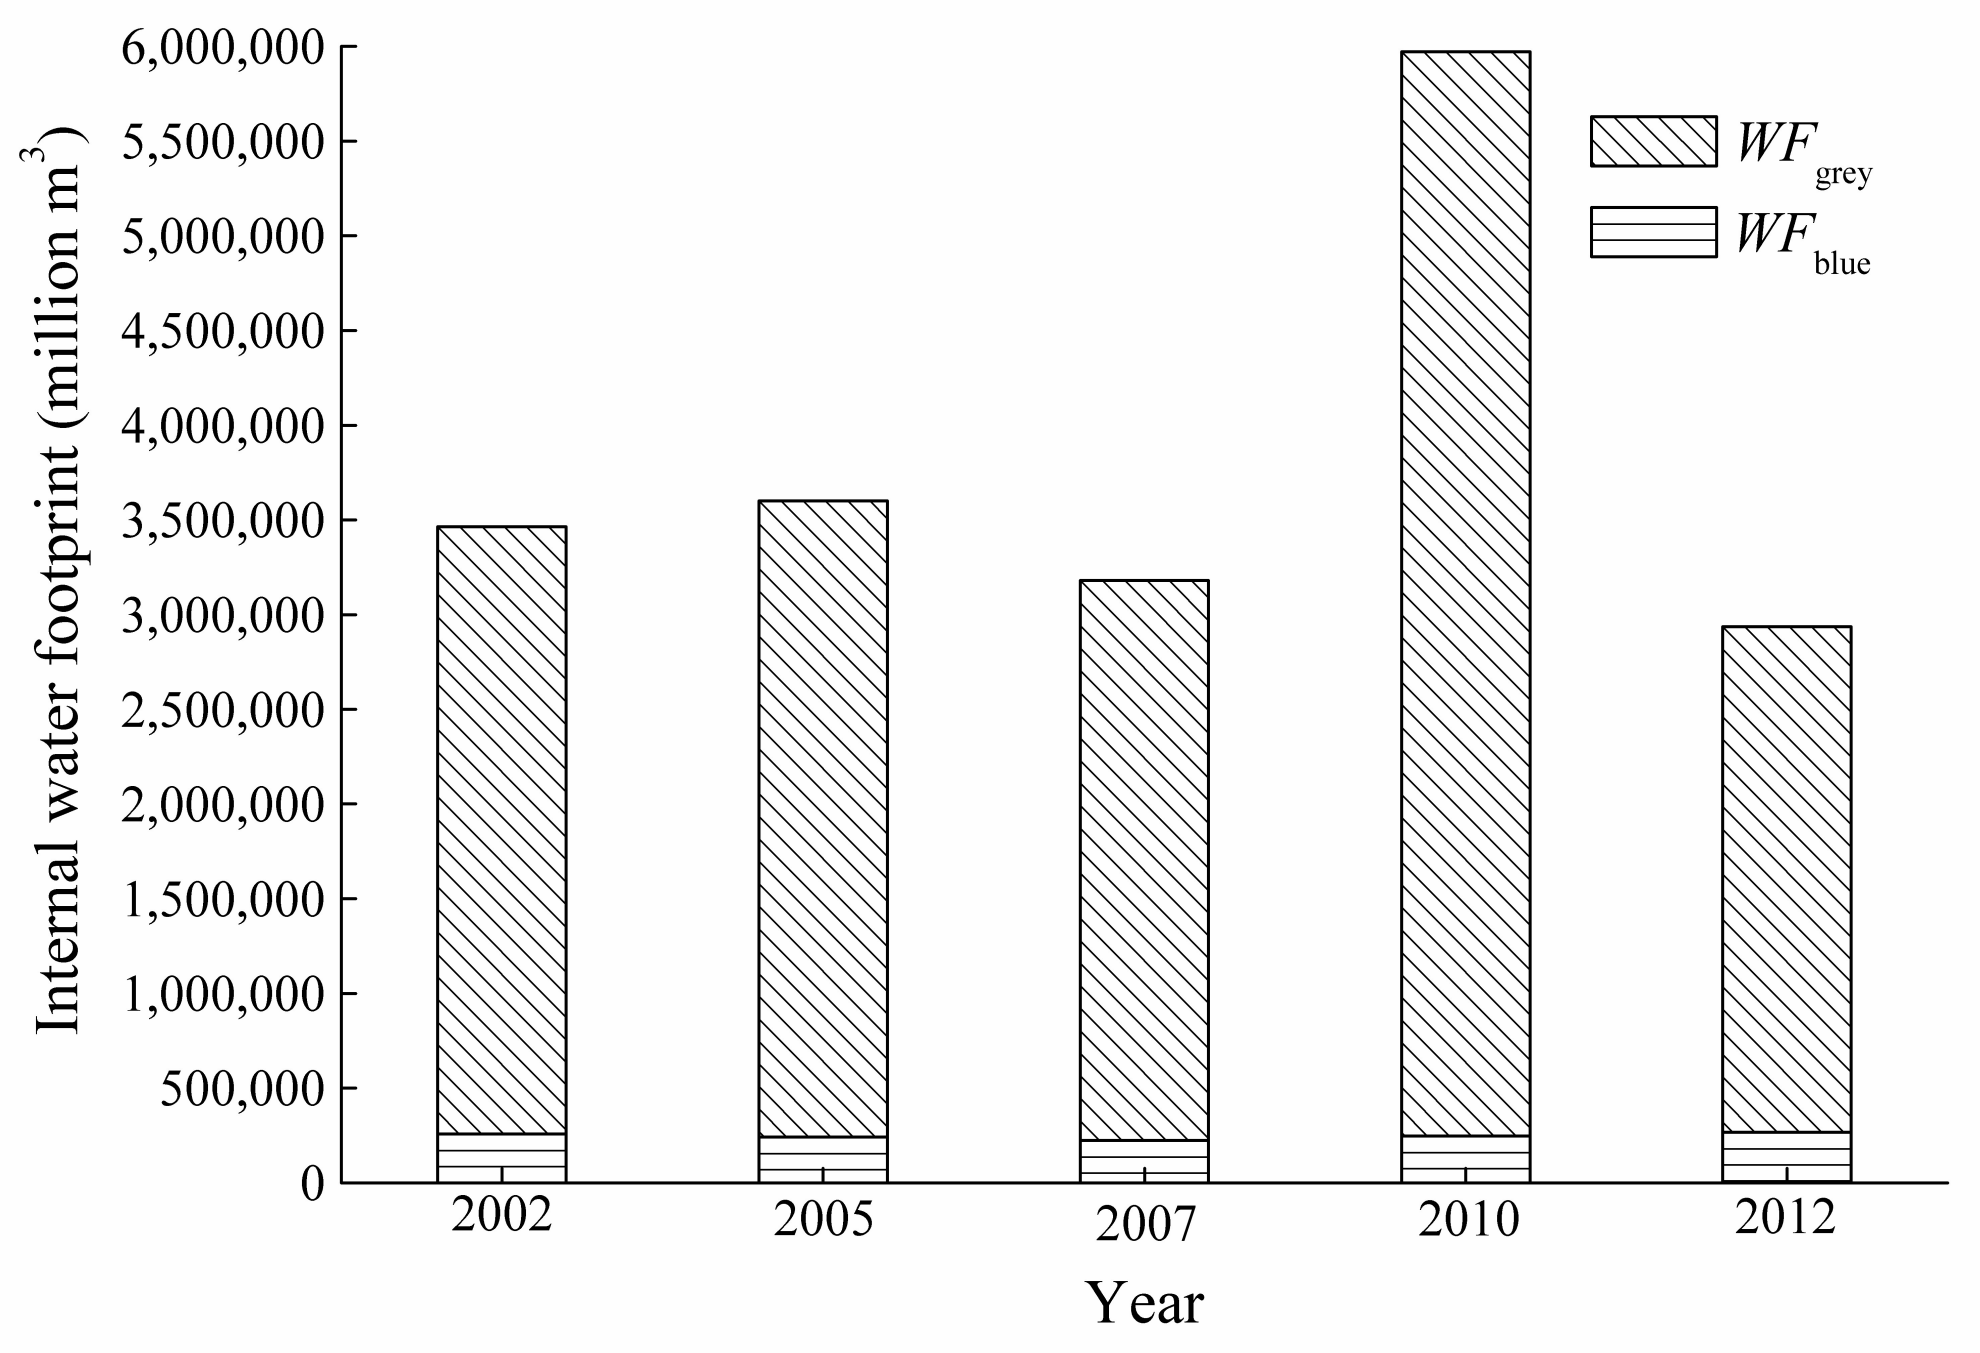
Figure 3 shows the inter-annual variations of
and its compositions from 2002 to 2012, it is obvious that
first decreased from 2002 to 2005, and then increased continuously and slightly from 2005 to 2012.
was relatively stable.
Table 2 shows the sectoral
of China from 2002 to 2012. Virtual blue water footprint in agriculture (sector 1) was the largest, with an average value of 87 billion m
3, accounting for 39.2% of the total virtual blue water footprint, followed by that in sector 6 (food and tobacco processing) which was 46.6 billion m
3, accounting for 21% of the total virtual blue water footprint. Nineteen out of twenty-four industrial sectors had the proportions of
over total virtual blue water footprint less than one percent.
of tertiary industry (sector 26) was 33.5 billion m
3, accounting for 15.1% of the total virtual blue water footprint. Change trends of
varied among different sectors. Seventeen out of twenty-six sectors had
increased, among which
in sector 11 (petroleum processing and coking) increased the fastest during the study period, with an average increase rate of 9.6%; followed by that in sector 10 (papermaking and cultural articles) and sector 17 (transport equipment), of which the increase rates were 9.3% and 8.3%, respectively.
in sector 2 (coal mining and processing) decreased the fastest, with an average decrease rate of −14.7%, followed by that in sector 5 (non-metallic and other minerals mining) whose decrease rate was −7.9%.
in sector 19 (electronic and telecommunications equipment) and sector 23 (gas production and supply) had very small changes, with the change rates less than one percent.
Virtual blue water footprint was caused by rural residents’ consumption (23%), urban residents’ consumption (42%), government consumption (7%), gross fixed capital formation and inventory investment (28%).
For the
caused by rural residents’ consumption (
Table 3), agriculture (sector 1) contributed the most, of which the
on average was as high as 32.3 billion m
3, accounting for 62.8% of the total
caused by rural residents’ consumption, followed by sector 6 (food and tobacco processing), of which the
on average was 12.4 billion m
3, accounting for 24.2%. Thirteen out of twenty-six sectors had very small
caused by rural residents’ consumption, all accounting for less than 0.1%. As for change trends,
caused by rural residents’ consumption in sector 14 (metal smelting and processing) and sector 5 (non-metallic and other minerals mining) presented the greatest and second greatest decreasing trends, with the decrease rates of −16% and −15.8%, respectively; while
caused by rural residents’ consumption in sector 23 (electronic and heating power production and supply) and sector 10 (papermaking and cultural articles) presented the greatest and second greatest increasing trends, with the increase rates of 10.7% and 9%, respectively.
Among the caused by urban residents’ consumption, agriculture (sector 1) also contributed the most, of which the on average was 38.5 billion m3, accounting for 41% of the total caused by urban residents’ consumption, followed by sector 6, of which the on average was 30.3 billion m3, accounting for 32.3%. Seven out of twenty-six sectors had very small caused by urban residents’ consumption, all accounting for less than 0.1%. As for change trends, eleven out of twenty-six sectors showed decreasing trends. caused by urban residents’ consumption in sector 3 (crude mining and processing), sector 5 (non-metallic and other minerals mining) and sector 14 (metal smelting and processing) showed the top three greatest decreasing trends, with the decrease rates of −20%, −15.9% and −15.9%, respectively; while caused by urban residents’ consumption in sector 11 (petroleum processing and coking) and sector 17 (transport equipment) showed the greatest and second greatest increasing trends, with the increase rates of 16.1% and 12.2%, respectively.
For caused by government consumption, it concentrated in tertiary industry (sector 26) and agriculture (sector 1), which were 13.1 billion m3 and 18.8 billion m3, accounting for 87.4% and 12.6% of the total caused by government consumption, respectively.
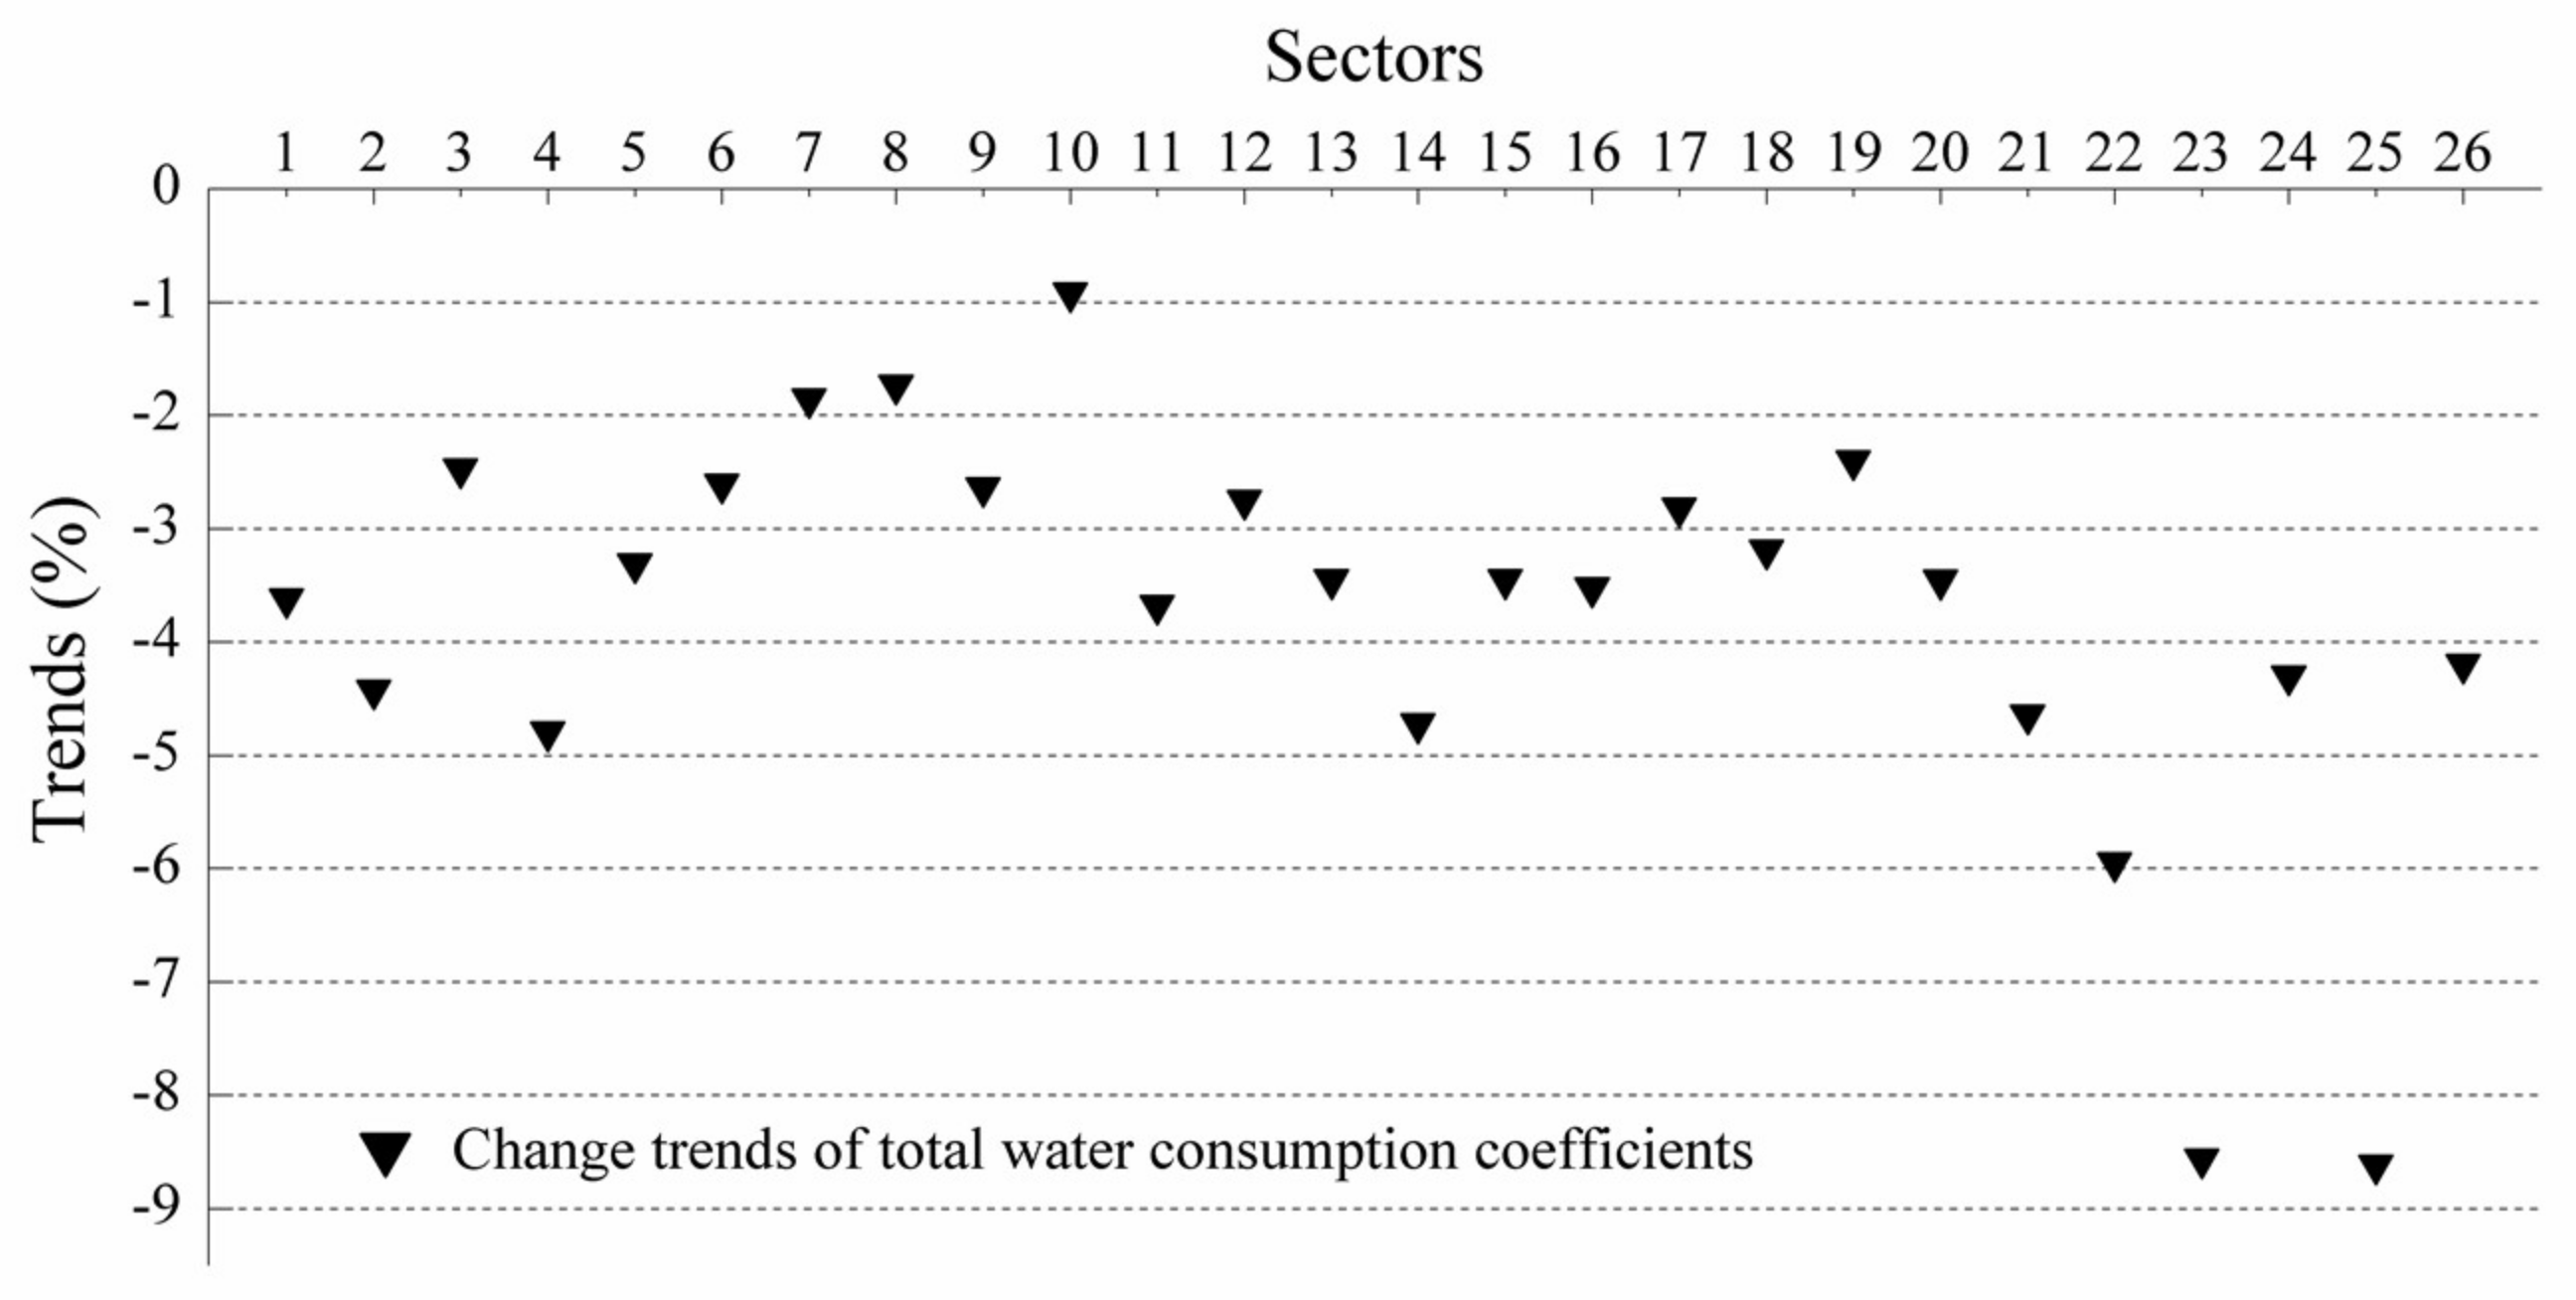
Virtual blue water footprint is determined by total water consumption coefficient and the corresponding expenditure. The expenditure reflects the consumption structure, while the total water consumption coefficient is related to the direct water consumption coefficient and industrial chain, thus reflecting the technological level and industrial structure. From 2002 to 2012, all the sectors had their total water consumption coefficients decreased, with the change rates ranging from −8.6% to −0.9% (
Figure 4). Therein, the total water consumption coefficient in sector 25 (construction) decreased the most, of which the decrease rate was −8.6%. Therefore, the increase of
in most sectors was caused by the increase of domestic consumption. Especially, rural residents’ demands for sector 23 (gas production and supply) and urban residents’ demands for sector 11 (petroleum processing and coking) and sector 17 (transport equipment) expanded obviously during the study period.
Taking the total water consumption coefficient in 2010 for example (
Figure 4), we find that agriculture (sector 1) had the highest total water consumption coefficient, followed by food and tobacco processing (sector 6).
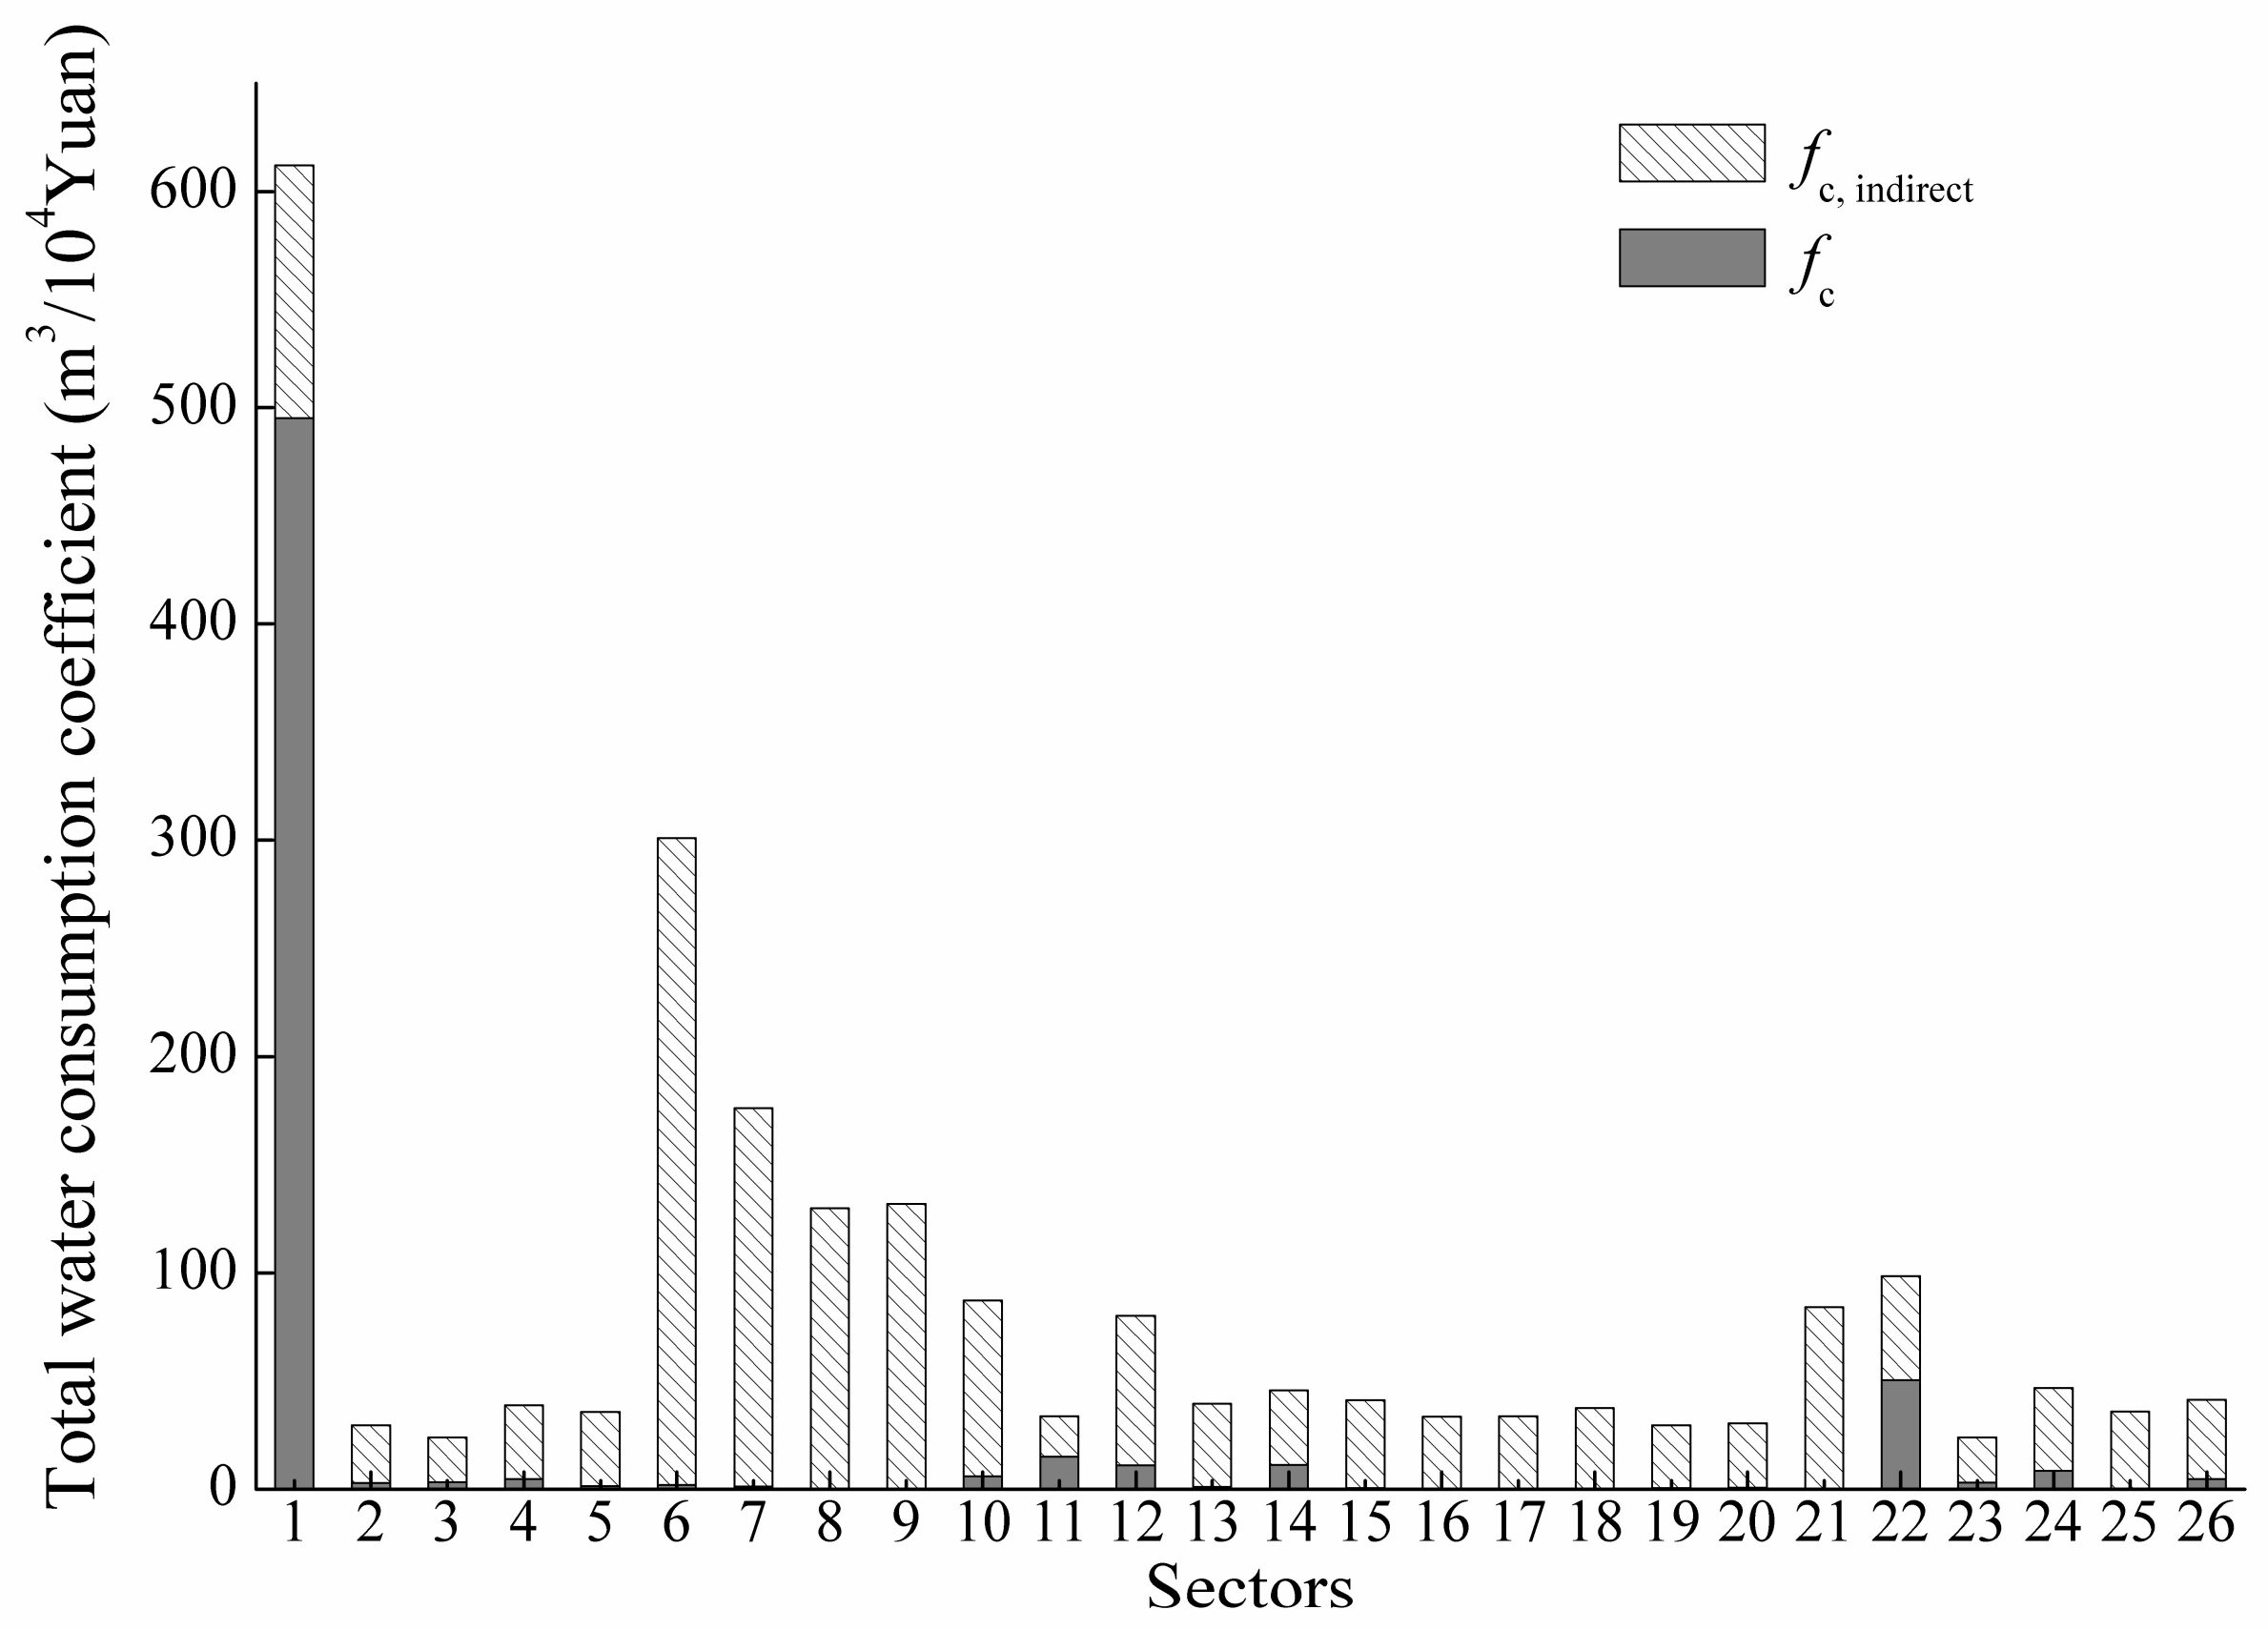
The compositions of total water consumption coefficients varied among sectors. Taking 2010 for example (
Figure 5), the direct water consumption coefficient in agriculture accounted for the largest proportion of total water consumption coefficient, which reached 81%, followed by that in sector 22 (electronic and heating power production and supply) and that in sector 11 (petroleum processing and coking), of which the proportions were 51% and 44%, respectively. Sectors with the indirect water consumption coefficients higher than 50% reached 24, accounting for 92.3% of the total sectors; those higher than 90% reached 10, accounting for 38% of the total sectors, indicating that most of the virtual blue water footprint was produced by the intermediate virtual water input, i.e., the virtual water embedded in the raw materials, other than the fresh water input. In other words, the accumulated effect of industrial chain had very significant impacts on virtual blue water footprint.
3.3. The Consumption Structure of Grey Water Footprint
From 2002 to 2012, the average grey water caused by living return water was 0.72 trillion m3, and that caused by virtual return water was 2.89 trillion m3 (conversion with the Grade III water standard). Grey water footprint caused by virtual return water took a substantial proportion (80%) of grey water footprint, indicating that the consumption of goods and services for domestic consumption was the major way to produce grey water footprint.
Table 4 shows the sectoral virtual grey water footprint of China from 2002 to 2012. Virtual grey water footprint in tertiary industry (sector 26) was the highest (sector 25 was not taken into discussion since it does not indicate a specific industry), which was as high as 787.1 billion m
3, accounting for 27.5% of the total
, followed by that in sector 6 (food tobacco and processing), which was 676 billion m
3, accounting for 23.7% of the total
. Nineteen sectors had the proportions of
over total virtual grey water footprint less than one percent. As for change trends, seventeen sectors showed overall decreasing trends, with sector 2 (coal mining and processing) decreased the most, with the decrease rate of −18.4%. Sector 15 (metal products) had
increased the most, with the increase rate of 13.5%.
Virtual grey water footprint was caused by rural residents’ consumption (12%), urban residents’ consumption (33%), government consumption (11%), and gross fixed capital formation and inventory investment (44%).
Among the
caused by rural residents’ consumption (
Table 3), sector 6 (food and tobacco processing) contributed the most, which was 181.7 billion m
3 on average, accounting for 54.6% of the total
caused by rural residents’ consumption, followed by tertiary industry (sector 26), which contributed 88.1 billion m
3 on average, accounting for 26.5%; twenty-one out of twenty-six sectors had very small
caused by rural residents’ consumption, accounting for less than one percent. As for change trends, sixteen out of twenty-six sectors showed decreasing trends.
caused by rural residents’ consumption in sector 5 (non-metallic and other minerals mining) and sector 14 (metal smelting and processing) presented the greatest and second greatest decreasing trends, with the decrease rates of −15.7% and −15.4%, respectively; while
caused by rural residents’ consumption in sector 23 (electronic and heating power production and supply) presented the greatest increasing trend, with the increase rate of 5.2%.
For the caused by urban residents’ consumption, sector 6 (food and tobacco processing) also contributed the most, which was 416.8 billion m3 on average, accounting for 44.8% of the total caused by urban residents’ consumption, followed by tertiary industry (sector 26), which contributed 312.8 billion m3 on average, accounting for 33.6%. As for change trends, seventeen out of twenty-six sectors showed decreasing trends. caused by urban residents’ consumption in sector 3 (crude mining and processing), sector 5 (non-metallic and other minerals mining) and sector 14 (metal smelting and processing) showed the top three greatest decreasing trends, with the decrease rates of −20%, −15.8% and −15.4%, respectively; while caused by urban residents’ consumption in sector 17 (transport equipment) and sector 11 (petroleum processing and coking) showed the greatest and second greatest increasing trends, with the increase rates of 10.2% and 9.9%, respectively.
For caused by government consumption, it concentrated in tertiary industry (sector 26) and agriculture (sector 1), which were 307.5 billion m3 and 1.3 billion m3, accounting for 99.4% and 0.4% of the total caused by government consumption, respectively.
Virtual grey water footprint was determined by the conversion coefficient of grey water footprint, total return water coefficient and the corresponding expenditure. The expenditure reflects the consumption structure; total return water coefficient is related to the sectoral direct return water coefficient and industrial chain, thus reflecting the technological level and industrial structure; the conversion coefficient of grey water footprint is related to the pollutant concentration, water quality standard and background pollutant concentration, which reflects the production process, and the demands and status of environment quality.
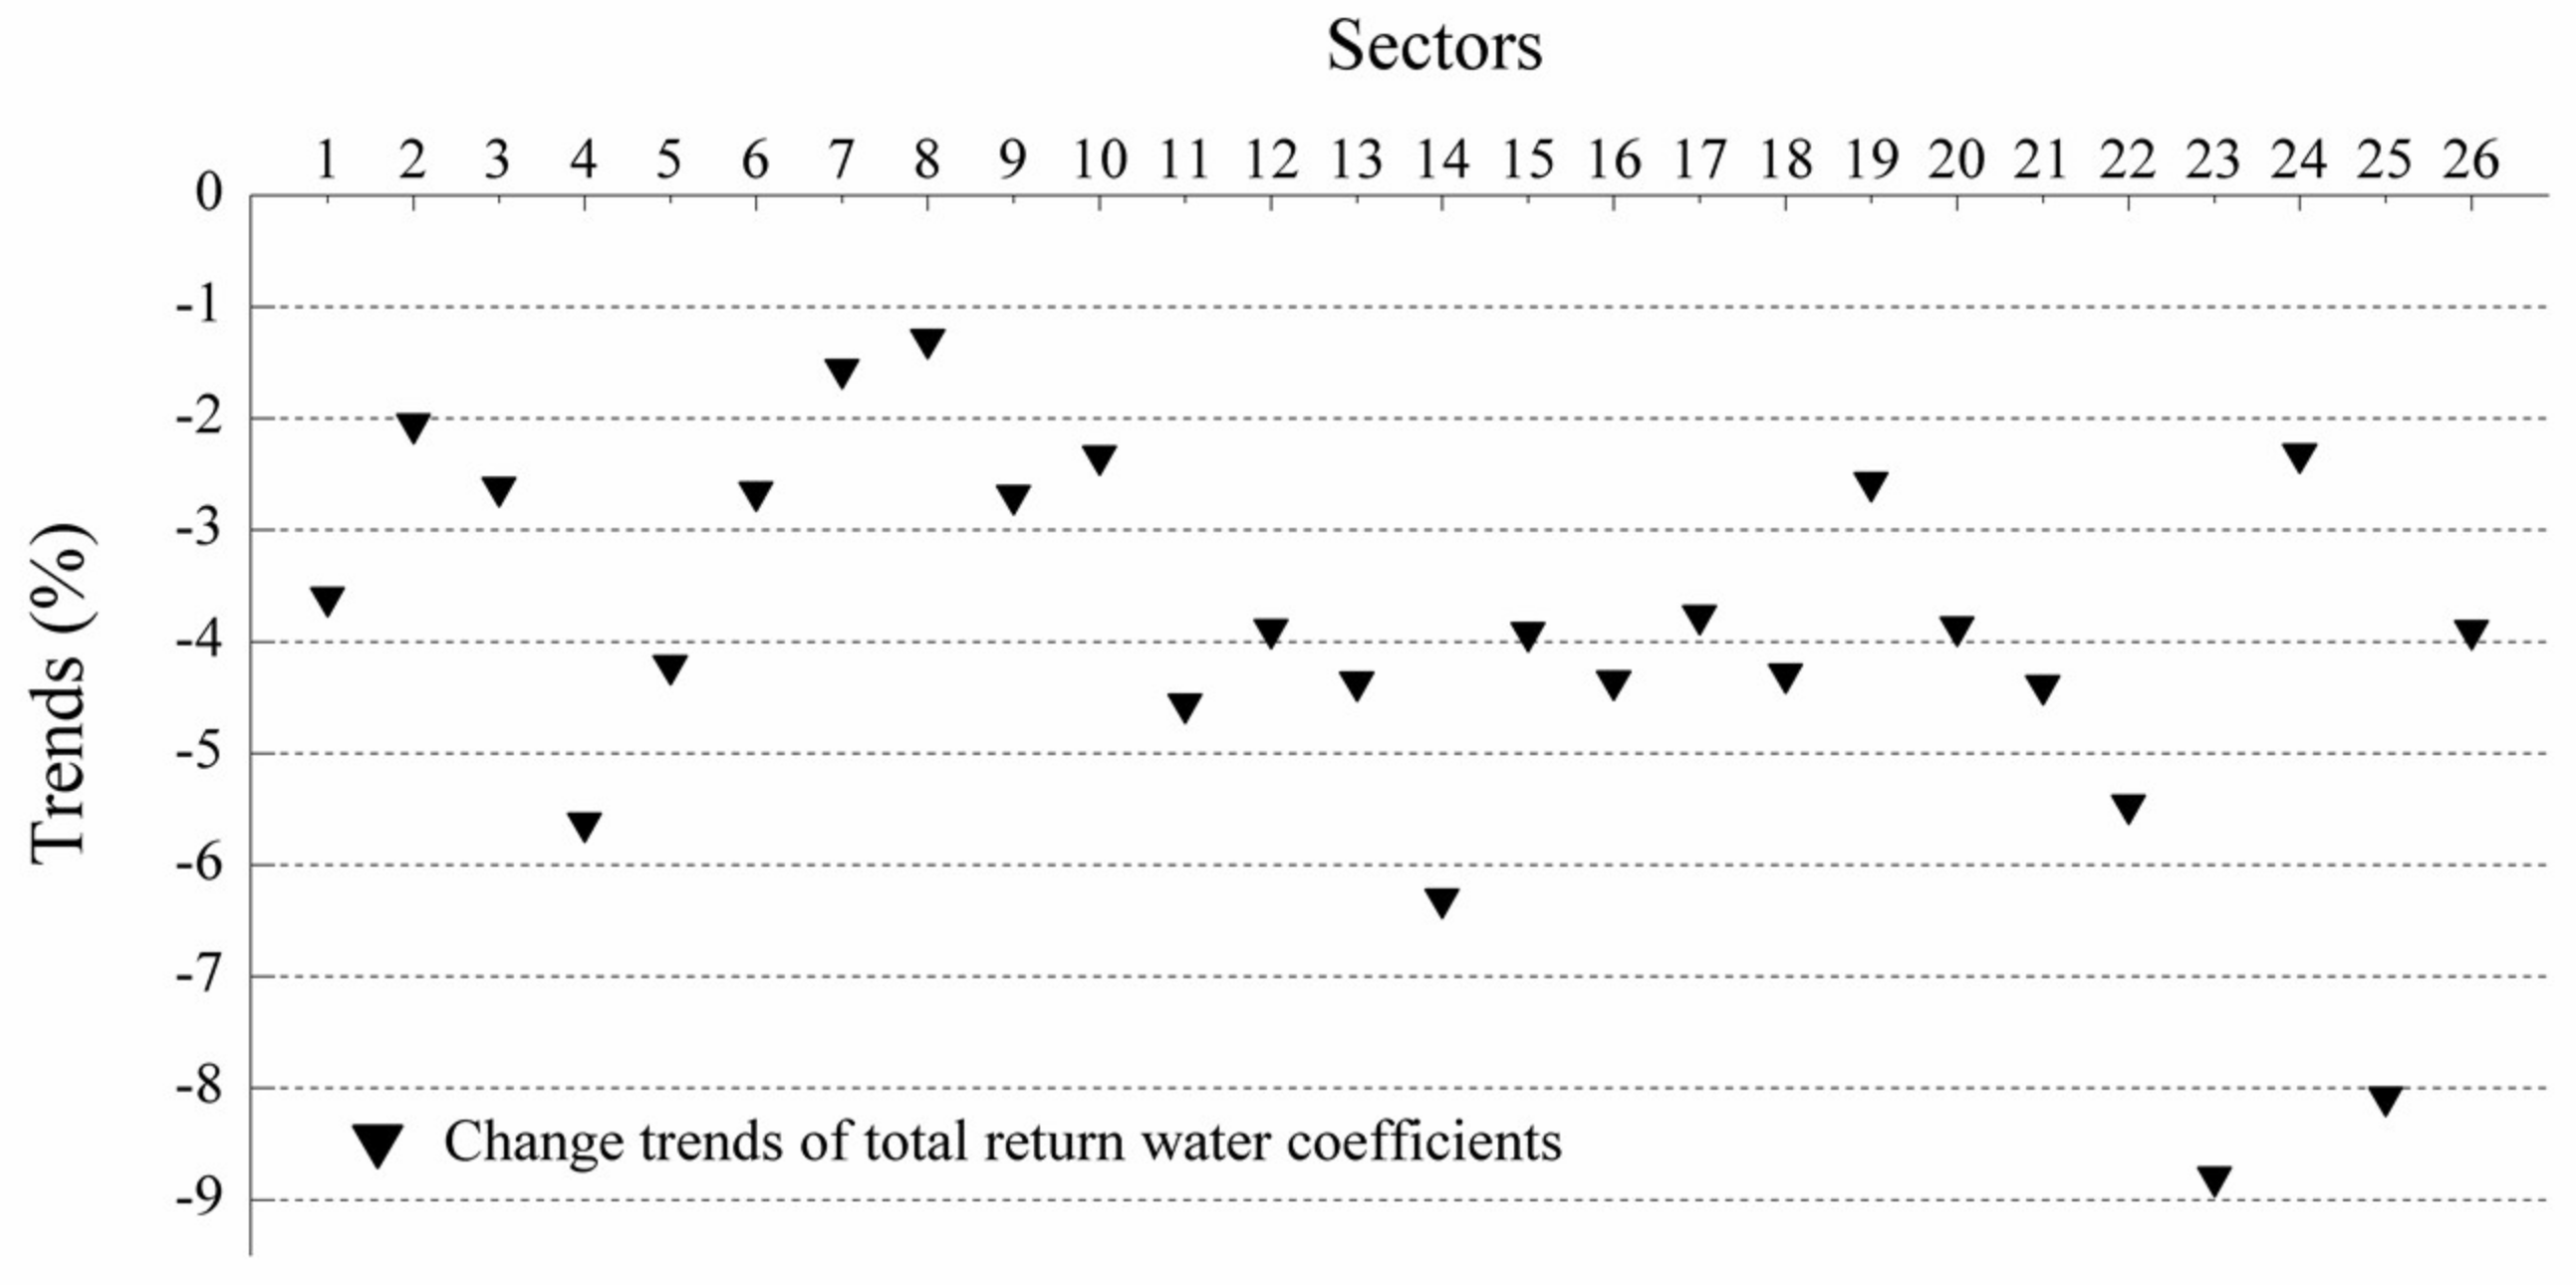
From 2002 to 2012, all sectors had the total return water coefficients decreased, with the decrease rates ranging from −8.8% to −1.3% (
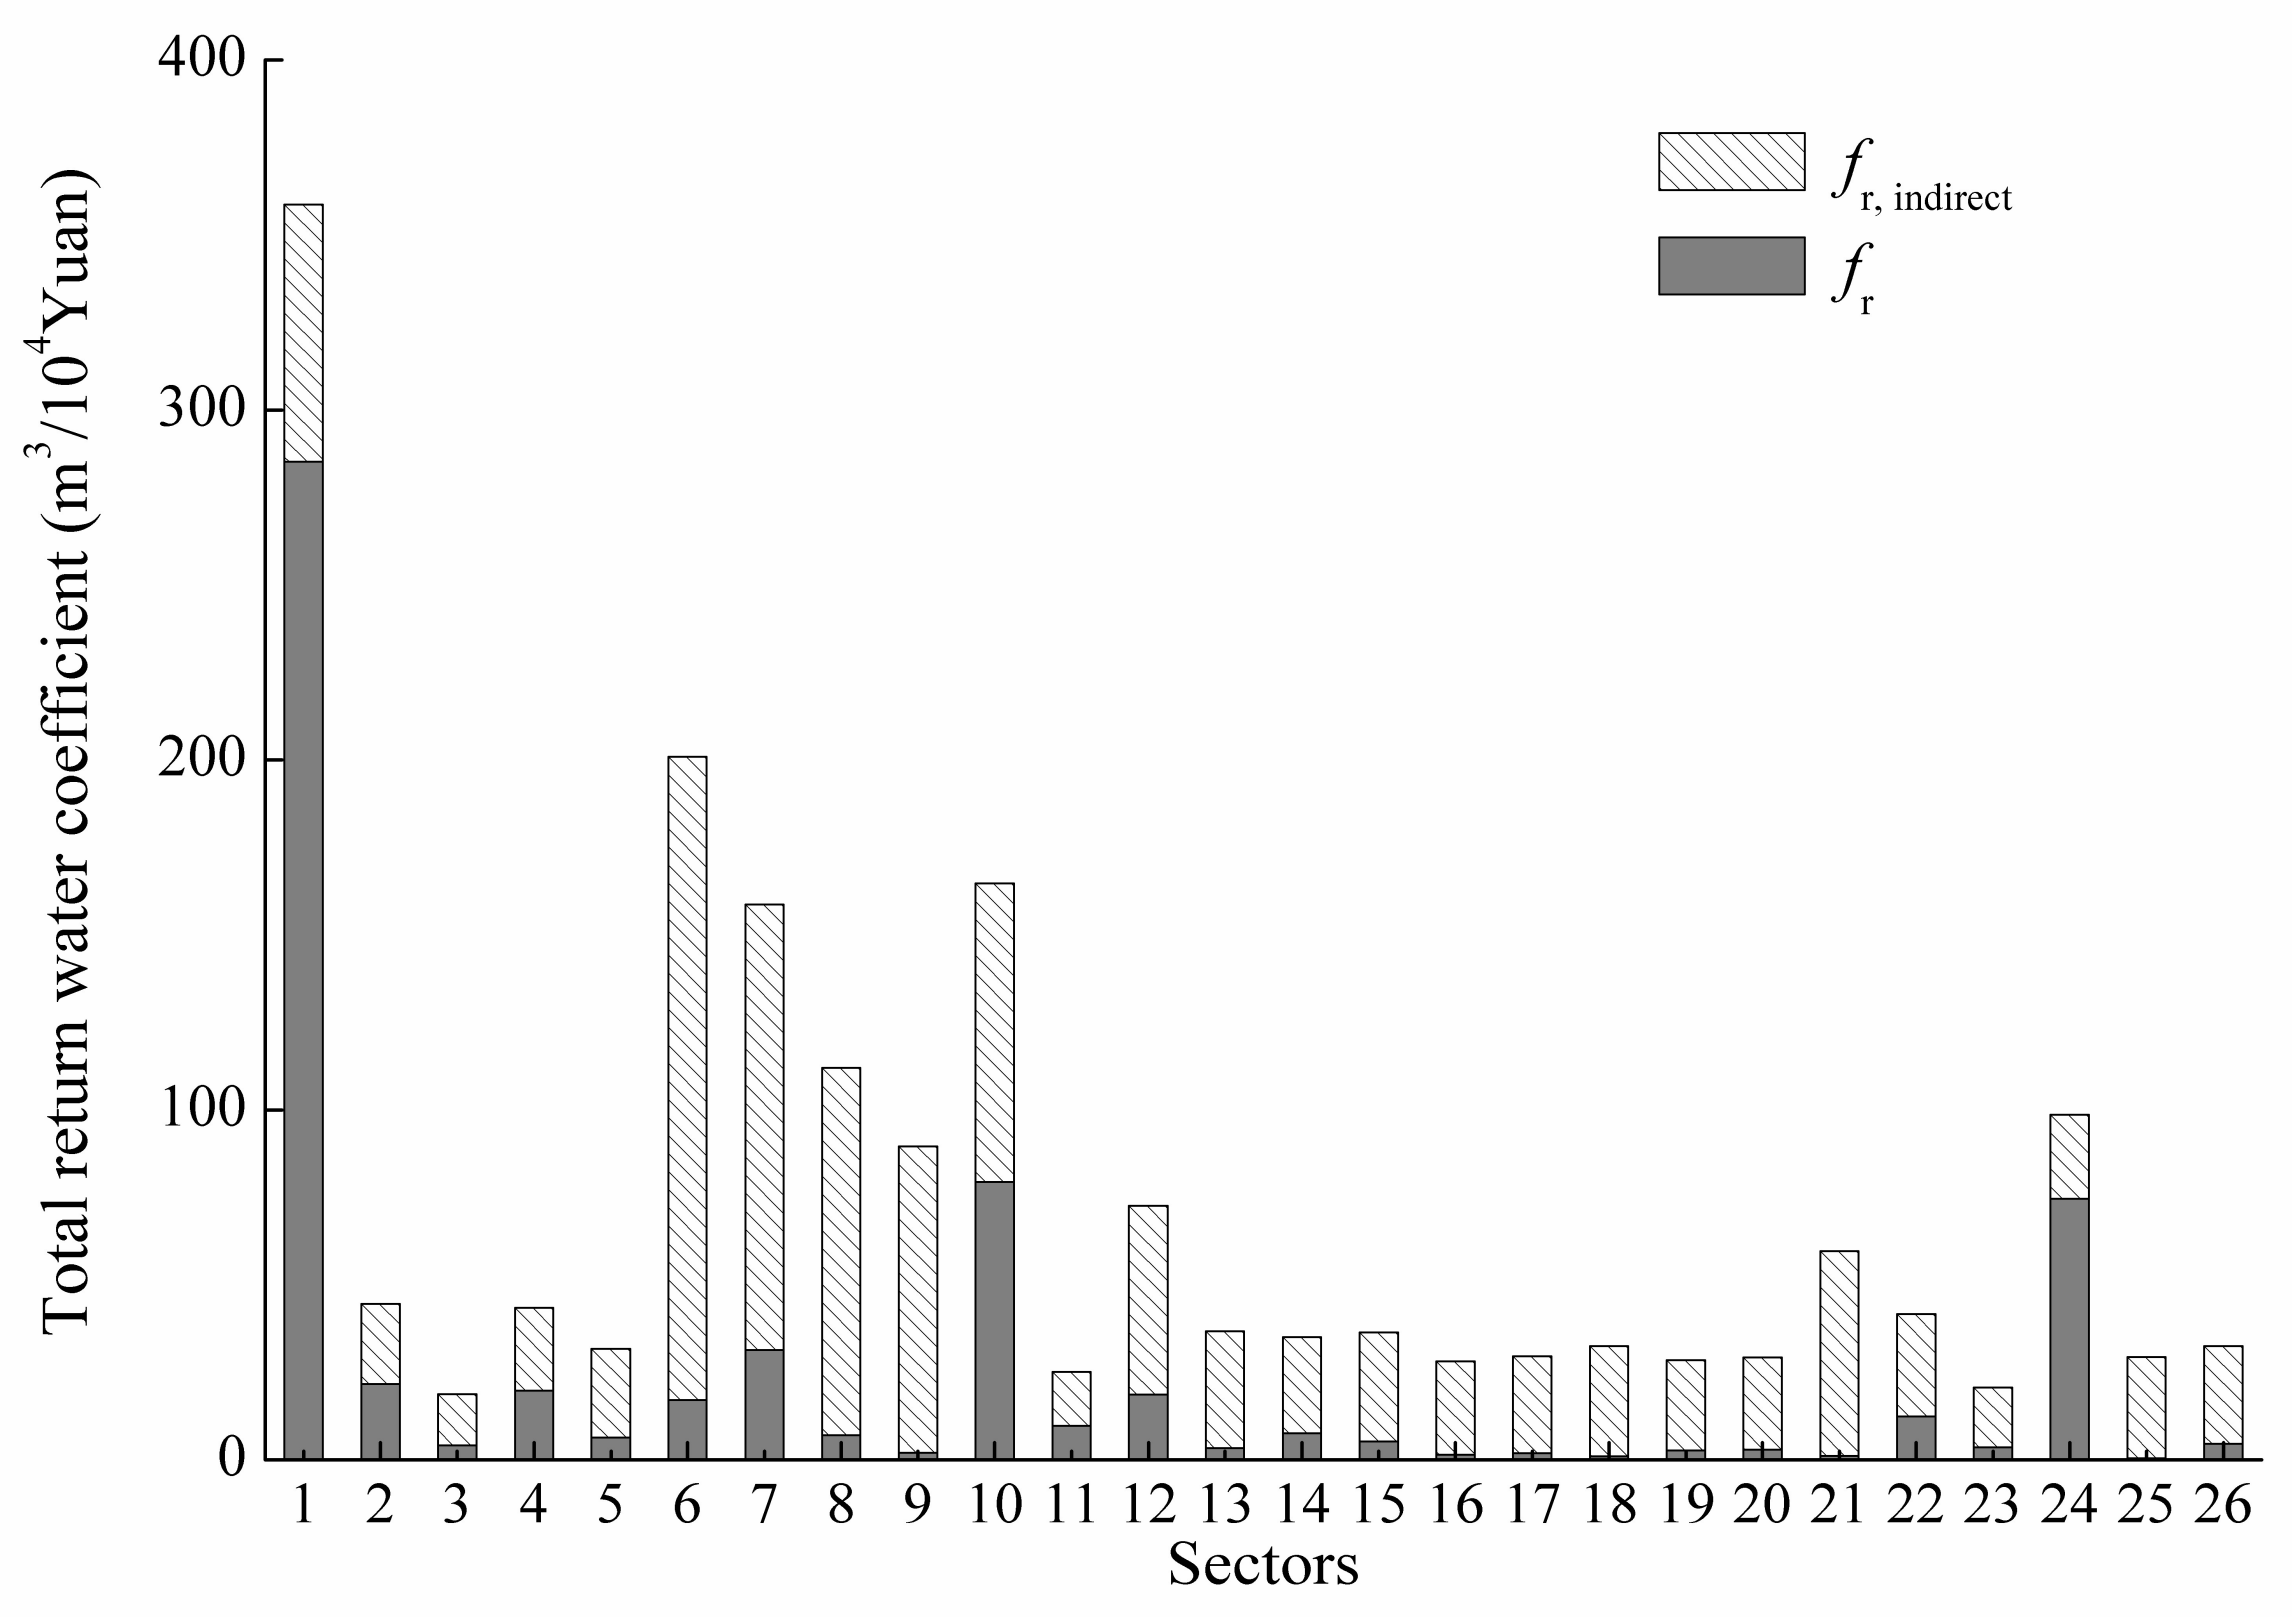
Figure 6). The contributions of direct return water coefficient to total return water coefficient varied among sectors. Taking total return water coefficient in 2010 for example (
Figure 7), direct return water coefficient in agriculture (sector 1) contributed the greatest, accounting for 80%, followed by that in sector 24 (water production and supply), of which the proportion reached 76%. Sectors that had the proportions of indirect return water coefficient over total return water coefficient over 50% reached 24, accounting for 92% of the total sectors, those over 90% reached 11, accounting for 42% of the total sectors, indicating that most of the virtual return water was produced by the intermediate virtual return water input during the production, i.e., the virtual return water embedded in the raw materials, other than the direct return water. In other words, the accumulated effect of production chain had great impacts on grey water footprint.
Table 5 shows the change trends of conversion coefficients of sectoral virtual grey water footprint under Grade III water quality standard from 2002 to 2012. It is evident that from 2002 to 2012, most sectors had the conversion coefficients decreased, indicating a water quality improvement of return water during the study period. Therein, conversion coefficient in sector 3 decreased most, followed by that in sector 16 (general and specialized machinery).
Since both total return water coefficient and conversion coefficient of virtual grey water footprint mostly presented decreasing trends, while final demand exhibited an increasing trend as we discussed in
Section 3.2, the conclusion is obvious that the decrease effect caused by total return water coefficients and conversion coefficients of virtual grey water footprint is more significant than the increase effect caused by final demand during the study period. Of particular importance, rural residents’ demands for sector 23 (gas production and supply) and urban residents’ demands for sector 11 (petroleum processing and coking) and sector 17 (transport equipment) expanded obviously during the study period.


