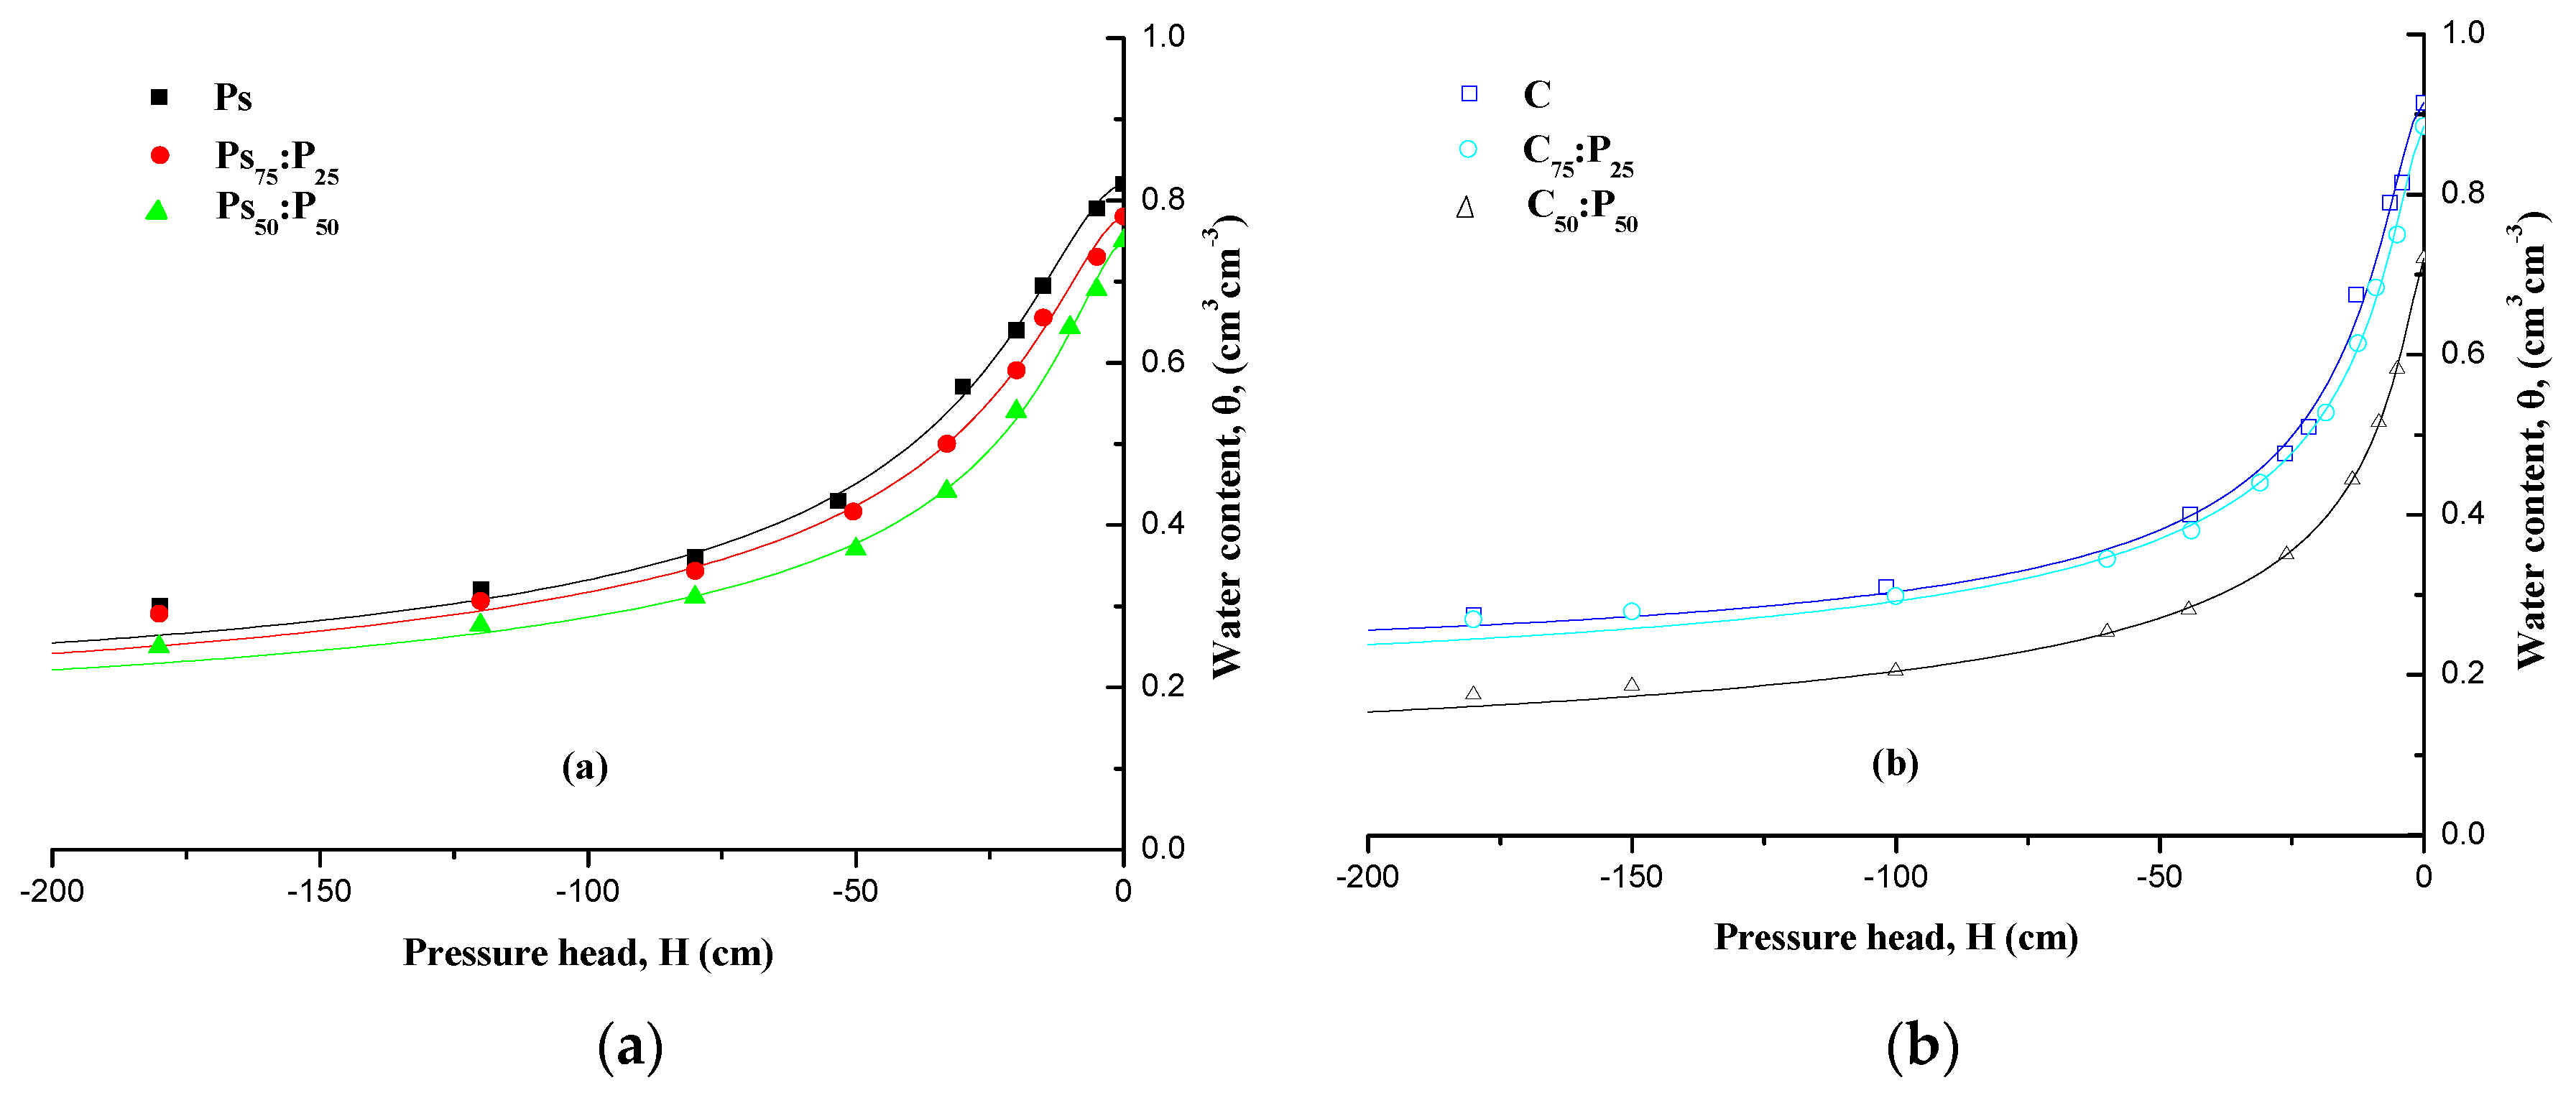
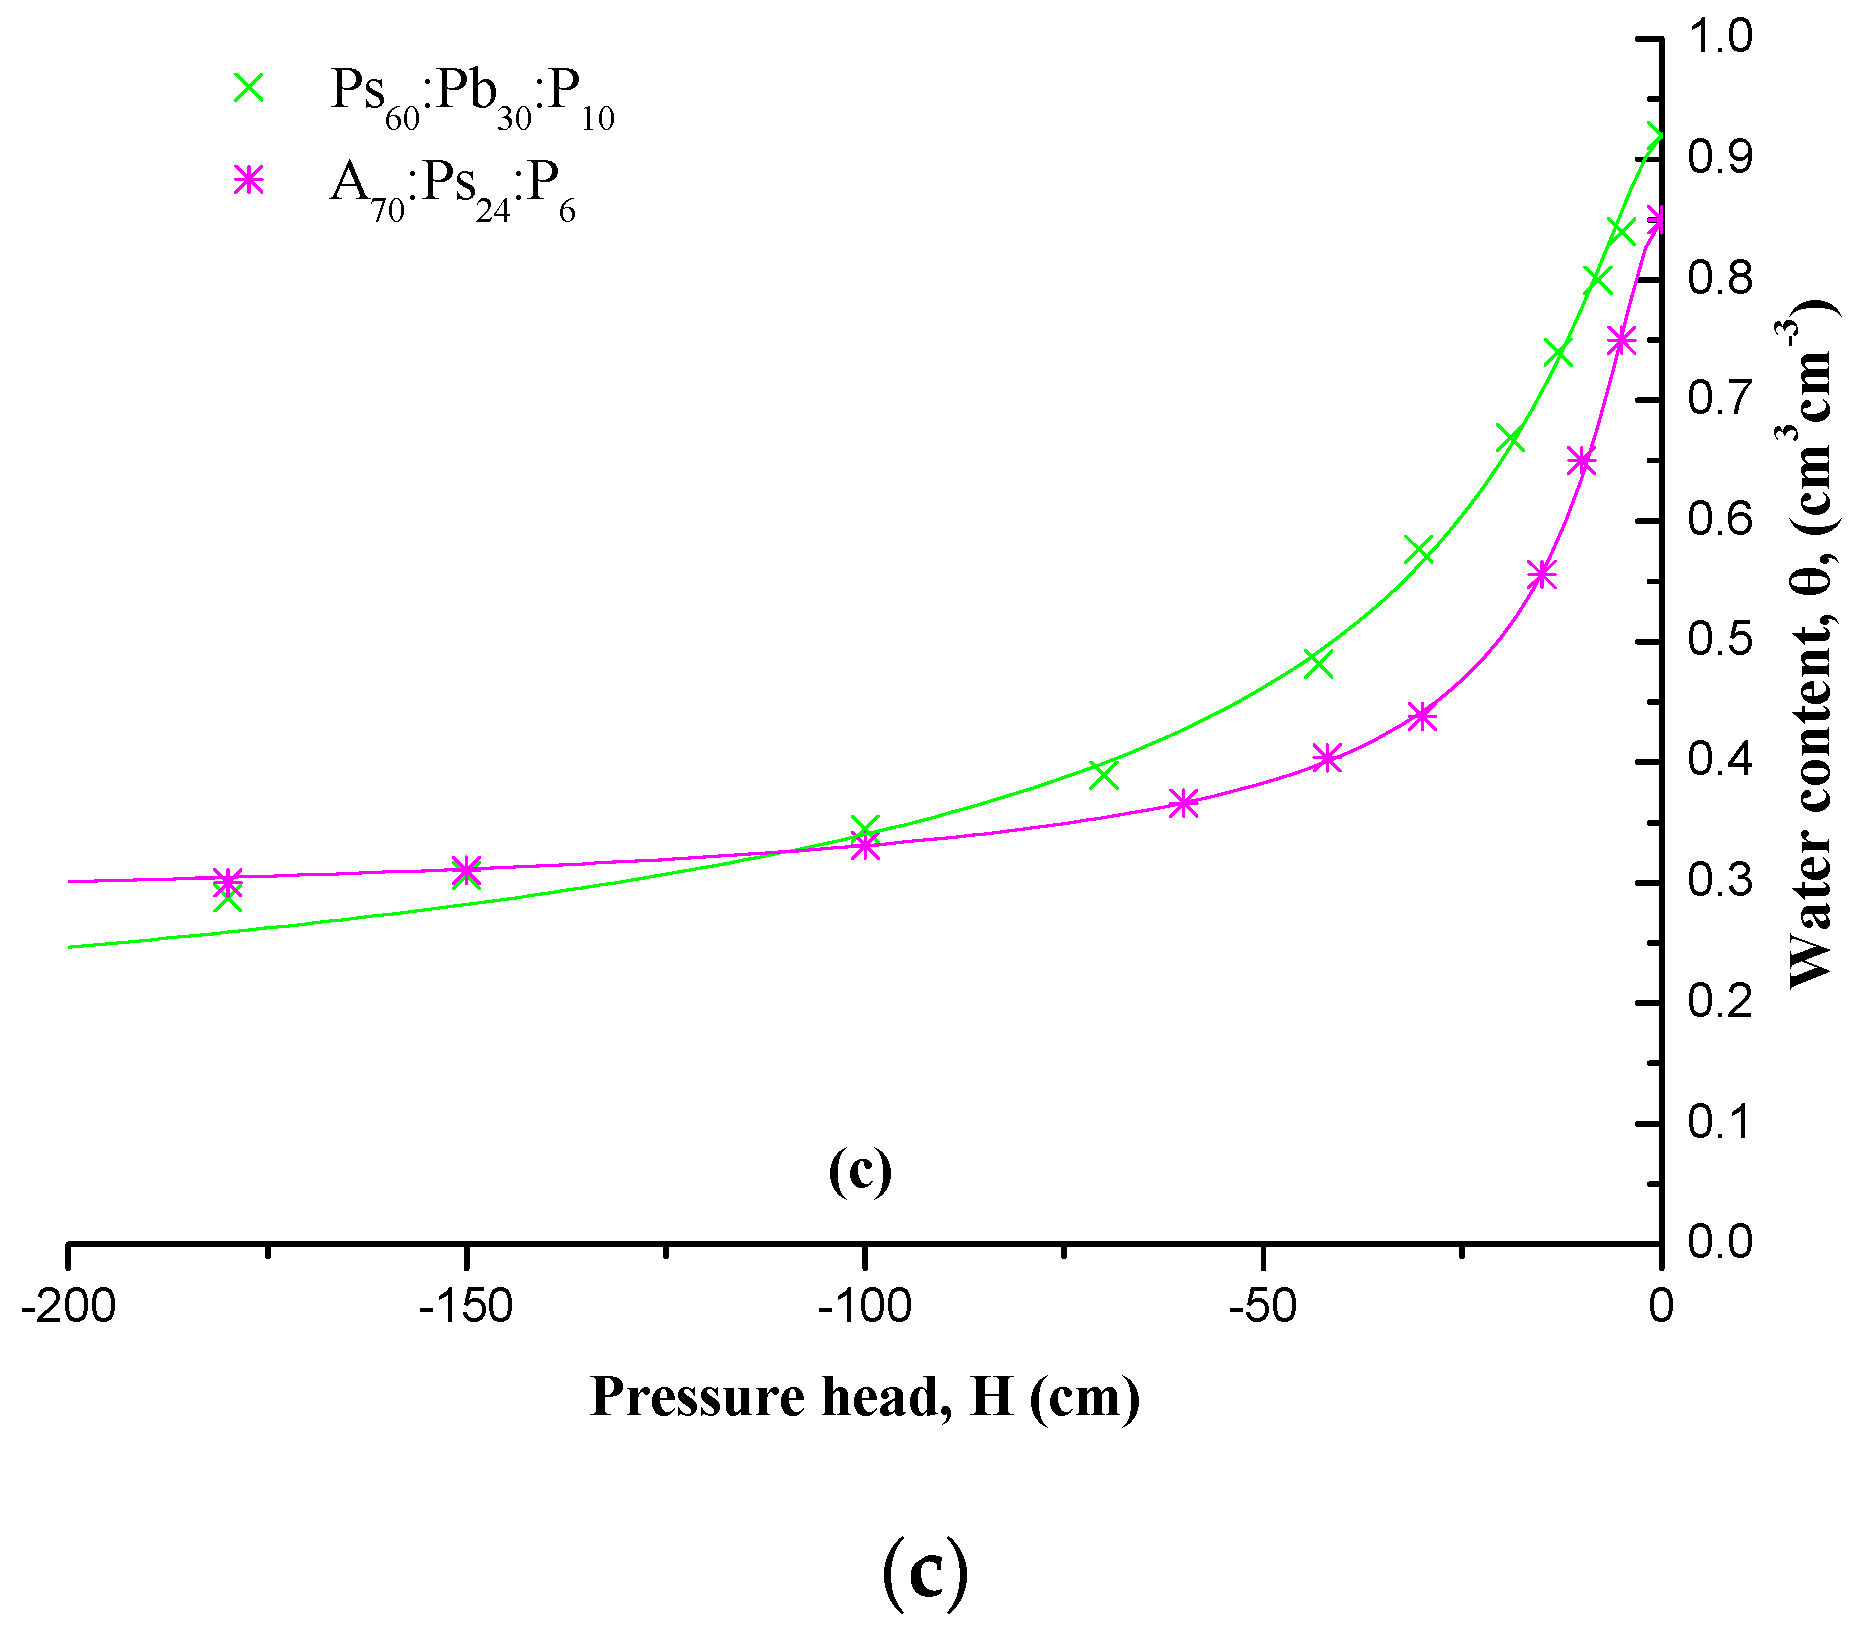
3.1. Physical–Hydraulic Properties of Growing Substrates
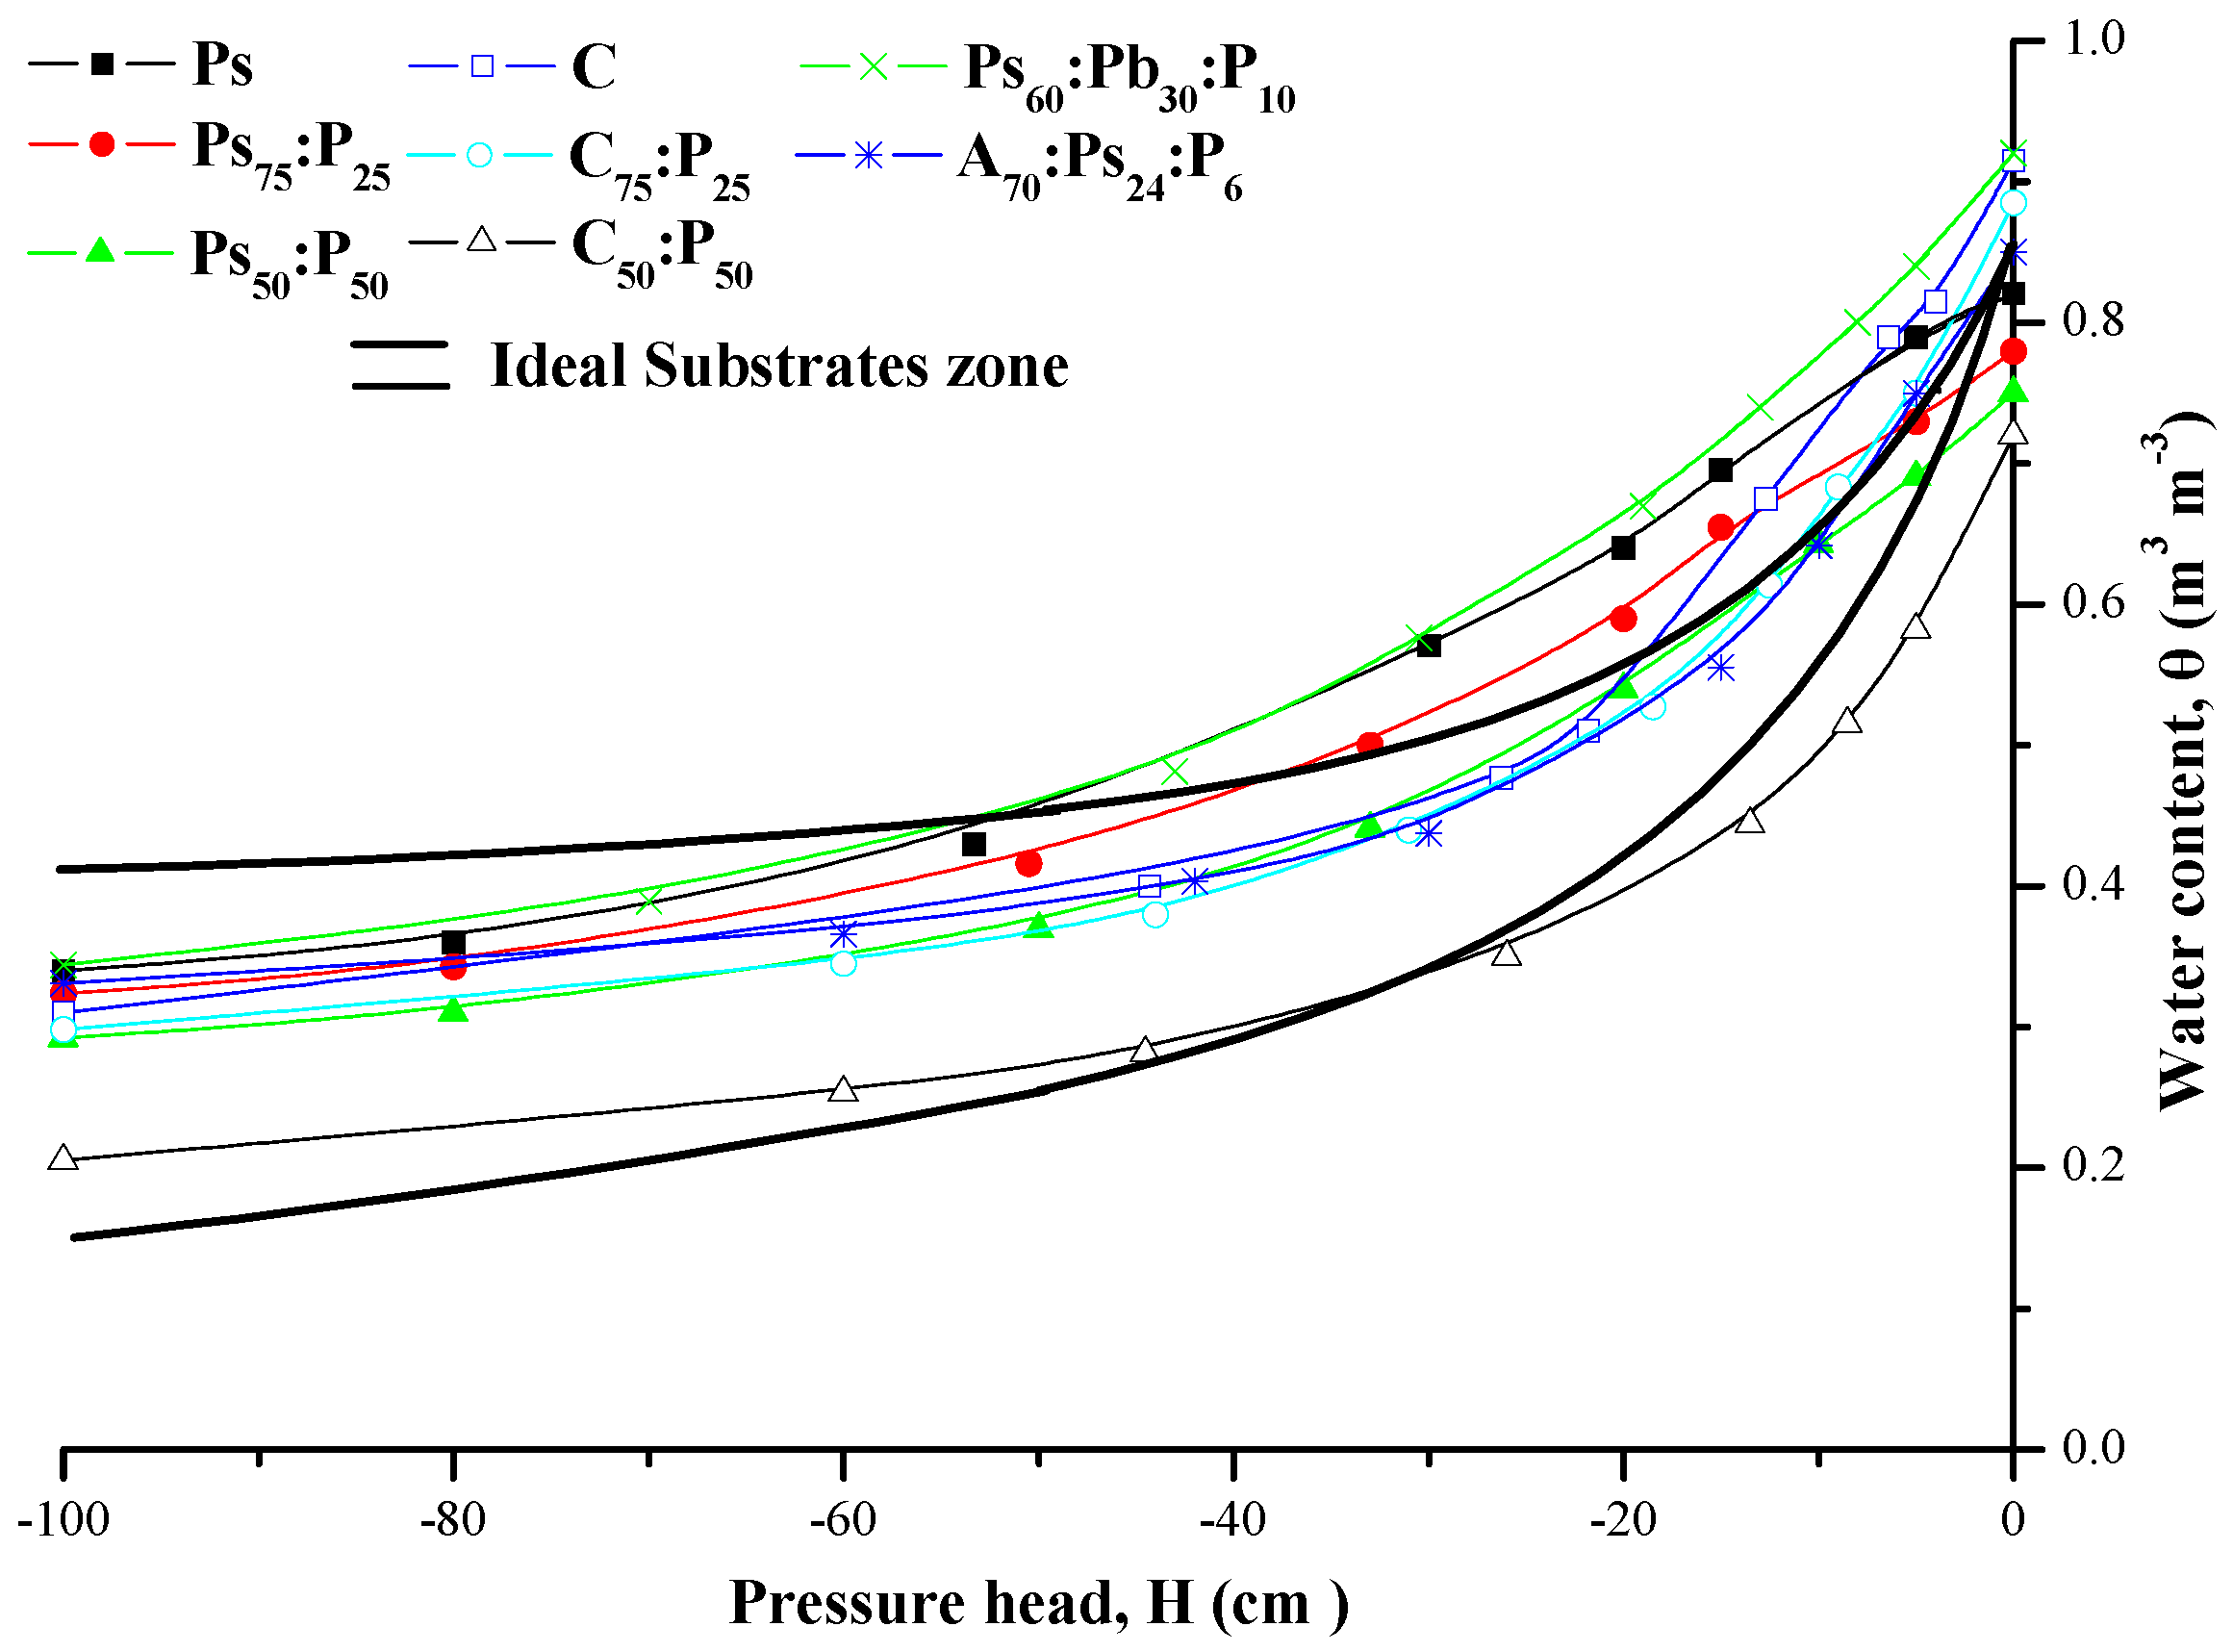
To assess the water retention capacity of the substrates studied, a comparative presentation of water retention curves is given in
Figure 1a–c.
The addition of perlite into peat and coir decreases the total porosity (water content at saturation) and water retention capacity of the peat–perlite (
Figure 1a) and coir–perlite (
Figure 1b) mixtures compared to the pure substrates. The decrease was higher in mixtures with higher percentages of perlite. In the case of the two commercial substrates, the comparison showed that Ps
60:Pb
30:P
10 has a greater total porosity and water retention capacity than A
70:Ps
24:P
6 (
Figure 1c). The knowledge gained from the determination of the substrates’ water retention curves plays a prime role in proper irrigation management.
In
Table 3, the Mualem–van Genuchten model fitting parameters α,
n, and
θr, as well as the experimental values
θs for all substrates examined, are given. As shown in
Figure 1, it is apparent that there is a very good agreement of the results between the experimental and predicted values of
θ(H), indicating that the corresponding soil hydraulic parameters listed in
Table 3 provide an adequate description of the
θ(H) relationship with a coefficient of determination R
2 ≥ 0.993 for all substrates.
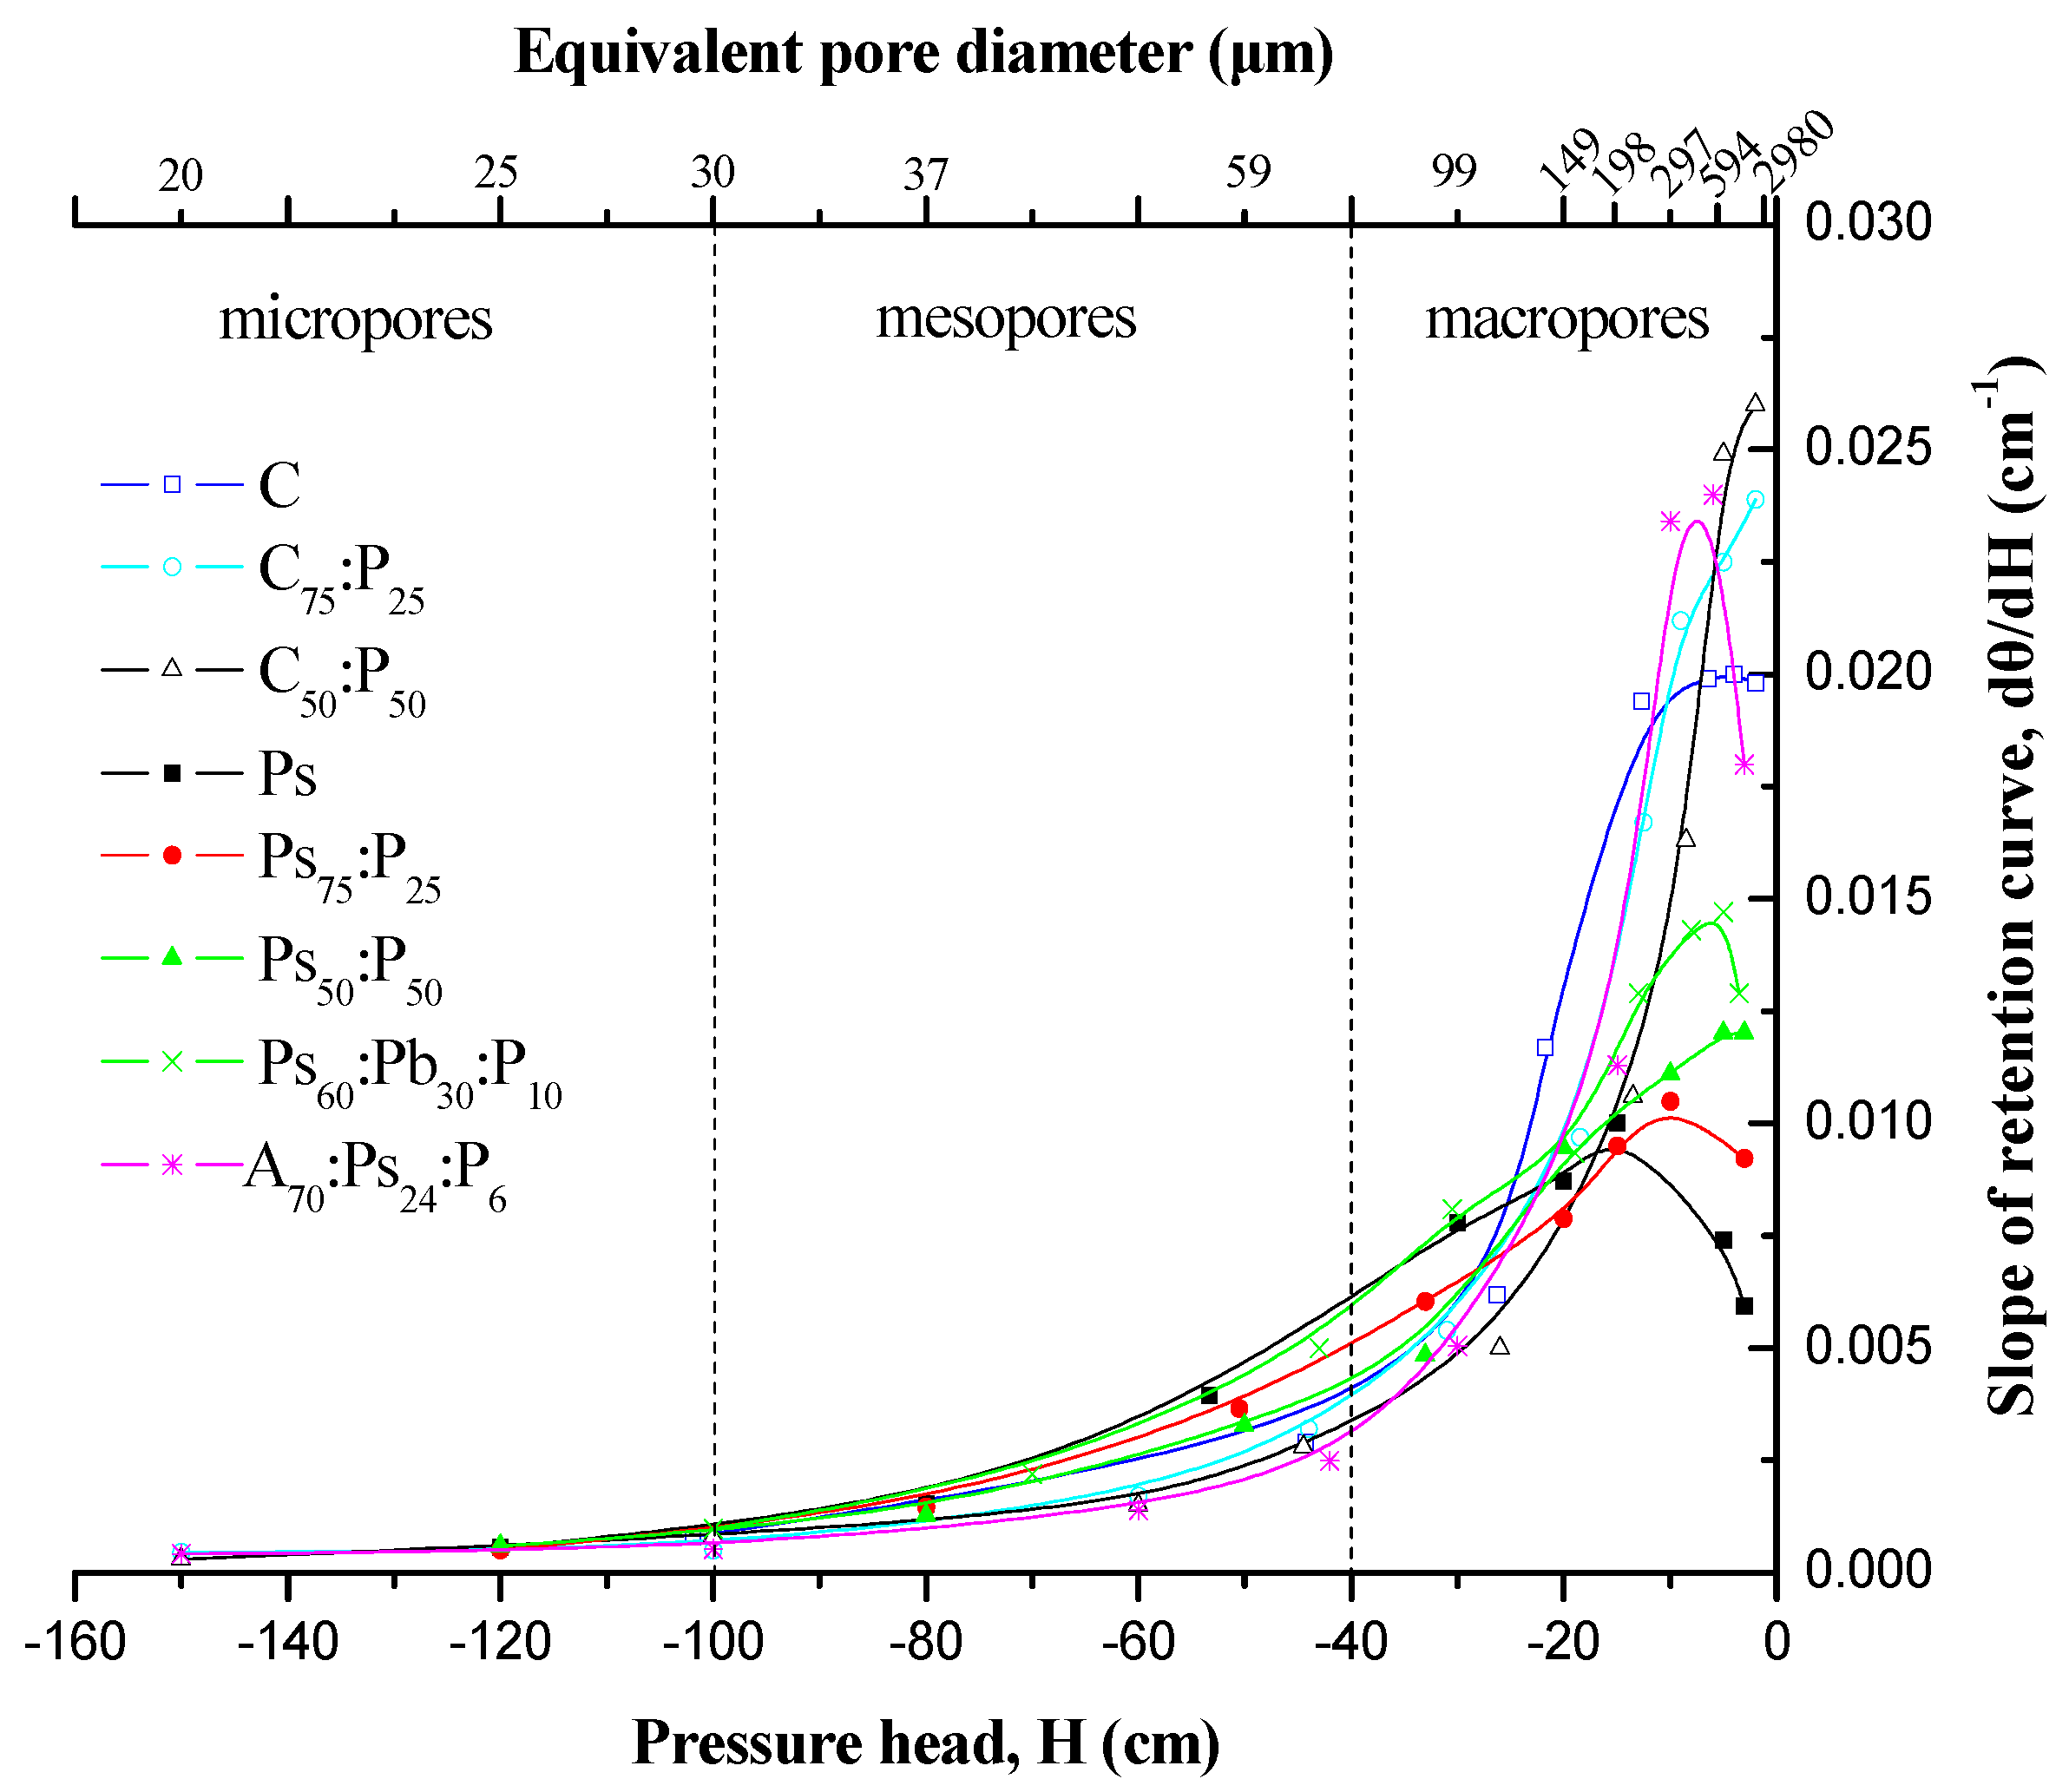
Differentiating the water retention curve (d
θ/d
H at each pressure head
H) of all substrates studied (
Figure 1a–c), the pore size distribution can be revealed [
38,
43] and is presented comparatively in
Figure 2 as a relationship between d
θ/d
H and equivalent pore diameter. As shown, generally, A
70:Ps
24:P
6 and coir–perlite mixtures (C, C
75:P
25, C
50:P
50) have larger macropores (equivalent pore diameter >75 μm), followed by Ps
60:Pb
30:P
10 and then peat–perlite mixtures. With regard to the peat–perlite mixtures (Ps, Ps
75:P
25, Ps
50:P
50), the addition of perlite increased the size of large pores, especially those associated with the water tension of −5 cm. Pore size increased as the percentage of perlite in the mixture increased. The same was observed in the case of coir–perlite mixtures. On the other hand, Ps
60:Pb
30:P
10 and peat–perlite mixtures have larger mesopores (equivalent pore diameter 30–75 μm) than A
70:Ps
24:P
6 and coir–perlite mixtures. Finally, all substrates analyzed have the same micropores (equivalent pore diameter 5–30 μm).
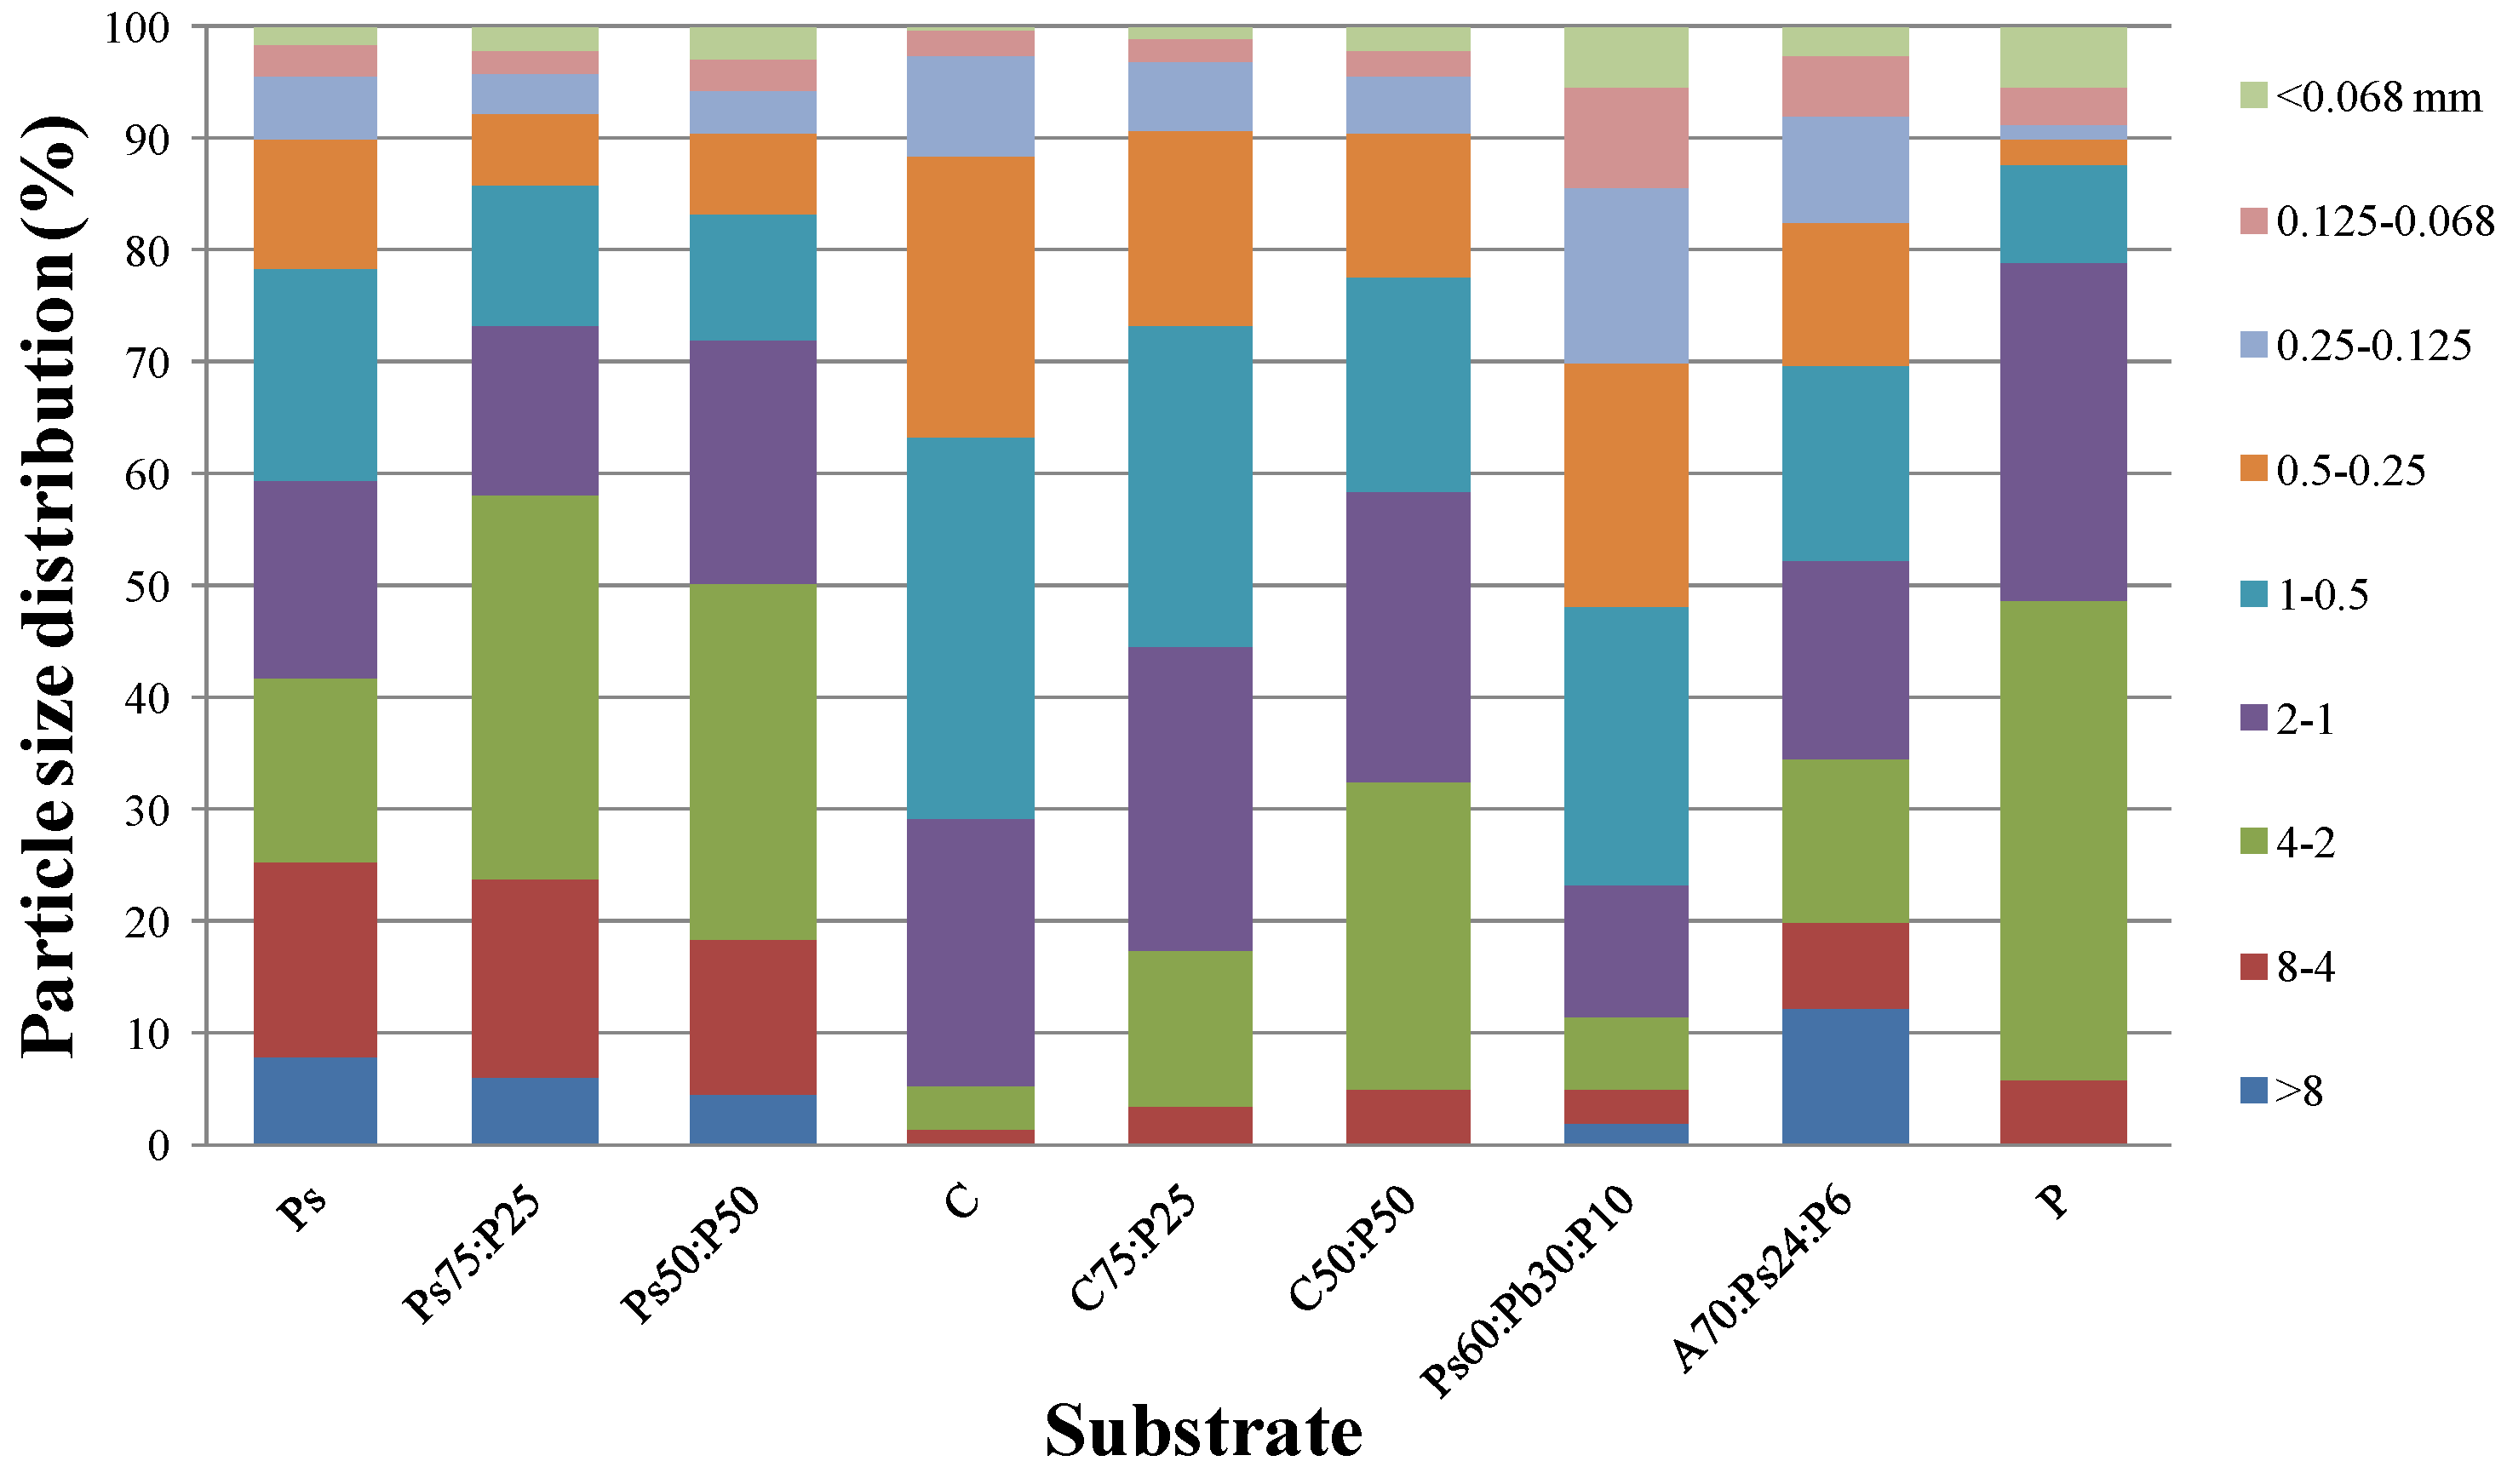
With regard to particle size distribution (
Figure 3), in the case of the peat–perlite mixtures (Ps, Ps
75:P
25, Ps
50:P
50), the addition of perlite decreased the percentage of particle sizes greater than 4 mm and less than 1 mm and increased the percentage of particle sizes between 4 and 1 mm. The same was observed in the case of the coir–perlite mixtures, with the exception of particles greater than 4 mm, where the percentage of these particles increased slightly with the addition of perlite in pure coir. Comparison between peat–perlite and coir–perlite mixtures showed that the latter was characterized by a lower percentage of particle sizes greater than 4 mm and a higher percentage of particle sizes less than 1 mm. In the case of prefortified substrates, Ps
60:Pb
30:P
10 was characterized by a lower percentage of particle sizes greater than 1 mm and a higher percentage of particle sizes less than 1 mm compared to A
70:Ps
24:P
6. It is worth noting that Ps
60:Pb
30:P
10 was characterized by the highest percentage of particle sizes less than 1 mm (≈77%) compared to all the other substrates studied. The abovementioned variation of the substrate particle sizes led to differences in various physical properties of the substrates. Large differences in particle size can result in the migration of fine particles into the spaces between larger fragments, resulting in reduced air-filled porosity, increased volumetric water content at specified pressures, and increased bulk density [
28].
To evaluate the results received from the water retention curves and both the pore size and particle size distributions,
Table 4 was created. In
Table 4, the terms introduced by De Boodt and Verdonck [
24] are used to characterize the water retention capacity and aeration of substrates in a range of water tensions between 0 (saturation) and −15,000 cm (permanent wilting point). Furthermore, in the same table, the bulk density values of all the substrates studied are shown. In accordance to
Table 4, the total porosity, easily available water, water buffering capacity, difficult available water, and nonavailable water were decreased in peat–perlite and coir–perlite mixtures compared to pure peat and coir, respectively. These differences were significant mainly in the case of 50% perlite percentage. On the other hand, as anticipated, substrate air space increased along with increasing the percentage of perlite in mixtures. In the case of the commercial substrates, Ps
60:Pb
30:P
10 had significantly greater values of total porosity, easily available water, water buffering capacity, and difficult available water, and a lower value of air space than A
70:Ps
24:P
6.
In
Table 4, the corresponding values of “ideal substrates” as identified by De Boodt and Verdonck [
24], and which have been implemented and used commercially at a large scale [
31,
32,
33], are indicated. According to the concept of “ideal substrates”, water retention curves below this zone have rapid water release and low water holding capacity, while those above it have less air space and greater water holding capacity. The only substrate to meet this zone for the full range of water tension is A
70:Ps
24:
P6, as represented in
Figure 4, followed by the substrates C
75:P
25 and Ps
50:P
50. The rest of the substrates have a remarkable portion of their water retention curve falling either below (e.g., C
50:P
50) or above this zone (e.g., Ps, Ps
75:P
25, C, C
50:P
50, Ps
60:Pb
30:P
10).
In
Table 5, the measured values of water content and hydraulic conductivity at saturation (
H = 0 cm), as well as the predicted ones by the Mualem–van Genuchten model at water pressure heads (
H = −10, −50, −100 cm) within the range of easily available water and water buffering capacity, as introduced by De Boodt and Verdonck, are presented. As shown, a sharp decrease of the unsaturated hydraulic conductivity was observed within this range of water pressure heads (0 to −100 cm). Similar results have also been reported by other researchers (e.g., [
20,
44,
45]). Comparing the unsaturated hydraulic conductivity values of the substrates A
70:Ps
24:
P6, C
75:P
25, and Ps
50:P
50 characterized as “ideal” (
Figure 4), it is apparent that remarkable differences exist among them (
Table 5). During plant growth in this study, the pressure heads varied from −10 to −50 cm between two successive irrigations (range of easily available water). For this range of pressure heads, the hydraulic conductivity of A
70:Ps
24:P
6 is decreased by approximately three orders of magnitude, whereas in the rest of the substrates, it is decreased by approximately two orders of magnitude. Specifically,
K values ranged from 5.5 × 10
−1 to 2.4 × 10
−4 cm·min
−1, with the smallest ones observed for the substrates C
50:P
50 and A
70:Ps
24:P
6 (
Table 5).
Τhe knowledge of both
K(Η) and
θ(H), is of vital importance mainly in greenhouse cultures and would contribute to alleviating water stress conditions and improving the quality of substrates. Nevertheless, we should bear in mind that in some cases, the predicted
K(Η) values using the water retention curve data and the saturated hydraulic conductivity may deviate significantly from the actual
K(Η) values [
46,
47,
48,
49,
50].
In general, during plant growth, the O2 concentration of the substrates studied was greater than 20.6%. However, there were no significant differences among the substrates nor along the depth of the substrates (data not shown).
3.2. Plant Growth
Plants grown in Ps
60:Pb
30:P
10 had significantly greater both shoot dry weight and percent growth increase than the plants grown in all the other substrates, with the exception of A
70:Ps
24:P
6 in the case of percent growth increase (
Table 6). Plants grown in pure coir (C) had the lowest percent growth increase. With regard to plant growth in peat-based (Ps, Ps
50:P
50, Ps
75:P
25) and coir-based (C, C
50:P
50, C
75:P
25) substrates, no significant differences were noted amongst them.
The analysis of both macro- and micronutrients of plant tissues are shown in
Table 7. The comparison between peat and its mixtures with perlite (Ps, Ps
50:P
50, Ps
75:P
25) as well as coir and its mixtures with perlite (C, C
50:P
50, C
75:P
25) showed that there are no significant differences in the macro- and micronutrients measured, except in the case of K and Na for plants grown in coir-based substrates, due to the higher initial content of K and Na in coir [
4]. Plants grown in Ps
60:Pb
30:P
10 and A
70:Ps
24:P
6 had similar mineral concentrations with the abovementioned substrates for all nutrients, except for K and Mn, which were higher in plants grown in A
70:Ps
24:P
6. Note that in all treatments, the same amount of fertilizer was added to the irrigation water during the experiment, and no apparent mineral nutrient deficiency or toxicity symptoms were observed on the plants grown in all the substrates. As presented in
Table 2, the two commercial prefortified substrates (Ps
60:Pb
30:P
10 and A
70:Ps
24:P
6) had a significantly higher concentration of N, especially, than the other substrates used, giving an advantage at the early state of the cultivation. However, this was not realized at the plant tissue analysis (
Table 7).
According to Reuter and Robinson [
51], the concentrations of the micronutrients Zn, Mn, and Cu are within adequate amounts. Analyses of Nelson et al. [
52], which were performed on younger leaves at 5 cm width or greater size of a different
Begonia variety to that of the current research, agree that only the Fe concentrations measured are low and the Mg concentrations are within adequate amounts for all the substrates studied. Moreover, the concentrations of N were low for all the substrates used and agree with the results given by Nelson et al. [
52], obtained at the end of the cultivation.
Amongst all the substrates studied, the observed differences in nutritional status were not so significant as to solely justify the differentiation in plant growth. Additionally, although the higher values of almost all nutrient concentrations were exhibited in plants grown in the A70:Ps24:P6 substrate, which was also classed as a hydraulically ideal substrate, the percent growth increase had not significantly increased in relation to Ps60:Pb30:P10 and the peat and coir mixtures. Instead, plants grown in Ps60:Pb30:P10 that had similar nutrient concentrations with plants grown in A70:Ps24:P6 and was classed as hydraulically nonideal, presented significant differences in both the shoot dry weight and percent growth increase with all the other substrates studied.
Therefore, it is apparent that the physical properties of the “ideal substrates” alone (
Table 4) cannot constitute the only criteria for selecting growing substrates, as there are notable substrates, such as those assessed in this paper, that did not fall within the range of the physical properties for ideal substrates. It is worth noticing that the higher plant growth was achieved in the Ps
60:Pb
30:P
10 substrate, although it did not fall into the “ideal substrates” zone. Taking into account the hydraulic parameters of the substrates studied, the reduction of hydraulic conductivity values between two successive irrigations (at pressure heads from −10 to −50 cm) did not appear to be a limiting factor in plant growth for any substrate, “ideal” or not. In particular,
K values ranged between 5.5 × 10
−1 and 2.4 × 10
−4 cm·min
−1 (
Table 5), or in other words, between 7920 and 3.46 mm·d
−1, and daily evapotranspiration values did not exceed 1.8 mm·d
−1, as has been determined in our previous study [
14]. In any case, the knowledge of
K(H) is essential for the substrate evaluation and proper irrigation management. So, the “nonideal” substrate Ps
60:Pb
30:P
10 resulted in the higher plant growth because it had an adequate water flow rate (due to proper irrigation management). Additionally, Ps
60:Pb
30:P
10 had both a growth advantage, because it was charged with a higher N concentration at the first stage of cultivation, and a high oxygen diffusion rate, as has been determined in our previous study [
14].
As other researchers (e.g., [
53,
54,
55,
56]) have concluded with similar results (i.e., plants grown in substrates which did not fall in the “ideal substrates” zone showed satisfactory growth), it should be noted that these physical parameters are static and should be used only as references, because the only criterion for defining them is negative water pressure head. The important role of the dynamic hydraulic properties of the substrates such as gas diffusivity, saturated and unsaturated hydraulic conductivity, their chemical composition, and the growth particularities of different plants have not been considered.
Overall, it can be stated that because the parameters of the substrates are static, they represent steady-state conditions. However, during plant growth in pots or in the field, a dynamic state is formed that constantly changes over time and space. Therefore, the method, timing, and amount of irrigation water beyond the values of the physical properties of the “ideal substrates” (
Table 2) play a significant role in defining a substrate as “ideal” or not.


