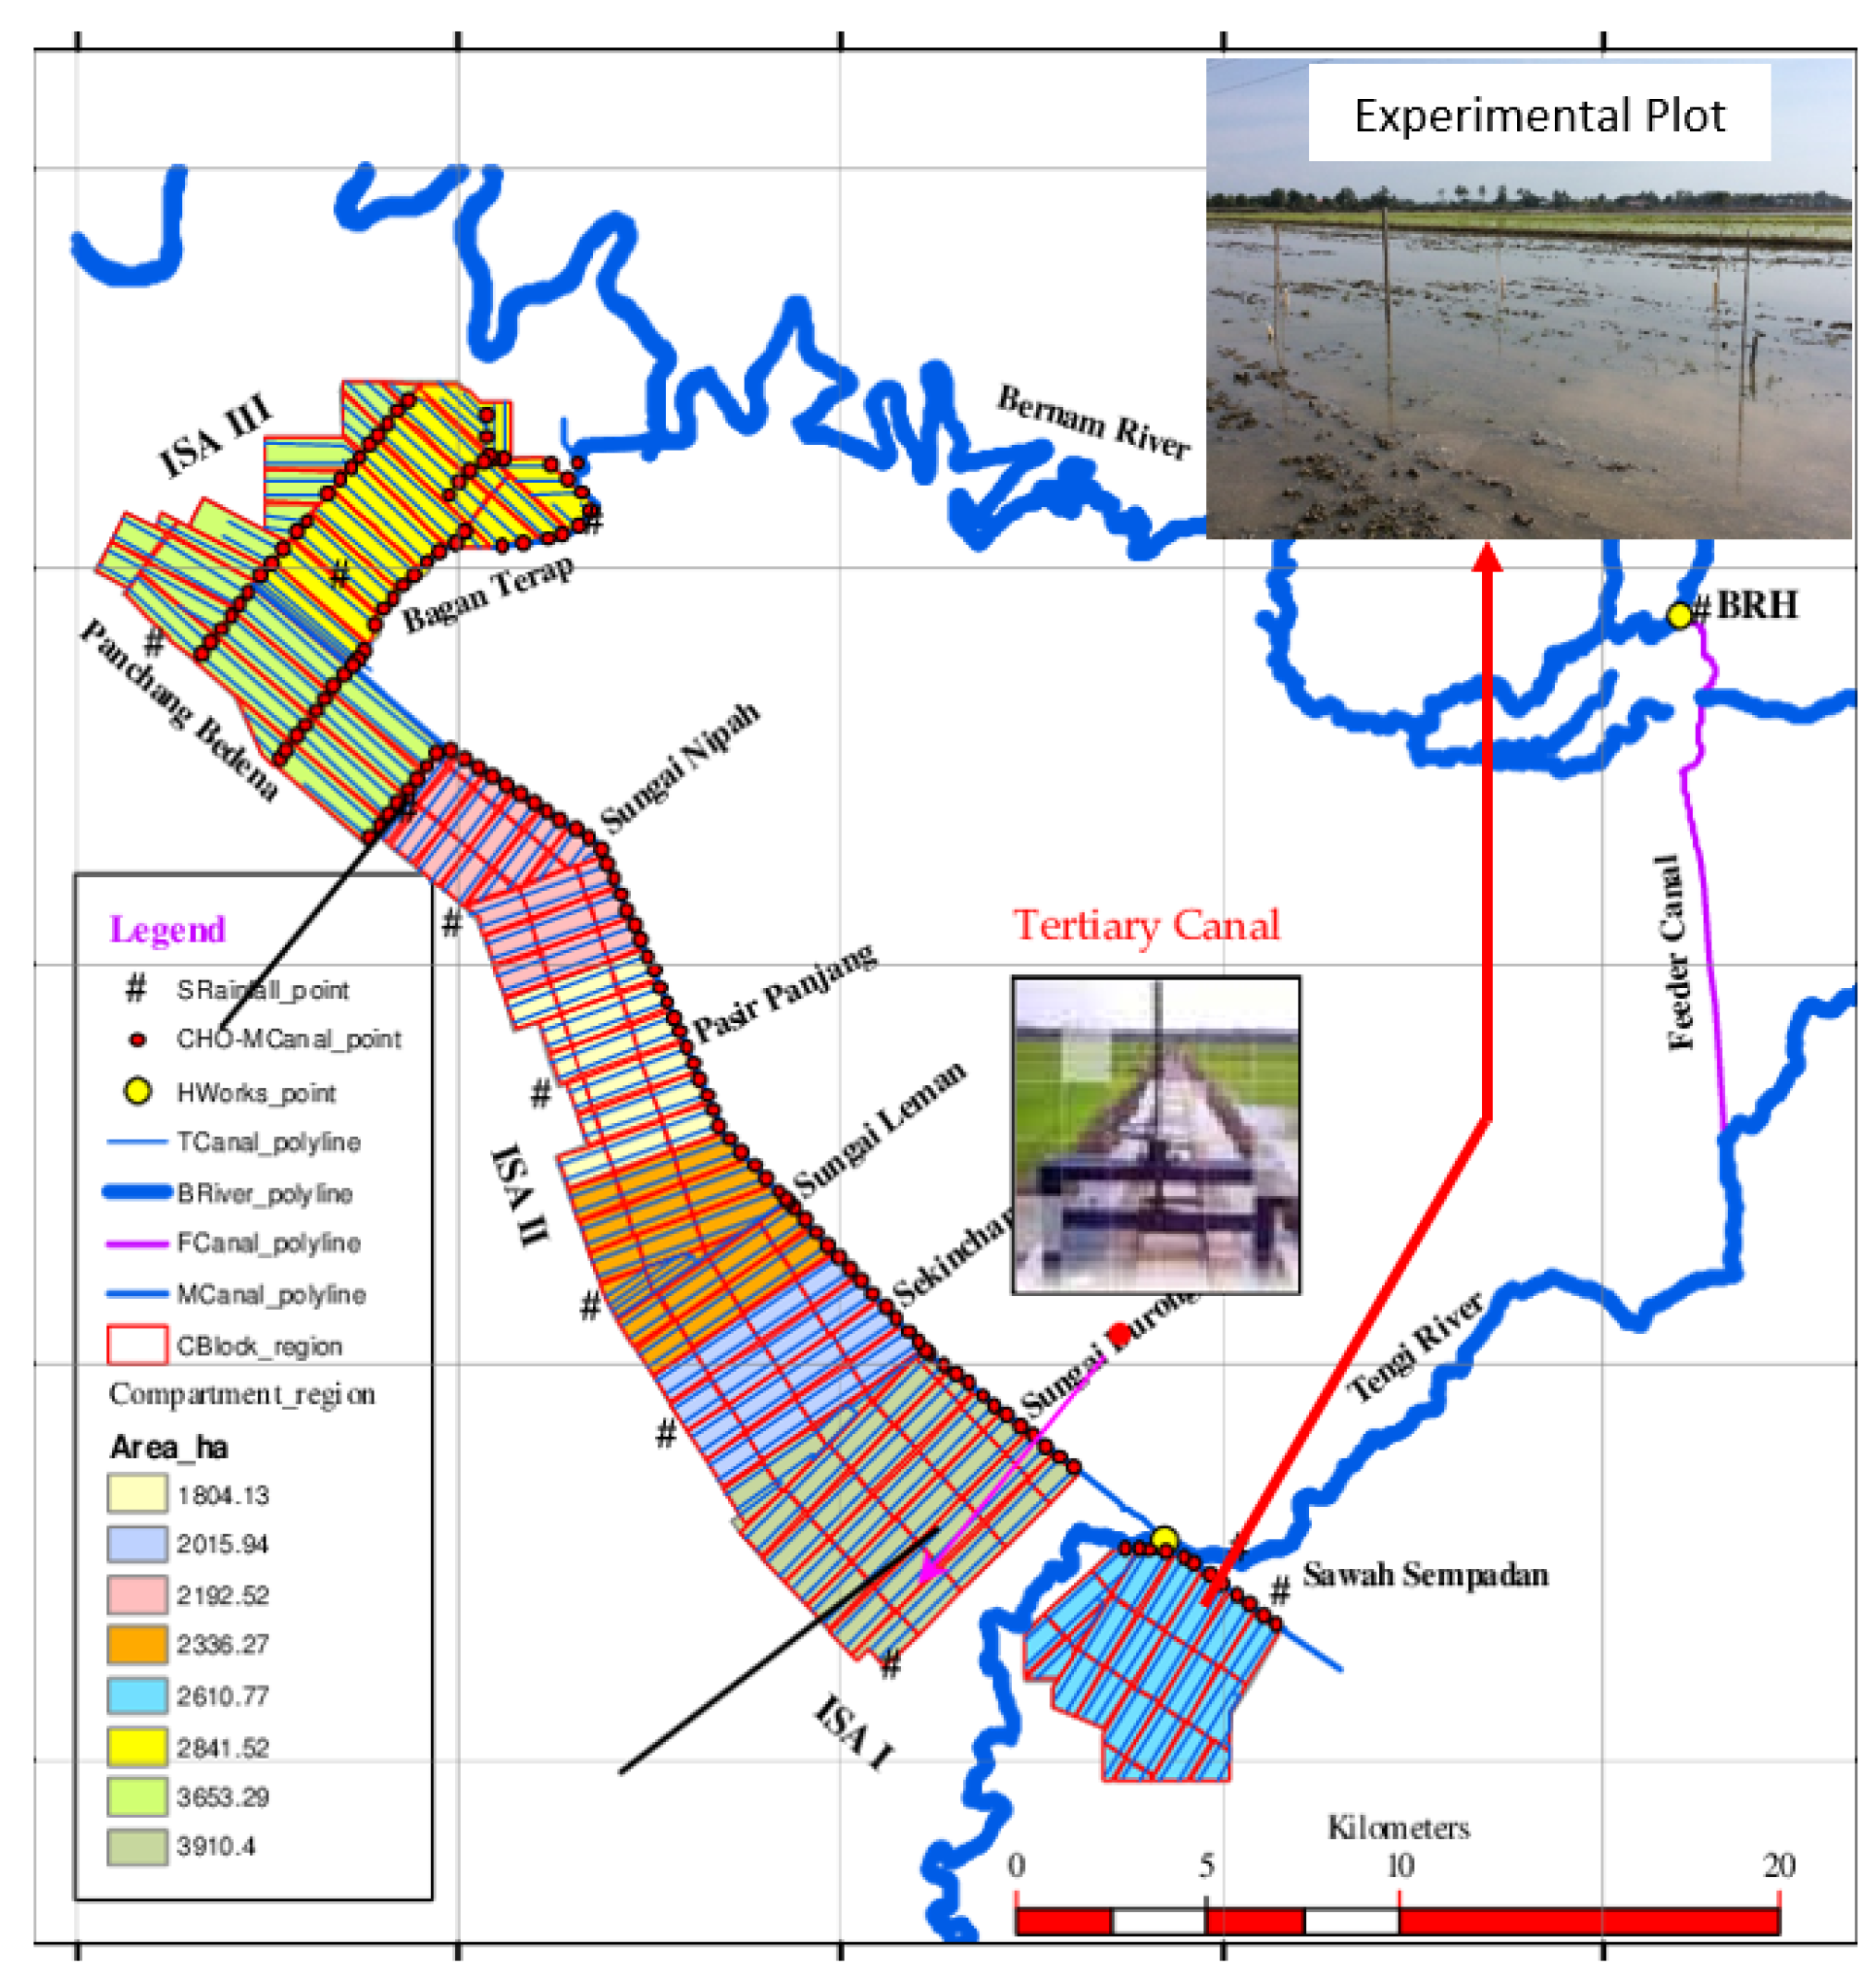
The study region relates to the Tanjung Karang rice irrigation scheme, which is located at 3°25′ ~3°45′ N latitude and 100°58′~101°15′ E longitude in the state of Selangor, Malaysia. It is one of the several irrigation compartments in Sawah Sempadan, consisting of 1468 lots, with the total area of about 2300 hectares divided into 24 blocks. BLOCK C in the Sawah Sempadan compartment had 86 individual farmers and was chosen as a research study area of the present study as shown in
Figure 1. The only source for irrigation supply in Sawah Sempadan is the Berman River. Geographically, the study area is located at 3°28′09.63465″ N 101°13′26.48399″ E, with average altitude of 6.2 m above the mean sea level. The experimental plot has the soil texture of clay loam, while the texture of the soil surface ranges from clay loam to clay. The soil is classified as Jawa series and defined as clayey, mixed isohyperthermic sulfic tropaquept [
26]. The physical and chemical properties of the soil at the site are listed in
Table 1 and
Table 2, respectively.
Experimental Design and Measurements
The study was conducted during two consecutive rice growing seasons (January–April 2017 and July–October 2017) in the Sawah Sempadan irrigation compartment at IADA Selangor. The experimental plot is 0.5 ha (5000 m
2) in size. “BLOCK C” was chosen as the study area. After the land preparation, the seeds were evenly broadcasted by hand on the soil during the off and main seasons, respectively. After seeding, the field was irrigated until presaturation. The harvest dates were on April and October for the off and main seasons, respectively.
Table 3 illustrates agricultural activities during both seasons. The total growing periods during these two seasons were 100 and 105 days, respectively. Soil samples were collected from the experimental plot to estimate the physical and chemical properties of the soil. Textural analyses were performed using a pipet method [
27]. The bulk density was determined using core methods [
28]. Saturated hydraulic conductivity was determined using the constant head method [
29]. Soil organic carbon was estimated using Walkley and Black’s method [
30]. Soil EC was measured by conductivity meter. Total nitrogen and extractable P and K were determined using the CHN-S method.
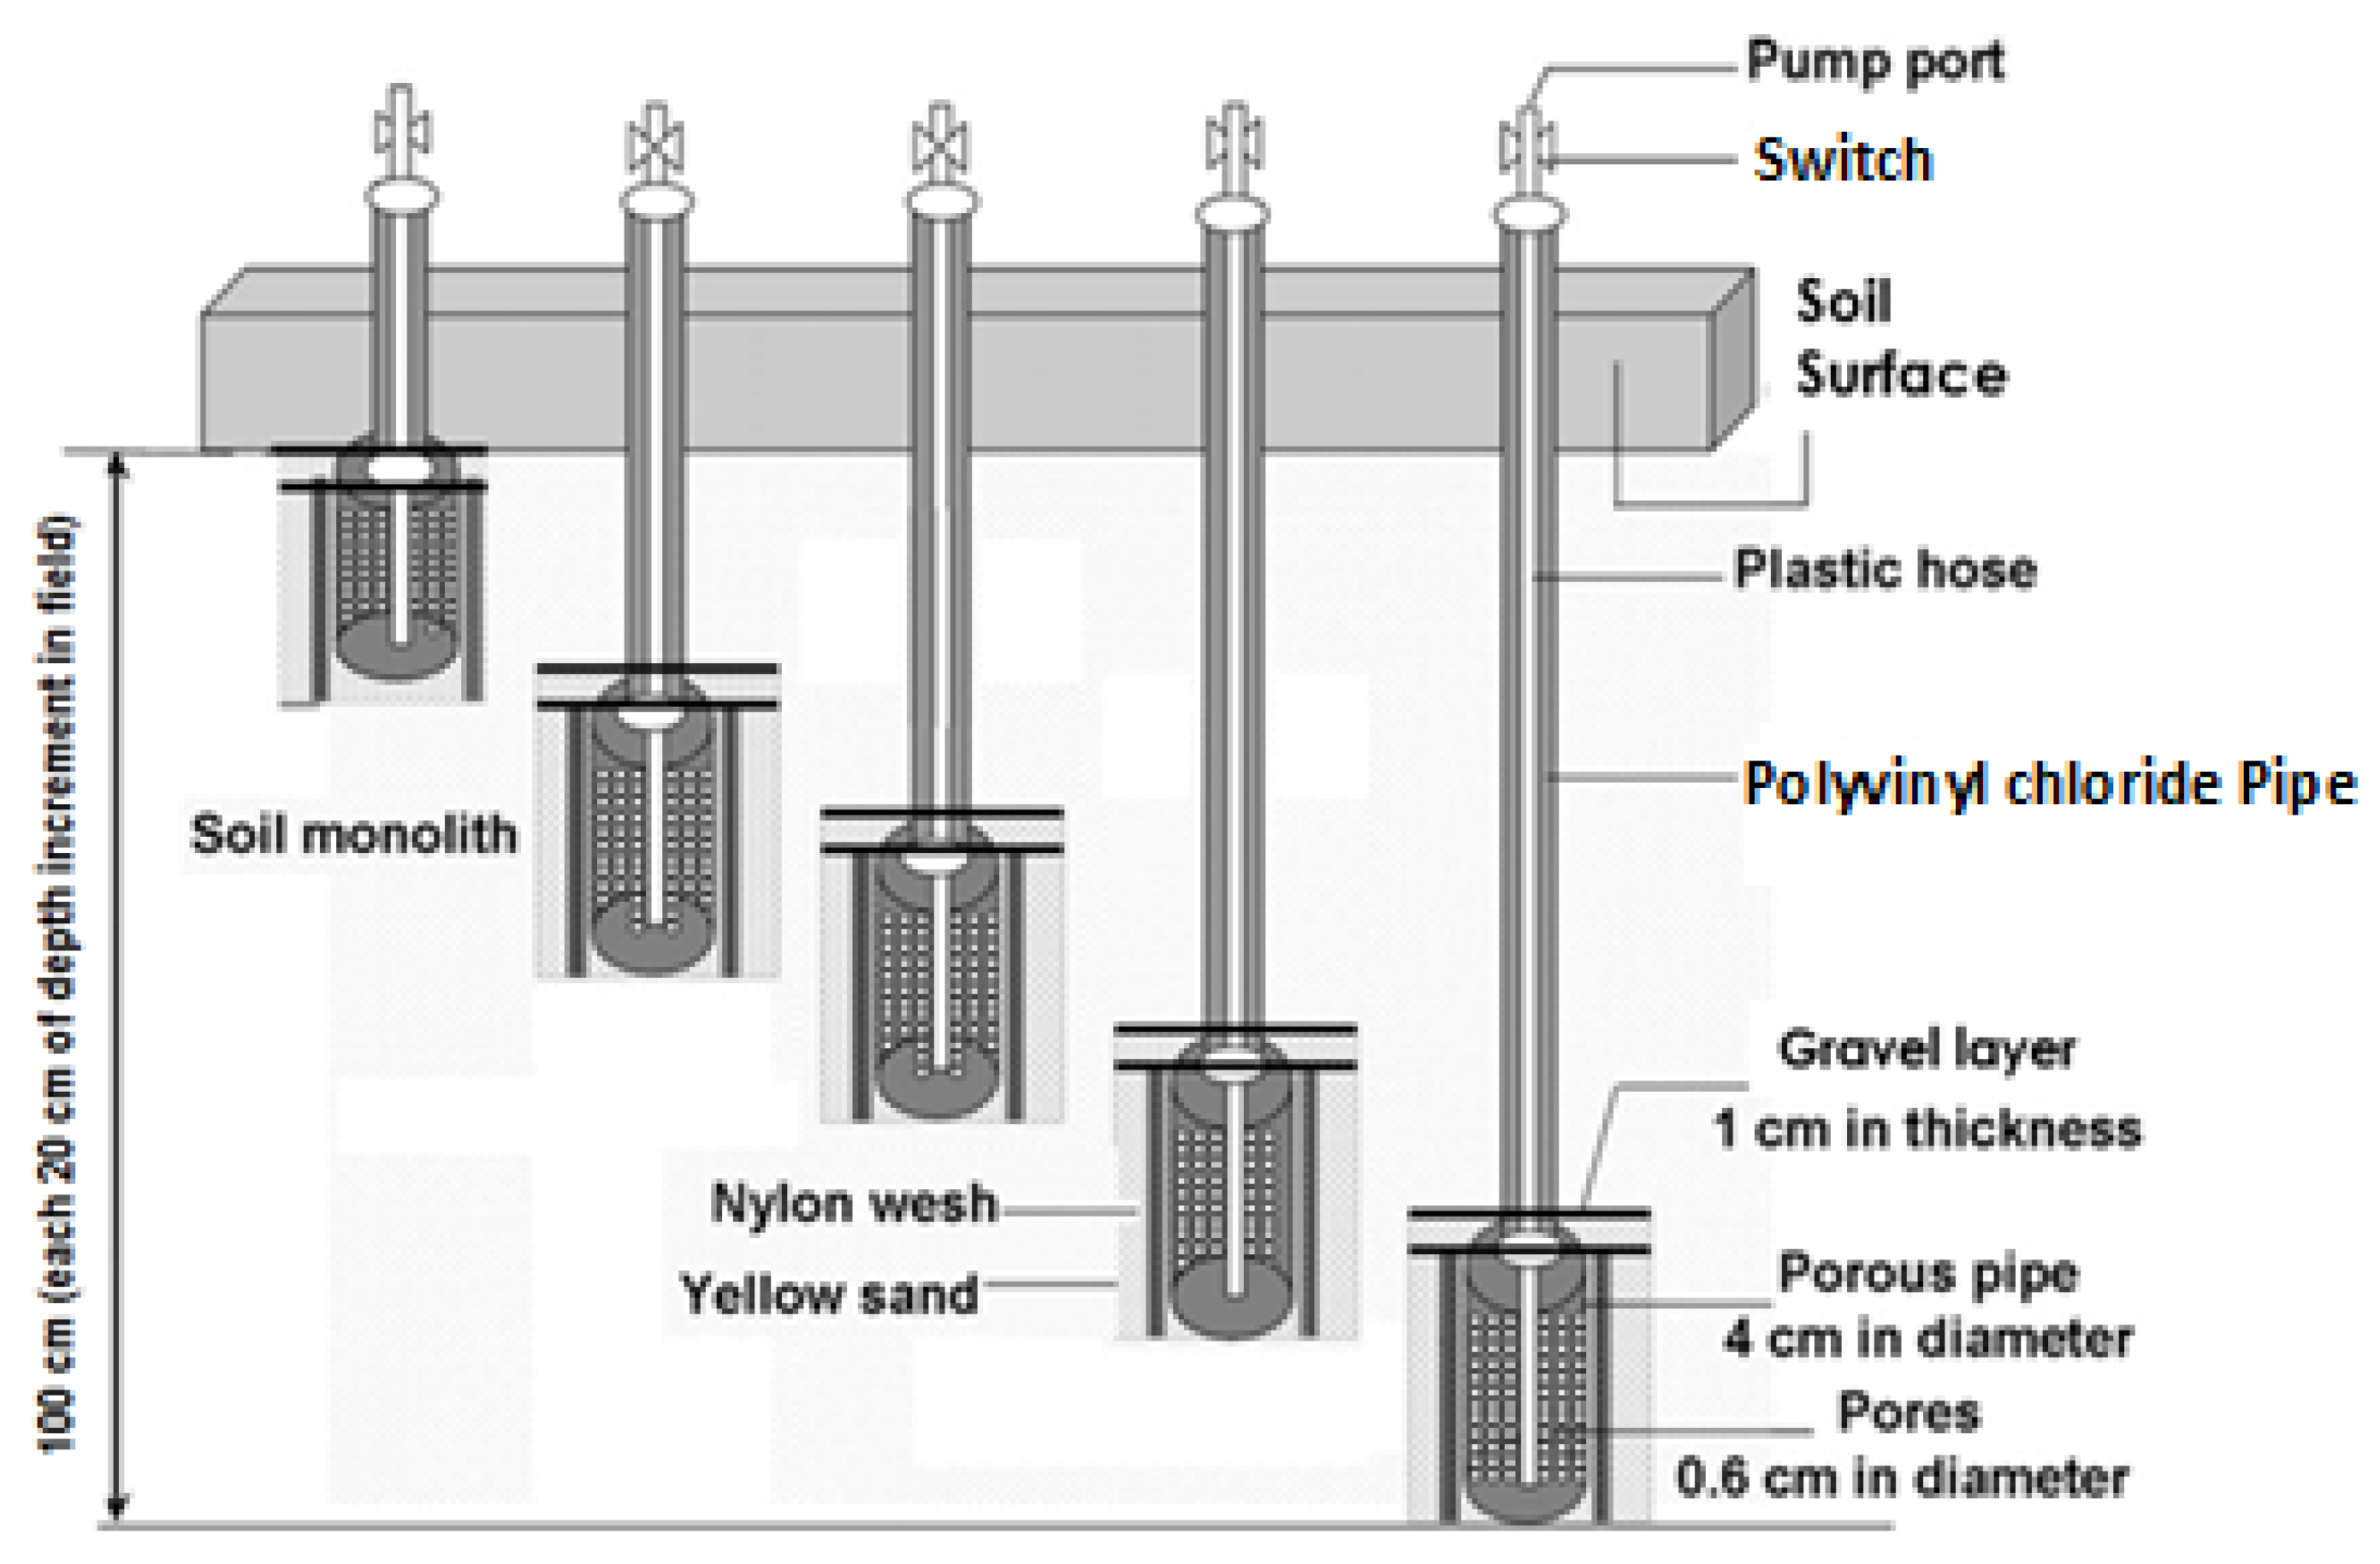
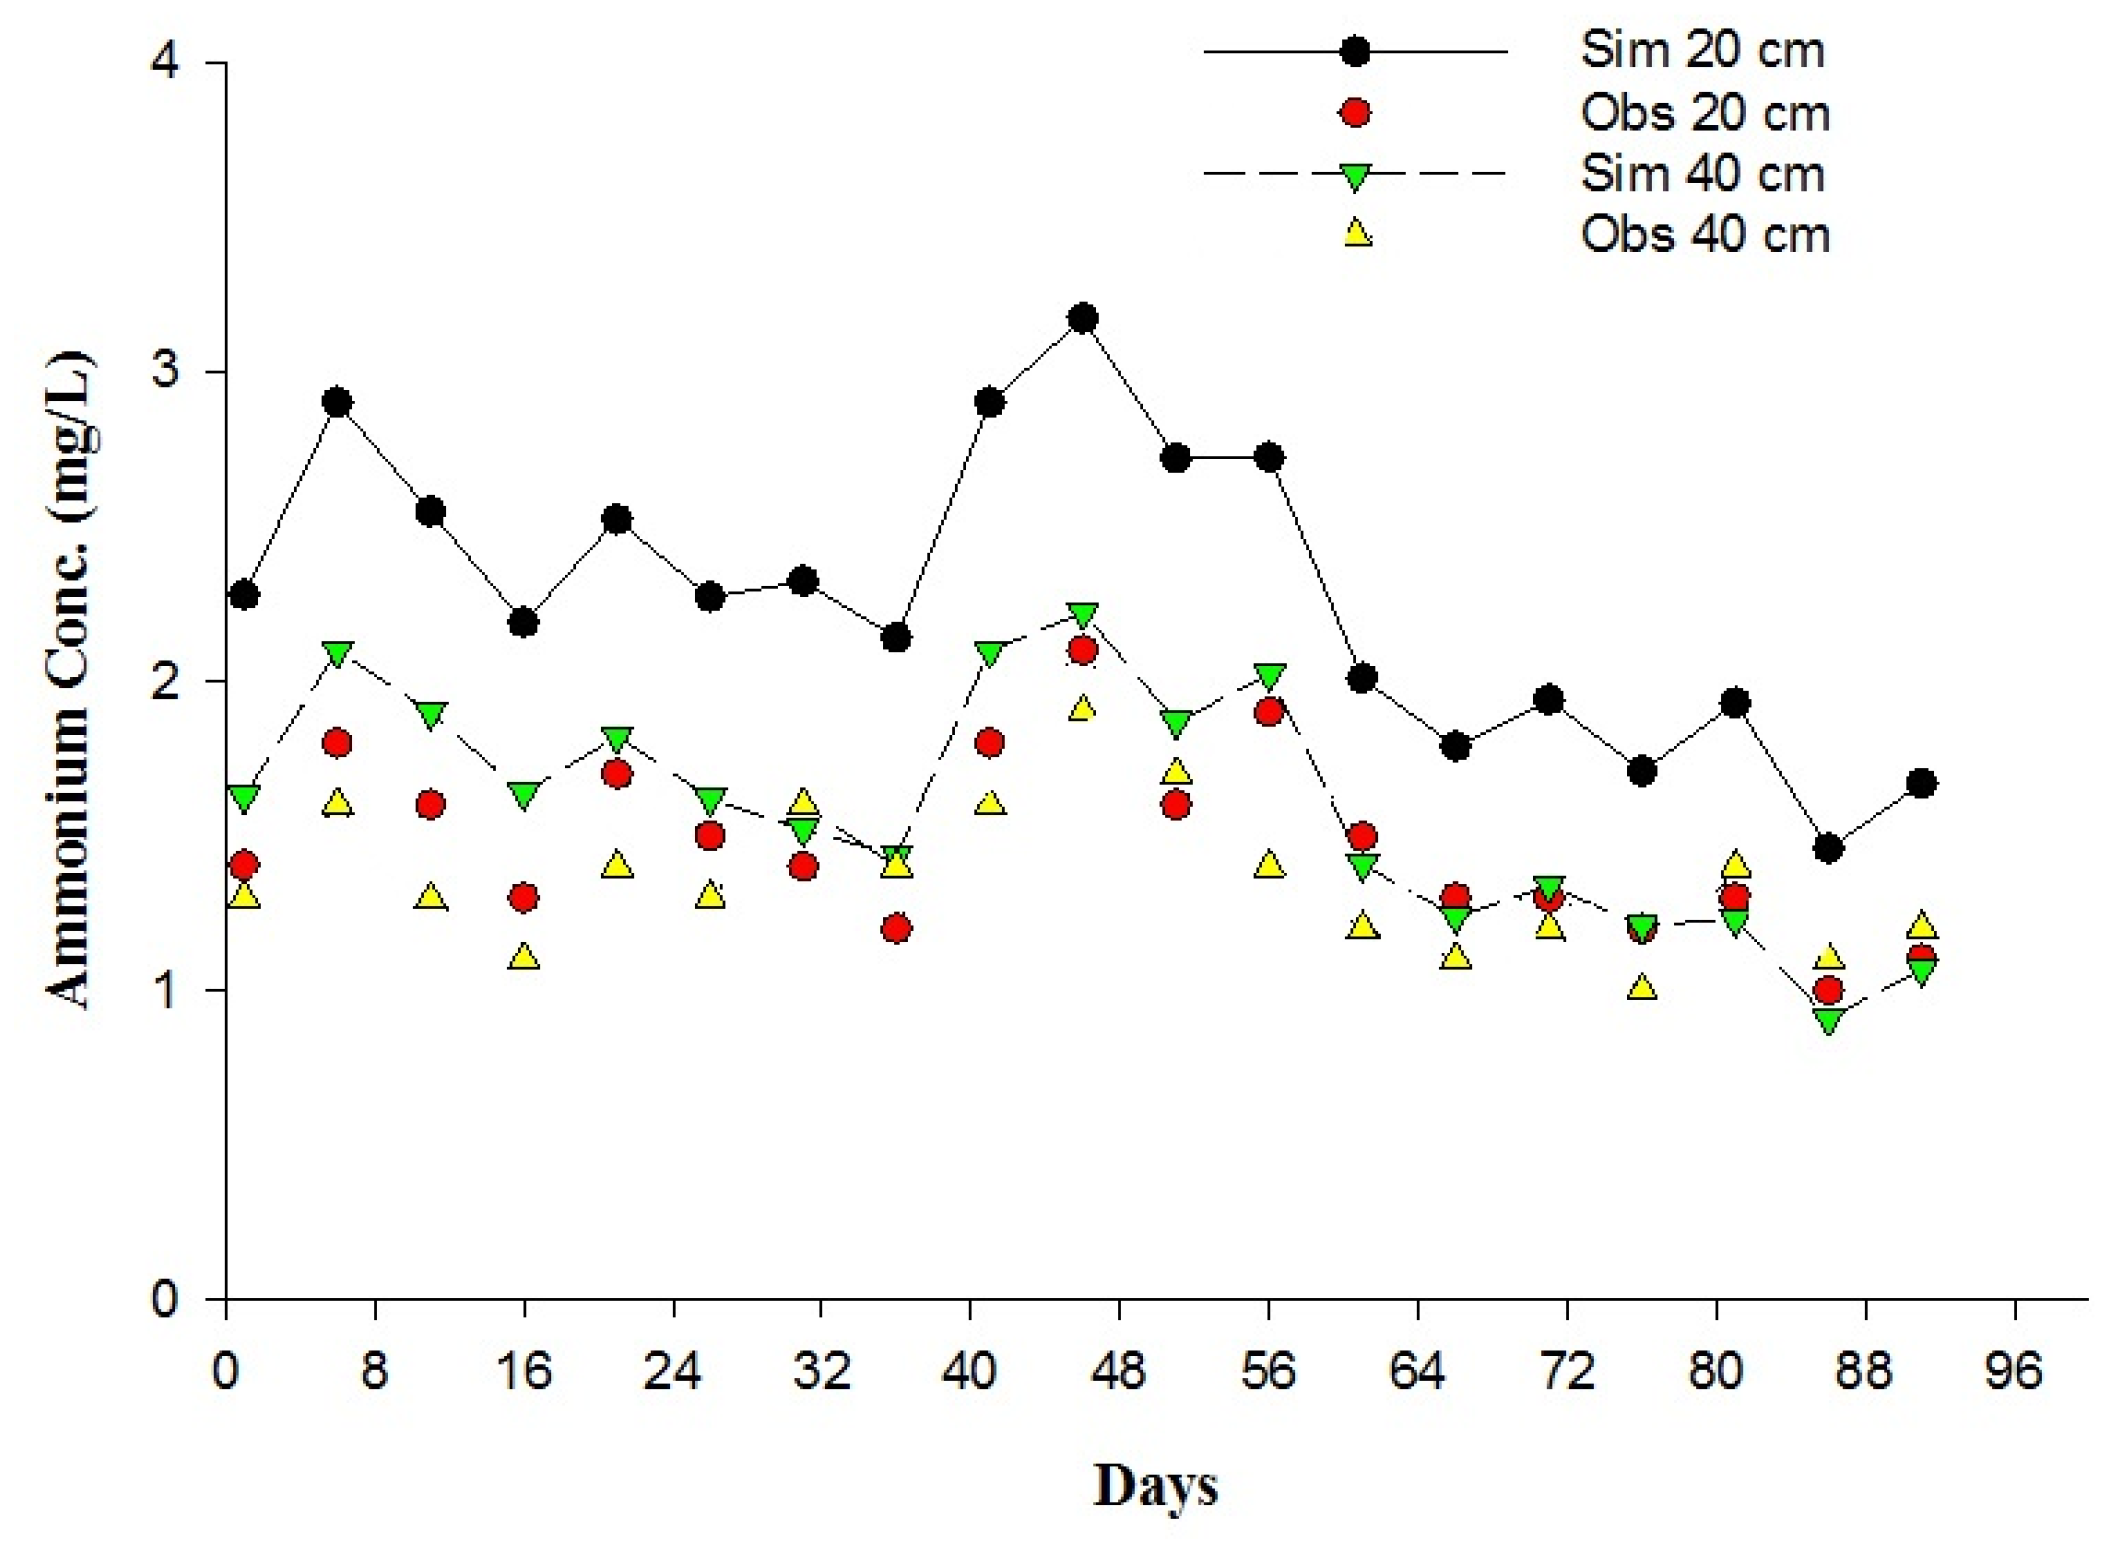
Ceramic porous cups at the depths of 20 cm, 40 cm, 60 cm, 80 cm, and 100 cm were installed at five different places to collect the amount of leachate water (solutes) to the subsurface as shown in
Figure 2. The percolation rate was calculated by the difference between the bottom closed and opened lysimeters (
Figure 3). In Sawah Sempadan, conventional flooding practice is generally adopted in rice paddy fields; therefore, during the entire experimental period, the irrigation and drainage of the experimental plot were monitored. Five porous pipes with leachate collectors were installed to obtain water samples from the subsurface soil in a paddy field. A one-litre plastic bottle was used to collect the samples of subsurface water. Leachate samples were collected on a weekly basis with vacuum hand pump. Additionally, leachate water samples were collected three times within the first 10 days of the fertiliser application. In this period (since the fertiliser application date), the concentration of nutrients varies very significantly. Finally, the samples were transported in a cooler with ice to the water quality laboratory lab, Faculty of Engineering, UPM, for further analysis. The concentrations of nitrate nitrogen (NO
3-N) and ammonia nitrogen (NH
4-N) in these water samples were analysed using a Spectrophotometer DR/890 colorimeter. The amounts of NO
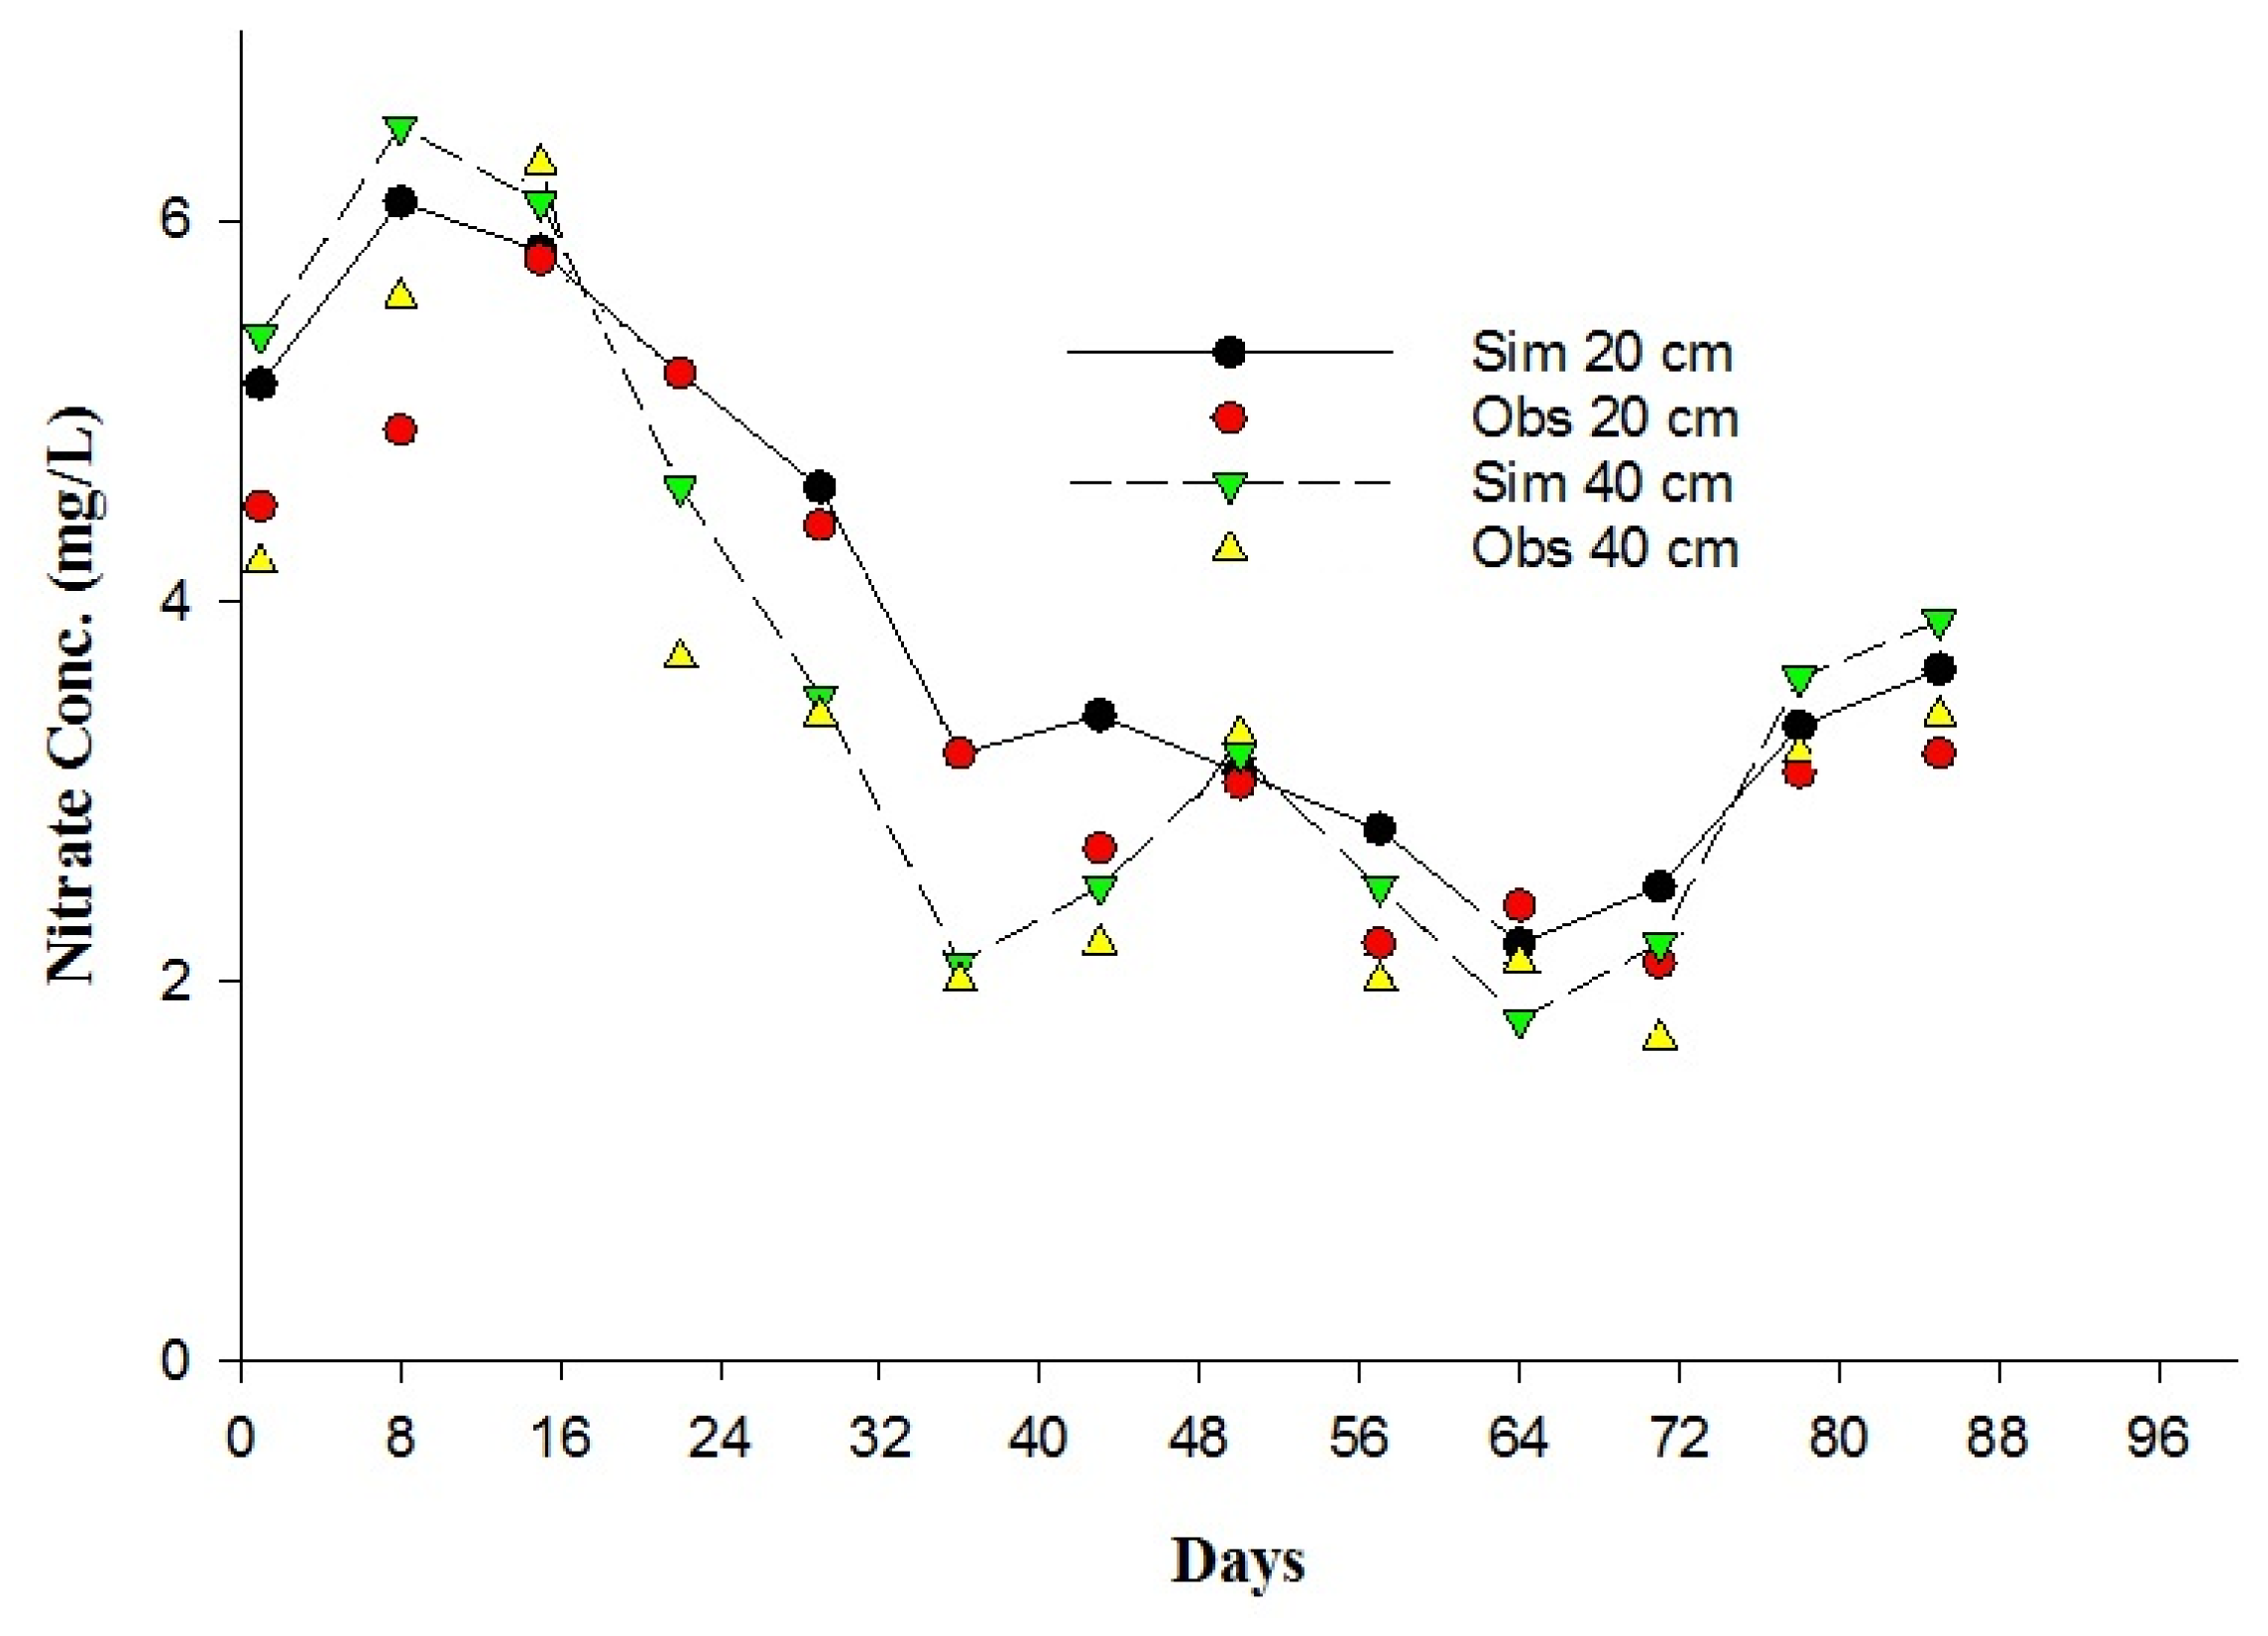
3-N and NH
4-N loss by leaching during the rice growing season were determined by multiplying the total amount of water leachate measured weekly, and the concentration of these nutrients of water was collected in ceramic porous cups at 20 cm, 40 cm, 60 cm, 80 cm, and 100 cm, respectively.
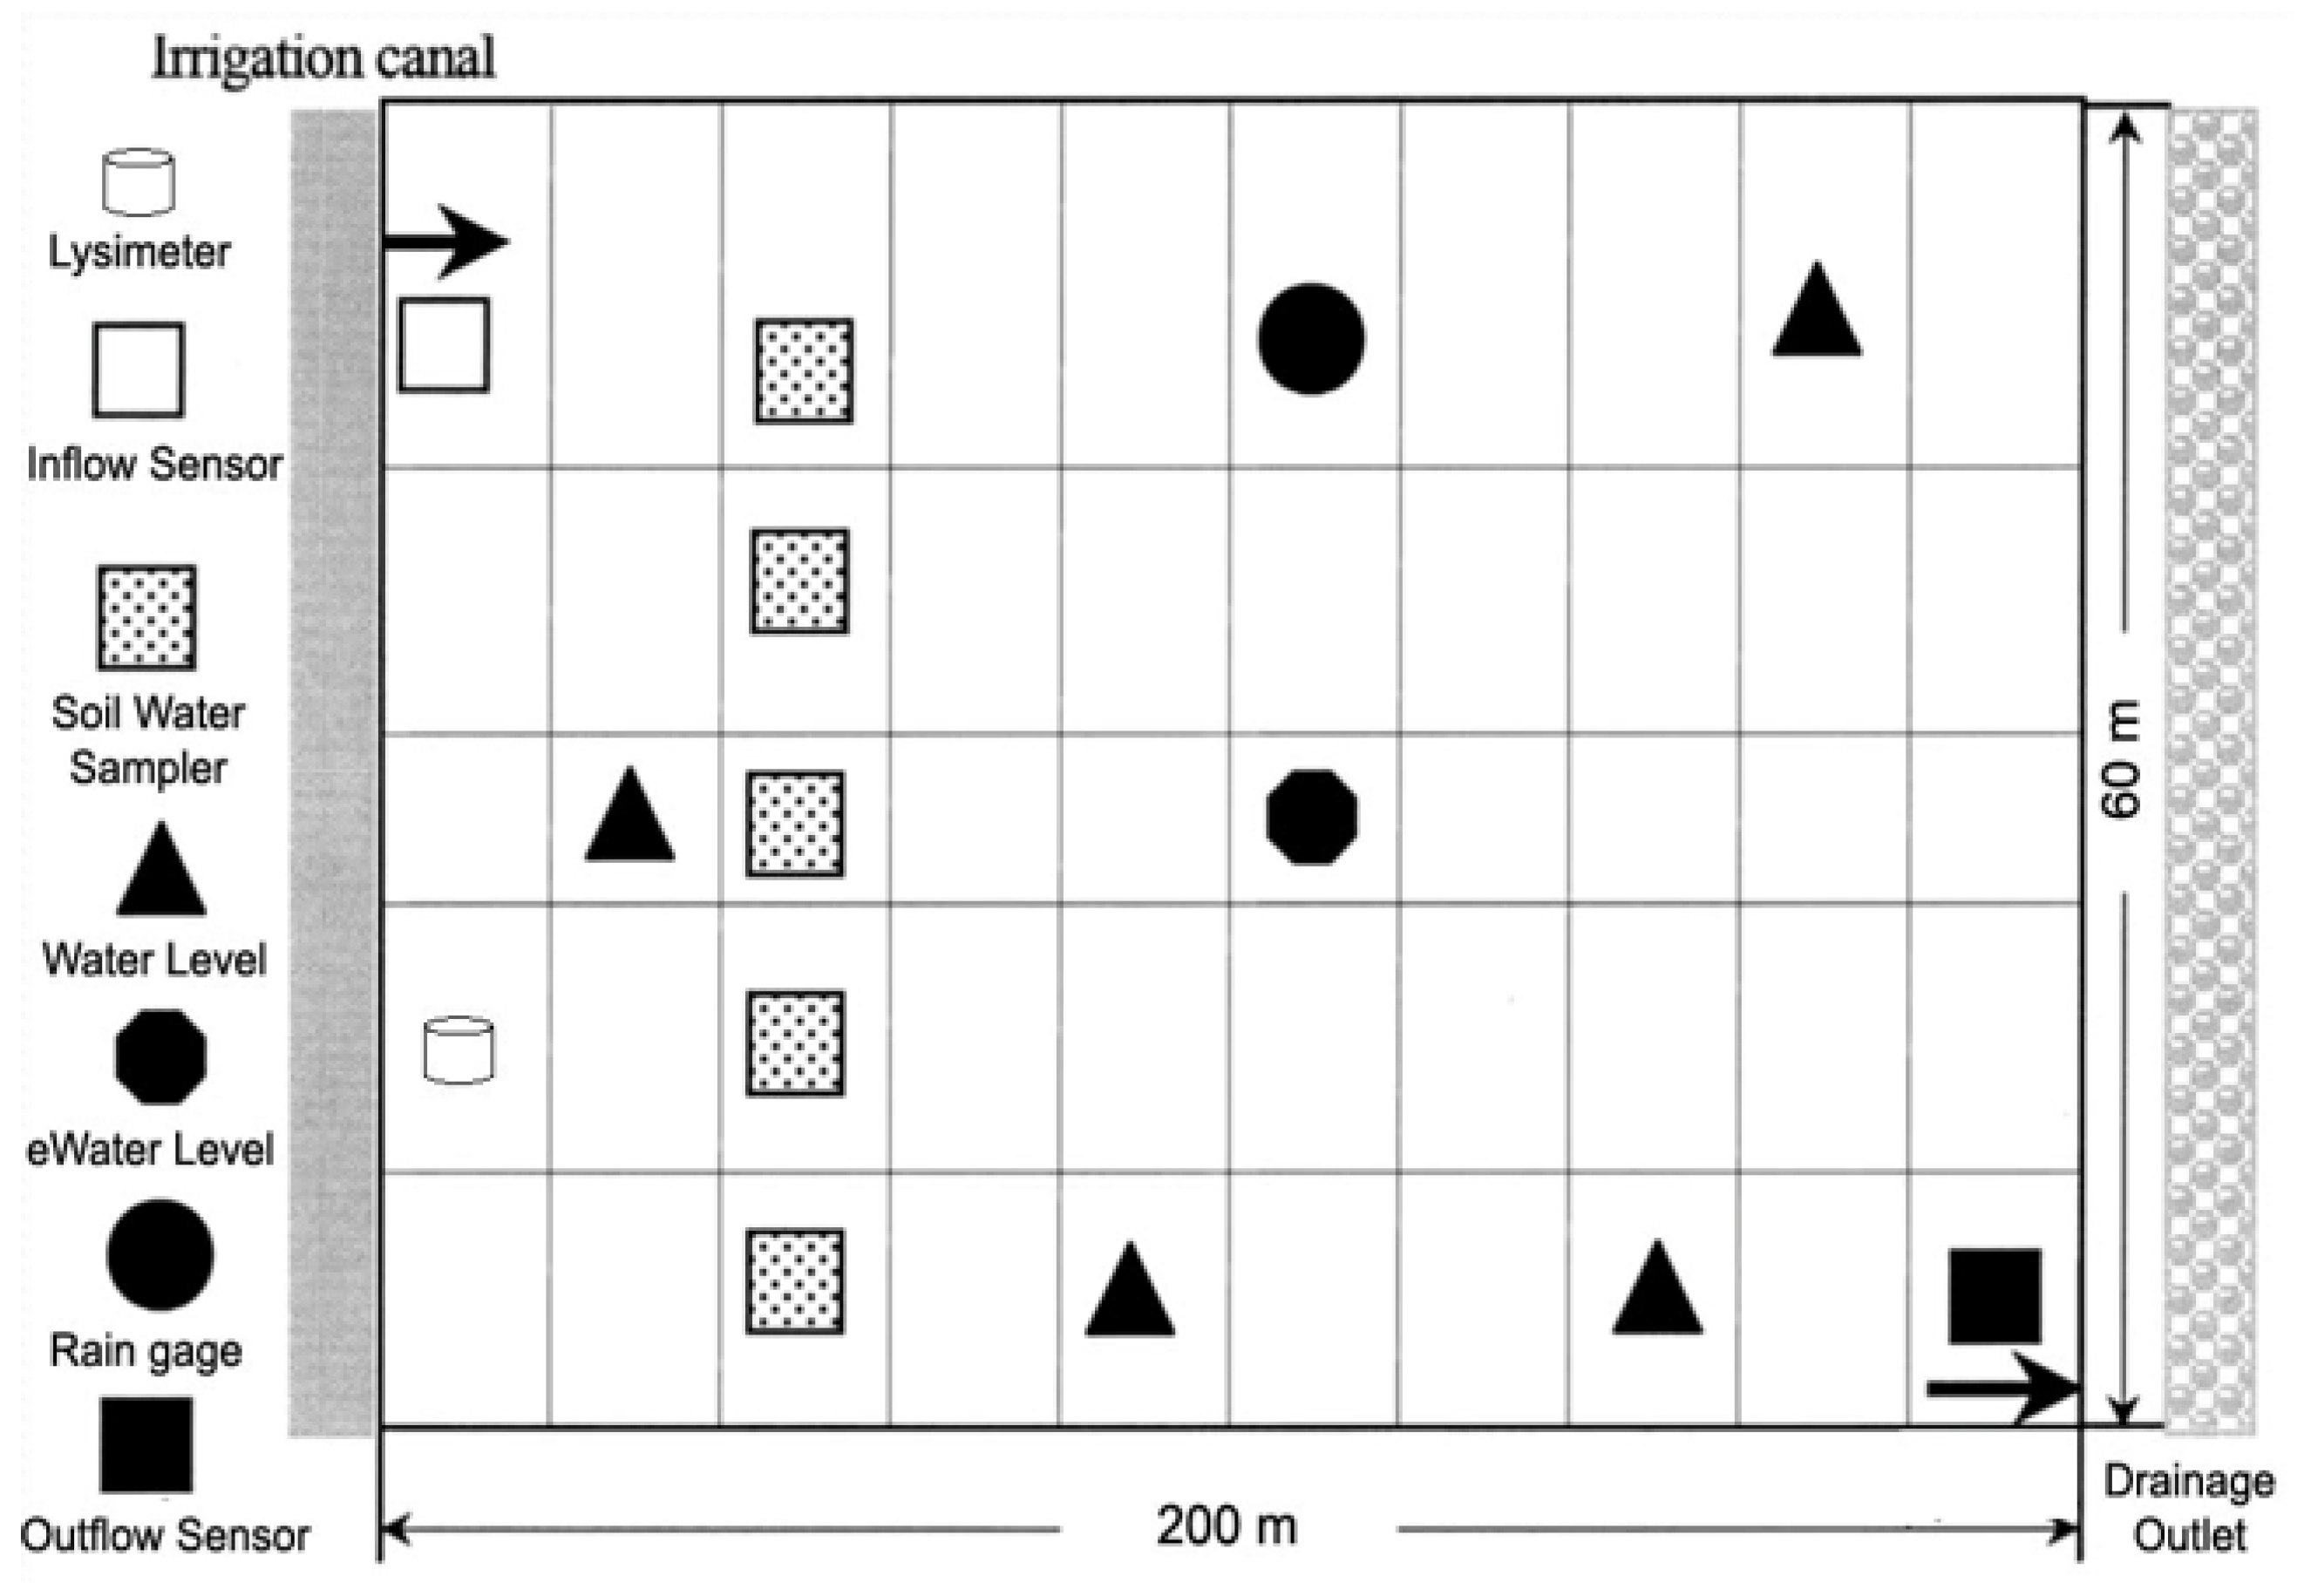
In the experimental field, a Parshall RBC flume, drainage sensor, rain gauge, and water level recorder were installed as shown in
Figure 4. The amount of precipitation was measured using a data-logging rain gauge. During both seasons, the total amount of rainfall was 47 and 21 cm, respectively. The highest rainfall occurred in the month of January during the off season (23 January 2017), which was 8.7 cm day
−1. This area experiences a humid equatorial climate with bimodal rainfall patterns largely influenced by the southwest and northeast monsoons. Rainfall is strongly seasonal, with roughly 70% occurring between the months of October and January during the northeast monsoon, while dry months generally fall in February to March and June to August during the southwest monsoon period. However, rainfall distribution is unreliable from January to August; therefore, the crop has to rely to a large extent on irrigation for sustained yields [
31,
32]. There was very little variation in the day length and temperature in the area. High temperatures are experienced during the dry season, with mean temperature values ranging from 28 °C to 35 °C. Fairly high humidity is experienced, with an average of 77%, which is typical of tropical climates. The amounts of irrigation water and the flow rate were measured using a Parshall RBC flume with an MJK 7070 level sensor with a CR200X logger (SZ-CR200X/7070) whenever an irrigation event occurred. The total amount of irrigation supply was 69.4 and 68.9 cm for both seasons, respectively. During the experimental period, the field water level was maintained from 3 cm to 10 cm depth until one week before harvesting time and every drainage event. The water level was measured using an E-water level sensor. In addition, the irrigation water was reapplied to maintain the crop water requirement when there was no rainfall (dry period) and the water level fell below a maintained depth.
An MJK7060 level sensor (NB-CR200X/7060) was installed at the outlet point to measure the amount of drainage water whenever a runoff event occurs. A concrete sump (70 cm × 50 cm × 70 cm) was constructed inside the outlet point to install the level sensor (NB-CR200X/7060). The drainage data was downloaded on a weekly basis during the study period. The total amount of drainage was 43 and 39 cm for both seasons, respectively. Percolation rate was estimated using four lysimeters. Two open and two closed field lysimeters were installed to estimate deep percolation. In the open condition, the lysimeter gives percolation (P) plus evapotranspiration ET (P + ET), while the closed lysimeter estimates only ET. The percolation rate can be obtained from the subtraction. Finally, the average readings from the four lysimeters (Closed, Opened, and Closed and Opened) were recorded as the daily deep percolation rate. The total amount of percolation water was 19.9 cm for the off season and 17.3 cm for the main season, respectively.
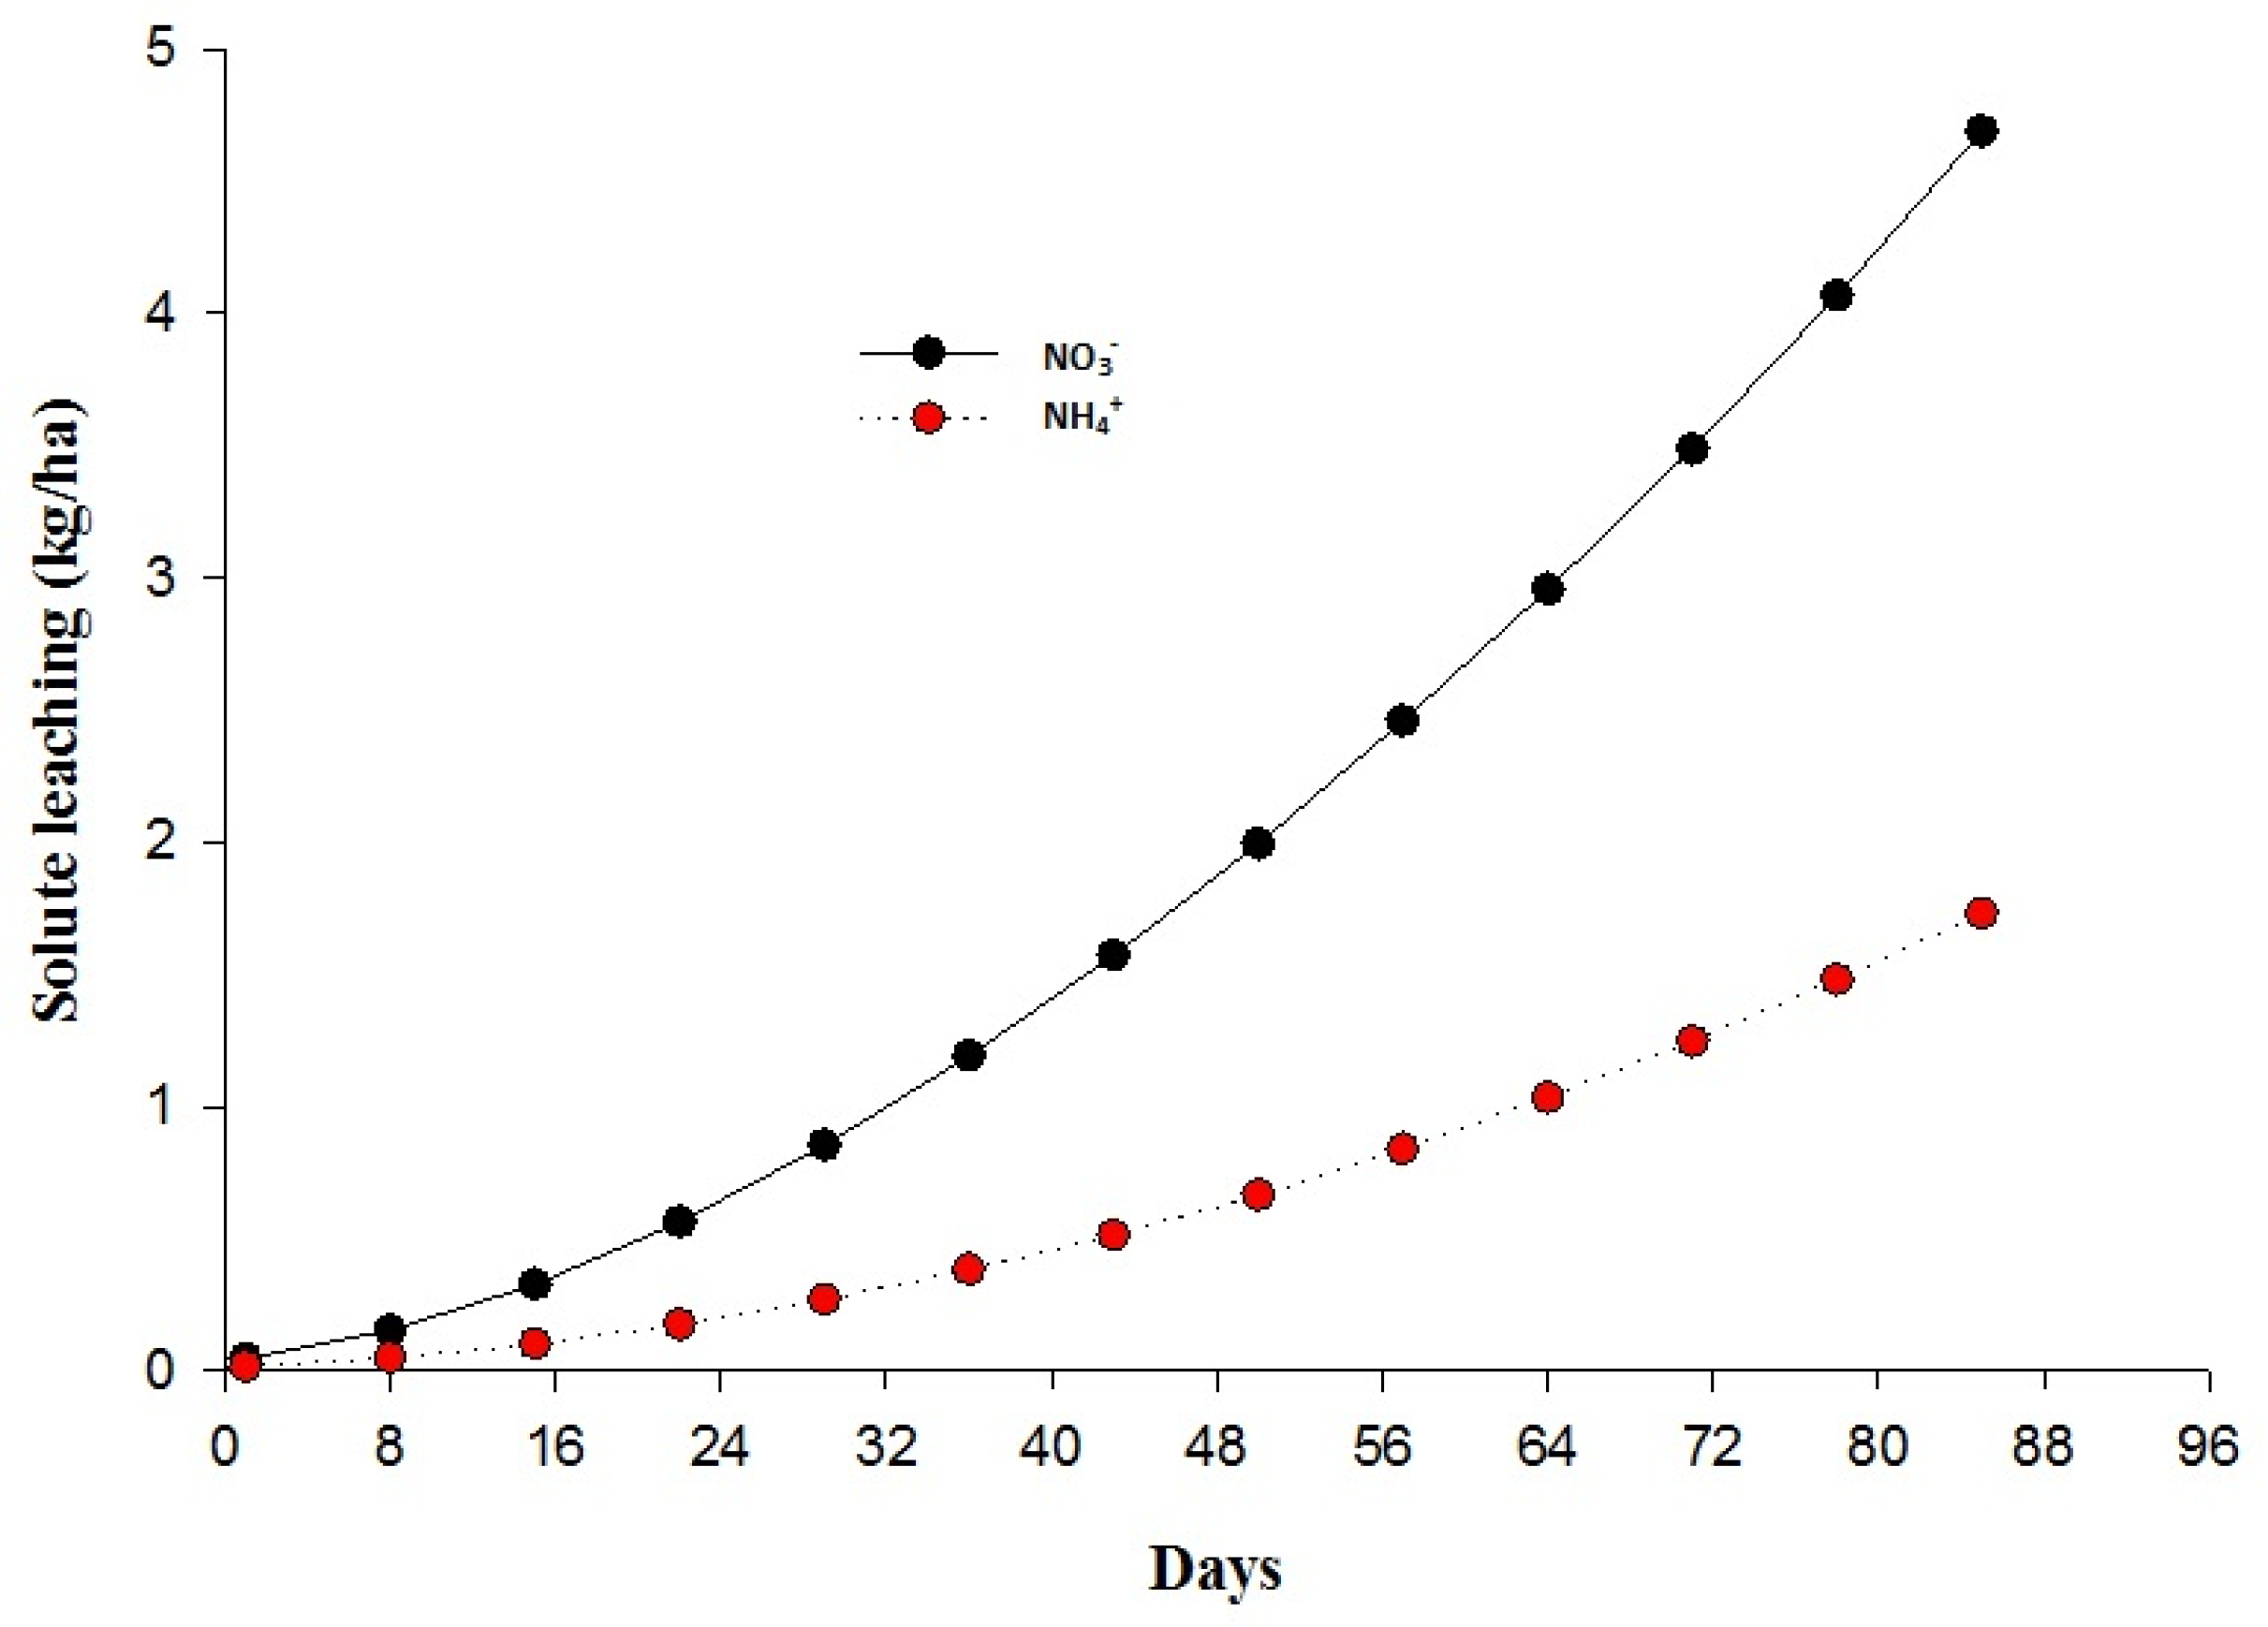
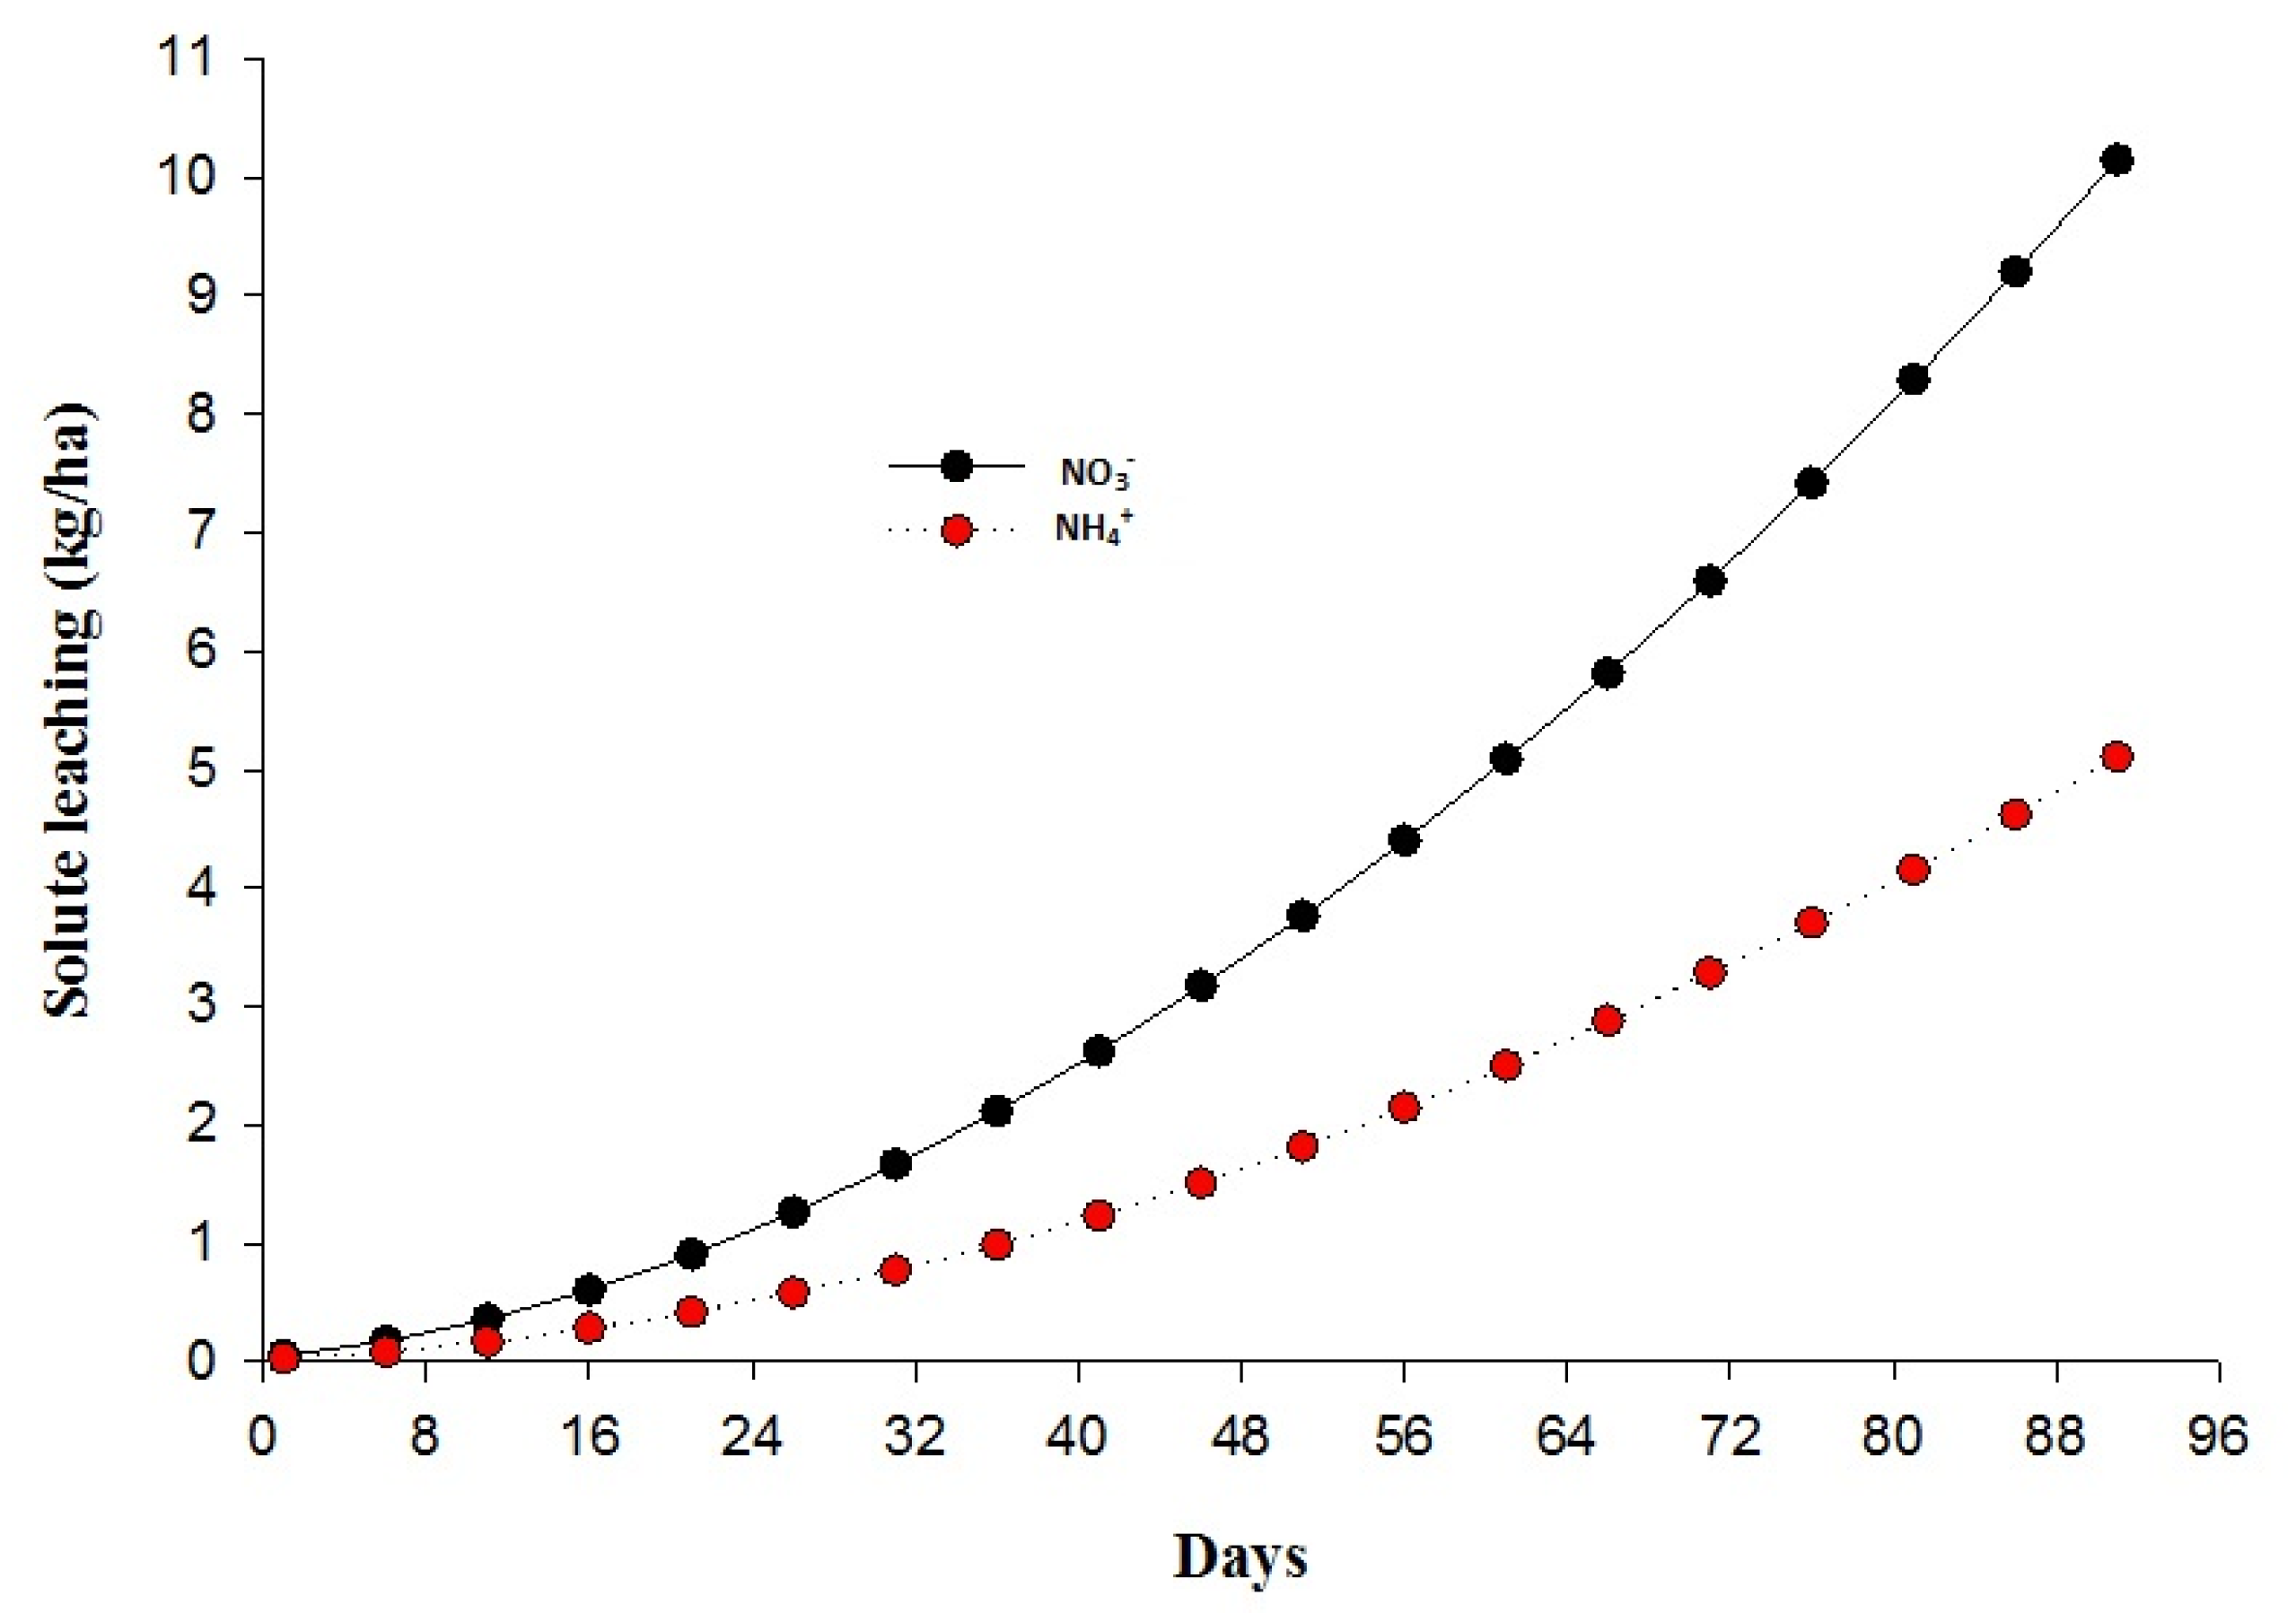
After obtaining the N concentrations by laboratory tests, the solute losses from subsurface/leachate were calculated as follow [
33]:
where
C = solute concentration (mg/L) and DP = deep percolation depth (mm).


