1. Introduction
Water scarcity has been a growing concern worldwide [
1,
2,
3]. Agriculture consumes 70% of the global freshwater withdrawal [
4]. With growing populations and expanding irrigated acreage, the water demand of agriculture continues to increase. Meanwhile, extensive application of fertilizer has caused severe, diffuse agricultural water pollution, which increases the competition for freshwater [
5]. In some river basins, due to limited water supply facilities and high water prices, crops are irrigated with inadequate water supply under field conditions. A comprehensive and accurate assessment of the volume and structure of agricultural water consumption under those conditions is key to improving water use efficiency and effectively managing water resources.
The water resources can be divided into green and blue water resources during water resource planning and management [
6,
7]. The concept of the “water footprint (WF)” was introduced by Hoekstra [
8] and it provides a tool to assist with water resource management and deals with water scarcity, such as changing consumption patterns or improving the water efficiency of production [
9,
10,
11,
12]. The WF of a product refers to the sum of the water volume consumed to produce the product [
13]. The blue WF refers to the volume of surface and groundwater consumed (evaporated) as a result of the production of a good. The green water footprint refers to the rainwater consumed. For crops, this refers to the portion of rainfall that infiltrates the soil and is accessible by plants to generate vapor flow in support of biomass growth [
9]. The grey WF of a product refers to the volume of freshwater that is required to assimilate the load of pollutants based on existing ambient water quality standards [
13]. The WF of unit production, which is also recognized as the virtual water content [
14,
15] when assessing virtual water flows among regions, reflects the regional water productivity or water use efficiency.
Within the agricultural sector, WF has been intensively studied from global levels to regional levels. Mekonnen and Hoekstra [
16,
17] estimated the green, blue, and grey WF of global wheat and quantified the green, blue, and grey WF of global crop production for the period 1996–2005. Siebert and Döll [
18] quantified the green and blue WF in global crop production, as well as potential production losses without irrigation. At the national level, Zhuo et al. [
19,
20] set up benchmark levels of consumptive WF of winter wheat and assessed the green and blue WF and virtual water trade in China under alternative future scenarios. Cao et al. [
21] assessed the blue and green water utilization in wheat production of China. Zoumides et al. [
22] employed a supply utilization approach along with two indicators, economic productivity of crop use and the blue water scarcity index, to assess the WF for the semi-arid island of Cyprus. Schyns and Hoekstra [
23] demonstrated the added value of the detailed analysis of the human water footprint within Morocco and thoroughly assessed the virtual water flows. At the regional level, Bulsink et al. [
24] analyzed the WF of an Indonesian province related to the consumption of crop products. Duan et al. [
25] explored the spatial variations of the WF and their relationships with agricultural inputs in Northeast China. Gobin et al. [
26] calibrated crop yield for a water balance model, “Aquacrop” at the field level and analyzed variability in the WF of arable crop production across European regions.
At the river basin level, Aldaya and Llamas [
27] analyzed the WF and virtual water in the semiarid Guadiana Basin. Yin et al. [
28] calculated the total WF and the net external WF of consumption in the Yellow River Basin of China. Zeng et al. [
29] quantified the WF in the Heihe River Basin of China during 2004–2006. Zang et al. [
30] reported on spatial and temporal patterns of both green and blue water flows, also in the Heihe River Basin. Zhuo et al. [
31] estimated the inter- and intra-annual WF of crop production in the Yellow River Basin for the period 1961–2009. Assessing WF at the river basin level is an important step to understanding how human activities influence the water cycle and is a basis for integrated water resource management and sustainable water uses within the basin [
29].
Prior studies analyzed or assessed the WF of crops by dividing them into pure rain-fed crops and irrigated crops with sufficient water. However, because of a lack of detailed long-term irrigation data, few studies assessed the WF with insufficient water supply restricted by water volume, water cost, and water supply facilities. Assessing the WF under those conditions can effectively improve our understanding regarding the agricultural water use status to improve agricultural water use efficiency. Additionally, few studies have investigated the spatial and temporal characteristics within the basin under the influence of many factors, such as climate, geography, soil property, and management practice (e.g., irrigation, fertilizer application). In order to effectively understand the agricultural water use status and reasonably allocate water resources within the basin, it is necessary to assess the spatial and temporal WF by dividing the basin into small regions according to administrative divisions which have their own record, climate, and geographical conditions. Among the above influences on spatial and temporal variations of the WF, irrigation is a key factor controlling the accuracy of WF assessment, especially in river basins facing water scarcity [
22,
23,
32,
33]. The irrigation quota is recommended by the local government to guide the farmers’ irrigation practice. Furthermore, in the process, many factors such as climate, geography, soil property, and manner of irrigation are considered. It is close to the actual scene for irrigated crops [
34]. Hence, the green, blue, and grey WF can be quantified with an irrigation quota to improve the accuracy of the WF assessment.
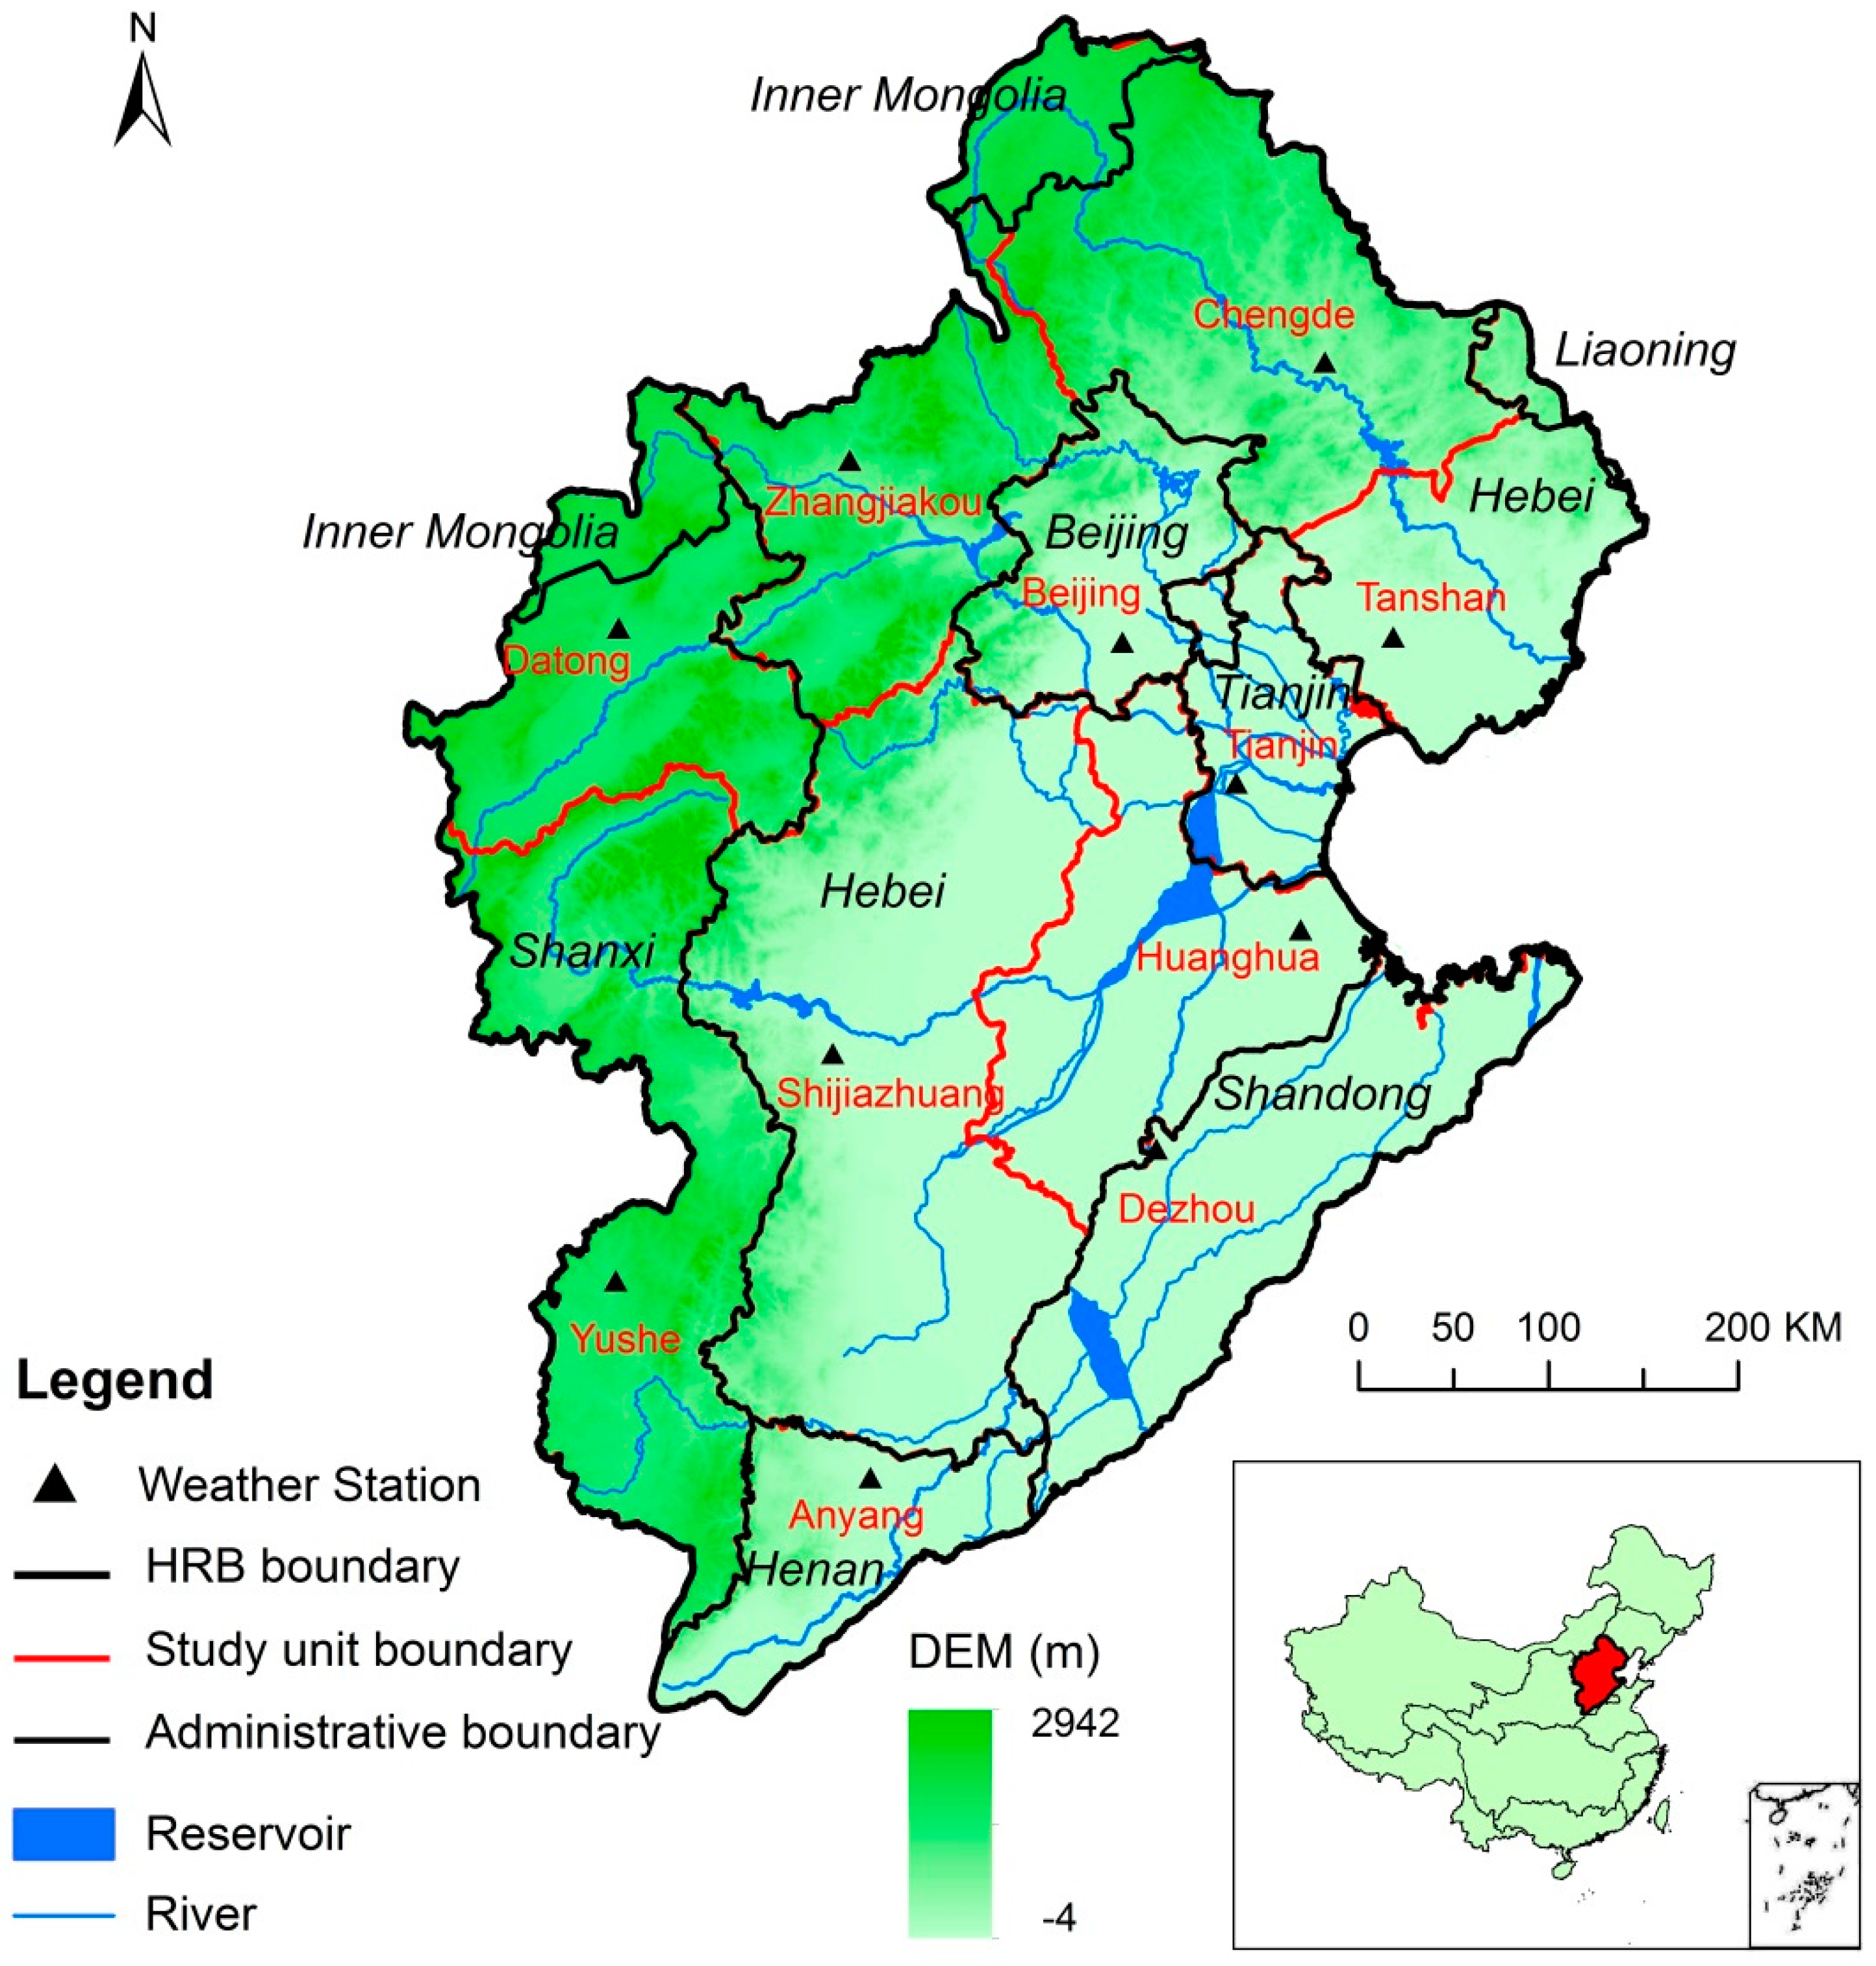
The Haihe River Basin (HRB), the political, economic, and cultural center of China, has 146 million inhabitants [
35] and is also a main grain producing area, with more than 10% of the national production. However, it is a historical water scarcity basin. The amount of water resources is 305 m
3 per capita, which is approximately 1/7 of the Chinese average (2200 m
3) and also 1/27 of the world average [
36,
37,
38]. Restricted by limited water resources, high water prices, water supply facilities, and different climate conditions, crops are irrigated with different intensity in different regions within the HRB. There are great differences in the WF accounting between insufficient irrigation conditions and traditional rain-fed and sufficient irrigation conditions. However, the WF assessment under these conditions and the subsequent spatiotemporal patterns are lacking for the HRB.
The specific objectives of this study are: (1) to take account of the WF of both wheat and maize within the HRB; (2) to analyze the temporal trends and spatial variations of the WF in the entire HRB during the period 1956–2015; and (3) to allocate the WF of wheat and maize based on administrative districts within the HRB.
3. Results
3.1. Total Water Footprint of Wheat and Maize in the HRB
The total WF of wheat and maize over the period 1956–2015 in the HRB was calculated, and the results are shown in
Table 4. The total WF of wheat is 20.1 billion m
3 year
−1 on average. The major portion of this water (52%) comes from green water, about 29% comes from blue water, and the remaining 19% is grey water. The total WF of maize is 15.1 billion m
3 year
−1 on average. The major portion of this water (73%) comes from green water, about 3% comes from blue water, and the remaining 24% is grey water, on average. Per hectare of cultivated land, wheat (4900 m
3 ha
−1) requires more water (including grey water) than maize (4580 m
3 ha
−1) on average. In the last ten years, the average blue WF of wheat (6.3 Gm
3 year
−1) and maize (0.6 Gm
3 year
−1) accounts for 26% and 2%, respectively, of the total agricultural water withdrawal of the HRB (24.04 Gm
3 year
−1) [
53].
To further analyze the structure of WF, the green water coefficient is defined as the ratio of green WF to the consumptive green and blue WF [
45]. As shown in
Table 4, the green water accounts for 65% and 96% of the consumptive WF for wheat and maize, respectively. For maize, 96% of the consumptive water comes from green water, because most parts of the HRB are planted with summer maize, which mainly grows in the flood season (June to September), with 70–85% of the annual rainfall. The green water coefficients estimated in this study are very close to the previous studies by Mekonnen and Hoekstra (2010) [
16] and Liu et al. [
45] (80% for all crops).
The total WF has different temporal variation trends for wheat and maize. For wheat, it increased (by 64%) from 1956 to 1997 and then decreased (by 3%) following the changing trends of planting areas. For maize, it continually increased (up to 144%) over the study period due to the continual increase of planting areas. For both wheat and maize, the grey water increased before 2001 due to the increased application of the nitrogen fertilizer. The growth rate of the nitrogen fertilizer application was faster than the growth rate of the production, which reversed after 2002.
3.2. Unit Water Footprint of Wheat and Maize in the HRB
The unit WF refers to WF per ton of crop production, which is the converse of the crop water productivity, and can reflect the water use efficiency of crops [
45]. Lower unit WF implies higher water use efficiency. Wheat (1580 m
3 t
−1) has a larger unit WF than maize (1275 m
3 t
−1), on average. In 2006–2015, the unit WF for wheat and maize production was 1022 m
3 t
−1 and 934 m
3 t
−1, respectively.
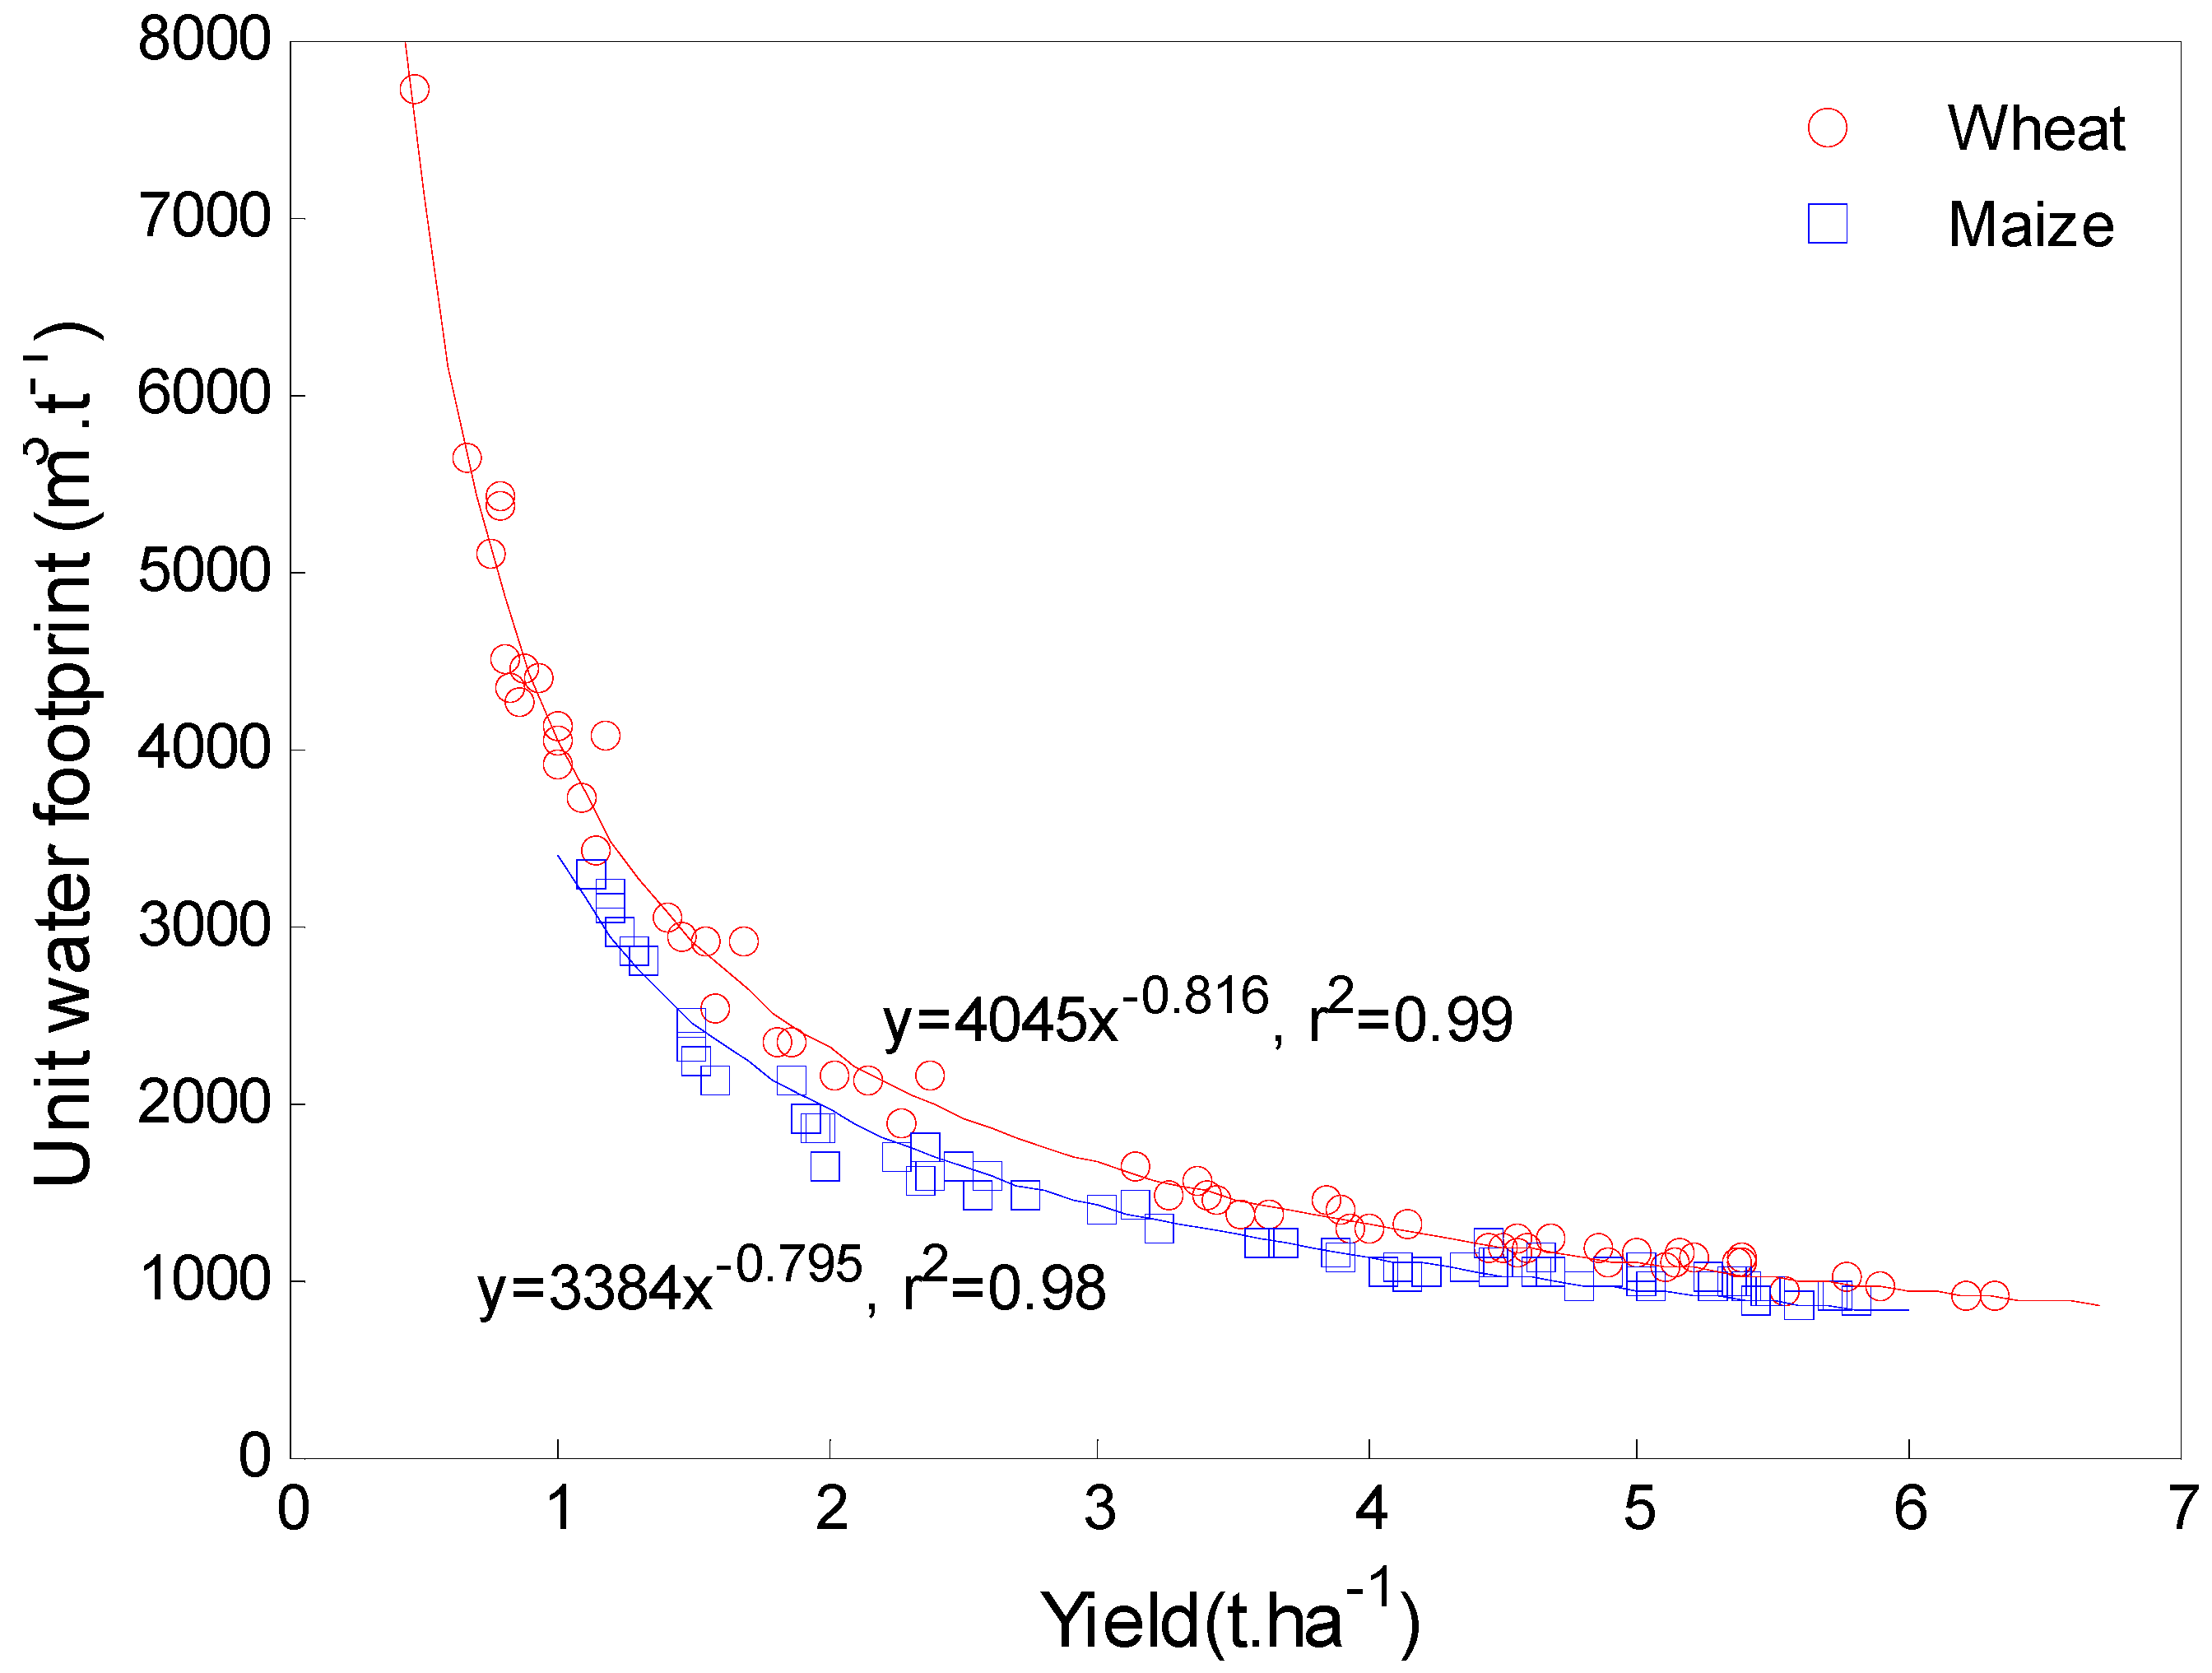
The unit WF for both wheat and maize have exponentially decreasing trends along with the increasing production, indicating that water use efficiency has improved (
Figure 2 and
Figure 3). The yield increased significantly due to the agricultural technology development, such as the large application of fertilizer, and innovation in agriculture management practices, such as the household contract responsibility system in the 1980s across China, which raised farmer’s enthusiasm and increased the yield.
The temporal variation trends of unit WF are fitted well by an exponential function with a non-linear least square method. It can be described as
(
= 0.83) (
Figure 2) and
(
= 0.79) (
Figure 3) for wheat and maize, respectively. The unit WF value was significantly high in 1961, with a value of 7533 m
3 t
−1, and that was because China experienced severe drought; at that time the production (1.6 million tons) was nearly half of the national average. In addition, in 1960 maize production decreased largely due to the severe drought, which resulted in a larger WF for maize (3254 m
3 t
−1).
The grey WF for unit wheat production increased significantly from 26 m
3 t
−1 to 366 m
3 t
−1 over the period 1956–2001 due to the increasing application of fertilizer (from 2 kg ha
−1 to 170 kg ha
−1) and then decreased 30% (276 m
3 t
−1) in 2015, mainly because the yield increased while the fertilizer application did not change much. For maize, it increased from 17 m
3 t
−1 to 384 m
3 t
−1 from 1956 to 1997, and then decreased 25% (276 m
3 t
−1) in 2015. In 2006–2015, the grey WF was 302 m
3 t
−1 and 304 m
3 t
−1 for unit wheat and maize production, respectively. It was 45% and 48% larger, respectively, than the world average estimated by Mekonnen and Hoekstra [
17] (207 m
3 t
−1). This indicates that agricultural water pollution is more severe than in other regions in the world, so the application of fertilizer should be reduced to assimilate the agricultural water pollution in the HRB.
The unit WF can be described and fitted well with a power function of crop yield (
Figure 4). It is y = 4045x
−0.816 (R
2 = 0.99) and y = 3384x
−0.795 (R
2 = 0.98) for wheat and maize, respectively. A similar relationship was studied by Mekonnen and Hoekstra. [
17], who argued that the trend between unit WF and the yield of cereals follows a logarithmic function. This indicated that the WF of crops is largely influenced by agricultural management rather than by climate conditions. Crop variety improvement, mechanization technologies, the rational combination of irrigation and fertilizer, and the change from family-oriented to farm management could increase the yields of wheat and maize. Further, improving crop production is an effective way to reduce the unit WF and improve water use efficiency. This can also be used to estimate the unit WF in the HRB when lacking information or to estimate the crop water use in the future.
3.3. Water Footprint Allocation among Administrative Units
Reasonable allocation of water resources within a river basin can reduce the competition for limited water resources among different regions and alleviate the intensified situation of water scarcity. The WF at the province (or municipality, which is the basic administrative district within the HRB) level was analyzed in the period of 2011–2015, and the results are shown in
Table 5. Note that only the region located within the basin is calculated for each province or municipality.
The sum of the WF of wheat and maize is 47.39 billion m
3, which is much more than the water withdrawal of agriculture (24.76 Gm
3 year
−1). This is because the water withdrawal of agriculture excluded the green and grey water. The blue water of wheat and maize accounts for 28% of the total water withdrawal of agriculture. The total WF is 22.11 and 25.28 Gm
3 year
−1 for wheat and maize, respectively. The largest WF for wheat was found in Hebei Province, with a value of 13.12 Gm
3 year
−1 (43% green, 26% blue, and 31% grey), which accounts for 59% of the total WF of wheat in the basin. This is because Hebei has the largest arable land and crop area. The planting area of Hebei Province (2.4 Mha) occupies 60% of the HRB. The order for wheat WF is Hebei (59%) > Shandong (19%) > Henan (12%) > Shanxi (5%) > Tianjin (3%) > Beijing (2%) (
Figure 5). For maize, the largest WF is also found in Hebei province, with a value of 15.93 Gm
3 year
−1 (65% green, 1% blue, and 34% grey), which accounts for 63% of the total WF of maize in the HRB. The order for maize WF is Hebei (63%) > Shandong (13%) > Shanxi (10%) > Henan (6%) > Tianjin (5%) > Beijing (3%) (
Figure 5), which is slightly different for Henan and Shanxi. The proportion of WF for maize in Henan (6%) is much smaller than that of wheat (12%) because, in Henan, wheat has a larger planting area (480 kha) than maize (290 kha) within the HRB. With wheat and maize WF combined together, Hebei province has the largest WF, which accounts for 61% of the total, followed by Shanxi (16%). Beijing and Tianjin account for 2% and 4% of the total WF, respectively.
The unit WF, which reflects the water use efficiency, was significantly different between different administrative districts in 2011–2015. The largest unit WF was found in Beijing and Tianjin for wheat and maize, respectively. The blue WF in Beijing (691 m3 t−1) was the largest for unit wheat production due to the large amount of irrigation (428 mm year−1). Water-saving irrigation systems could be used to reduce the amount of irrigation water and improve the efficiency in the future.
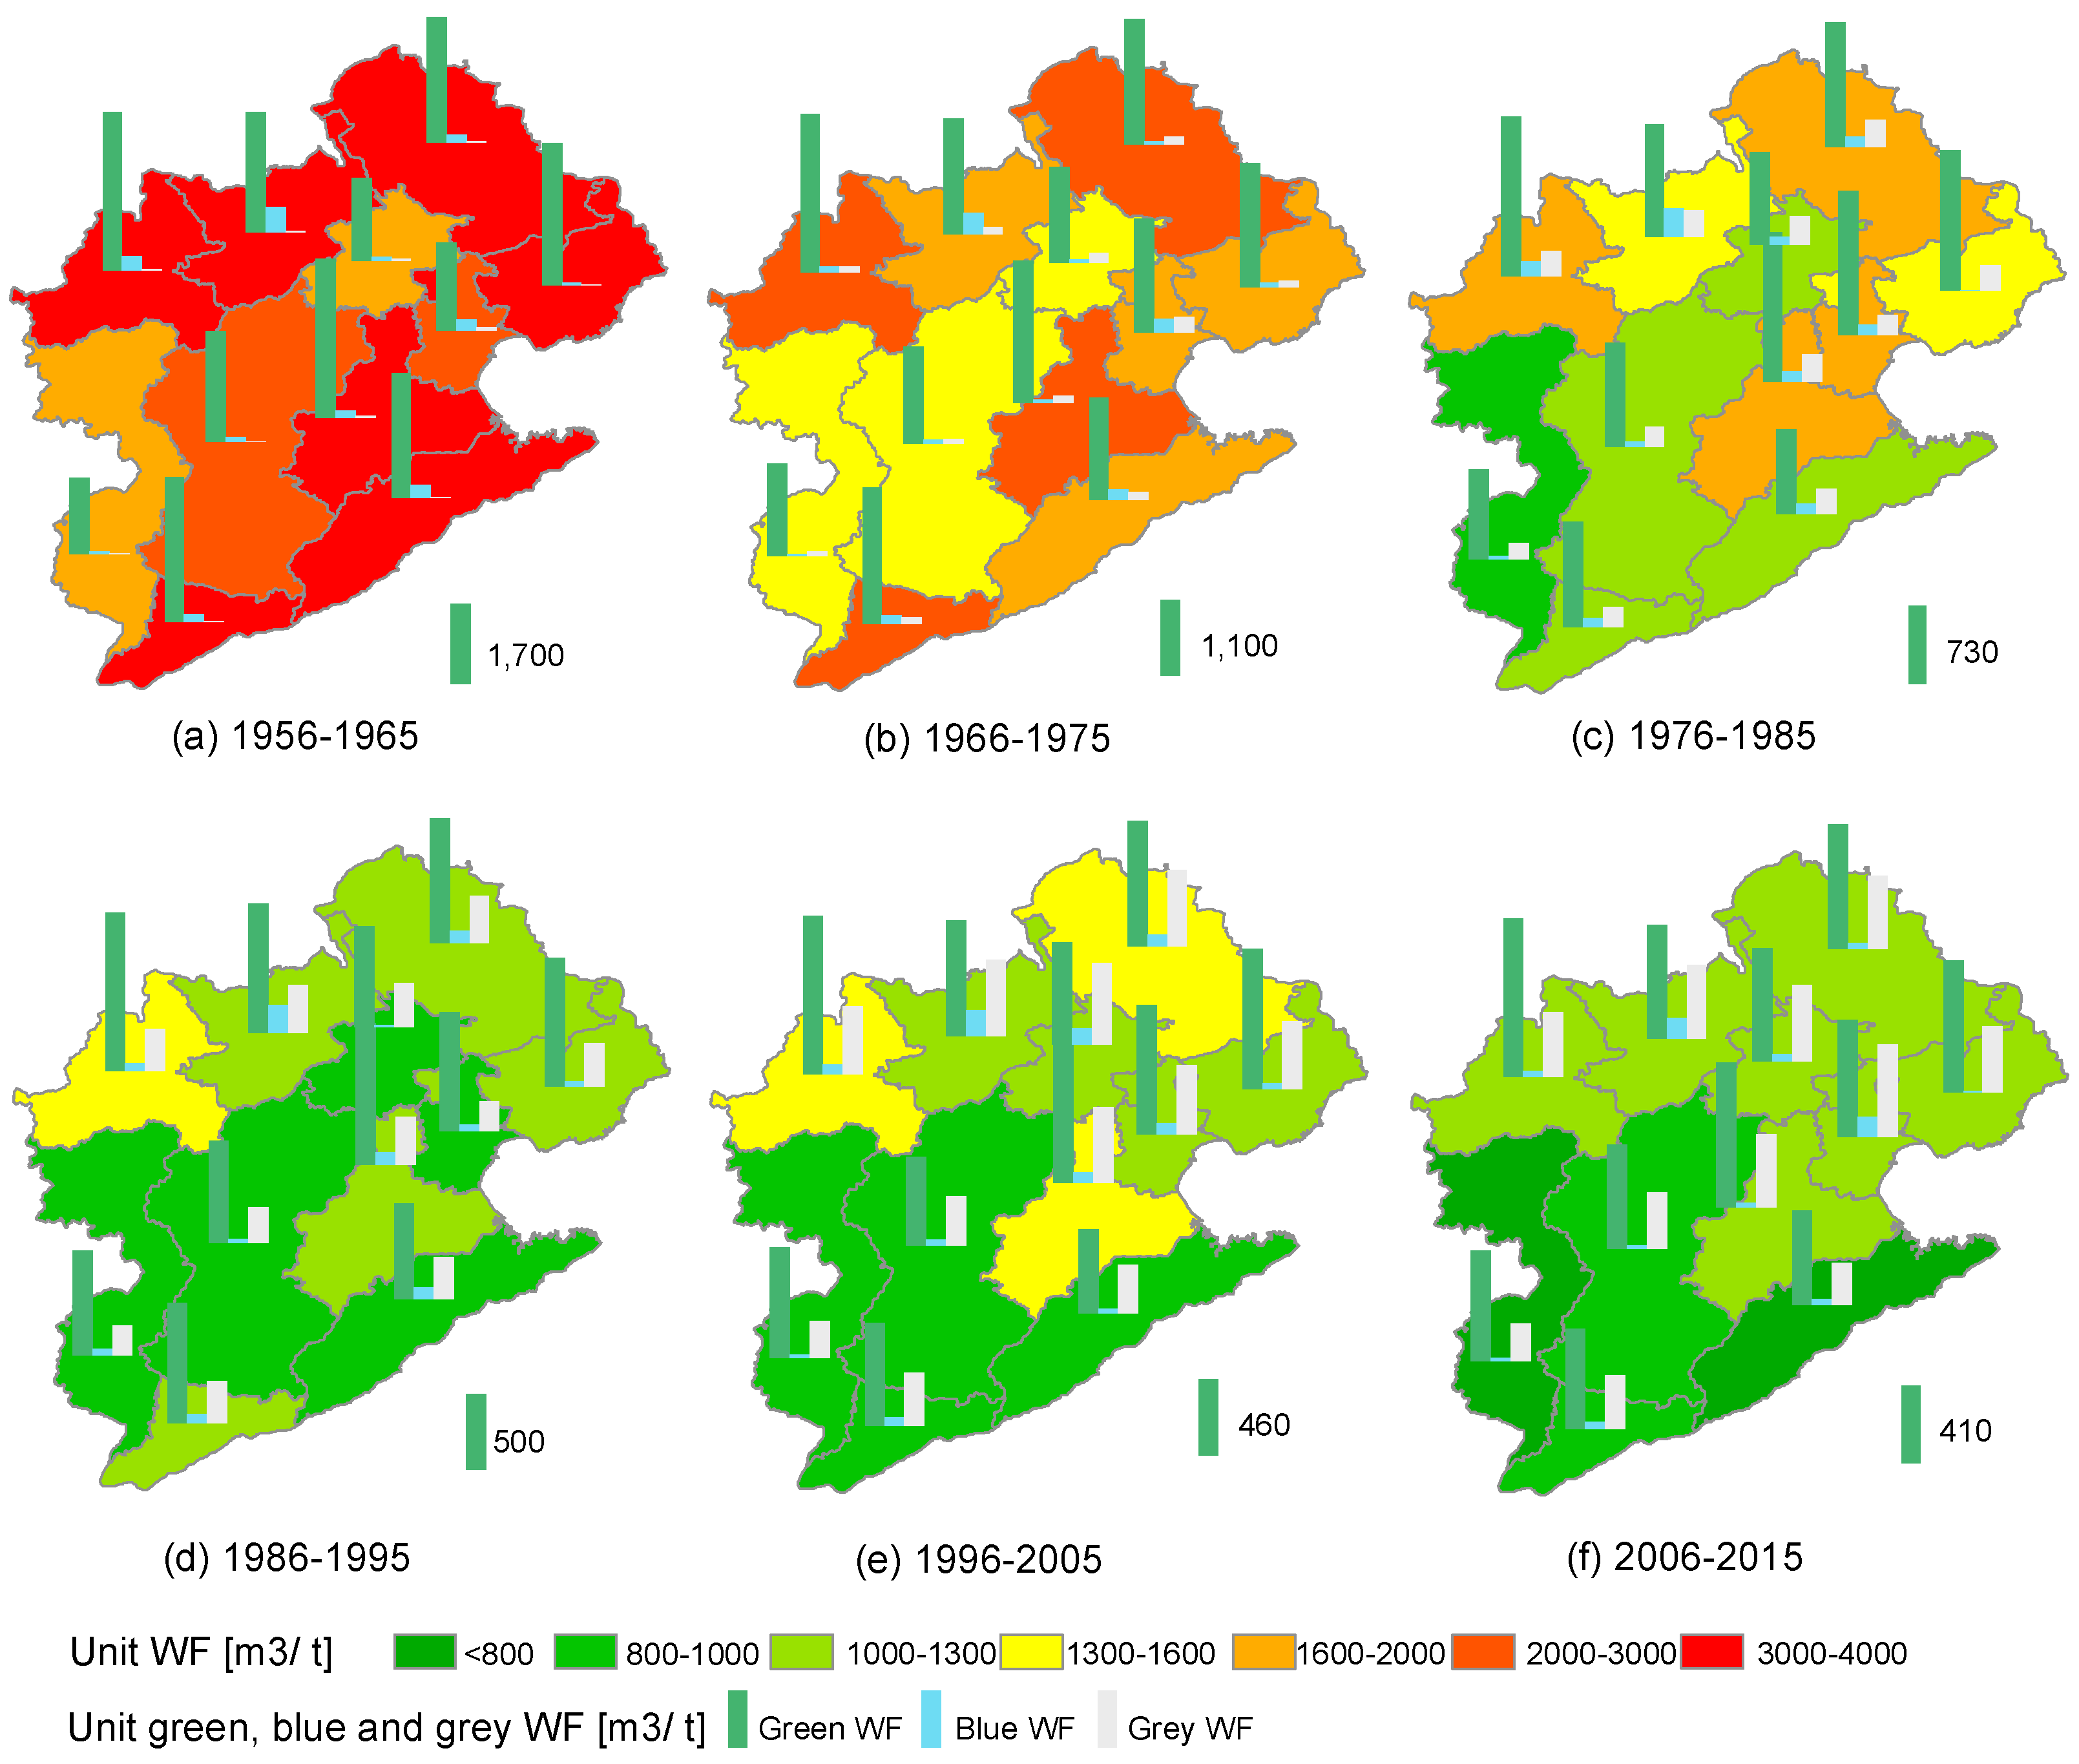
3.4. Spatial Distribution of Unit Water Footprint
The unit WF of wheat and maize varies largely across regions, as shown in
Figure 6 and
Figure 7. For unit wheat production, Tianjin has the largest WF on average (1956–2015). The second largest group is the region surrounding Tianjin, containing Beijing, Tangshan, and Huanghua. The remaining areas, containing Yushe, Shijiazhuang, Anyang, and Dezhou, have relatively smaller WF, because these areas are mainly grain-producing areas, especially Anyang and Dezhou, which have larger yields than the others due to efficient and centralized management.
The spatial distribution of unit WF for maize is different from wheat. First, the unit WF of spring maize planted in Northwestern HRB (Zhangjiakou, Chengde, and Datong) is larger than for summer maize in other regions. This is because the growing period of spring maize is longer than that of summer maize. In the summer maize-planted areas, Huanghua has the largest unit WF (1860 m3 t−1) on average. This is because the yield of maize in Huanghua is much smaller than in other regions. In contrast, relatively lower unit WF is found in the south of the HRB (e.g., Dezhou) because of the relatively higher yield.
The variation in space could be attributed to the different climate conditions, geography, soil properties, and management practices among these regions. Tianjin has the largest unit WF because of the lower yield and large application of fertilizer. Many factors might cause a lower crop yield, such as soil physiochemical properties and management practices. These factors should be further studied to improve crop productivity.
3.5. Water Footprint under Different Irrigation Conditions
Irrigation is a key factor affecting the accuracy of WF assessment. In this study, a comparison was made of the WF of wheat and maize under rain-fed and irrigated conditions with sufficient and insufficient water. The crops suffered water stress under conditions of rain-fed and insufficient irrigation, and the yields were simulated by a yield reduction fraction caused by the reduction of crop evapotranspiration proposed by Doorenbos and Kassam [
54].
Maize production per hectare requires more water than wheat under all conditions. This is because maize has a much shorter growing period than wheat. The yield of wheat under sufficient water conditions is 93% larger than for rain-fed. This indicates that irrigation plays a vital role in the wheat growing period. For maize, the yield is relatively good even without irrigation, because it mainly grows in the rainy season and there is sufficient water during the crop-growing period.
For both wheat and maize, the unit WF under sufficient irrigation conditions was lower than rain-fed and crops under insufficient irrigation conditions (
Table 6). This is because irrigation can significantly improve the crop yield, though more blue water is required. The result is close to other studies [
17].
5. Summary and Conclusions
The spatial and temporal characteristics of WF of wheat and maize are analyzed in the period 1956–2015 in the HRB. The major portion of total WF comes from green water, especially for maize production, indicating that we should pay more attention to the management of rain water in the future. In all, 19% and 24% of total WF are required to eliminate agricultural water pollution for wheat and maize, respectively. Those are much higher percentages than the world average, indicating that fertilizer use efficiency should be improved in the future. The total WF of wheat and maize varied largely in 1956–2015, mainly following the changing planting areas.
Per ton of crop, wheat (1581 m3 t−1) required more water than maize (1275 m3 t−1). The unit WF of wheat and maize both have exponentially decreasing trends due to increasing production, indicating that water use efficiency has improved. However, increased production was mainly caused by increased fertilizer use, resulting in increased grey water.
Considering the total WF of crop production allocation based on administrative districts (only the area located in the HRB was considered), Hebei Province has the largest WF of both wheat and maize, which accounts for 61% of the total WF, followed by Shanxi (16%), and Beijing and Tianjin account for 2% and 4% of the total WF, respectively. The allocation of WF between administrative districts within the HRB provides an effective way to reduce the conflict among different regions over competition for limited water resources.
The WF varies largely in space. Spring maize has relatively larger unit WF than summer maize. Tianjin has the largest unit WF for wheat because of the poor yield and large application of fertilizer. Other factors might also cause poor crop yield, such as soil physicochemical properties and management practices. These factors should be further studied to improve water productivity. Spring maize has relatively larger unit WF than summer maize due to the longer growing period.
A comparison was made of the WF of wheat and maize under different irrigation conditions. Maize production per hectare requires more water than wheat for all conditions. For both wheat and maize, the unit WF under sufficient irrigation conditions is lower than rain-fed and crops under insufficient irrigation conditions, though much blue water is consumed.
Overall, this study assessed the WF of wheat and maize in HRB of Northern China over the period 1956–2015. The WF analysis for wheat and maize in the HRB shows very large spatial and temporal variations. Analyzing the spatial and temporal characteristics of WF is helpful for basin agencies to make proper water management decisions to improve agricultural water use efficiency and control diffuse agricultural water pollution.
In future studies, in order to improve the accuracy of WF assessment, high-resolution climate datasets and detailed soil datasets should be considered. Meanwhile, in order to obtain more accurate WF and calibrate and validate the model parameters, the soil water conditions and crop growing status in the HRB should be monitored by field experiments.

 ,
, 


