Modeling Approach for Water-Quality Management to Control Pollution Concentration: A Case Study of Ravi River, Punjab, Pakistan


Abstract
:1. Introduction
2. Materials and Methods
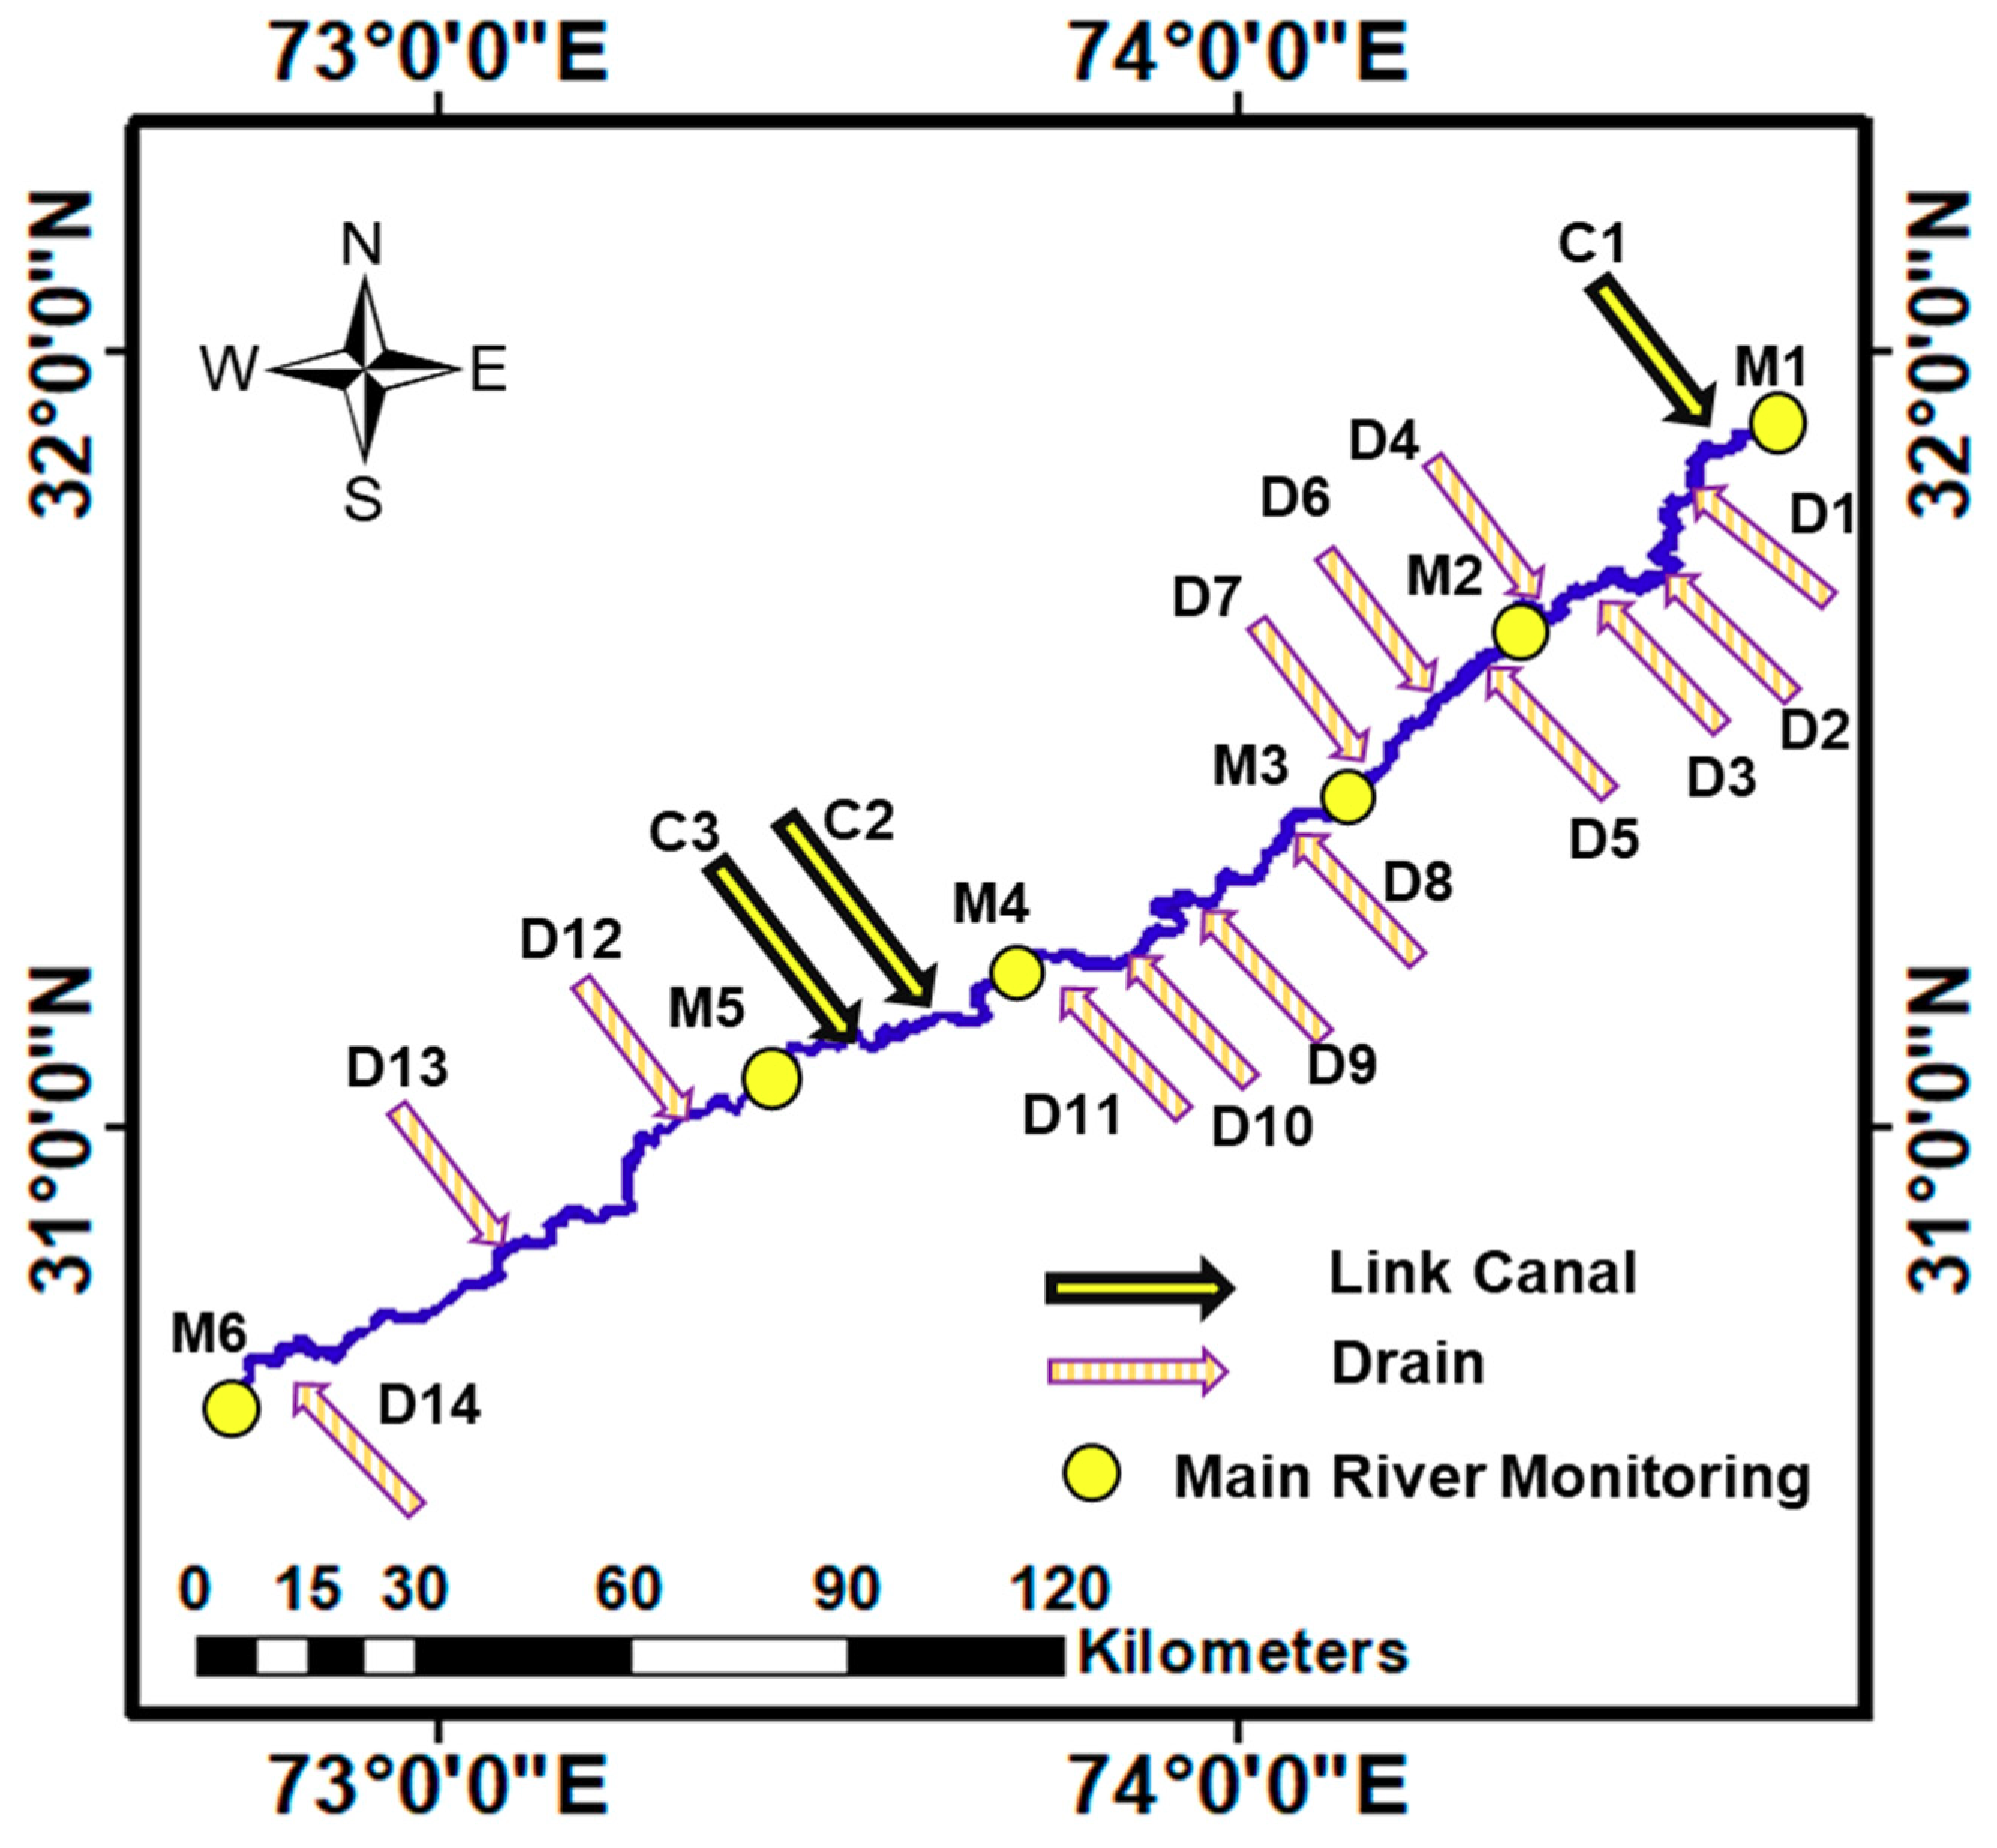
2.1. Study Area
2.2. Data Collection for Water-Quality Assessment.
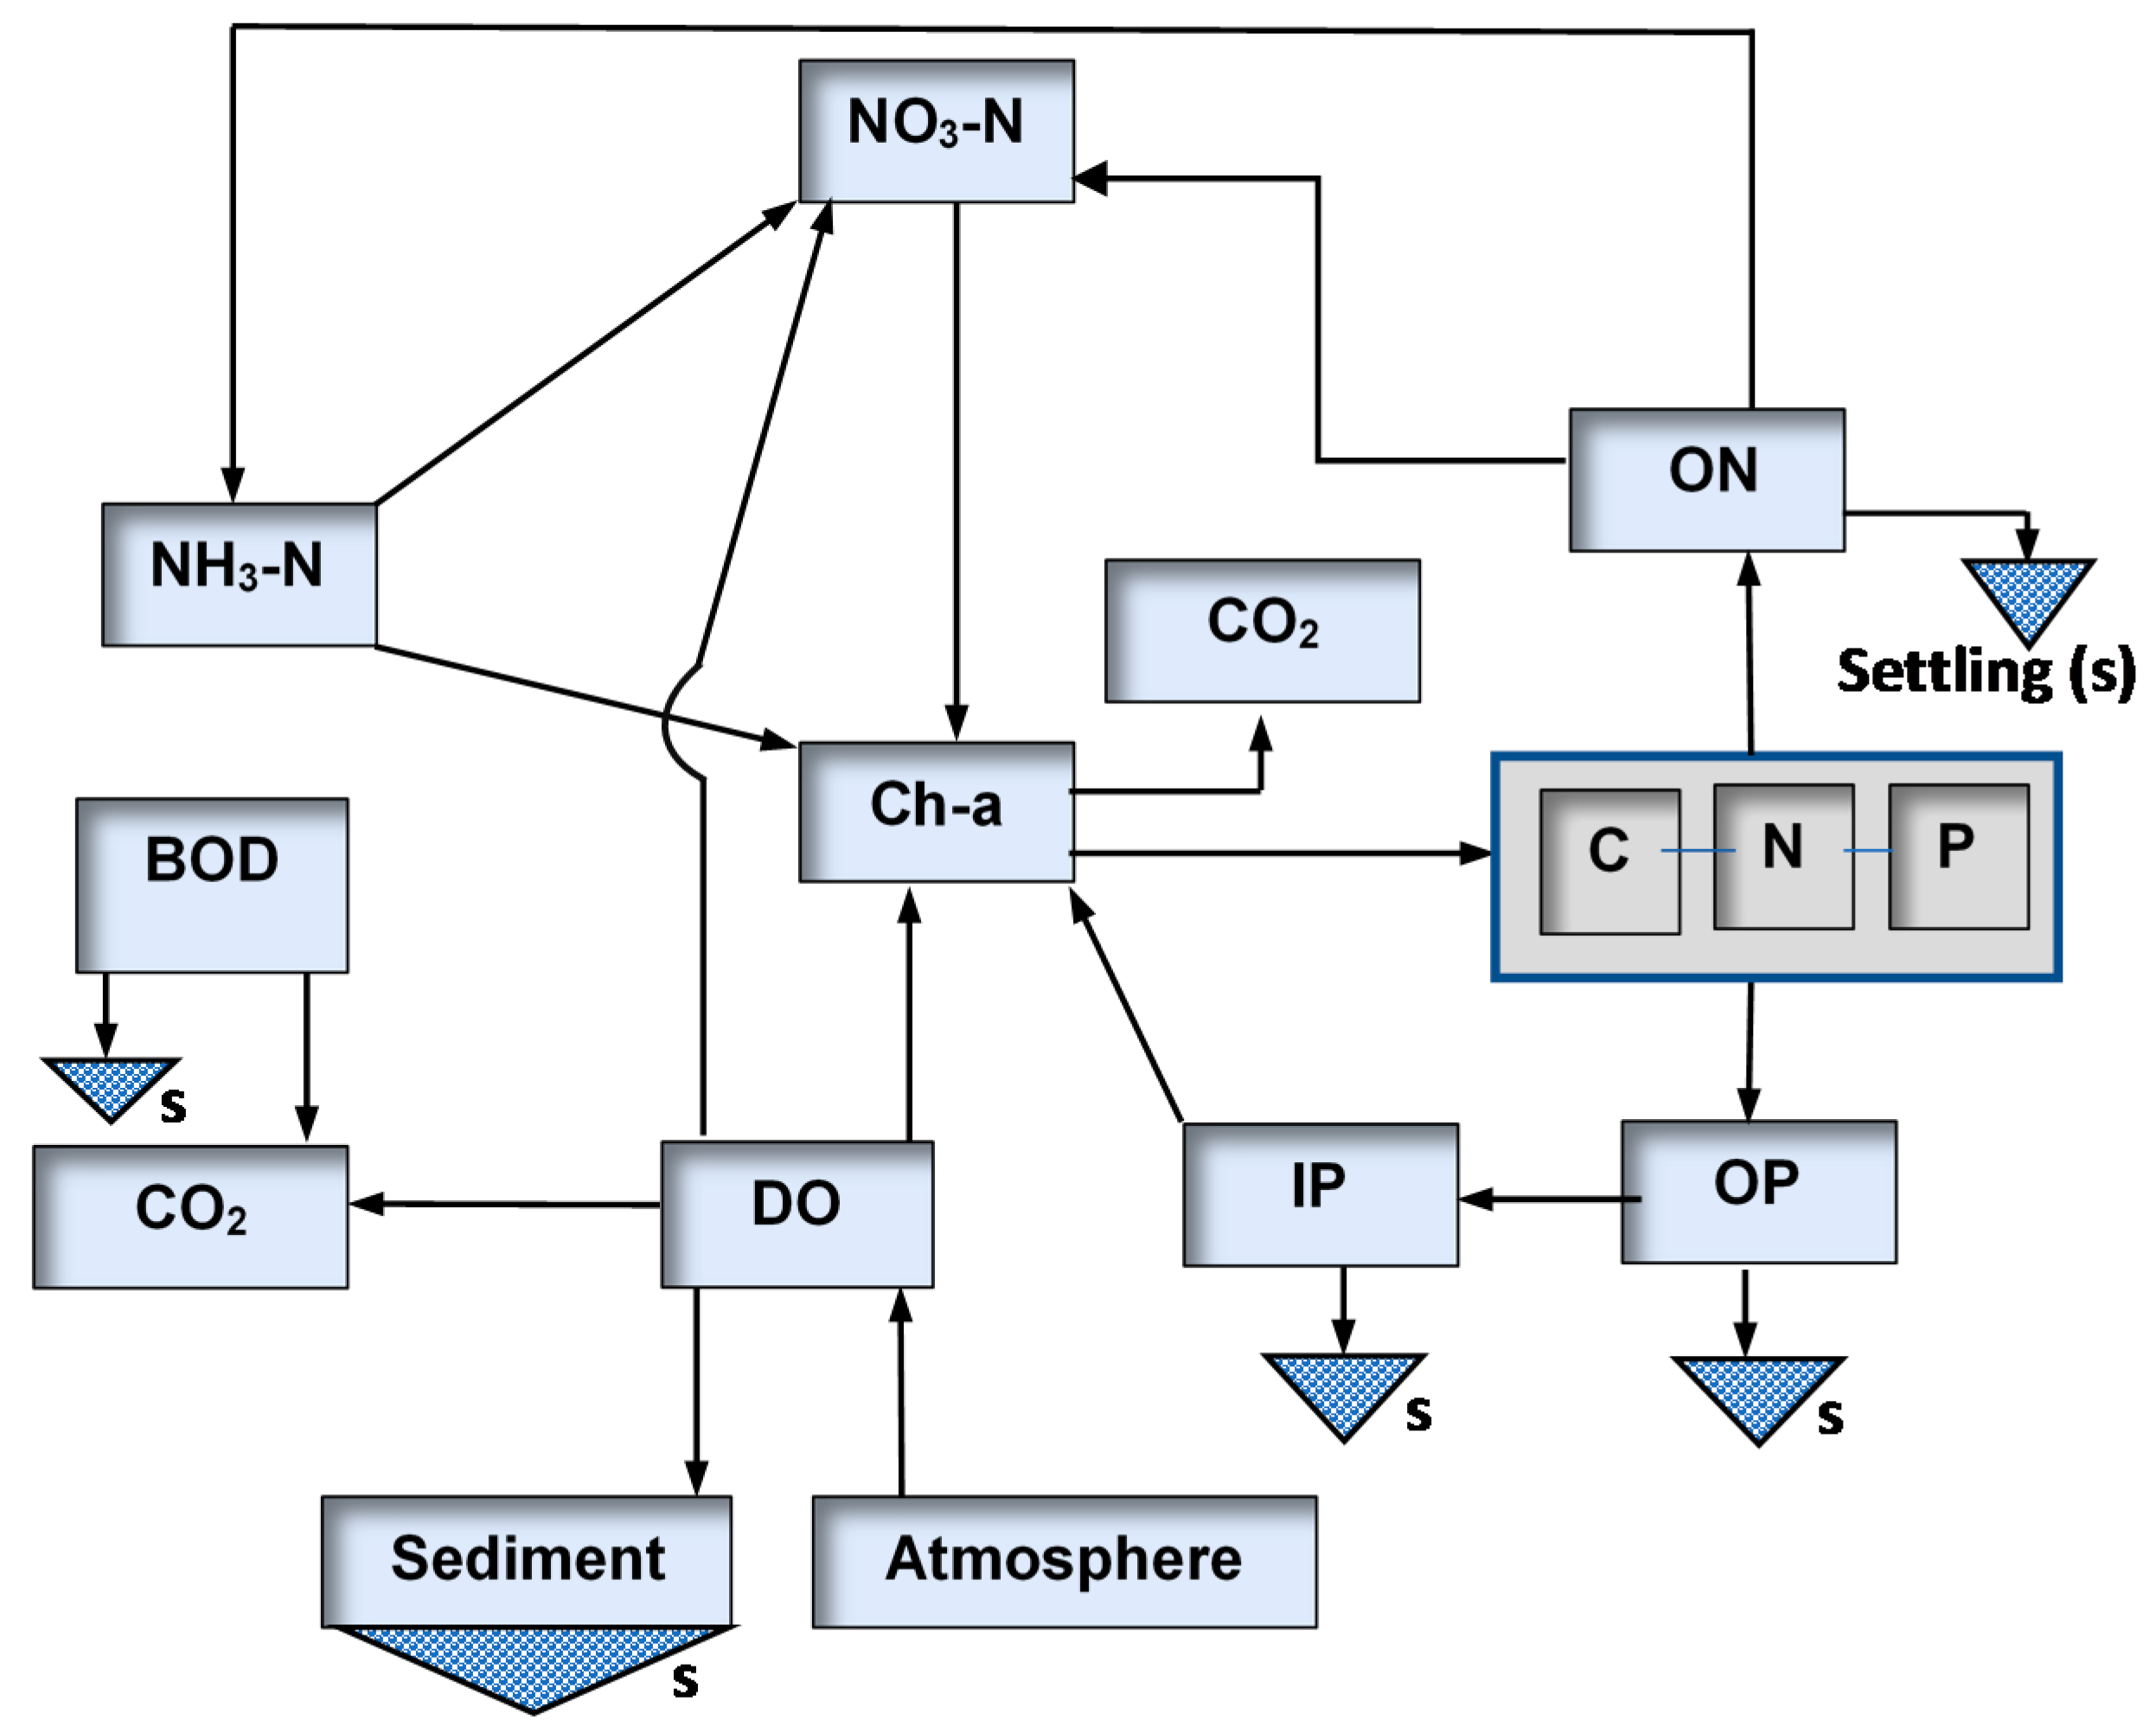
2.3. Overview of WASP Model
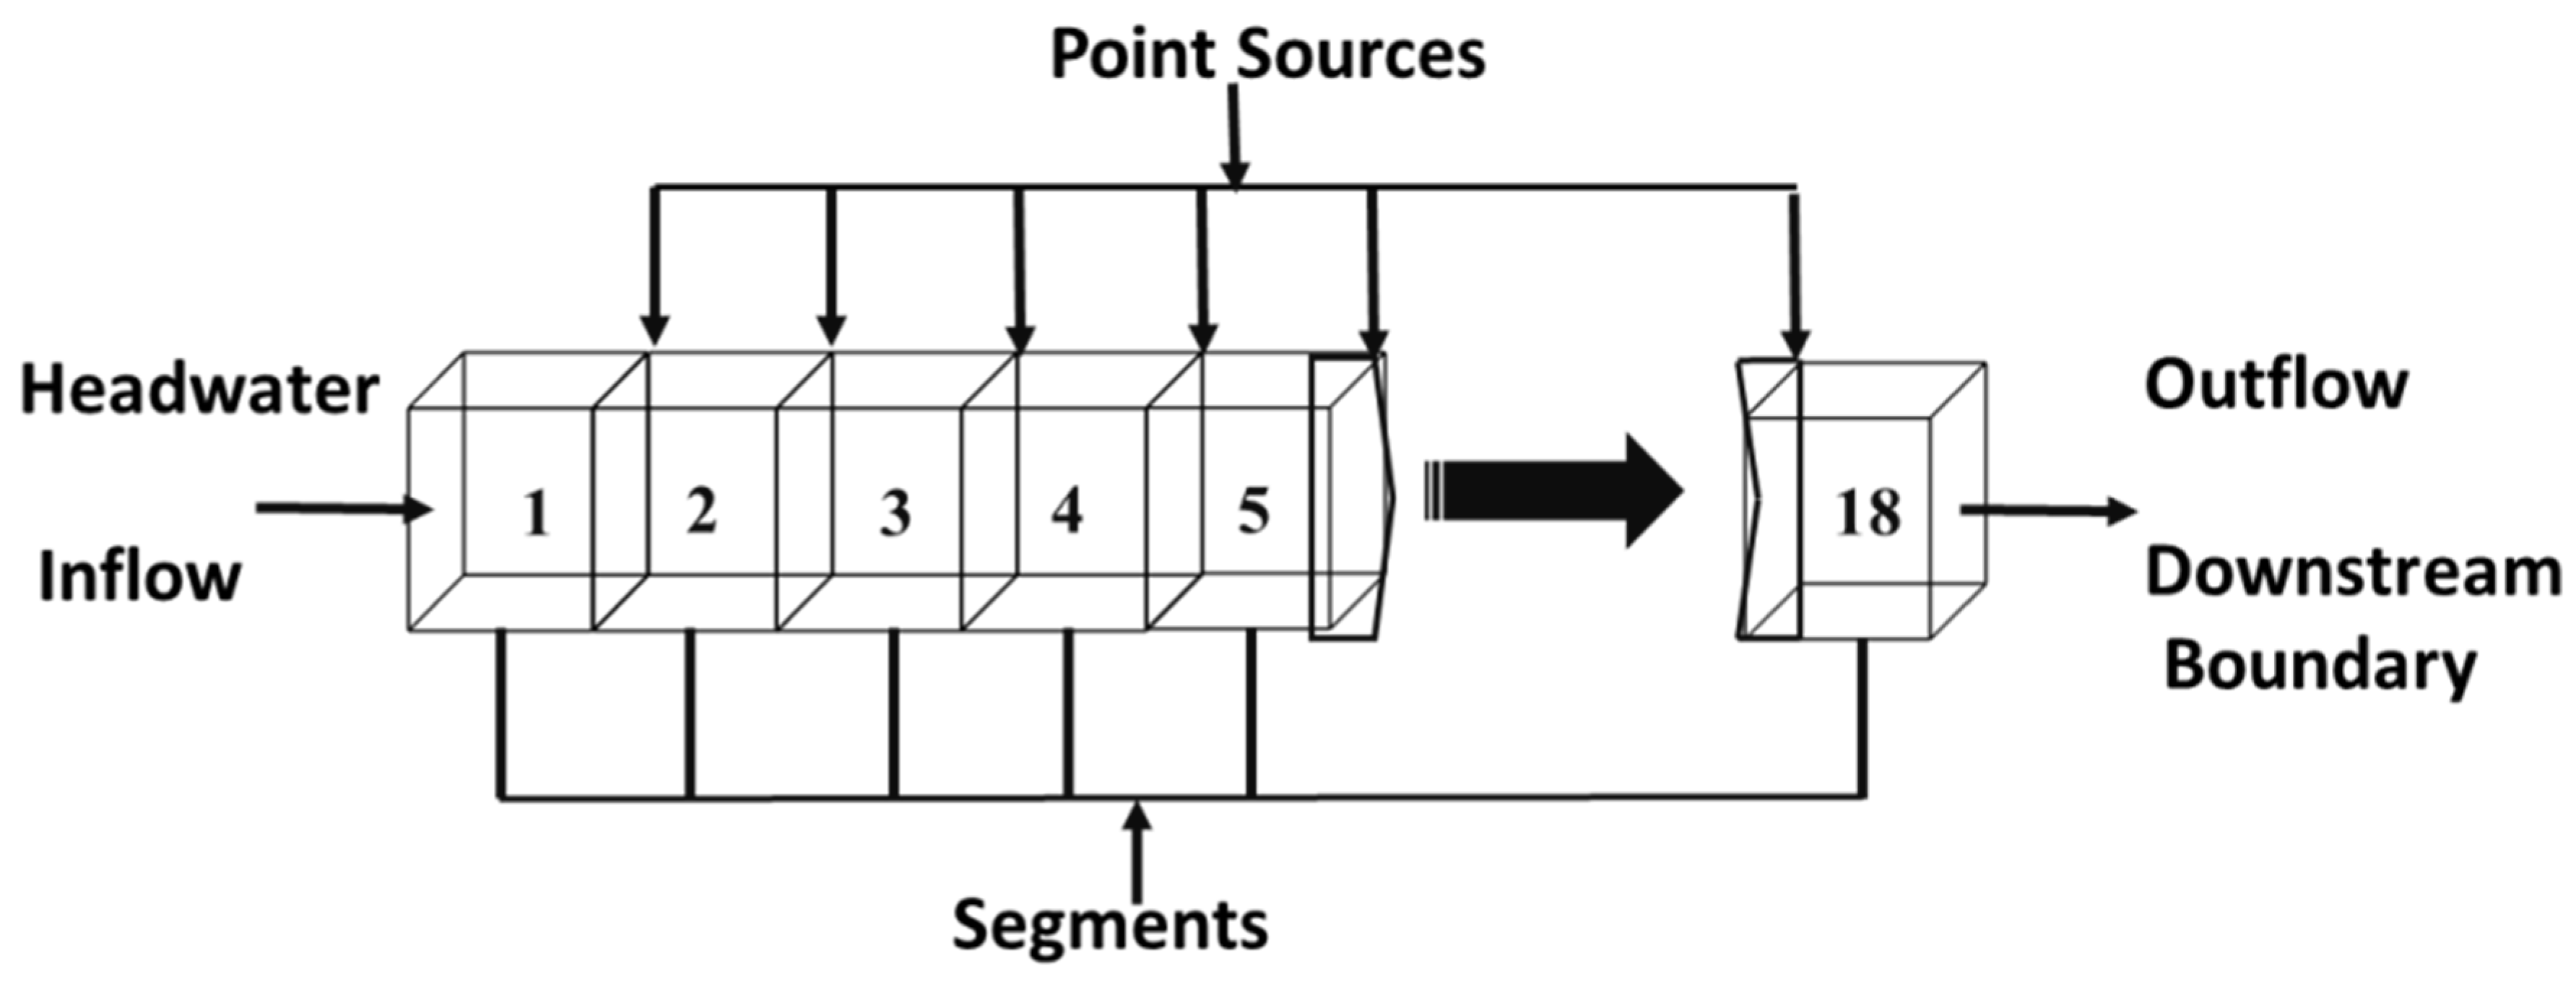
2.4. Model Physical Domain
2.4.1. River Discretization
2.4.2. Initial and Boundary Conditions
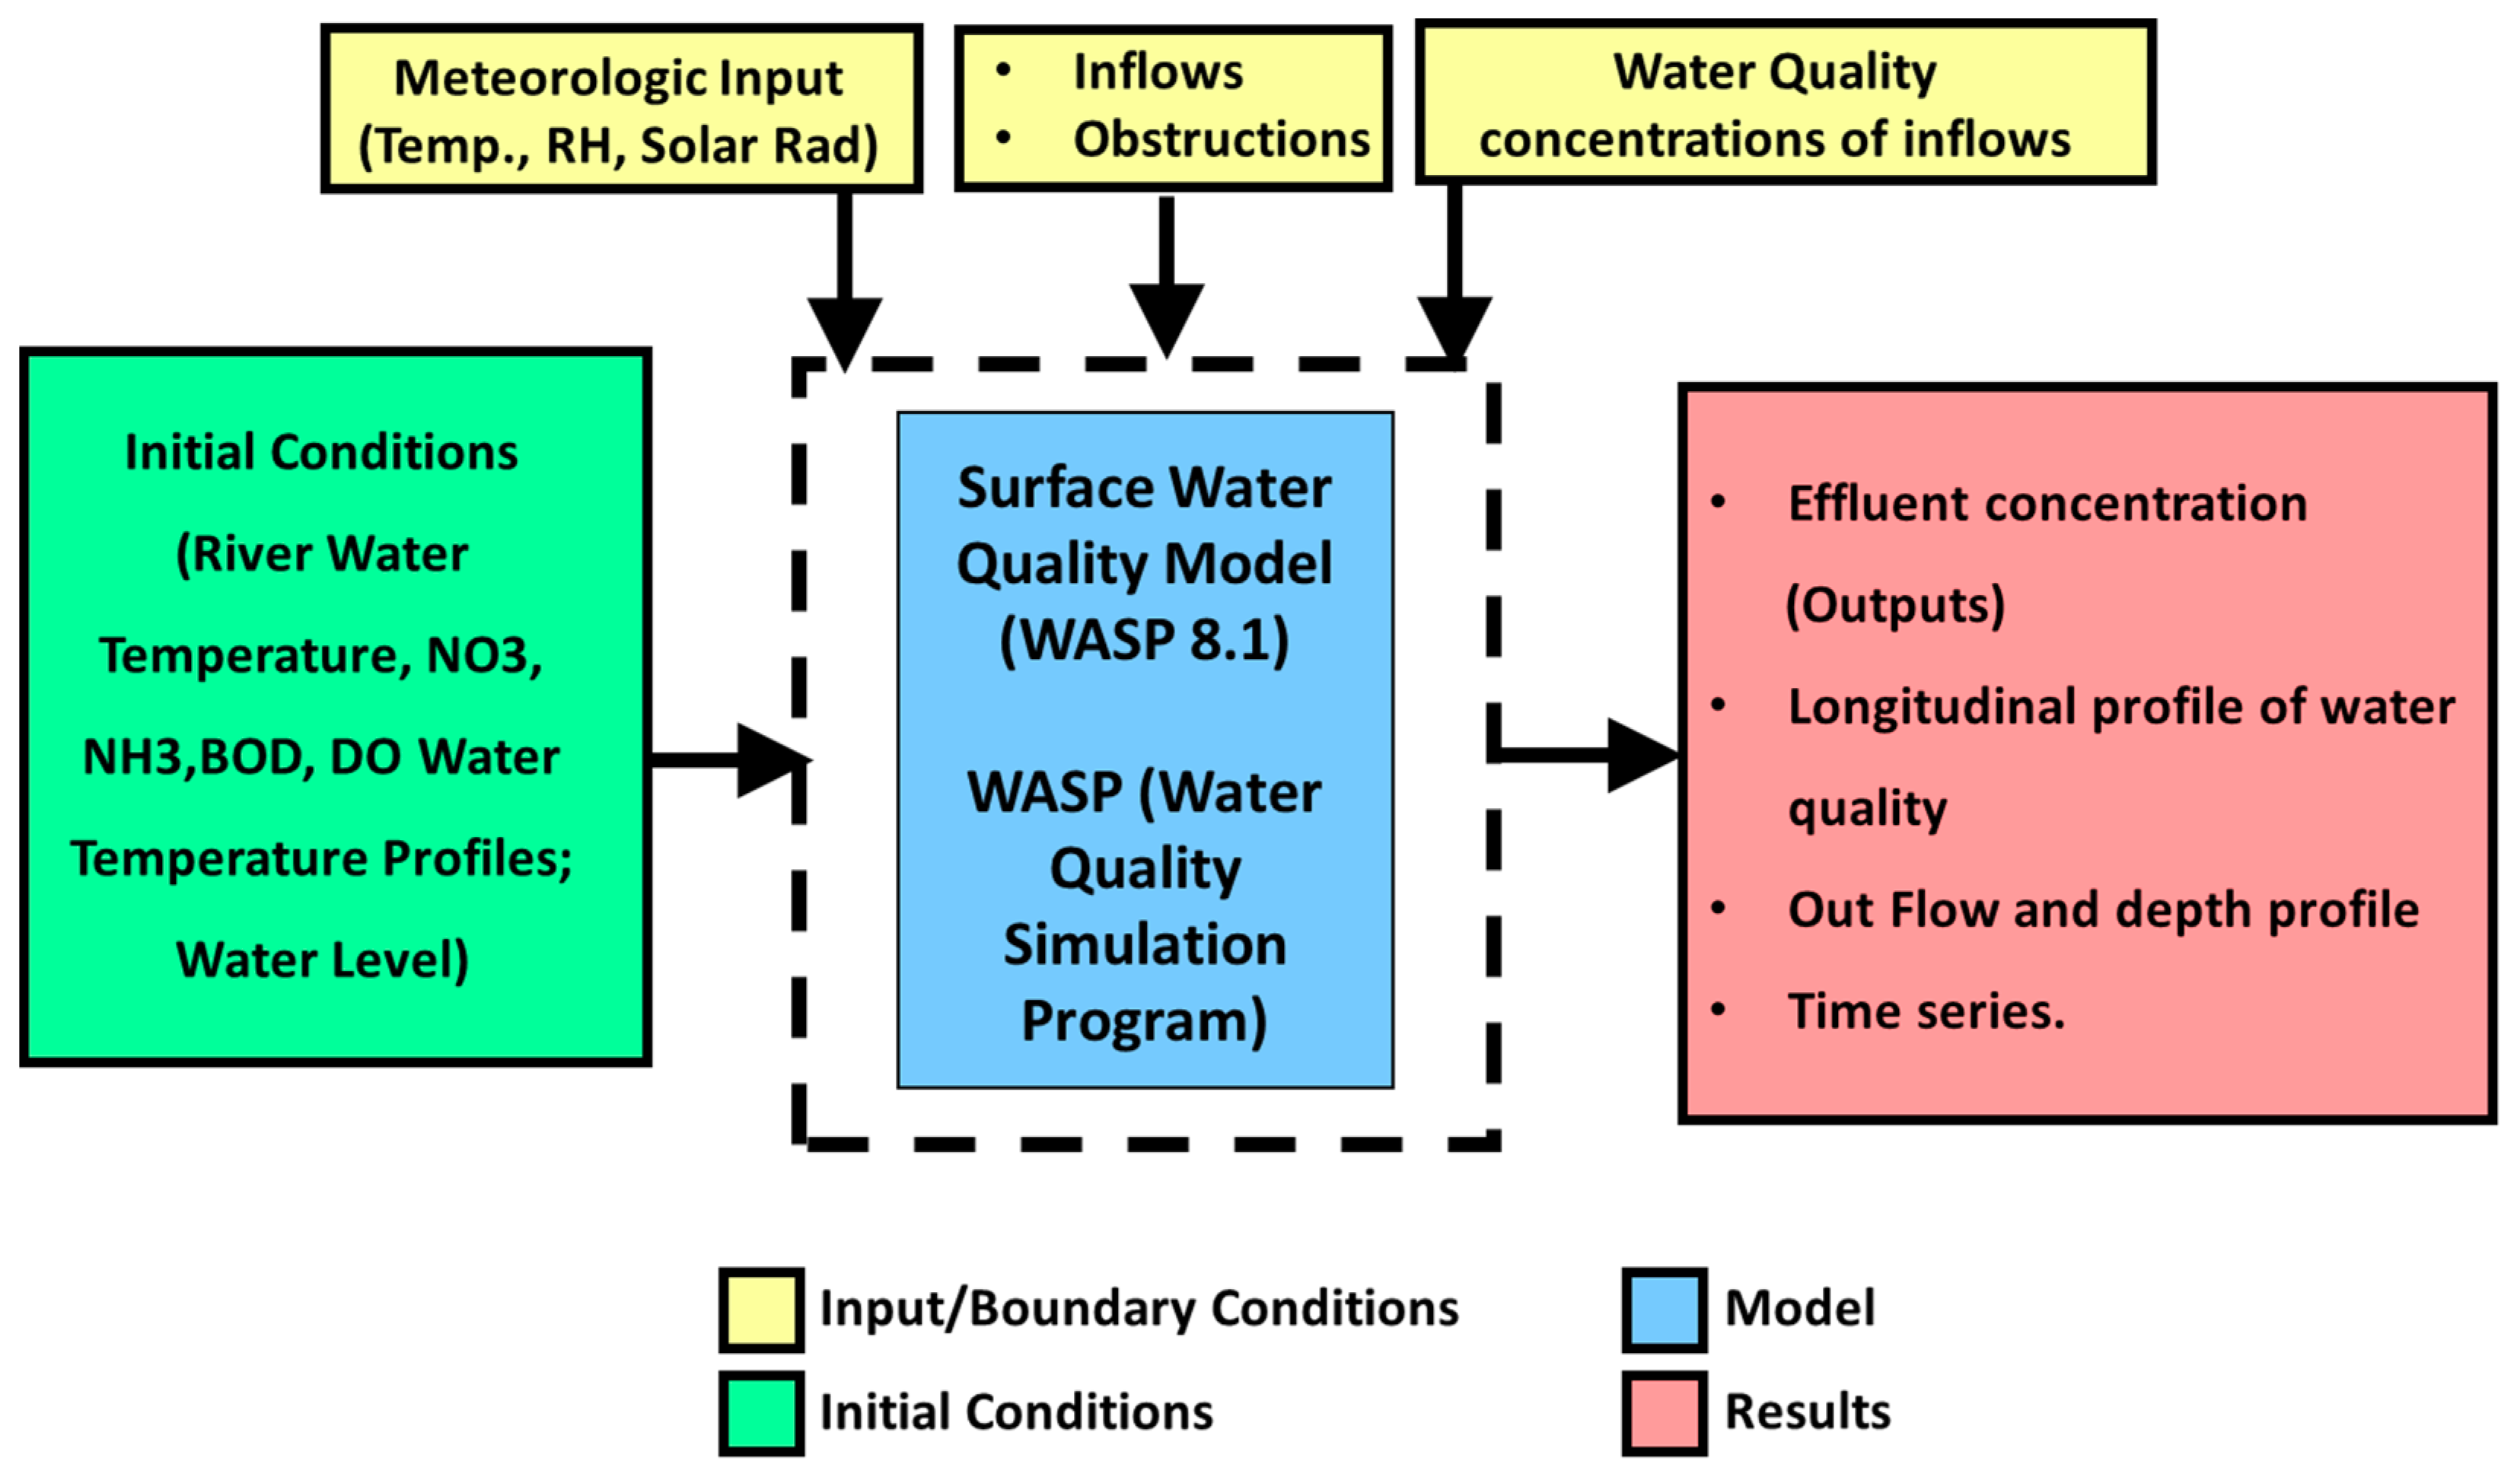
2.4.3. Input Data and Model Outputs
2.5. Scenario Development for Pollution-Concentration Control
2.6. Model Application and Calibration
2.7. Model Accuracy Evlauation
3. Results and Discussion
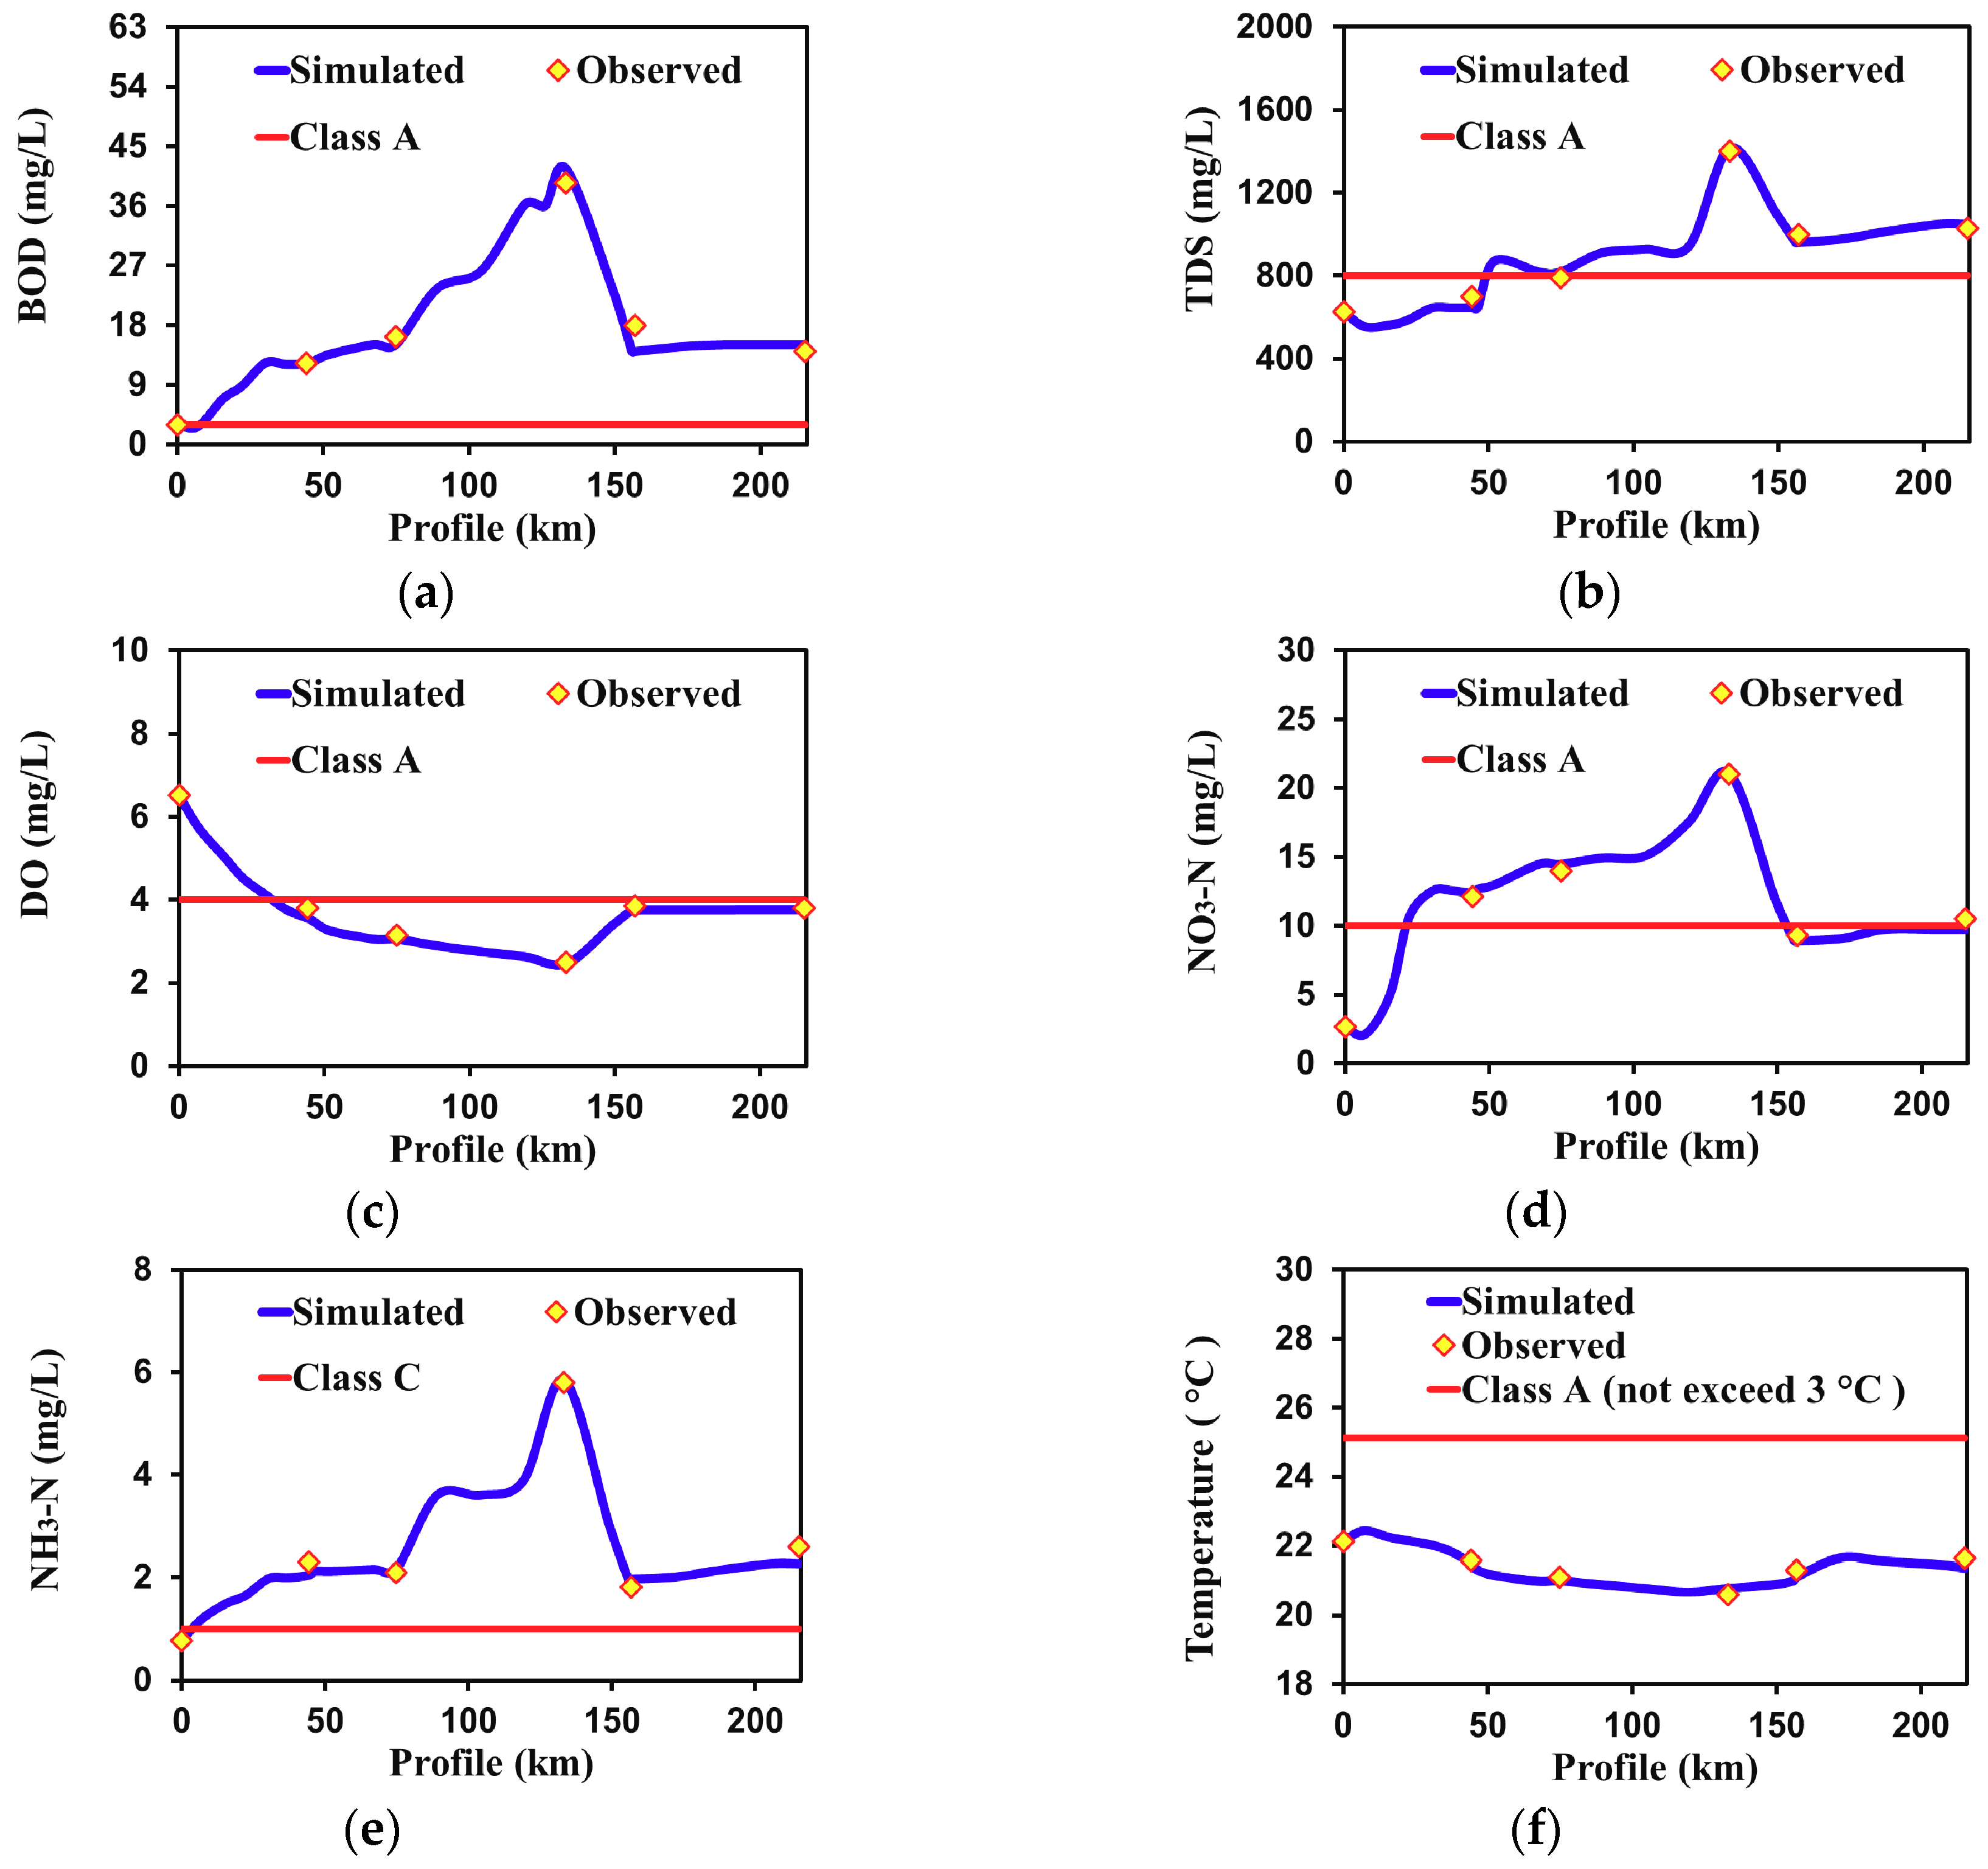
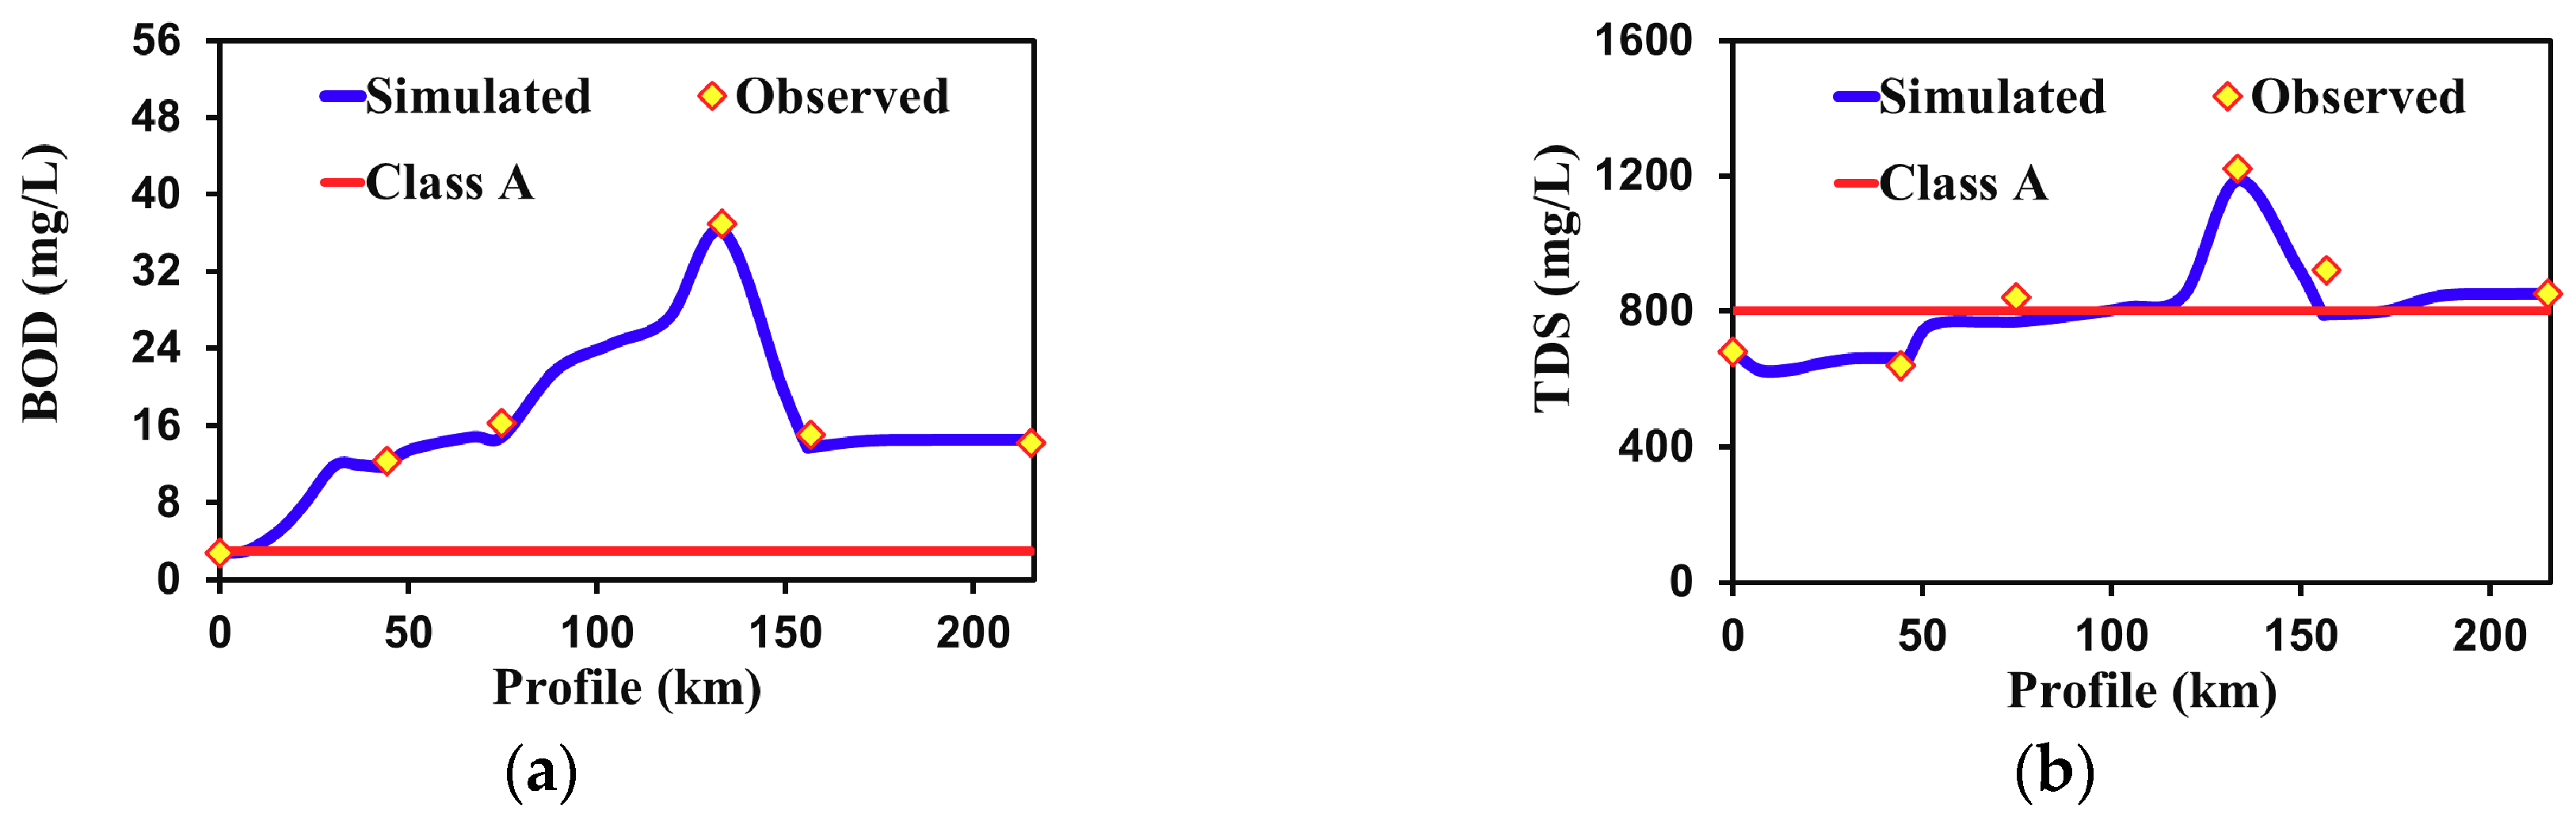
3.1. Model Calibration and Validation
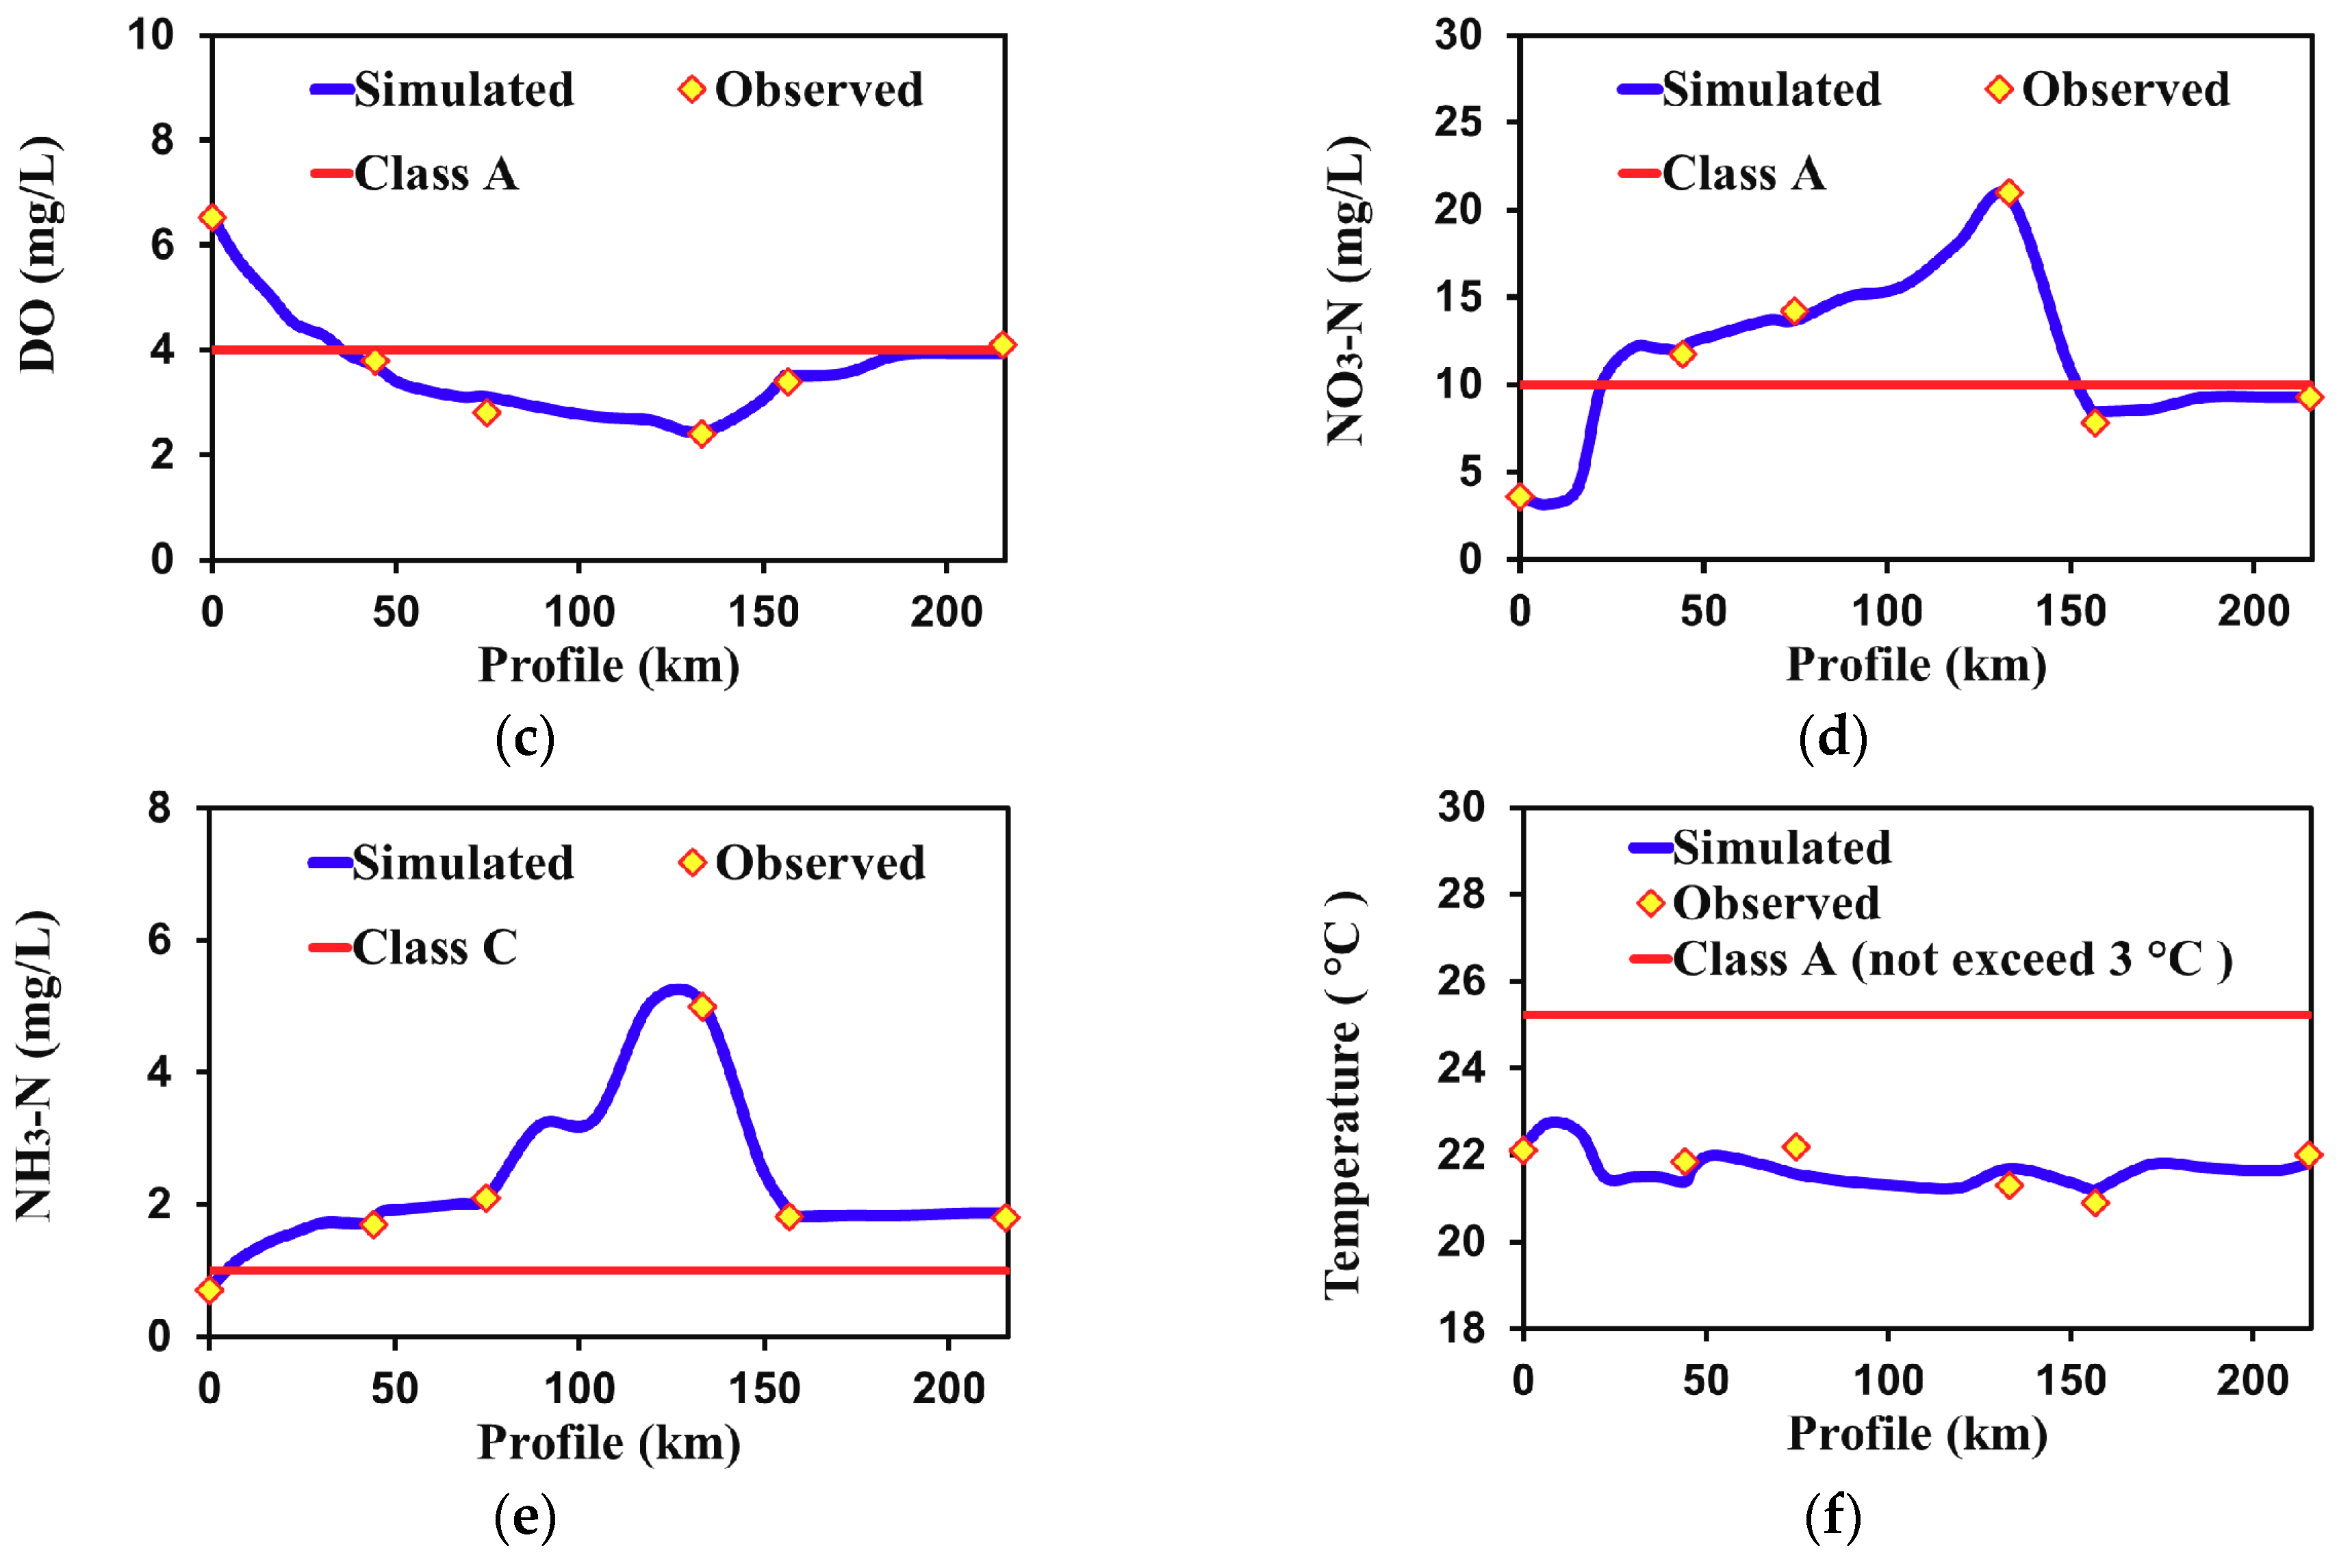
3.2. Strategies to Control Pollution Concentration
4. Conclusions
Supplementary Materials
Author Contributions
Funding
Acknowledgments
Conflicts of Interest
References
- Bekele, E.; Page, D.; Vanderzalm, J.; Kaksonen, A.; Gonzalez, D. Water recycling via aquifers for sustainable urban water quality management: Current status, challenges and opportunities. Water 2018, 10, 457. [Google Scholar] [CrossRef]
- Galvis, A.; Van der Steen, P.; Gijzen, H. Validation of the three-step strategic approach for improving urban water management and water resource quality improvement. Water 2018, 10, 188. [Google Scholar] [CrossRef]
- Almaarofi, H.; Etemad-Shahidi, A.; Stewart, R.A. Strategic evaluation tool for surface water quality management remedies in drinking water catchments. Water 2017, 9, 738. [Google Scholar] [CrossRef]
- Lee, I.; Hwang, H.; Lee, J.; Yu, N.; Yun, J.; Kim, H. Modelling approach to evaluation of environmental impacts on river water quality: A case study with Galing River, Kuantan, Pahang, Malaysia. Ecol. Model. 2017, 353, 167–173. [Google Scholar] [CrossRef]
- Jalilov, S.; Kefi, M.; Kumar, P. Sustainable urban water management: Application for integrated assessment in Southeast Asia. Sustainability 2018, 10, 122. [Google Scholar] [CrossRef]
- UN Water. UN-Water Annual Report 2008. Available online: http://www.unwater.org/downloads/annualreport2008.pdf (accessed on 22 May 2018).
- Mishra, B.K.; Regmi, R.K.; Masago, Y.; Fukushi, K.; Kumar, P.; Saraswat, C. Assessment of Bagmati river pollution in Kathmandu Valley: Scenario-based modelling and analysis for sustainable urban development. Sustain. Water Qual. Ecol. 2017, 9, 67–77. [Google Scholar] [CrossRef]
- Wang, Z.; Zou, R.; Zhu, X.; He, B.; Yuan, G.; Zhao, L.; Liu, Y. Predicting lake water quality responses to load reduction: A three-dimensional modelling approach for total maximum daily load. Int. J. Environ. Sci. Technol. 2014, 11, 423–436. [Google Scholar] [CrossRef]
- Rashidi, H.; Ghaffarianhoseini, A.; Ghaffarianhoseini, A.; Nik Sulaiman, N.M.; Tookey, J.; Hashim, N.A. Application of wastewater treatment in sustainable design of green built environments: A review. Renew. Sustain. Energy Rev. 2015, 49, 845–856. [Google Scholar] [CrossRef]
- Srinivas, R.; Singh, A.P. An integrated fuzzy-based advanced eutrophication simulation model to develop the best management scenarios for a river basin. Environ. Sci. Pollut. Res. 2018, 25, 9012–9039. [Google Scholar] [CrossRef] [PubMed]
- Li, K.; He, J.; Li, J.; Guo, Q.; Liang, S.; Li, Y.; Wang, X. Linking water quality with the total pollutant load control management for nitrogen in Jiaozhou Bay, China. Ecol. Indic. 2018, 85, 57–66. [Google Scholar] [CrossRef]
- Bieroza, M.Z.; Heathwaite, A.L.; Bechmann, M.; Kyllmar, K.; Jordan, P. The concentration-discharge slope as a tool for water quality management. Sci. Total Environ. 2018, 630, 738–749. [Google Scholar] [CrossRef] [PubMed]
- Slaughter, A.R.; Hughes, D.A.; Retief, D.C.H.; Mantel, S.K. A management-oriented water quality model for data scarce catchments. Environ. Model. Softw. 2017, 97, 93–111. [Google Scholar] [CrossRef]
- Chen, Y.; Shuai, J.; Zhang, Z.; Shi, P.; Tao, F. Simulating the impact of watershed management for surface water quality protection: A case study on reducing inorganic nitrogen load at a watershed scale. Ecol. Eng. 2014, 62, 61–70. [Google Scholar] [CrossRef]
- Gao, L.; Li, D. A review of hydrological/water-quality models. Front. Agric. Sci. Eng. 2014, 1, 267. [Google Scholar] [CrossRef] [Green Version]
- Nguyen, T.T.; Keupers, I.; Willems, P. Conceptual river water quality model with flexible model structure. Environ. Model. Softw. 2018, 104, 102–117. [Google Scholar] [CrossRef]
- Cox, B.A. A review of currently available in-stream water-quality models and their applicability for simulating dissolved oxygen in lowland rivers. Sci. Total Environ. 2003, 314, 335–377. [Google Scholar] [CrossRef]
- Tsakiris, G.; Alexakis, D. Water quality models: An overview. Eur. Water 2012, 37, 33–46. [Google Scholar]
- Wang, Q.; Li, S.; Jia, P.; Qi, C.; Ding, F. A review of surface water quality models. Sci. World J. 2013, 2013. [Google Scholar] [CrossRef] [PubMed]
- Morley, N.J. Anthropogenic effects of reservoir construction on the parasite fauna of aquatic wildlife. Ecohealth 2007, 4, 374–383. [Google Scholar] [CrossRef]
- Wang, Y.; Hua, Z.; Wang, L. Parameter estimation of water quality models using an improved multi-objective particle swarm optimization. Water 2018, 10, 32. [Google Scholar] [CrossRef]
- Yan, Z.; Wang, Y.; Wu, D.; Xia, B. Exploration of an urban lake management model to simulate chlorine interference based on the ecological relationships among aquatic species. Sci. Rep. 2018, 8, 8325. [Google Scholar] [CrossRef] [PubMed]
- Zhu, S.; Zhang, Z.; Liu, X. Enhanced two dimensional hydrodynamic and water quality models (CE-QUAL-W2) for simulating mercury transport and cycling in water bodies. Water 2017, 9, 643. [Google Scholar] [CrossRef]
- Kannel, P.R.; Kanel, S.R.; Lee, S.; Lee, Y.S.; Gan, T.Y. A review of public domain water quality models for simulating dissolved oxygen in rivers and streams. Environ. Model. Assess. 2011, 16, 183–204. [Google Scholar] [CrossRef]
- Ambrose, R.B.; Wool, T.A. WASP8 Stream Transport—Model Theory and User’s Guide Supplement to Water Quality Analysis Simulation Program (WASP) User Documentation; United Sates Environmental Protection Agency: Athens, GA, USA, 2017.
- Ambrose, R.B.; Wool, T.A.; Martin, J.L. The Water Quality Analysis Simulation Program, WASP5 Part A: Development Protection Agency; United States Environmental Protection Agency: Athens, GA, USA, 1993.
- Akomeah, E.; Chun, K.P.; Lindenschmidt, K.E. Dynamic water quality modelling and uncertainty analysis of phytoplankton and nutrient cycles for the upper South Saskatchewan River. Environ. Sci. Pollut. Res. 2015, 22, 18239–18251. [Google Scholar] [CrossRef] [PubMed]
- Yang, C.P.; Lung, W.S.; Kuo, J.T.; Lai, J.S.; Wang, Y.M.; Hsu, C.H. Using an integrated model to track the fate and transport of suspended solids and heavy metals in the tidal wetlands. Int. J. Sediment Res. 2012, 27, 201–212. [Google Scholar] [CrossRef]
- Yang, C.; Kuo, J.; Lung, W.; Lai, J.; Wu, J. Water quality and ecosystem modelling of tidal wetlands. J. Environ. Eng. 2007, 133, 711–721. [Google Scholar] [CrossRef]
- Yao, H.; Qian, X.; Yin, H.; Gao, H.; Wang, Y. Regional risk assessment for point source pollution based on a water quality model of the taipu river, China. Risk Anal. 2015, 35, 265–277. [Google Scholar] [CrossRef] [PubMed]
- Wang, X.; Jia, J.; Su, T.; Zhao, Z.; Xu, J.; Wang, L. A fusion water quality soft-sensing method based on WASP model and its application in water eutrophication evaluation. J. Chem. 2018, 2018. [Google Scholar] [CrossRef]
- Tang, P.; Huang, Y.; Kuo, W.; Chen, S. Variations of model performance between QUAL2K and WASP on a river with high ammonia and organic matters. Desalin. Water Treat. 2014, 52, 1193–1201. [Google Scholar] [CrossRef]
- Lei, K.; Zhou, G.; Guo, F.; Khu, S.T.; Mao, G.; Peng, J.; Liu, Q. Simulation–optimization method based on rationality evaluation for waste load allocation in Daliao river. Environ. Earth Sci. 2015, 73, 5193–5209. [Google Scholar] [CrossRef]
- Pakistan Bureau of Statistics. Provisional Summary Results of 6th Population and Housing Census 2017. Islamabad. Available online: http://www.pbscensus.gov.pk/ (accessed on 24 May 2018).
- Punjab Bureau of Statistics. Punjab Development Statistics 2017. Lahore. Available online: http://www.bos.gop.pk/publicationreports (accessed on 24 May 2018).
- Rana, I.A.; Bhatti, S.S. Lahore, Pakistan—Urbanization challenges and opportunities. Cities 2018, 72, 348–355. [Google Scholar] [CrossRef]
- Syed, J.H.; Malik, R.N.; Li, J.; Chaemfa, C.; Zhang, G.; Jones, K.C. Status, distribution and ecological risk of organochlorines (OCs) in the surface sediments from the Ravi River, Pakistan. Sci. Total Environ. 2014, 472, 204–211. [Google Scholar] [CrossRef] [PubMed]
- Bilal, C.Q.; Khan, M.S.; Avais, M.; Ijaz, M.; Khan, J.A. Prevalence and chemotherapy of Balantidium coli in cattle in the River Ravi region, Lahore (Pakistan). Vet. Parasitol. 2009, 163, 15–17. [Google Scholar] [CrossRef] [PubMed]
- Baqar, M.; Sadef, Y.; Ahmad, S.R.; Mahmood, A.; Li, J.; Zhang, G. Organochlorine pesticides across the tributaries of River Ravi, Pakistan: Human health risk assessment through dermal exposure, ecological risks, source fingerprints and spatio-temporal distribution. Sci. Total Environ. 2018, 618, 291–305. [Google Scholar] [CrossRef] [PubMed]
- Pakistan Water Gateway. Ravi River Key Facts. 2017. Available online: http://www.waterinfo.net.pk/ (accessed on 18 July 2018).
- Gauging Station Data Summary ORNL; DAAC. Ravi Ravi discharge at Mukesar. 2016. Available online: https://daac.ornl.gov/ (accessed on 24 May 2018).
- JICA (Japan International Cooperation Agency). The Preparatory Study on Lahore Water Supply, Sewerage and Drainage Improvement Project in Islamic Republic of Pakistan, Interim Report, WASA-LDA, Lahore. 2009. Available online: http://open_jicareport.jica.go.jp/ (accessed on 18 July 2018).
- Mahfooz, Y.; Yasar, A.; Bari Tabinda, A.; Sohail, M.T.; Siddiqua, A.; Mahmood, S. Quantification of the River Ravi pollution load and oxidation pond treatment to improve the drain water quality. Desalin. Water Treat. 2017, 85, 132–137. [Google Scholar] [CrossRef]
- Haider, H.; Ali, W. Evaluation of water quality management alternatives to control dissolved oxygen and un-ionized ammonia for Ravi River in Pakistan. Environ. Model. Assess. 2013, 18, 451–469. [Google Scholar] [CrossRef]
- Environment Protection Department. Environmental Monitoring of River Ravi EPA Laboratory December, 2009. 2010. Available online: https://www.epd.punjab.gov.pk/Reports (accessed on 16 May 2018).
- Franceschini, S.; Tsai, C.W. Assessment of uncertainty sources in water quality modelling in the Niagara River. Adv. Water Resour. 2010, 33, 493–503. [Google Scholar] [CrossRef]
- Tufford, D.L.; McKellar, H.N. Spatial and temporal hydrodynamic and water quality Modelling analysis of a large reservoir on the South Carolina (USA) coastal plain. Ecol. Model. 1999, 114, 137–173. [Google Scholar] [CrossRef]
- Vuksanovic, V.; De Smedt, F.; Van Meerbeeck, S. Transport of polychlorinated biphenyls (PCB) in the Scheldt Estuary simulated with the water quality model WASP. J. Hydrol. 1996, 174, 1–18. [Google Scholar] [CrossRef]
- Ji, Z.G. Hydrodynamics and Water Quality Modeling Rivers, Lakes, and Estuaries; John Wiley and Sons, Inc.: Hoboken, NJ, USA, 2009; ISBN 9780470135433. [Google Scholar]
- Wescoat, J.L.; Siddiqi, A.; Muhammad, A. Socio-hydrology of channel flows in complex river basins: Rivers, canals, and distributaries in Punjab, Pakistan. Water Resour. Res. 2018, 54, 464–479. [Google Scholar] [CrossRef]
- Acreman, M.C.; Dunbar, M.J. Defining environmental river flow requirements—A review. Hydrol. Earth Syst. Sci. 2004, 8, 861–876. [Google Scholar] [CrossRef]
- Aguilar, C.; Polo, M.J. Assessing minimum environmental flows in nonpermanent rivers: The choice of thresholds. Environ. Model. Softw. 2016, 79, 120–134. [Google Scholar] [CrossRef]
- Kiwango, H.; Njau, K.N.; Wolanski, E. The need to enforce minimum environmental flow requirements in Tanzania to preserve estuaries: Case study of mangrove-fringed Wami River estuary. Ecohydrol. Hydrobiol. 2015, 15, 171–181. [Google Scholar] [CrossRef]
- Nikghalb, S.; Shokoohi, A.; Singh, V.P.; Yu, R. Ecological Regime versus minimum environmental flow: Comparison of results for a River in a Semi Mediterranean Region. Water Resour. Manag. 2016, 30, 4969–4984. [Google Scholar] [CrossRef]
- Allen, J.I.; Holt, J.T.; Blackford, J.; Proctor, R. Error quantification of a high-resolution coupled hydrodynamic-ecosystem coastal-ocean model: Part 2. Chlorophyll-a, nutrients and SPM. J. Mar. Syst. 2007, 68, 381–404. [Google Scholar] [CrossRef]
- Bae, S.; Seo, D. Analysis and modelling of algal blooms in the Nakdong River, Korea. Ecol. Model. 2018, 372, 53–63. [Google Scholar] [CrossRef]
- Moriasi, D.N.; Arnold, J.G.; Van Liew, M.W.; Bingner, R.L.; Harmel, R.D.; Veith, T.L. Model evaluation guidelines for systematic quantification of accuracy in watershed simulations. Trans. ASABE 2007, 50, 885–900. [Google Scholar] [CrossRef]
- Lewis, K.; Allen, J.I.; Richardson, A.J.; Holt J, T. Error quantification of a high-resolution coupled hydrodynamic ecosystem coastal ocean model: Part 3. Validation with CPR data. J. Mar. Syst. 2006, 63, 209–244. [Google Scholar] [CrossRef]
- Nash, J.E.; Sutcliffe, J.V. River flow forecasting through conceptual models part I—A discussion of principles. J. Hydrol. 1970, 10, 282–290. [Google Scholar] [CrossRef]
- Ostojski, M.S.; Gebala, J.; Orlińska-Woźniak, P.; Wilk, P. Implementation of robust statistics in the calibration, verification and validation step of model evaluation to better reflect processes concerning total phosphorus load occurring in the catchment. Ecol. Model. 2016, 332, 83–93. [Google Scholar] [CrossRef]
- Ministry of Climate Change. National surface water quality guidelines for Pakistan. 2007. Available online: http://www.mocc.gov.pk (accessed on 25 April 2018).
- Kannel, P.R.; Lee, S.; Lee, Y.S.; Kanel, S.R.; Pelletier, G.J.; Kim, H. Application of automated QUAL2Kw for water quality Modelling and management in the Bagmati River, Nepal. Ecol. Model. 2007, 202, 503–517. [Google Scholar] [CrossRef]
- Campolo, M.; Andreussi, P.; Soldati, A. Water quality control in the river Arno. Water Res. 2002, 36, 2673–2680. [Google Scholar] [CrossRef]
- Lakshminarasimman, N.; Quiñones, O.; Vanderford, B.J.; Campo-Moreno, P.; Dickenson, E.V.; McAvoy, D.C. Biotransformation and sorption of trace organic compounds in biological nutrient removal treatment systems. Sci. Total Environ. 2018, 640, 62–72. [Google Scholar] [CrossRef] [PubMed]
- Ogunlaja, O.O.; Parker, W.J. Assessment of the removal of estrogenicity in biological nutrient removal wastewater treatment processes. Sci. Total Environ. 2015, 514, 202–210. [Google Scholar] [CrossRef] [PubMed]
- Estrada-Arriaga, E.B.; Cortés-Muñoz, J.E.; González-Herrera, A.; Calderón-Mólgora, C.G.; de Lourdes Rivera-Huerta, M.; Ramírez-Camperos, E.; Montellano-Palacios, L.; Gelover-Santiago, S.L.; Pérez-Castrejón, S.; Cardoso-Vigueros, L.; et al. Assessment of full-scale biological nutrient removal systems upgraded with physico-chemical processes for the removal of emerging pollutants present in wastewaters from Mexico. Sci. Total Environ. 2016, 571, 1172–1182. [Google Scholar] [CrossRef] [PubMed]
- Dos Santos Pereira, M.; Borges, A.C.; Heleno, F.F.; Squillace, L.F.A.; Faroni, L.R.D. Treatment of synthetic milk industry wastewater using batch dissolved air flotation. J. Clean. Prod. 2018, 189, 729–737. [Google Scholar] [CrossRef]
- Fonseca, R.R.; Thompson, J.P.; Franco, I.C.; da Silva, F.V. Automation and Control of a Dissolved Air Flotation Pilot Plant. IFAC-Pap. Online 2017, 50, 3911–3916. [Google Scholar] [CrossRef]
- Rodrigues, J.P.; Béttega, R. Evaluation of multiphase CFD models for Dissolved Air Flotation (DAF) process. Coll. Surf. Physicochem. Eng. Asp. 2018, 539, 116–123. [Google Scholar] [CrossRef]
- Kokabian, B.; Gude, V.G.; Smith, R.; Brooks, J.P. Evaluation of anammox biocathode in microbial desalination and wastewater treatment. Chem. Eng. J. 2018, 342, 410–419. [Google Scholar] [CrossRef]
- Khandegar, V.; Acharya, S.; Jain, A.K. Data on treatment of sewage wastewater by electrocoagulation using punched aluminum electrode and characterization of generated sludge. Data Br. 2018, 18, 1229–1238. [Google Scholar] [CrossRef] [PubMed]


| Type | Stations Name | km | Locations |
|---|---|---|---|
| Main River | Miroo Wal (M1) | 0.00 | Meroo Wal, Ravi River before confluence with M.R. Link Canal |
| Railway Bridge (M2) | 44.27 | Upstream of Forest Colony Pumping Station, Railway Bridge | |
| Sughyan Bridge (M3) | 74.84 | Downstream of Bhuda Ravi Drain, Sughyan Bridge | |
| Darbar Bridge (M4) | 133.78 | Downstream of Hudaira Drain, Darbar Syed Imam Ali | |
| Karianwala (M5) | 156.81 | Downstream of Qadrabad Balloki Link Canal, Karianwala | |
| Moza Malayka (M6) | 215.21 | Downstream of Sukhwara Drian, Moza Malayka | |
| Drains | Mehmood Booti Drain (D1) | 15.60 | M.B.D. before confluence with River, near Ring Road |
| Sukh Naher Drain (D2) | 22.13 | S.N.D. before confluence with Ravi River, near Bund Road | |
| Shad Bagh Drain (D3) | 30.30 | S.B.D. before confluence with Ravi River, near Ravi Interchange | |
| Shahdara Town Pumping Station (D4) | 37.08 | S.T.P.S. before confluence with Ravi River, near Shahdara Town Lahore | |
| Forest Colony Pumping Station (D5) | 46.27 | F.C.P.S. before confluence with River Ravi, near Old Bridge Ravi River Lahore | |
| Farukhabad Drain (D6) | 52.12 | Farukhabad Drain before confluence with Ravi river Lahore | |
| Budha Ravi Drain (D7) | 67.20 | B. R. D. before confluence with Ravi River near Munshi Hospital | |
| Main Outfall Drain (D8) | 89.00 | M.O.F.D. before confluence with Ravi River, near Sughyan Lahore | |
| Gulshan-E-Ravi Drain (D9) | 104.21 | G.E.R.D before confluence with Ravi River, near Sanda Bhatiyan | |
| Babu Sabu Drain (D10) | 119.21 | B.S.D. before confluence with Ravi River, near Babu Sabu Tool Plaza | |
| Hudiara Drain (D11) | 133.26 | H.D. before confluence with Ravi River, near Syed Imam Ali Shah Darbar, Lahore | |
| Jaranwala Drain/Deg II/Deg Nullah (D12) | 172.21 | J.D. before confluence into Ravi River, Jhamrey, Moza Malang | |
| Samundari Drain (D13) | 186.78 | S.D. before confluence into Ravi River, Bulley Shah, Mamum Kajan, Faisalabad | |
| Sukhwara Drain (D14) | 205.21 | S.D. before confluence with Ravi River, Chak Bandyan, Sahiwal | |
| Link Canals | Marala Ravi Link Canal (C1) | 7.078 | M.R.Link Canal before confluence with Ravi River, near Bryar Kohna |
| Upper Chenab Canal (C2) | 149.02 | U.C.C. Link Canal before confluence with Ravi River, near Sharqpur, Kot mehmmod, Lahore | |
| Qadrabad Balloki Link Canal (C3) | 155.82 | Q.B. Link Canal before confluence with Ravi River, near Karianwla, Lahore |
| Scenario | Explanation |
|---|---|
| S1 | Headwater-flow increase 50% |
| S2 | Link canal-flow increase 50% |
| S3 | Headwater plus link canal-flow increase 50% |
| S4 | Treatment facilities of drain water |
| S5 | Combination of scenarios 1 and 4 |
| S6 | Combination of scenarios 2 and 4 |
| S7 | Combination of scenarios 1, 2 and 4 1 |
| Parameter | Unit | Units |
|---|---|---|
| Advection factor for solution | 0.5 | |
| Maximum mass check swing during DT (Time Step) | 0.01 | |
| Maximum temperature swing during DT | 0.05 | °C |
| Maximum dissolve oxygen swing during DT | 0.6 | mg/L |
| Maximum fraction NH3 added by diagenesis flux during DT | 0.5 | |
| Maximum fraction TIC swing during DT | 0.01 | |
| Fresh water = 0, Marine Water = 1 | 0 | |
| CO2 partial pressure | 0.1 | atm |
| Ks Option | 1.5 | |
| Heat exchange option (0 = full heat balance, 1 = equilibrium temperature) | 0 | |
| Coefficient of bottom heat exchange | 1.07 | Wm−2 °C−1 |
| Sediment (ground) temperature | 13 | °C |
| Ice switch | 0 | |
| Initial ice thickness | 0 | m |
| Temperature above which ice formation is not allowed | 1 | °C |
| Temperature coefficient of nitrification | 1.07 | |
| Water-to-ice heat exchange coefficient | 10 | Wm−2 °C−1 |
| Least temperature required for nitrification reaction | 3 | °C |
| Rate constant of nitrification at 20 °C | 0.122 | /day |
| Half-saturation constant for denitrification oxygen limit | 0.0001 | mg O2/L |
| Half-saturation constant of nitrification oxygen limit | 0.0001 | mg O2/L |
| Detritus dissolution to BOD fraction | 0.0001 | |
| BOD carbon source fraction of for denitrification | 0.000001 | |
| Rate constant for denitrification at 20 °C | 0.02 | /day |
| Temperature coefficient of denitrification | 1.03 | |
| Rate constant for BOD decay at 20 °C | 0.01 | /day |
| Temperature correction coefficient for BOD decay rate | 1.07 | |
| Water body option for surrounding wind reaeration rate | 0 | |
| Reaeration option (0 = Covar, 1 = O’Connor, 2 = Owens, 3 = Churchill) | 2 | |
| Light extinction multiplier | 0.12 | 1/m |
| Light extinction multiplier for detritus and solids | 0.12 | 1/m/(mg/L) |
| Half-saturation oxygen limit of BOD | 0.01 | mg O2/L |
| light extinction multiplier for DOC | 0.014 | 1/m/(mg/L) |
| Reaeration option | 0.021 | |
| Minimum reaeration rate | 0 | 1/day |
| Temperature correction for Theta-reaeration | 1.028 | |
| Stoichiometric ratio of oxygen to carbon | 2.668 | |
| Global reaeration rate constant at 20 °C | 0.1 | /day |
| Elevation above sea level used for DO saturation | 0 | m |
| Parameters | Class AA 1 | Class A 2 | Class B 3 | Class C 4 | Class D 5 |
|---|---|---|---|---|---|
| Total Dissolved Solids (TDS) | 800 | 800 | 1000 | 1000 | 1000 |
| Temperature | The maximum water-temperature change shall not exceed 3 °C relative to an upstream control point | ||||
| pH | 6.5–8.5 | 6.5–8.5 | 6.5–8.5 | 6.5–8.5 | 6.5–8.4 |
| BOD | 2 | 3 | 8 | 8 | 8 |
| DO | >6 | >4 | 4 | >5 | >4 |
| NO3 (as N) | 10 | 10 | - | - | - |
| NH3 (as N) | - | - | - | 1 | 1 |
| Param 1 | Mean Absolute Error (MAE) | Normalized Root Mean Square Error (NRMSE) | Mean Absolute Percentage Error (MAPE) | Percentage Model Bias (PMB) | Coefficient of Determination (R2) | |||||
|---|---|---|---|---|---|---|---|---|---|---|
| Calibration | Validation | Calibration | Validation | Calibration | Validation | Calibration | Validation | Calibration | Validation | |
| TDS | 26.47 | 32.45 | 0.004 | 0.004 | 0.03 | 0.04 | 0.48 | 0.32 | 0.92 | 0.94 |
| NH3-N | 0.24 | 0.07 | 1.58 | 1.66 | 0.08 | 0.04 | 3.06 | −1.40 | 0.94 | 0.94 |
| NO3-N | 0.33 | 0.26 | 0.35 | 0.35 | 0.03 | 0.02 | 0.39 | −0.08 | 0.97 | 0.95 |
| BOD | 1.19 | 0.71 | 0.24 | 0.25 | 0.06 | 0.04 | −1.21 | 1.5 | 0.93 | 0.92 |
| DO | 0.08 | 0.12 | 1.05 | 1.08 | 0.02 | 0.06 | 1.99 | −0.61 | 0.96 | 0.97 |
| Temperature | 0.26 | 0.25 | 0.02 | 0.19 | 0.01 | 0.01 | 0.22 | 0.66 | 0.90 | 0.87 |
| Parameter | Distance 1 | S1 | S2 | S3 | S4 | S5 | S6 | S7 |
|---|---|---|---|---|---|---|---|---|
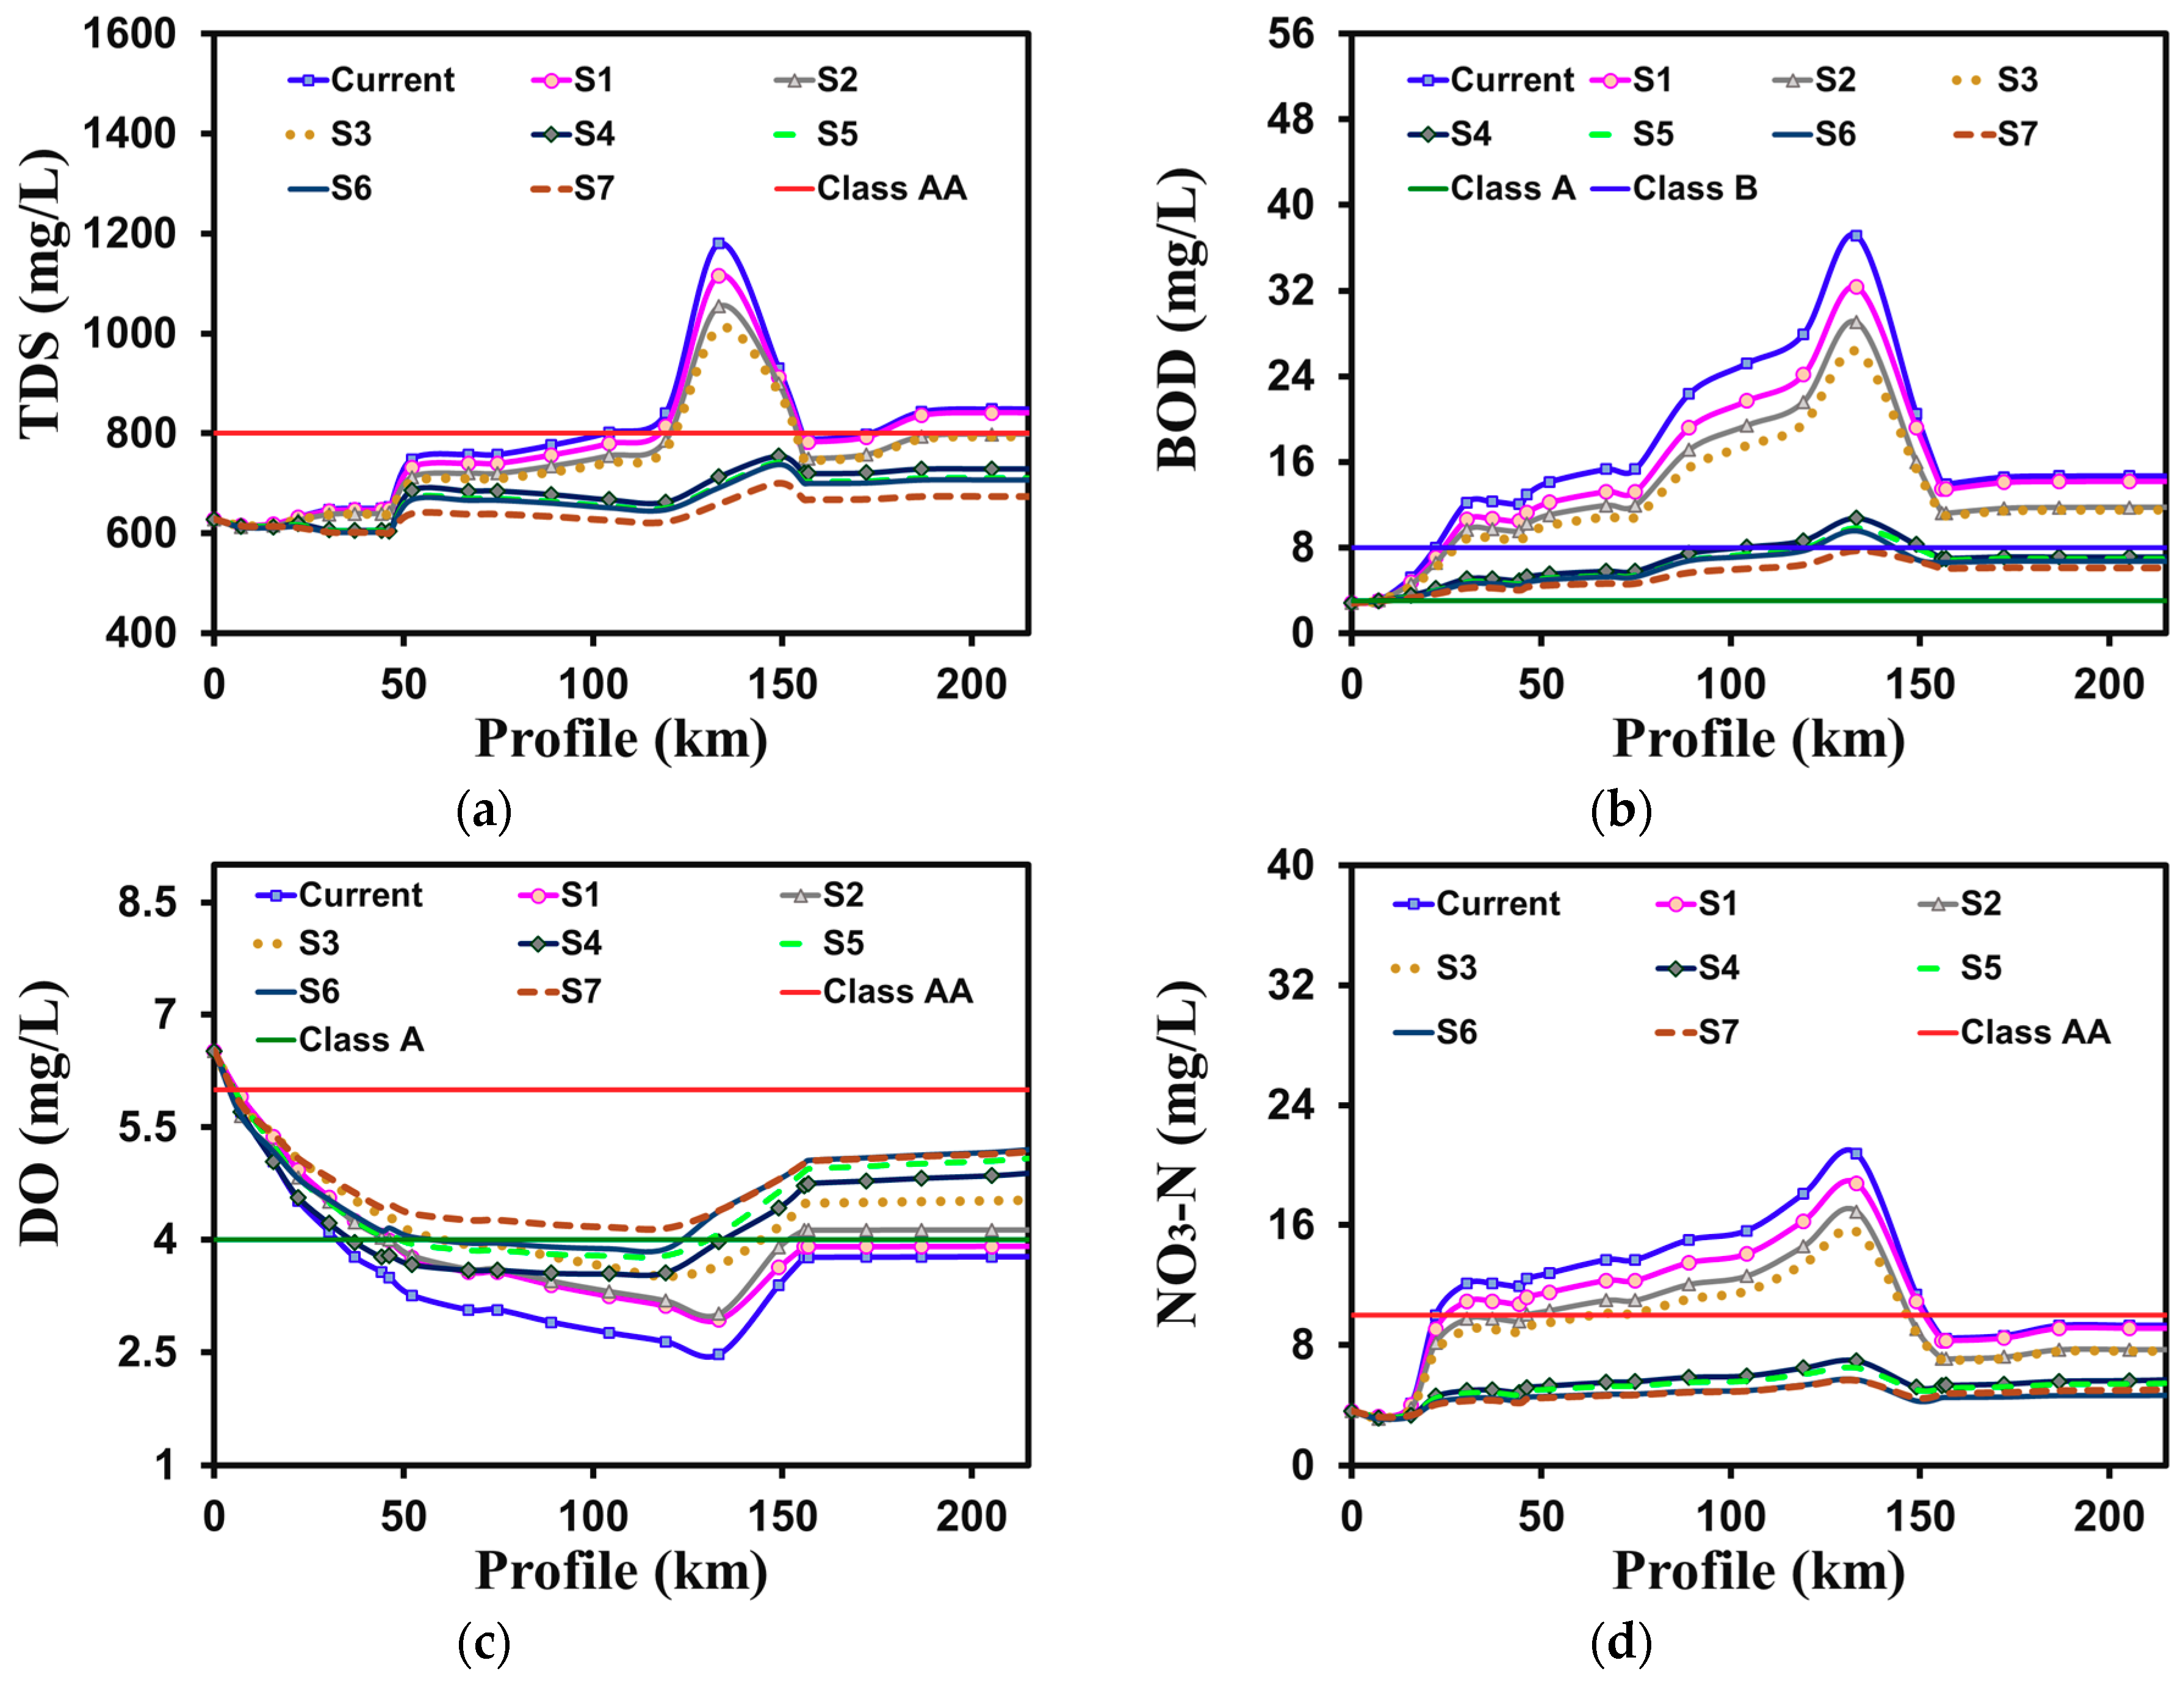
| TDS (mg/L) | 134 km | 5.41% | 10.64% | 14.33% | 39.51% | 41.08% | 41.37% | 44.19% |
| BOD (mg/L) | 134 km | 12.86% | 21.75% | 28.99% | 71.03% | 73.50% | 74.22% | 79.17% |
| DO (mg/L) | 134 km | 18.66% | 21.96% | 48.15% | 60.83% | 65.32% | 77.50% | 77.68% |
| NO3-N (mg/L) | 134 km | 9.57% | 18.55% | 25.11% | 66.54% | 68.75% | 72.62% | 72.82% |
© 2018 by the authors. Licensee MDPI, Basel, Switzerland. This article is an open access article distributed under the terms and conditions of the Creative Commons Attribution (CC BY) license (http://creativecommons.org/licenses/by/4.0/).
Share and Cite
Iqbal, M.M.; Shoaib, M.; Agwanda, P.; Lee, J.L. Modeling Approach for Water-Quality Management to Control Pollution Concentration: A Case Study of Ravi River, Punjab, Pakistan. Water 2018, 10, 1068. https://doi.org/10.3390/w10081068
Iqbal MM, Shoaib M, Agwanda P, Lee JL. Modeling Approach for Water-Quality Management to Control Pollution Concentration: A Case Study of Ravi River, Punjab, Pakistan. Water. 2018; 10(8):1068. https://doi.org/10.3390/w10081068
Chicago/Turabian StyleIqbal, Muhammad Mazhar, Muhammad Shoaib, Paul Agwanda, and Jung Lyul Lee. 2018. "Modeling Approach for Water-Quality Management to Control Pollution Concentration: A Case Study of Ravi River, Punjab, Pakistan" Water 10, no. 8: 1068. https://doi.org/10.3390/w10081068
APA StyleIqbal, M. M., Shoaib, M., Agwanda, P., & Lee, J. L. (2018). Modeling Approach for Water-Quality Management to Control Pollution Concentration: A Case Study of Ravi River, Punjab, Pakistan. Water, 10(8), 1068. https://doi.org/10.3390/w10081068