Vulnerability Assessment of Dam Water Supply Capacity Based on Bivariate Frequency Analysis Using Copula
Abstract
:1. Introduction
2. Theoretical Background
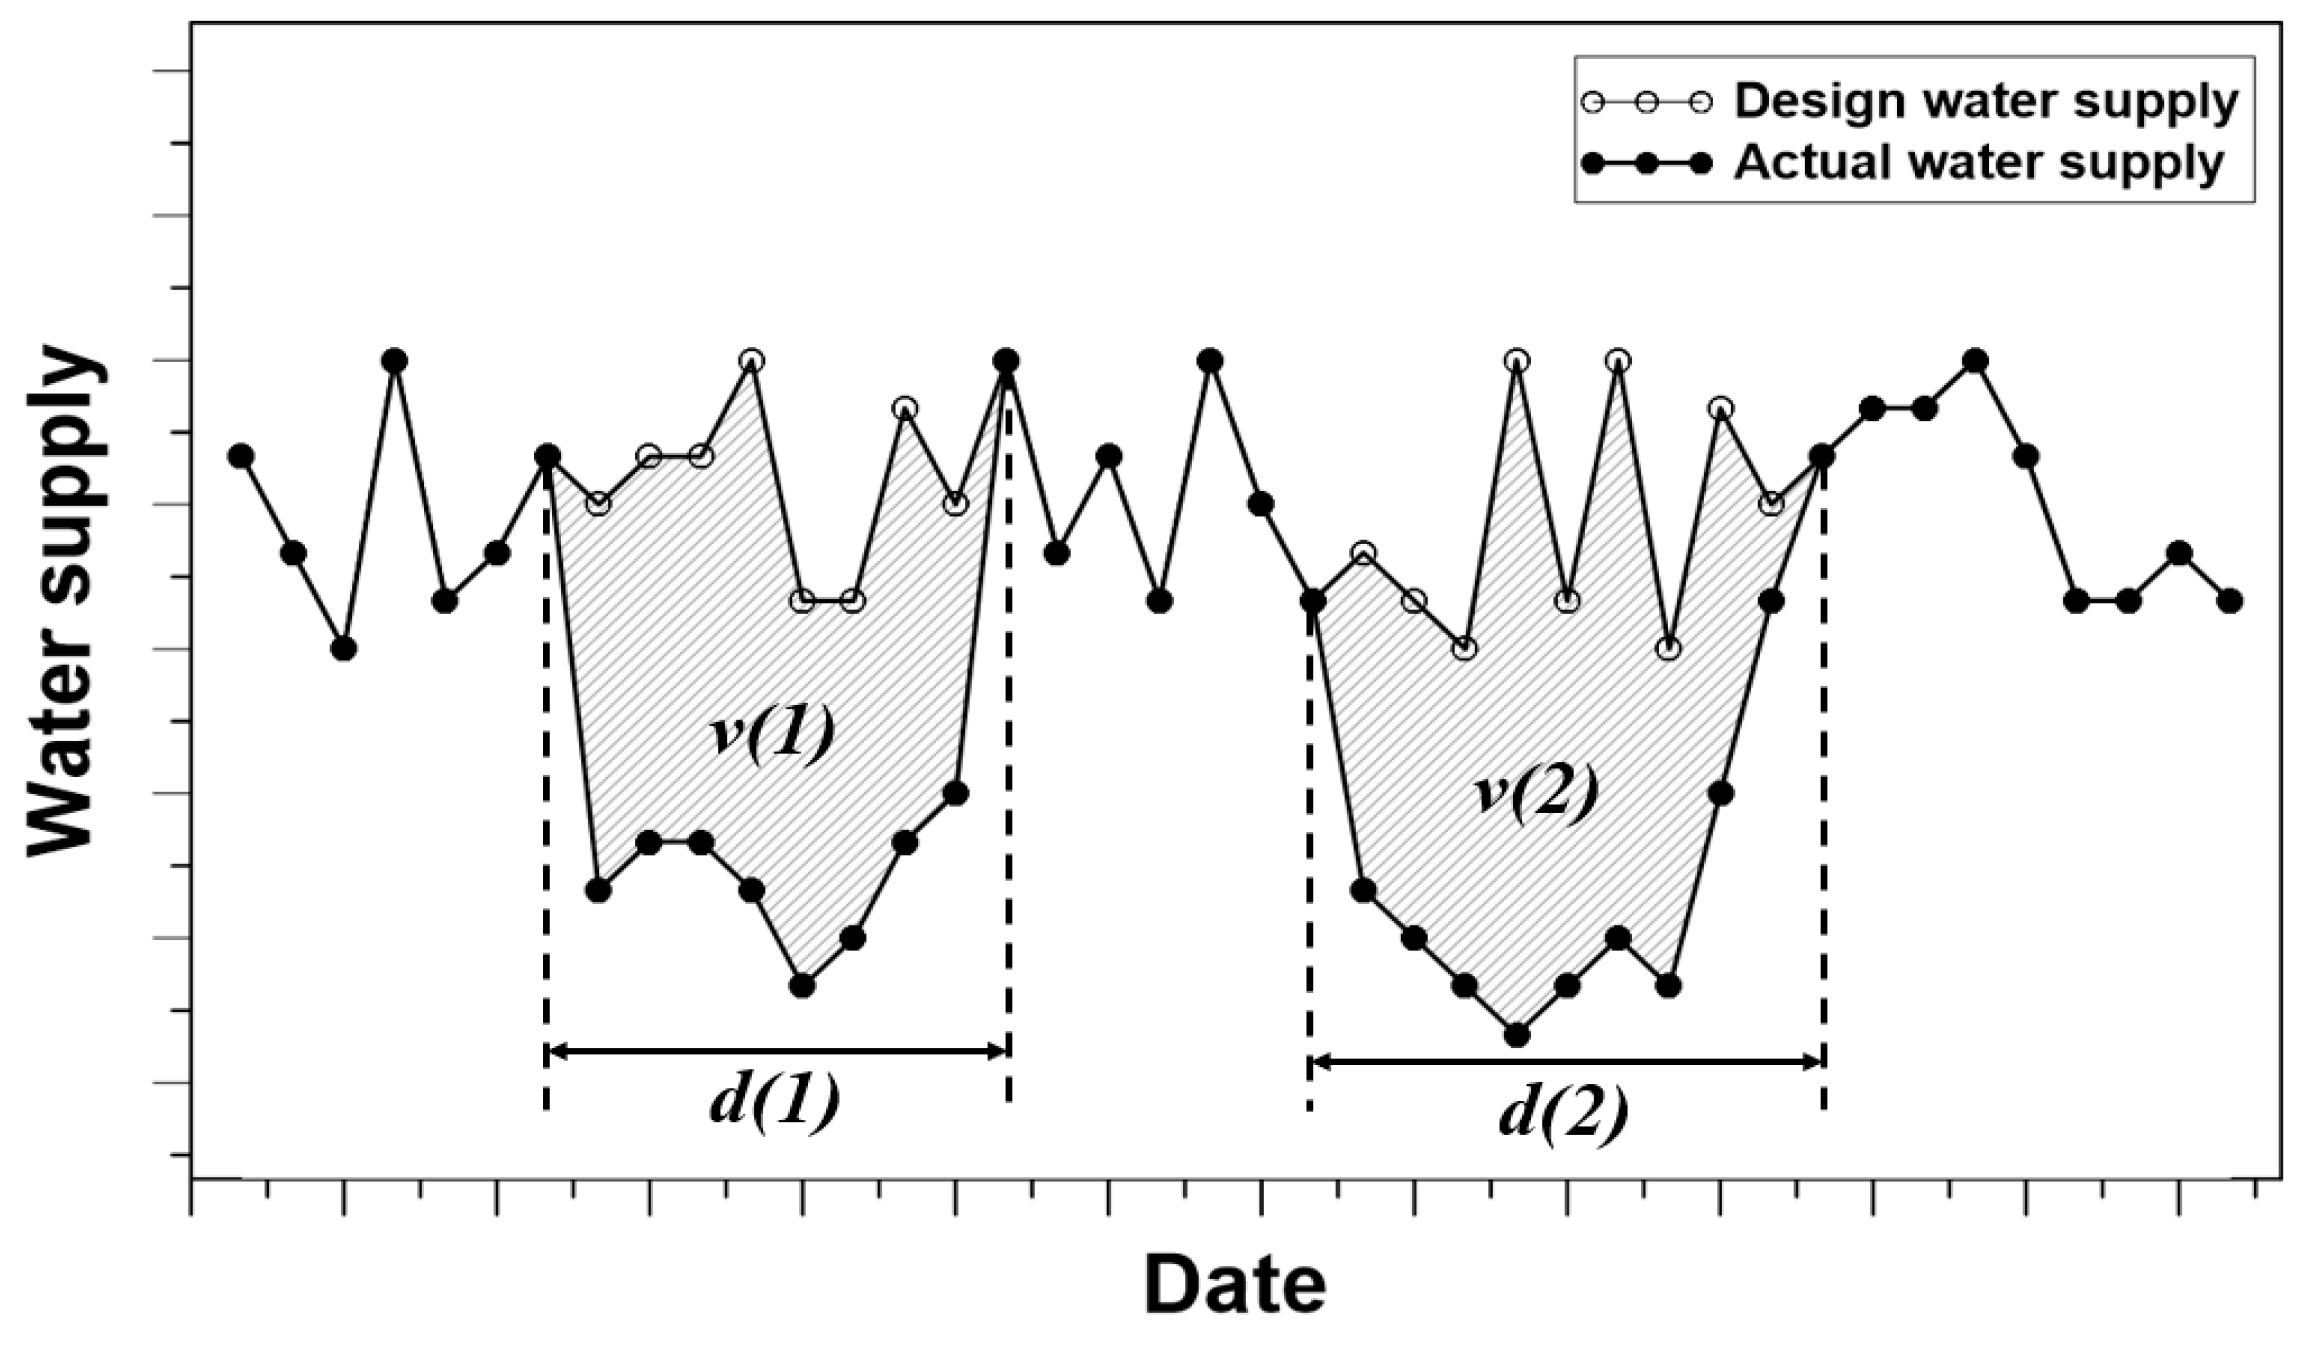
2.1. Risk Assessment Measures for a Water Supply System
2.2. Bivariate Frequency Analysis Using the Copula
2.2.1. Basic Concept of the Copula
2.2.2. Parameter Estimation
2.2.3. Determination of the Optimal Copula Model
2.2.4. Occurrence Probability Calculated by the Copula Model
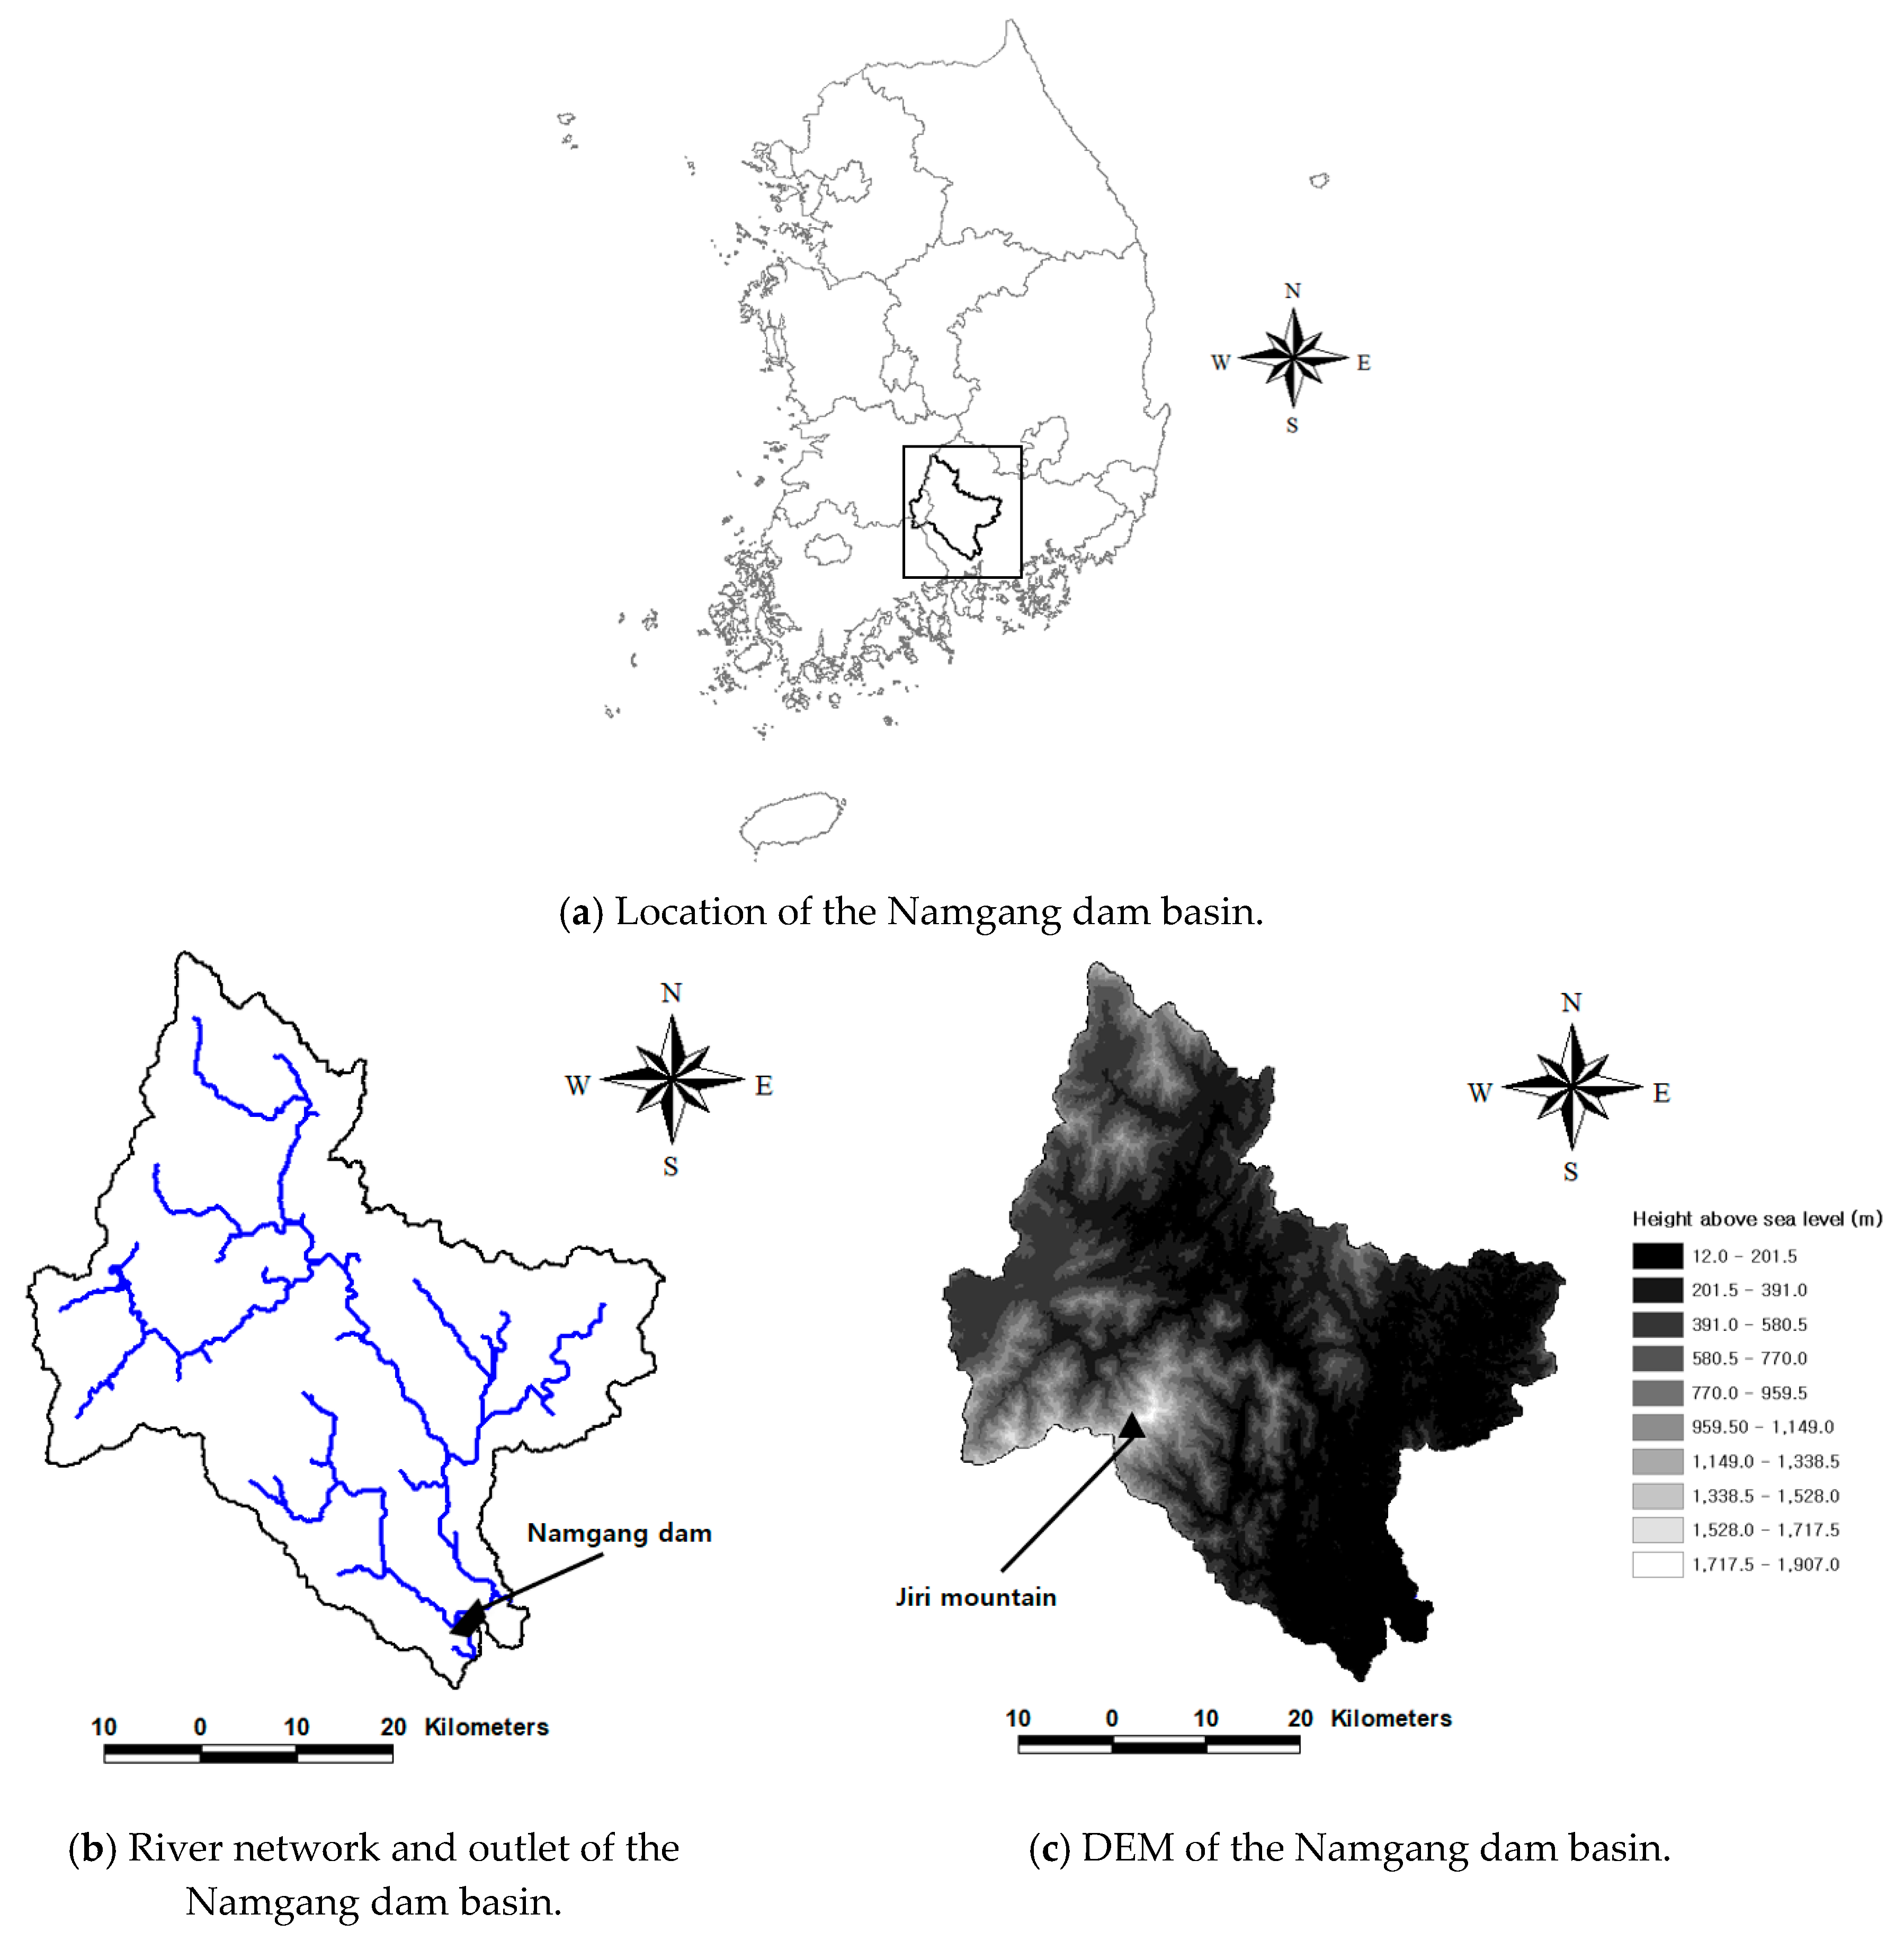
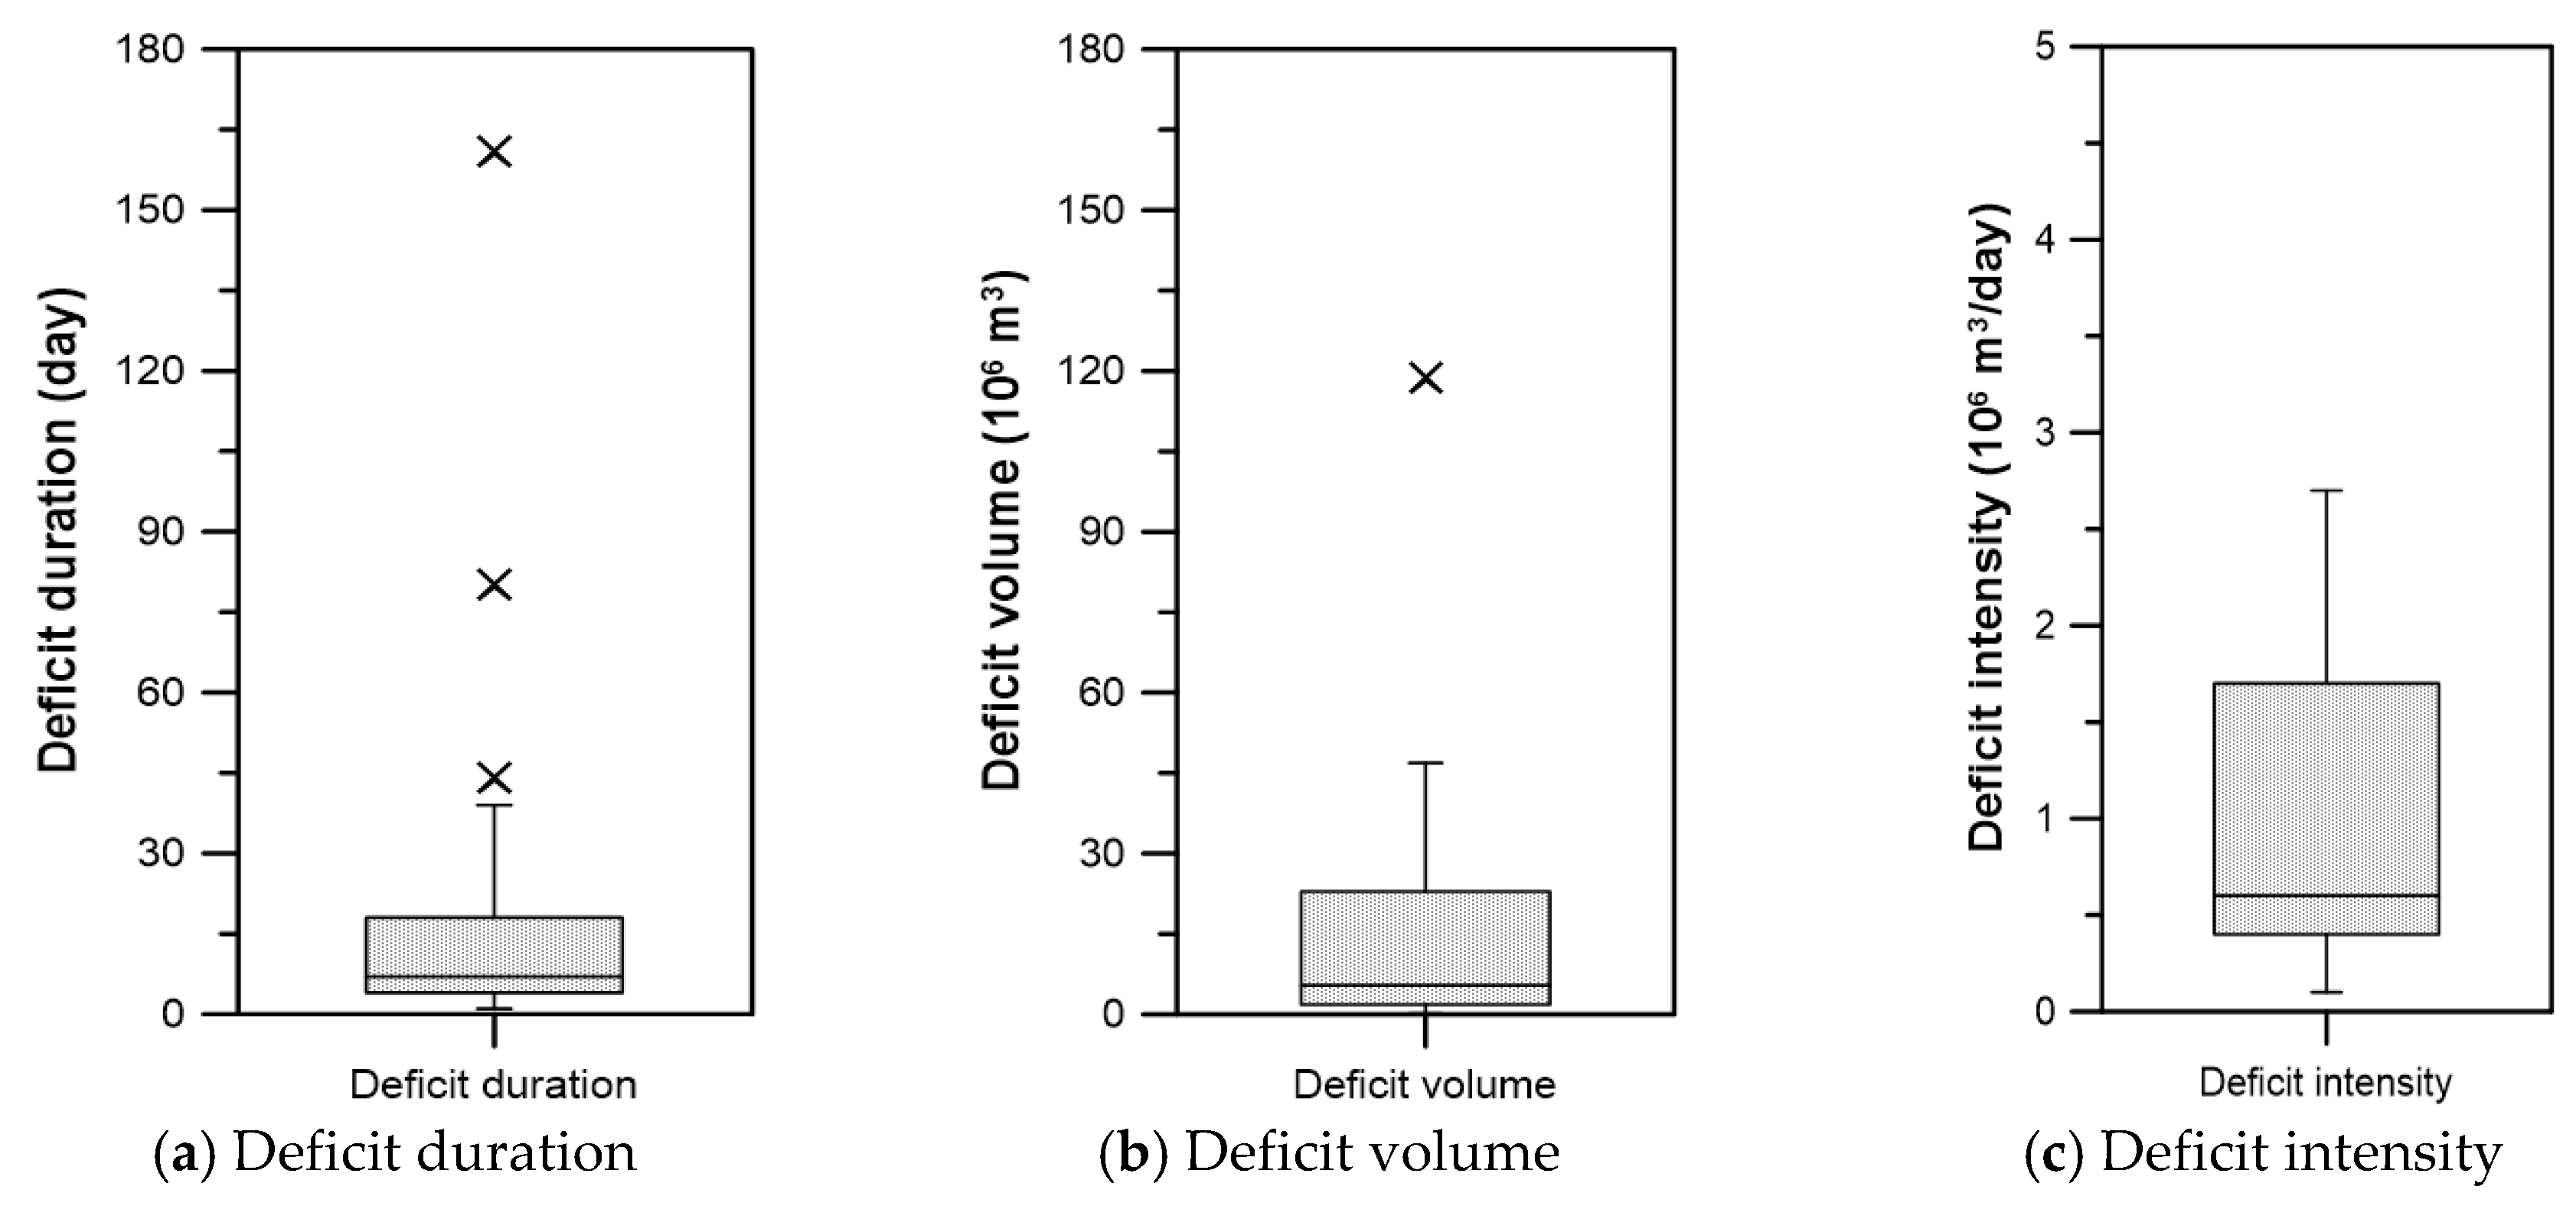
3. Study Area and Data
4. Results
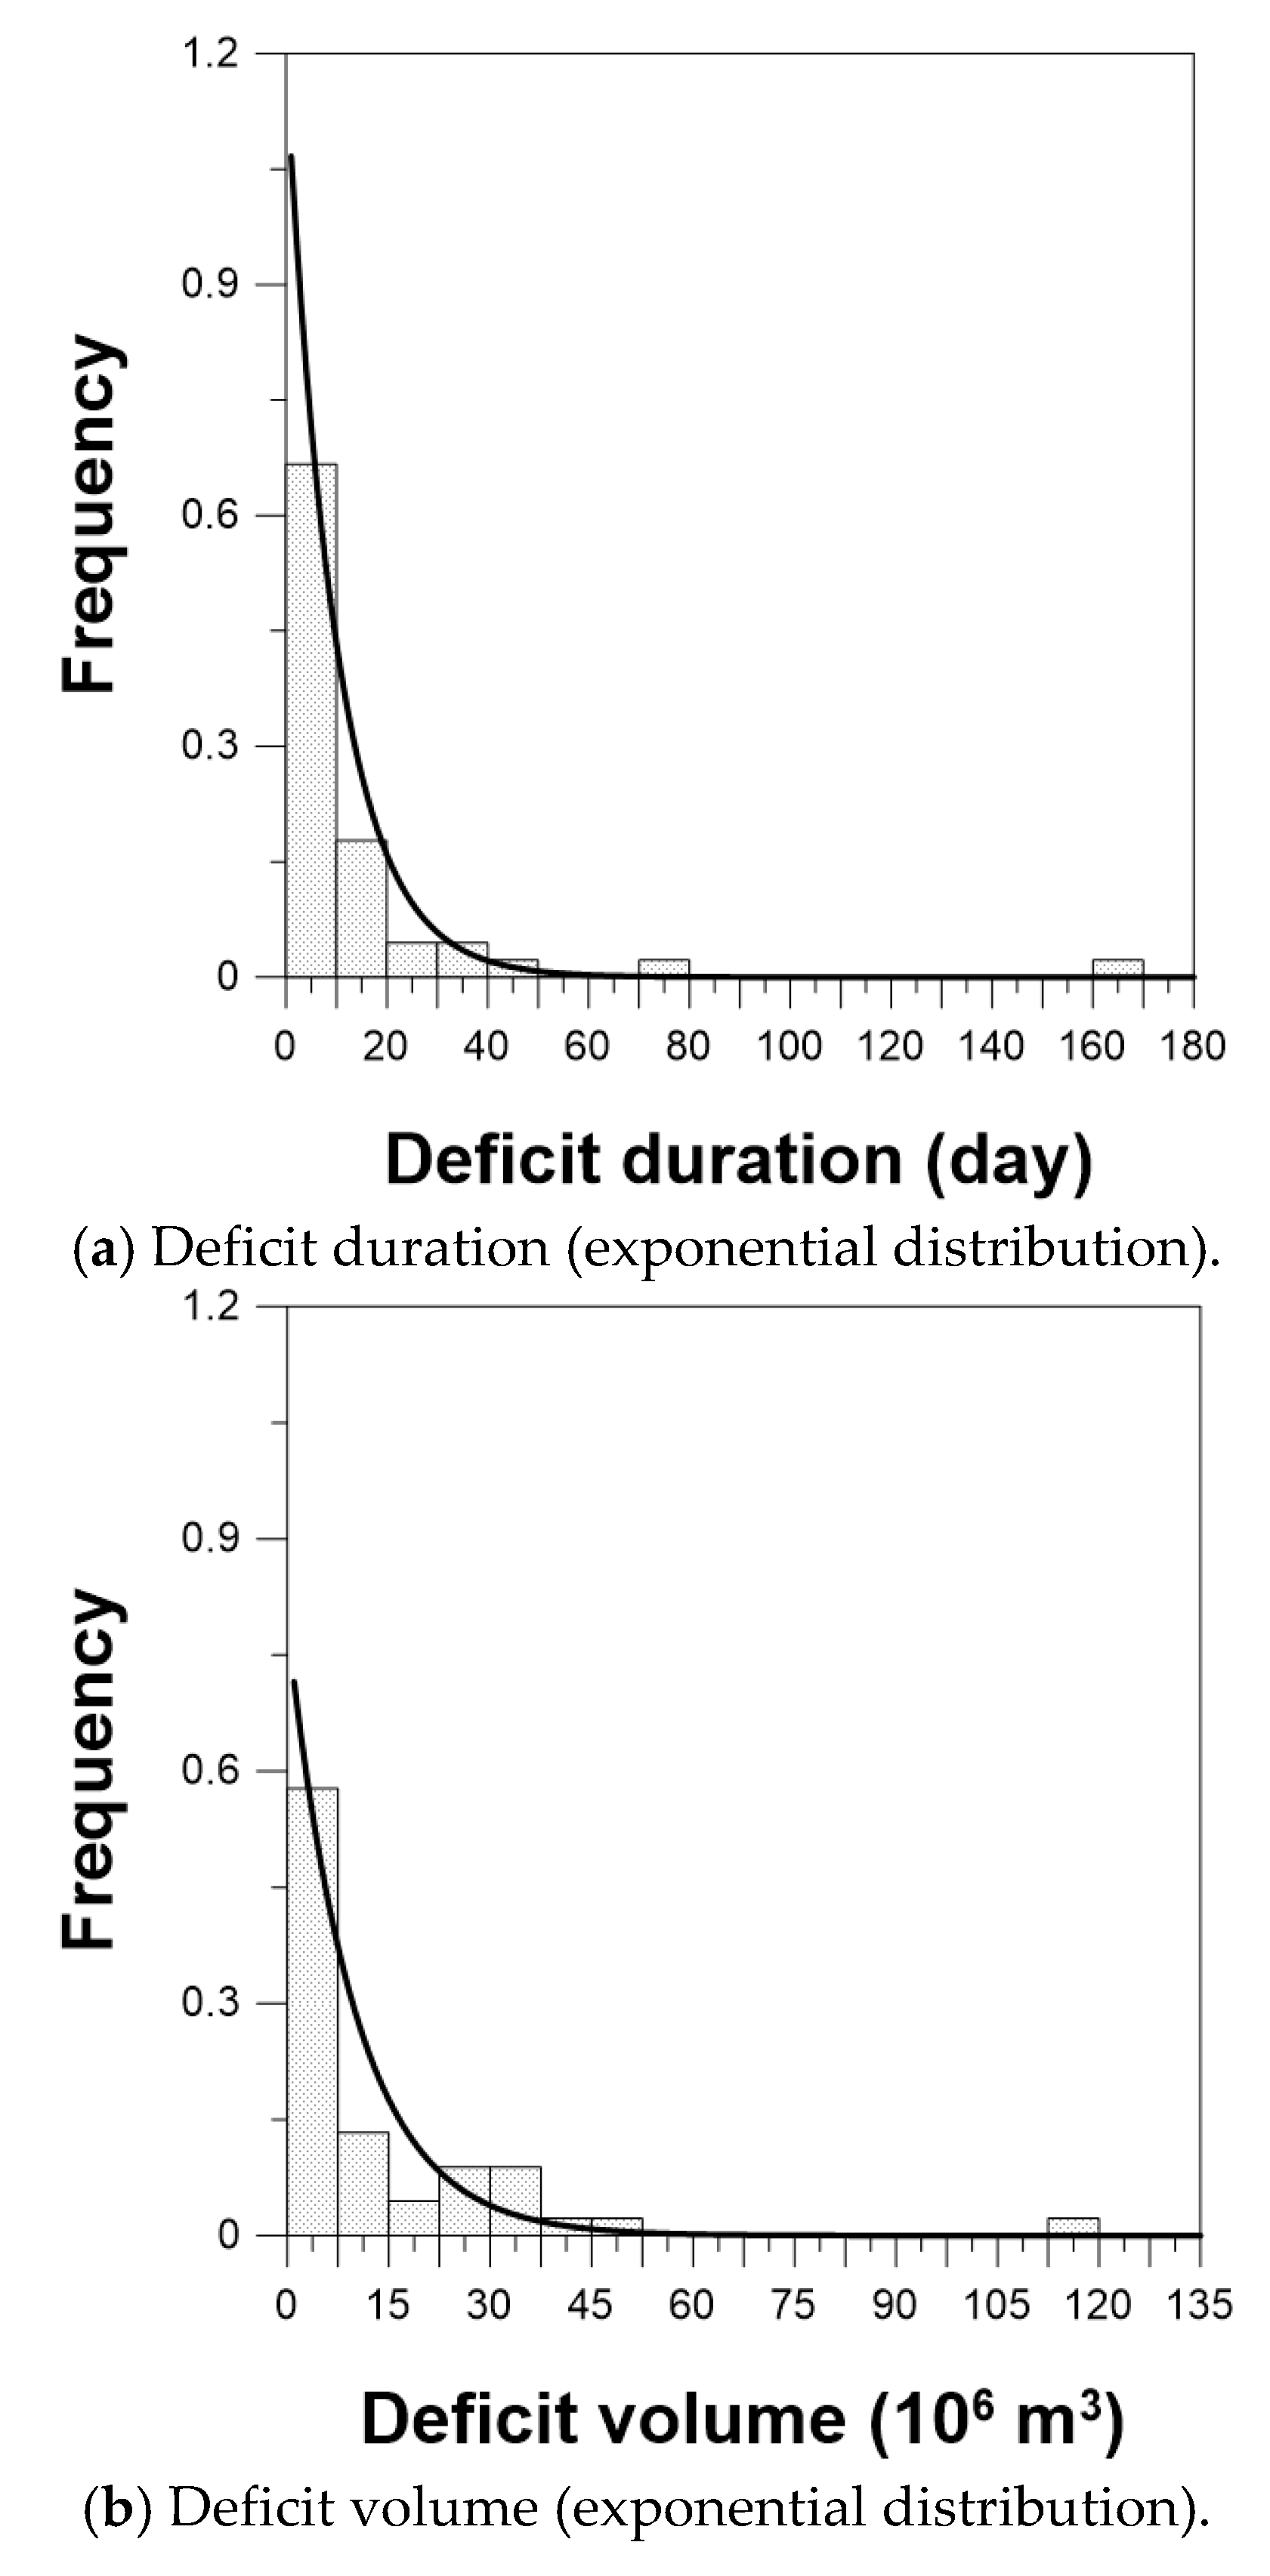
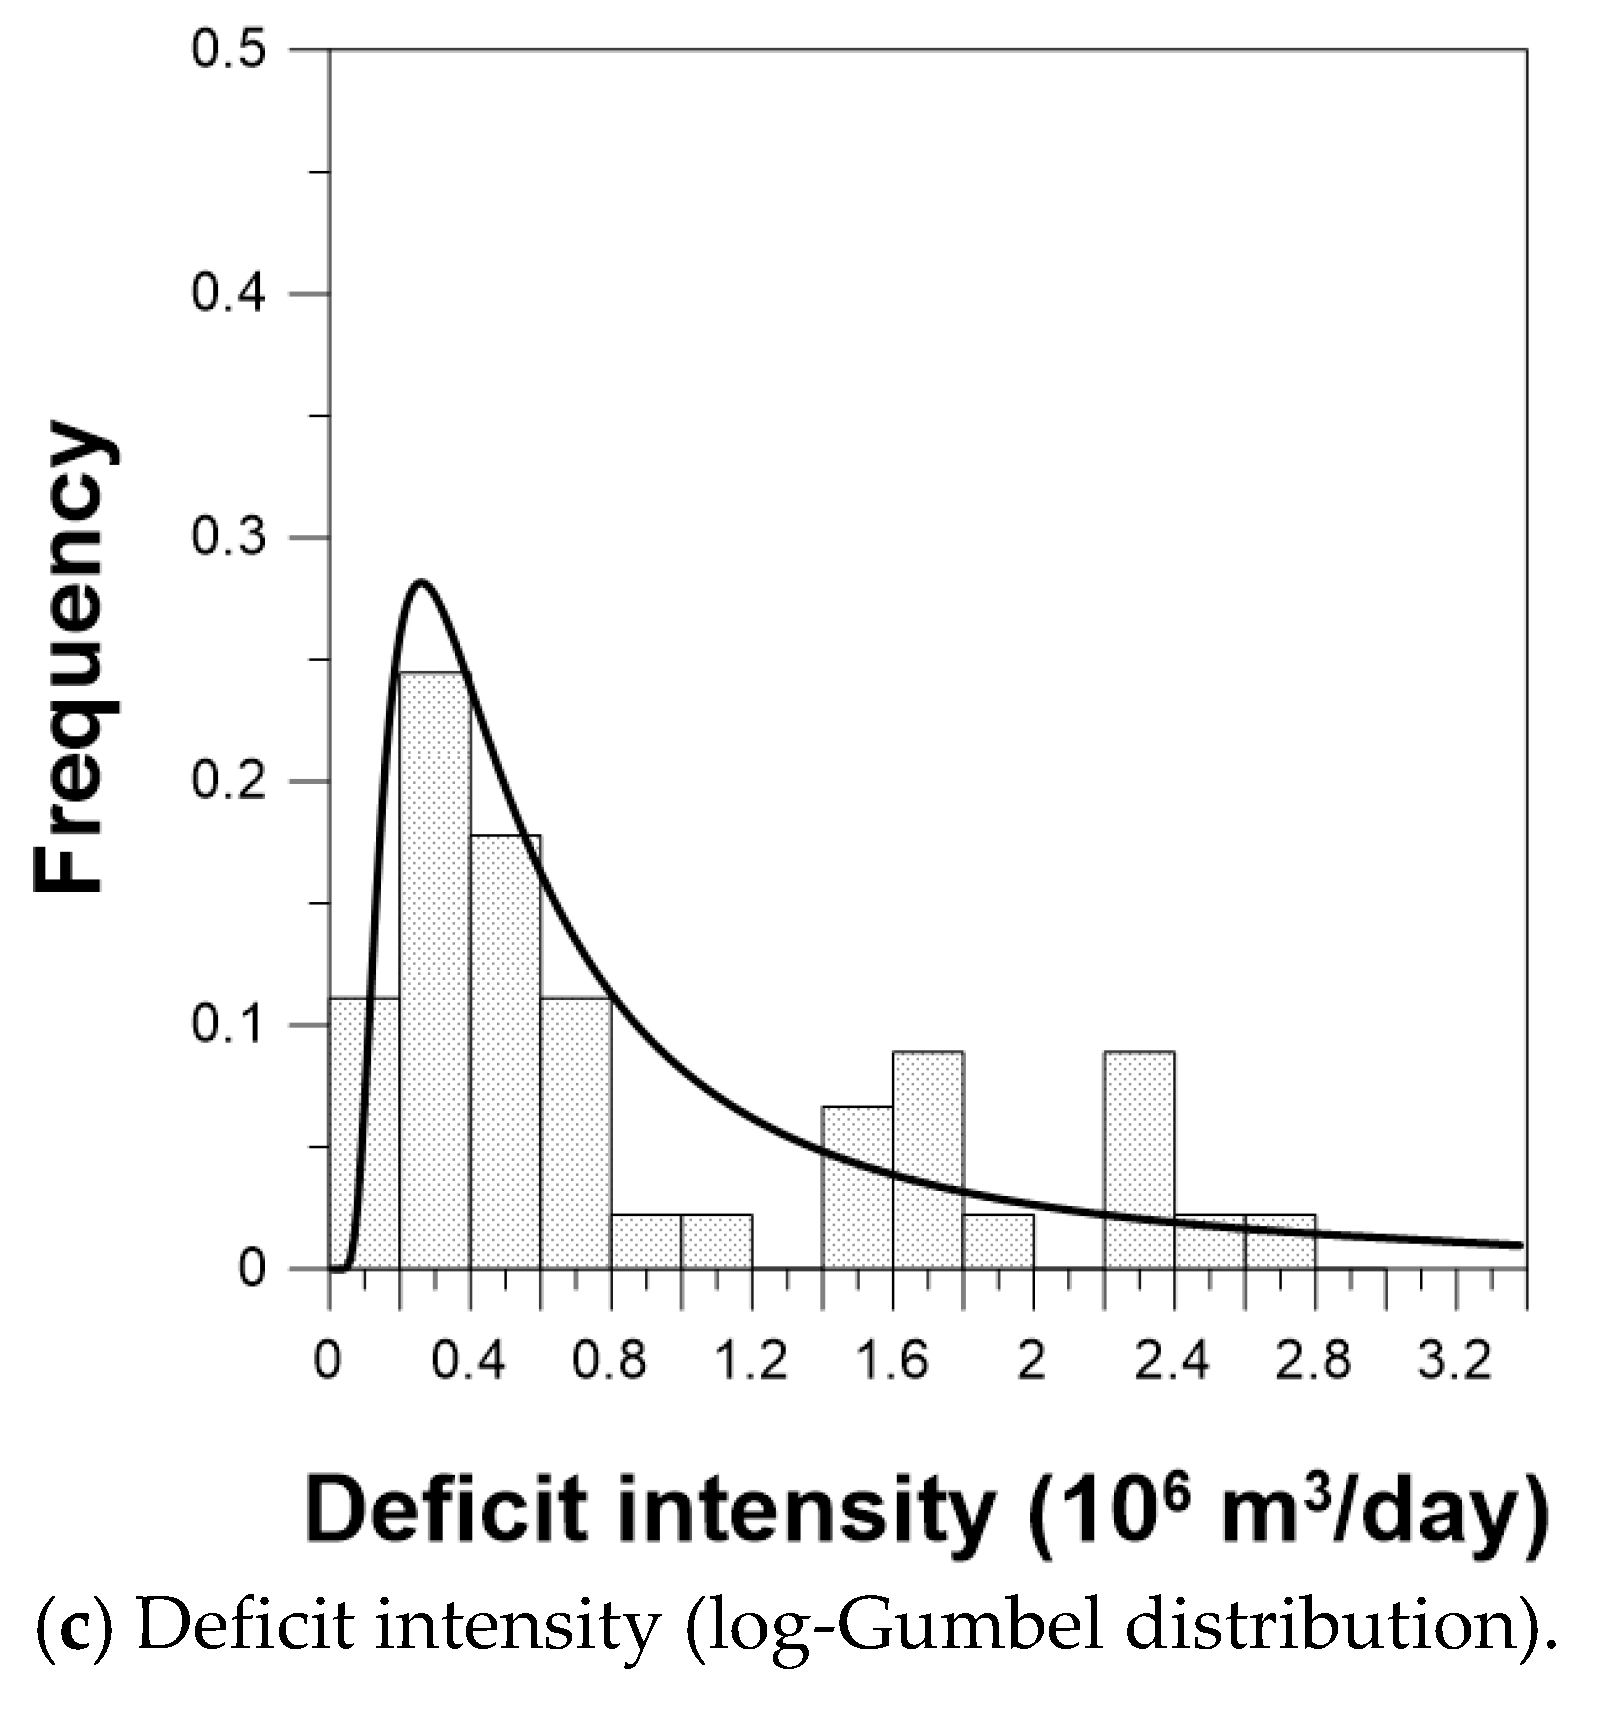
4.1. Probability Density Functions
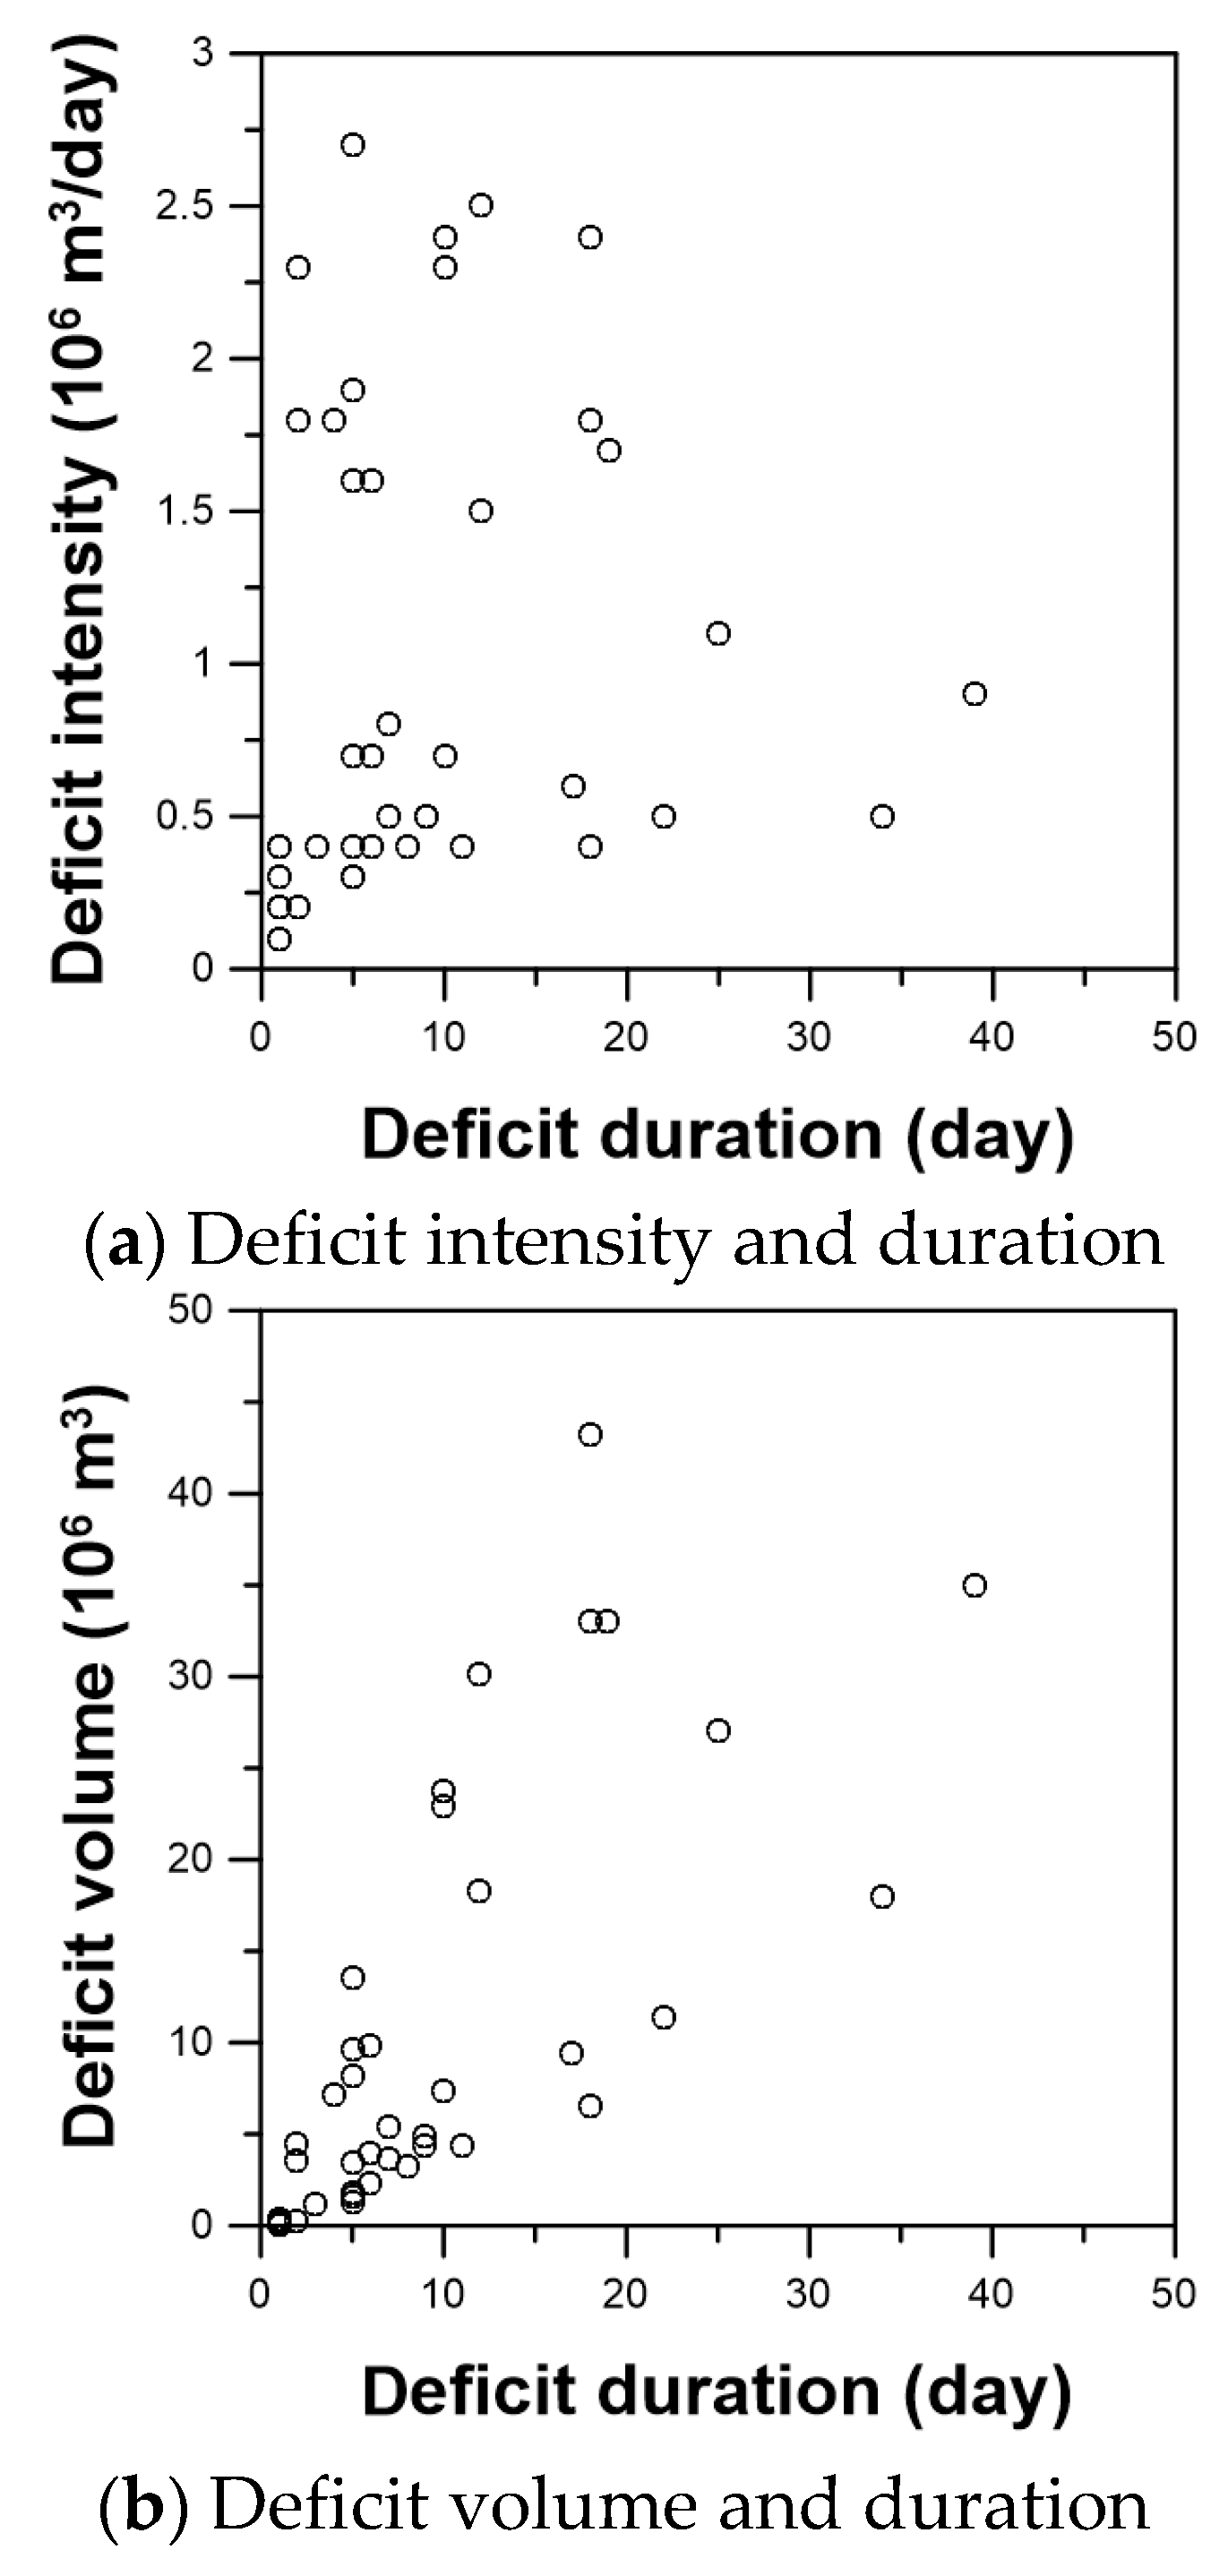
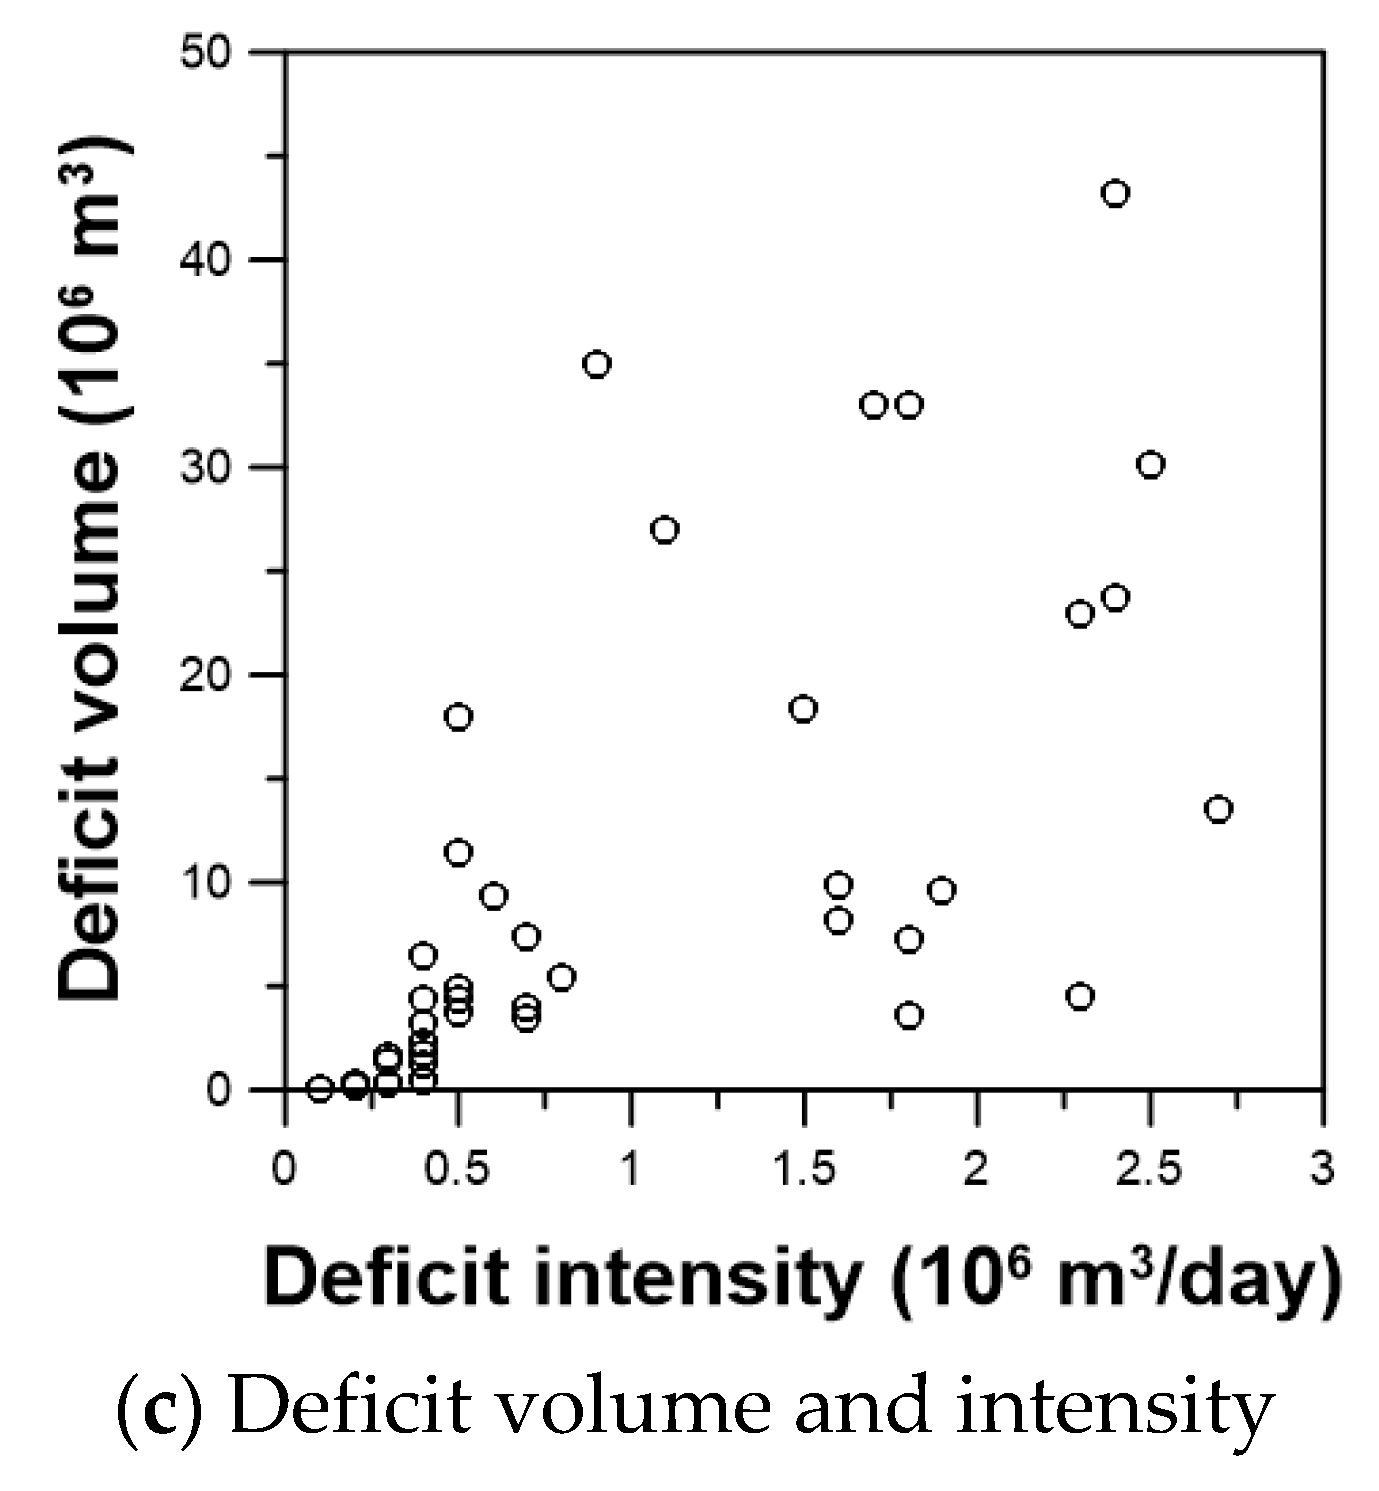
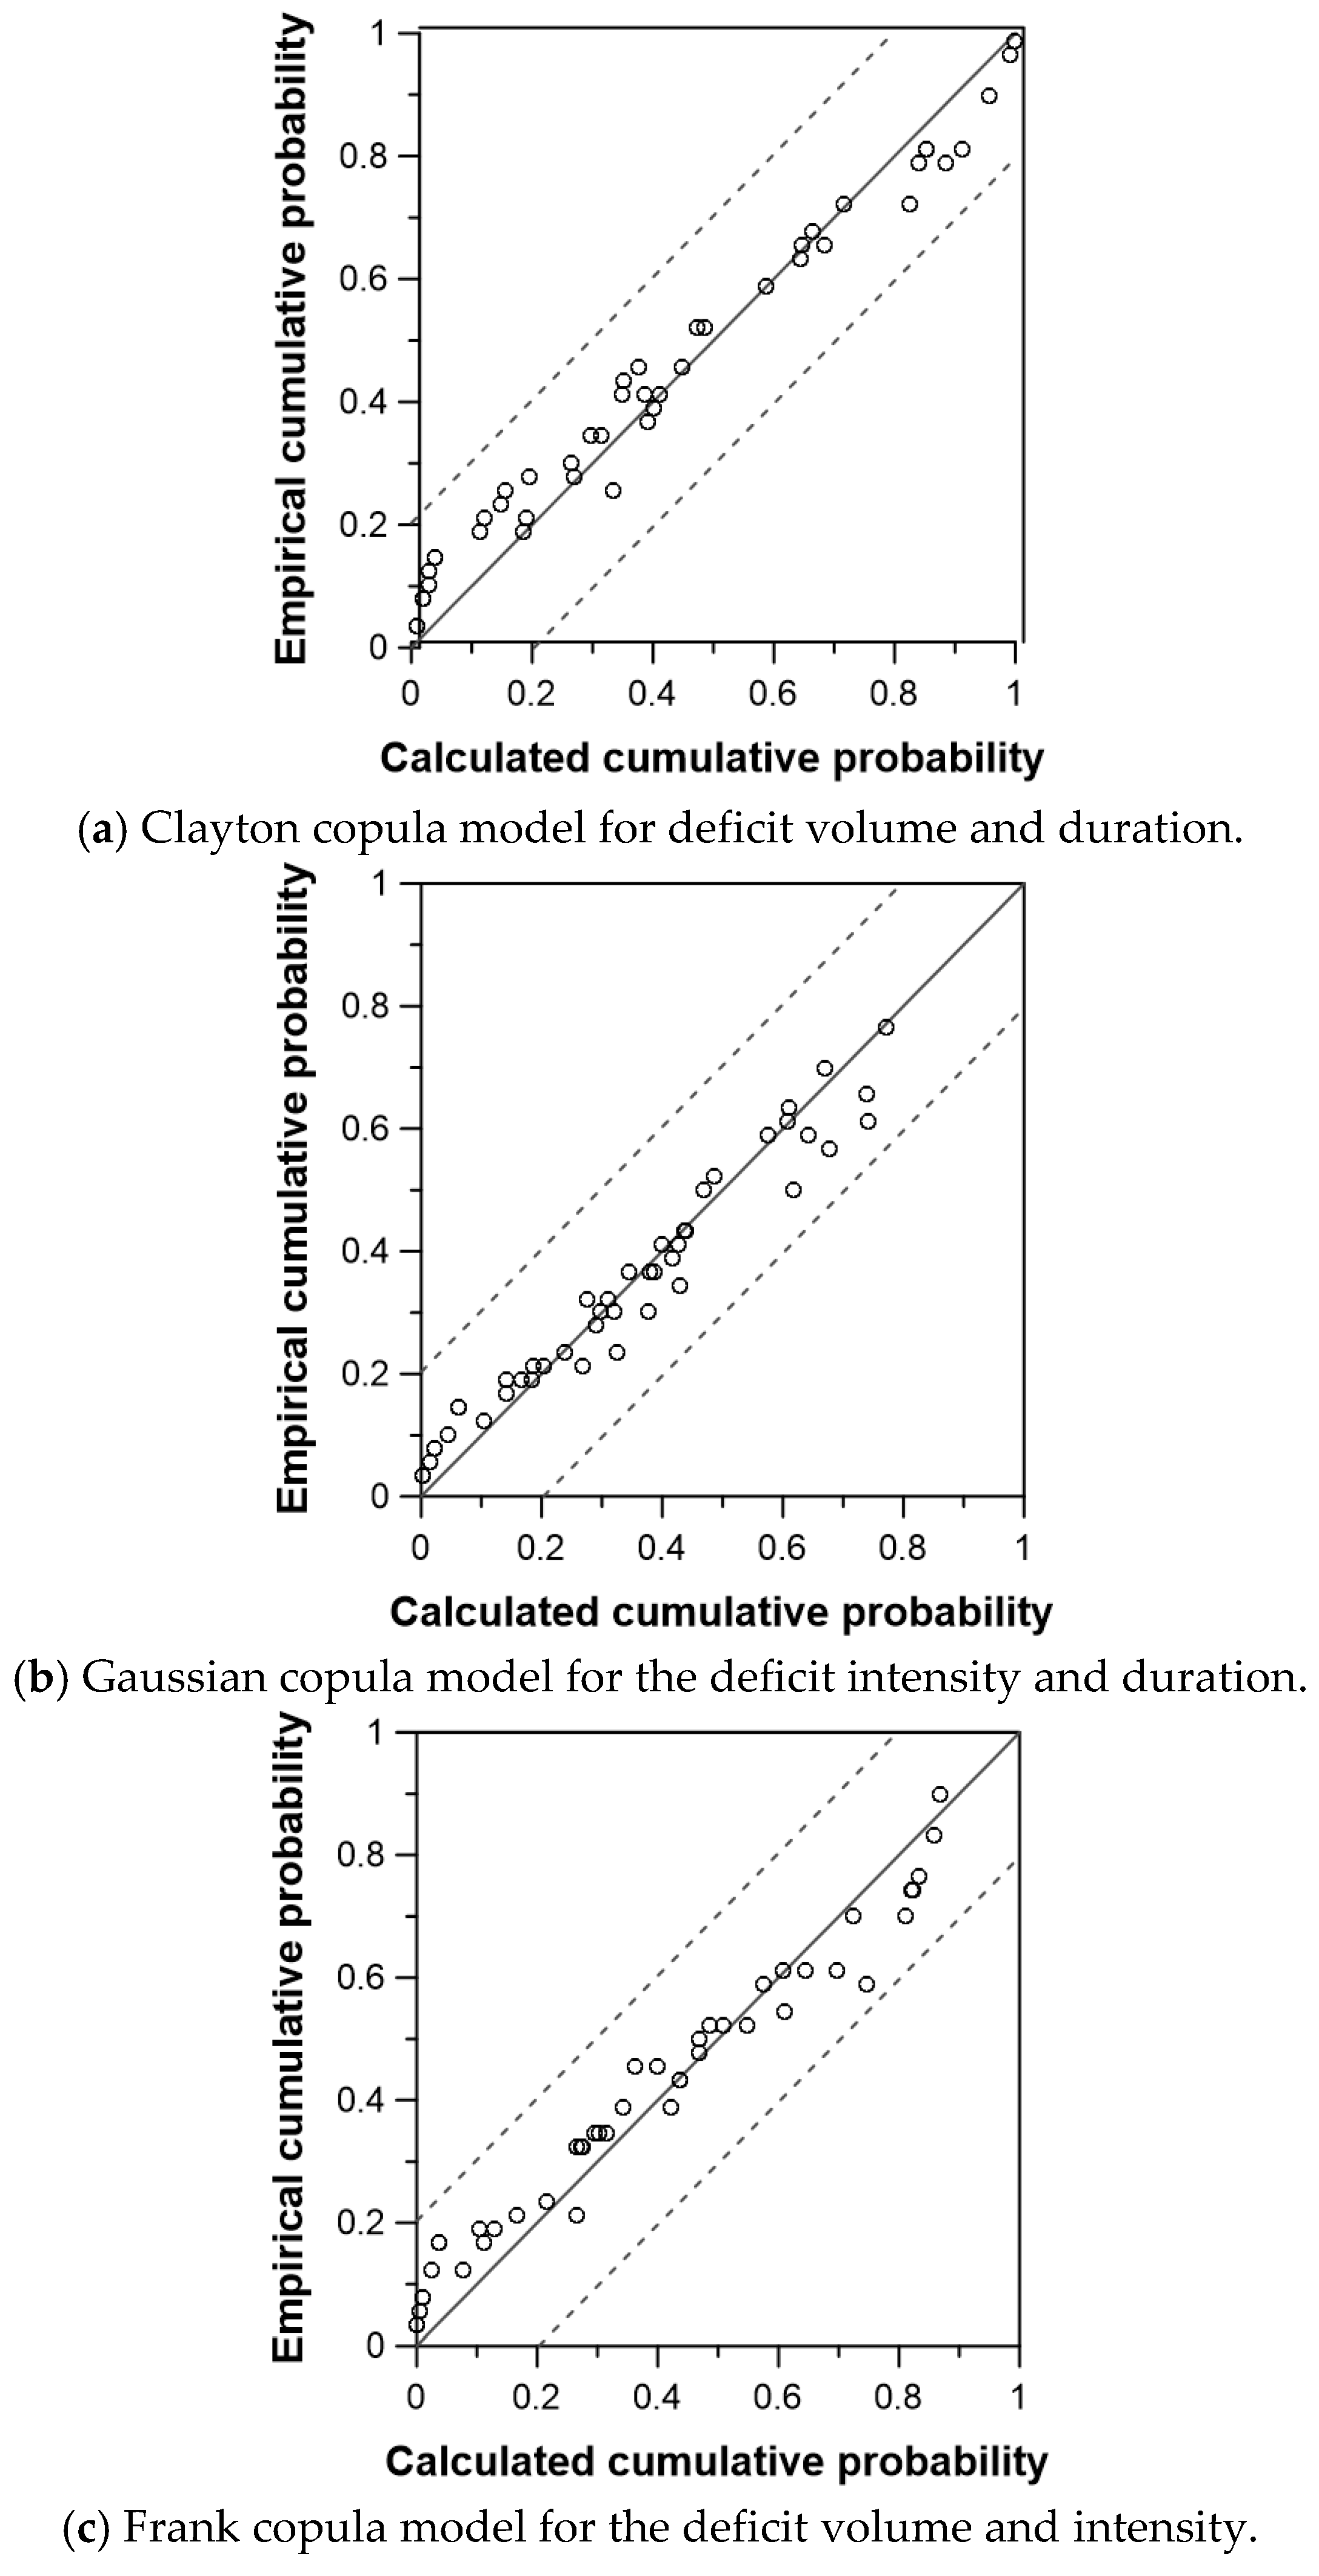
4.2. Optimal Copula Model for the Water Deficit Events
4.3. Occurrence Probability
4.4. Vulnerability
5. Conclusions
Author Contributions
Funding
Conflicts of Interest
References
- Choe, J.-H.; Heo, E.-N.; Sim, M.-P. The economic impacts of water supply constraints during a drought using input-output analysis. J. Korea Water Resour. Assoc. 2000, 33, 647–658. [Google Scholar]
- Chang, H.; Kwon, W.-T. Spatial variations of summer precipitation trends in South Korea, 1973–2005. Environ. Res. Lett. 2007, 2, 045012. [Google Scholar] [CrossRef] [Green Version]
- Seo, S.-S.; Kim, D.-G.; Lee, K.-H.; Kim, H.-S.; Kim, T.-W. Estimation of drought damage based on agricultural and domestic water use. J. Wetl. Res. 2009, 11, 77–87. [Google Scholar]
- Lee, G.-M.; Yi, J. Analysis of emergency water supply effects of multipurpose dams using water shortage index. J. Korea Water Resour. Assoc. 2012, 45, 1143–1156. [Google Scholar] [CrossRef]
- Lee, G.-M. Water supply performance assessment of multipurpose dams using sustainability index. J. Korea Water Resour. Assoc. 2014, 47, 411–420. [Google Scholar] [CrossRef]
- Yi, J.-E. Development of optimal operation rule for multipurpose reservoirs system. J. Korea Water Resour. Assoc. 2004, 37, 487–497. [Google Scholar] [CrossRef]
- Yi, J.-E.; Kwon, D.-S. Effects on conservation and flood control systems according in normal water level change from Daechung multi-purpose reservoir. J. Korea Water Resour. Assoc. 2007, 40, 1–10. [Google Scholar] [CrossRef]
- Long-Term Master Plan for Dam Construction (2012–2021); Ministry of Land, Transport and Maritime Affairs: Seoul, Korea, 2012.
- Long-Term Comprehensive Water Resource Plans (2001–2020); Ministry of Land, Transport and Maritime Affairs: Seoul, Korea, 2016.
- Harada, J.; Yasuda, N. Conservation and improvement of the environment in dam reservoirs. Int. J. Water Resour. Dev. 2004, 20, 77–96. [Google Scholar] [CrossRef]
- Yi, J.; Lee, G.; Cha, K. Idea on the improvement of water yield evaluation methodology. Mag. Korea Water Resour. Assoc. 2012, 45, 51–57. [Google Scholar] [CrossRef]
- Hashimoto, T.; Stedinger, J.R.; Loucks, D.P. Reliability, resiliency, and vulnerability criteria for water resource system performance evaluation. Water Resour. Res. 1982, 18, 14–20. [Google Scholar] [CrossRef] [Green Version]
- Moy, W.S.; Cohon, J.L.; ReVelle, C.S. A programming model for analysis of the reliability, resilience, and vulnerability of a water supply reservoir. Water Resour. Res. 1986, 22, 489–498. [Google Scholar] [CrossRef]
- Grigg, N.S. Management framework for large-scale water problems. J. Water Resour. Plan. Manag. 1996, 122, 296–300. [Google Scholar] [CrossRef]
- Kjeldsen, T.R.; Rosbjerg, D. Choice of reliability, resilience and vulnerability estimators for risk assessments of water resources systems/choix d’estimateurs de fiabilité, de résilience et de vulnérabilité pour les analyses de risque de systèmes de ressources en eau. Hydrol. Sci. J. 2004, 49. [Google Scholar] [CrossRef]
- Lee, G.-M. On the water yield assessment index in water resources system. Water Future 2012, 45, 71–77. [Google Scholar]
- Füssel, H.-M.; Klein, R.J. Climate change vulnerability assessments: An evolution of conceptual thinking. Clim. Change 2006, 75, 301–329. [Google Scholar] [CrossRef]
- Gain, A.K.; Giupponi, C.; Renaud, F.G. Climate change adaptation and vulnerability assessment of water resources systems in developing countries: A generalized framework and a feasibility study in bangladesh. Water 2012, 4, 345–366. [Google Scholar] [CrossRef] [Green Version]
- Wu, G.; Li, L.; Ahmad, S.; Chen, X.; Pan, X. A dynamic model for vulnerability assessment of regional water resources in arid areas: a case study of Bayingolin, China. Water Resour. Manag. 2013, 27, 3085–3101. [Google Scholar] [CrossRef]
- Nicu, I.C. Cultural heritage assessment and vulnerability using analytic hierarchy process and geographic information systems (Valea Oii catchment, North-eastern Romania). An approach to historical maps. Int. J. Disaster Risk Reduct. 2016, 20, 103–111. [Google Scholar] [CrossRef]
- Jinno, K. Risk assessment of a water supply system during drought. Int. J. Water Resour. Dev. 1995, 11, 185–204. [Google Scholar] [CrossRef]
- Jain, S.K. Investigating the behavior of statistical indices for performance assessment of a reservoir. J. Hydrol. 2010, 391, 90–96. [Google Scholar] [CrossRef]
- Sklar, M. Fonctions de repartition an dimensions et leurs marges. Publ. Inst. Stat. Univ. Paris 1959, 8, 229–231. [Google Scholar]
- Nelsen, R.B. An Introduction to Copulas; Springer Science & Business Media: Berlin, Germany, 2007. [Google Scholar]
- Genest, C.; Favre, A.-C. Everything you always wanted to know about copula modeling but were afraid to ask. J. Hydrol. Eng. 2007, 12, 347–368. [Google Scholar] [CrossRef]
- Salvadori, G.; De Michele, C. On the use of copulas in hydrology: Theory and practice. J. Hydrol. Eng. 2007, 12, 369–380. [Google Scholar] [CrossRef]
- Embrechts, P.; Lindskog, F.; McNeil, A. Modelling Dependence with Copulas and Applications to Risk Management; Institut Fédéral de Technologie de Zurich: Zurich, Switzerland, 2001. [Google Scholar]
- Clayton, D.G. A model for association in bivariate life tables and its application in epidemiological studies of familial tendency in chronic disease incidence. Biometrika 1978, 65, 141–151. [Google Scholar] [CrossRef]
- Frank, M.J. On the simultaneous associativity of F(x, y) and x + y − F(x, y). Aequ. Math. 1979, 19, 194–226. [Google Scholar] [CrossRef]
- Hutchinson, T.P. Continuous Bivariate Distributions Emphasising Applications; Rumsby Scientific Publishing: Adelaide, Autralia, 1990. [Google Scholar]
- Schmidt, R.; Stadtmüller, U. Non-parametric estimation of tail dependence. Scand. J. Stat. 2006, 33, 307–335. [Google Scholar] [CrossRef]
- Zhang, L.; Singh, V.P. Bivariate rainfall frequency distributions using archimedean copulas. J. Hydrol. 2007, 332, 93–109. [Google Scholar] [CrossRef]
- Akaike, H. A new look at the statistical model identification. IEEE Trans. Autom. Control 1974, 19, 716–723. [Google Scholar] [CrossRef]
- Gringorten, I.I. A plotting rule for extreme probability paper. J. Geophys. Res. 1963, 68, 813–814. [Google Scholar] [CrossRef]
- Burnham, K.P.; Anderson, D.R. Model Selection and Multimodel Inference: A Practical Information-Theoretic Approach; Springer Science & Business Media: Berlin, Germany, 2003. [Google Scholar]
- Yevjevich, V. Probability and Statistics in Hydrology; Water Resources Pubications: Littleton, CO, USA, 1972. [Google Scholar]
- Rodriguez-Iturbe, I.; Cox, D.R.; Isham, V. Some models for rainfall based on stochastic point processes. Proc. R. Soc. Lond. A 1987, 410, 269–288. [Google Scholar] [CrossRef]
- Heneker, T.M.; Lambert, M.F.; Kuczera, G. A point rainfall model for risk-based design. J. Hydrol. 2001, 247, 54–71. [Google Scholar] [CrossRef]
- Morrissey, M.L. Superposition of the neyman–scott rectangular pulses model and the poisson white noise model for the representation of tropical rain rates. J. Hydrometeorol. 2009, 10, 395–412. [Google Scholar] [CrossRef]
- Kim, D.; Olivera, F.; Cho, H.; Socolofsky, S.A. Regionalization of the modified Bartlett–Lewis rectangular pulse stochastic rainfall model. Terr. Atmos. Ocean. Sci. 2013, 24, 421–436. [Google Scholar] [CrossRef]
- Teixeira-Gandra, C.F.; Damé, R.d.C.F. Bartlett–Lewis of rectangular pulse modified model: Estimate of parameters for simulation of precipitation in sub-hourly duration. Engenharia Agrícola 2014, 34, 925–934. [Google Scholar] [CrossRef]
- Ritschel, C.; Ulbrich, U.; Névir, P.; Rust, H.W. Precipitation extremes on multiple timescales–Bartlett–Lewis rectangular pulse model and intensity–duration–frequency curves. Hydrol. Earth Syst. Sci. 2017, 21, 6501–6517. [Google Scholar] [CrossRef]
- Yoo, C.; Kim, D.; Kim, T.-W.; Hwang, K.-N. Quantification of drought using a rectangular pulses poisson process model. J. Hydrol. 2008, 355, 34–48. [Google Scholar] [CrossRef]
- Farrar, D.E.; Glauber, R.R. Multicollinearity in regression analysis: The problem revisited. Rev. Econ. Stat. 1967, 49, 92–107. [Google Scholar] [CrossRef]
- Silvey, S. Multicollinearity and imprecise estimation. J. R. Stat. Soc. Ser. B Methodol. 1969, 31, 539–552. [Google Scholar]
- Cortina, J.M. Interaction, nonlinearity, and multicollinearity: Implications for multiple regression. J. Manag. 1993, 19, 915–922. [Google Scholar] [CrossRef]
- Wheeler, D.; Tiefelsdorf, M. Multicollinearity and correlation among local regression coefficients in geographically weighted regression. J. Geogr. Syst. 2005, 7, 161–187. [Google Scholar] [CrossRef]
- Morrow-Howell, N. The M word: Multicollinearity in multiple regression. Social Work Res. 1994, 18, 247–251. [Google Scholar] [CrossRef]
- Viswesvaran, C. Multiple regression in behavioral research: Explanation and prediction. Pers. Psychol. 1998, 51, 223–226. [Google Scholar]
- Kutner, M.H.; Nachtsheim, C.; Neter, J. Applied Linear Regression Models; McGraw-Hill/Irwin: Boston, MA, USA, 2004. [Google Scholar]
- Robinson, C.; Schumacker, R.E. Interaction effects: Centering, variance inflation factor, and interpretation issues. Mult. Linear Regres. Viewp. 2009, 35, 6–11. [Google Scholar]
- Marquandt, D. You should standardize the predictor variables in your regression models. Discussion of: A critique of some ridge regression methods. J. Am. Stat. Assoc. 1980, 75, 87–91. [Google Scholar] [CrossRef]
- Hasenauer, H.; Monserud, R.A. A crown ratio model for austrian Forests. For. Ecol. Manag. 1996, 84, 49–60. [Google Scholar] [CrossRef]
- Shiu, H.-J. The application of the value added intellectual coefficient to measure corporate performance: Evidence from technological firms. Int. J. Manag. 2006, 23, 356–365. [Google Scholar]
- Akinwande, M.O.; Dikko, H.G.; Samson, A. Variance inflation factor: As a condition for the inclusion of suppressor variable(s) in regression analysis. Open J. Stat. 2015, 5, 754. [Google Scholar] [CrossRef]
| Copula Model | Joint PDF |
|---|---|
| Clayton | |
| Frank | |
| Gumbel–Hougaard | |
| Gaussian |
| Copula Model | Relationship between Kendall’s and the Parameter |
|---|---|
| Clayton | |
| Frank | |
| Gumbel–Hougaard | |
| Gaussian |
| Variable | Mean | Standard Deviation | Range |
|---|---|---|---|
| Deficit duration (day) | 15.0 | 26.5 | 1–161 |
| Deficit volume (106 m3) | 13.5 | 20.4 | 0.1–118.9 |
| Deficit intensity (106 m3/day) | 1.0 | 0.8 | 0.1–2.7 |
| Copula Model | Deficit Volume and Duration | Deficit Intensity and Duration | Deficit Volume and Intensity |
|---|---|---|---|
| Clayton | 3.97 | 0.70 | 2.13 |
| Frank | 11.22 | 5.36 | 9.01 |
| Gumbel–Hougaard | 2.99 | 1.35 | 2.06 |
| Gaussian | 0.87 | 0.40 | 0.72 |
| Data Pair | Clayton | Frank | Gumbel–Hougaard | Gaussian | |
|---|---|---|---|---|---|
| MSE | Deficit volume and duration | 0.00351 | 0.00398 | 0.00404 | 0.00440 |
| Deficit intensity and duration | 0.0287 | 0.00397 | 0.0313 | 0.0313 | |
| Deficit volume and intensity | 0.0349 | 0.00401 | 0.0378 | 0.0378 | |
| AIC | Deficit volume and duration | −108.488 | −106.005 | −104.051 | −105.728 |
| Deficit intensity and duration | −67.370 | −106.052 | −65.703 | −114.095 | |
| Deficit volume and intensity | −63.599 | −105.839 | −62.000 | −102.689 |
| Data Pair | ‘AND’ Case | ‘OR’ Case |
|---|---|---|
| Deficit volume and duration | 3.27 106 m3 | 5.34 106 m3 |
| Deficit intensity and duration | 3.16 106 m3 | 9.11 106 m3 |
| Deficit volume and intensity | 3.38 106 m3 | 8.30 106 m3 |
| Conventional method | 13.54 × 10⁶ m3 | |
© 2018 by the authors. Licensee MDPI, Basel, Switzerland. This article is an open access article distributed under the terms and conditions of the Creative Commons Attribution (CC BY) license (http://creativecommons.org/licenses/by/4.0/).
Share and Cite
Yoo, C.; Cho, E. Vulnerability Assessment of Dam Water Supply Capacity Based on Bivariate Frequency Analysis Using Copula. Water 2018, 10, 1113. https://doi.org/10.3390/w10091113
Yoo C, Cho E. Vulnerability Assessment of Dam Water Supply Capacity Based on Bivariate Frequency Analysis Using Copula. Water. 2018; 10(9):1113. https://doi.org/10.3390/w10091113
Chicago/Turabian StyleYoo, Chulsang, and Eunsaem Cho. 2018. "Vulnerability Assessment of Dam Water Supply Capacity Based on Bivariate Frequency Analysis Using Copula" Water 10, no. 9: 1113. https://doi.org/10.3390/w10091113
APA StyleYoo, C., & Cho, E. (2018). Vulnerability Assessment of Dam Water Supply Capacity Based on Bivariate Frequency Analysis Using Copula. Water, 10(9), 1113. https://doi.org/10.3390/w10091113


