1. Introduction
Flooding is one of the most common natural phenomena. With the economic and social development, the global climate and the underlying surface have changed, causing changes in the water circulation process of river basins and causing more serious and frequent floods. Severe flood disasters have become one of the most serious water issues, which have brought incalculable losses and caused serious threats to the safety of lives and properties.
Flood forecasting is an important non-engineering measure for flood control and disaster reduction. Timely and accurate flood forecasting is the most effective way to control flooding and reduce flooding damage. A hydrological model is a modern flood forecasting method developing with the rapid development of electronic computer technology. By simulating historical floods, we can evaluate the performance of these hydrological models and make full preparations for flood forecasting. Since the first watershed hydrological model—the Stanford model—was applied in hydrology research [
1], there have been numerous hydrological models available all over the world. Xin’anjiang (XAJ) model [
2] is the first developed watershed hydrological model in China and has been widely used for flood forecasting in humid and semi-humid regions. Li et al. (2008) [
3] combined the XAJ model, the hydraulic method and the real-time error correction method to perform real-time flood forecasting in a regulated Huai River Basin and achieved a high accuracy. Liu et al. (2009) [
4] coupled the XAJ model with a kinematic flow model based on digital drainage networks and applied it for flood simulation in Huangnizhuang basin; it showed good performance. In addition, many hydrological models have been developed abroad, including SWMM [
5], HSPF [
6], MIKE SHE [
7], AGNPS [
8], ANSWERS [
9], SWAT [
10] and MARINE event-based model [
11]. Among these models, the SWAT model is a basin-scale model which can predict the impact of management on water, sediment and agricultural chemical pollutant loads. It has a very strong physical mechanism that is able to simulate in the basins without observed data. The SWAT model is good at simulating long periods of time at a larger time-scale and has been extensively used for daily, monthly and yearly simulation of runoff and discharge [
12,
13,
14].
The ability to simulate event-based floods is significant for hydrological models to sufficiently capture dynamic hydrological processes between short intervals. Therefore, more and more scholars have studied the application of the SWAT model for discharge simulation in a shorter time-step. Jeong et al. (2010) [
15] modified the SWAT model to simulate floods with hourly precipitation input, but they only tested it in a very small watershed (1.94 km
2) and pointed out that there may be some problems in intensely urbanized areas. Yu et al. (2017) [
16] followed the same method and improved the Unit Graph module. They simulated event-based floods in the upper Huai River Basin and demonstrated that the modified SWAT model had a high accuracy in flood simulation in a larger and urbanized area. Using the original SWAT model, Yang et al. (2016) [
17] compared the SWAT model with daily and sub-daily precipitation input for the simulation of daily discharge in the upper Huai River Basin and showed that the model with sub-daily precipitation data performed better than the model with daily precipitation data, especially when simulating peak flows during the flood seasons. Boithias et al. (2017) [
18] simulated flash floods at an hourly time-step in the Têt Mediterranean river basin using the SWAT model and then compared it with the MARINE model. This is the first time that the SWAT model has been performed at an hourly time-step at a catchment of about 1000 km
2. This research has shown great improvement in the SWAT model, but the applicability of the SWAT model in simulating floods remains to be further studied in more and larger basins.
To date, the XAJ model has been the most widely used hydrological model in flood forecasting in China, while the SWAT model has also proved its reasonable capability to simulate floods in several basins. The objectives of this study were threefold. The first objective was to evaluate the performance of the SWAT model in flood simulation at a sub-daily time-scale in a slightly larger basin and explore how this simulation improves our understanding of hydrological processes during a flood event. The second objective was to compare the results of sub-daily SWAT with the XAJ model and demonstrate the event-based flood simulation capability of the SWAT model. The third objective was to research the impact of spatial scale on the SWAT model and comprehensively estimate the applicability of the SWAT model.
3. Results and Discussion
3.1. Parameters’ Sensitivity for SWAT Model
The ranking of the most sensitive parameters obtained in daily simulation and flood simulation was listed in
Table 3. In this paper, the parameter was considered to be significantly sensitive when the p-value was less than 0.03.
The significantly sensitive parameters of the SWAT model in daily simulation were baseflow alpha factor for bank storage (ALPHA_BNK), Manning’s “n” value of the main channel (CH_N2), effective hydraulic conductivity in main channel alluvium (CH_K2), saturated hydraulic conductivity (SOL_K), threshold depth of water in the shallow aquifer required for return flow to occur (GWQMN), groundwater “revap” coefficient (GW_REVAP) and initial SCS runoff curve number for moisture condition II (CN2). These parameters were related to flow routing and runoff generation. While in flood simulation, significantly sensitive parameters were ALPHA_BNK, CH_N2 and CH_K2. They were all connected with flow routing. In both daily and flood simulation, ALPHA_BNK, CH_N2 and CH_K2 were significantly sensitive which means that flow routing was very important for the simulation of the SWAT model in this study area, while their values were all larger in flood simulation. The larger ALPHA_BNK value meant flat recessions for bank flow and the larger CH_K2 value would cause more water loss to the groundwater within the stream bed. The fitted value of CH_N2 in flood simulation was 0.0847 (m−1/3s) and was larger than 0.0447 (m−1/3s) in daily simulation. The larger CH_N2 value led to smaller flow velocity. Other differences were GWQMN, average slope length (SLSUBBSN) and groundwater delay time (GW_DELAY). Their values were all smaller in flood simulation.
It is worth noting that the calibration and sensitivity analysis results were based on the data and model performance for this paper. The final result was influenced by all the parameters included. Many other factors, such as types of changes for parameters and the selection of objective function [
38], may affect the results as well.
3.2. Comparison of Sub-daily SWAT and XAJ Model in Daily Simulation
The team developed a sub-daily SWAT model for daily discharge simulation and then compared it with the XAJ model. The results of calibration and validation for the XAJ and SWAT models were presented in
Table 4, which shows separately the performances for the calibration and validation periods. After three iterations, a best iteration for sub-daily SWAT model was chosen. The p-factor and r-factor were 0.86 and 0.63 for the sub-daily SWAT model, respectively. So, the calibration of the SWAT model was considered to be satisfactory according to the criteria.
During the calibration period, the R2, NSE and PBIAS obtained by the SWAT model was 0.81, 0.76 and 14.61, respectively, while the R2, NSE and PBIAS for the XAJ model was 0.75, 0.70 and −0.75, respectively. The simulations were classified as satisfactory for both models. The XAJ model simulated more reasonably than the SWAT model according to the PBIAS. While the R2 and NSE obtained by the SWAT model improved a lot compared to that obtained by the XAJ model. During the validation period, the R2 and NSE of the XAJ model were almost the same as those during the calibration period, but the PBIAS changed from −0.75 to 2.22. For the SWAT model, the R2, NSE and PBIAS were 0.84, 0.80 and 8.62, respectively. All of them improved a lot. After analyzing these results, it was concluded that both the XAJ and SWAT models were suitable for daily simulation. The SWAT model was better according to R2 and NSE. The higher R2 and NSE values for the SWAT model indicated that the simulated discharge was in better agreement with the observed data.
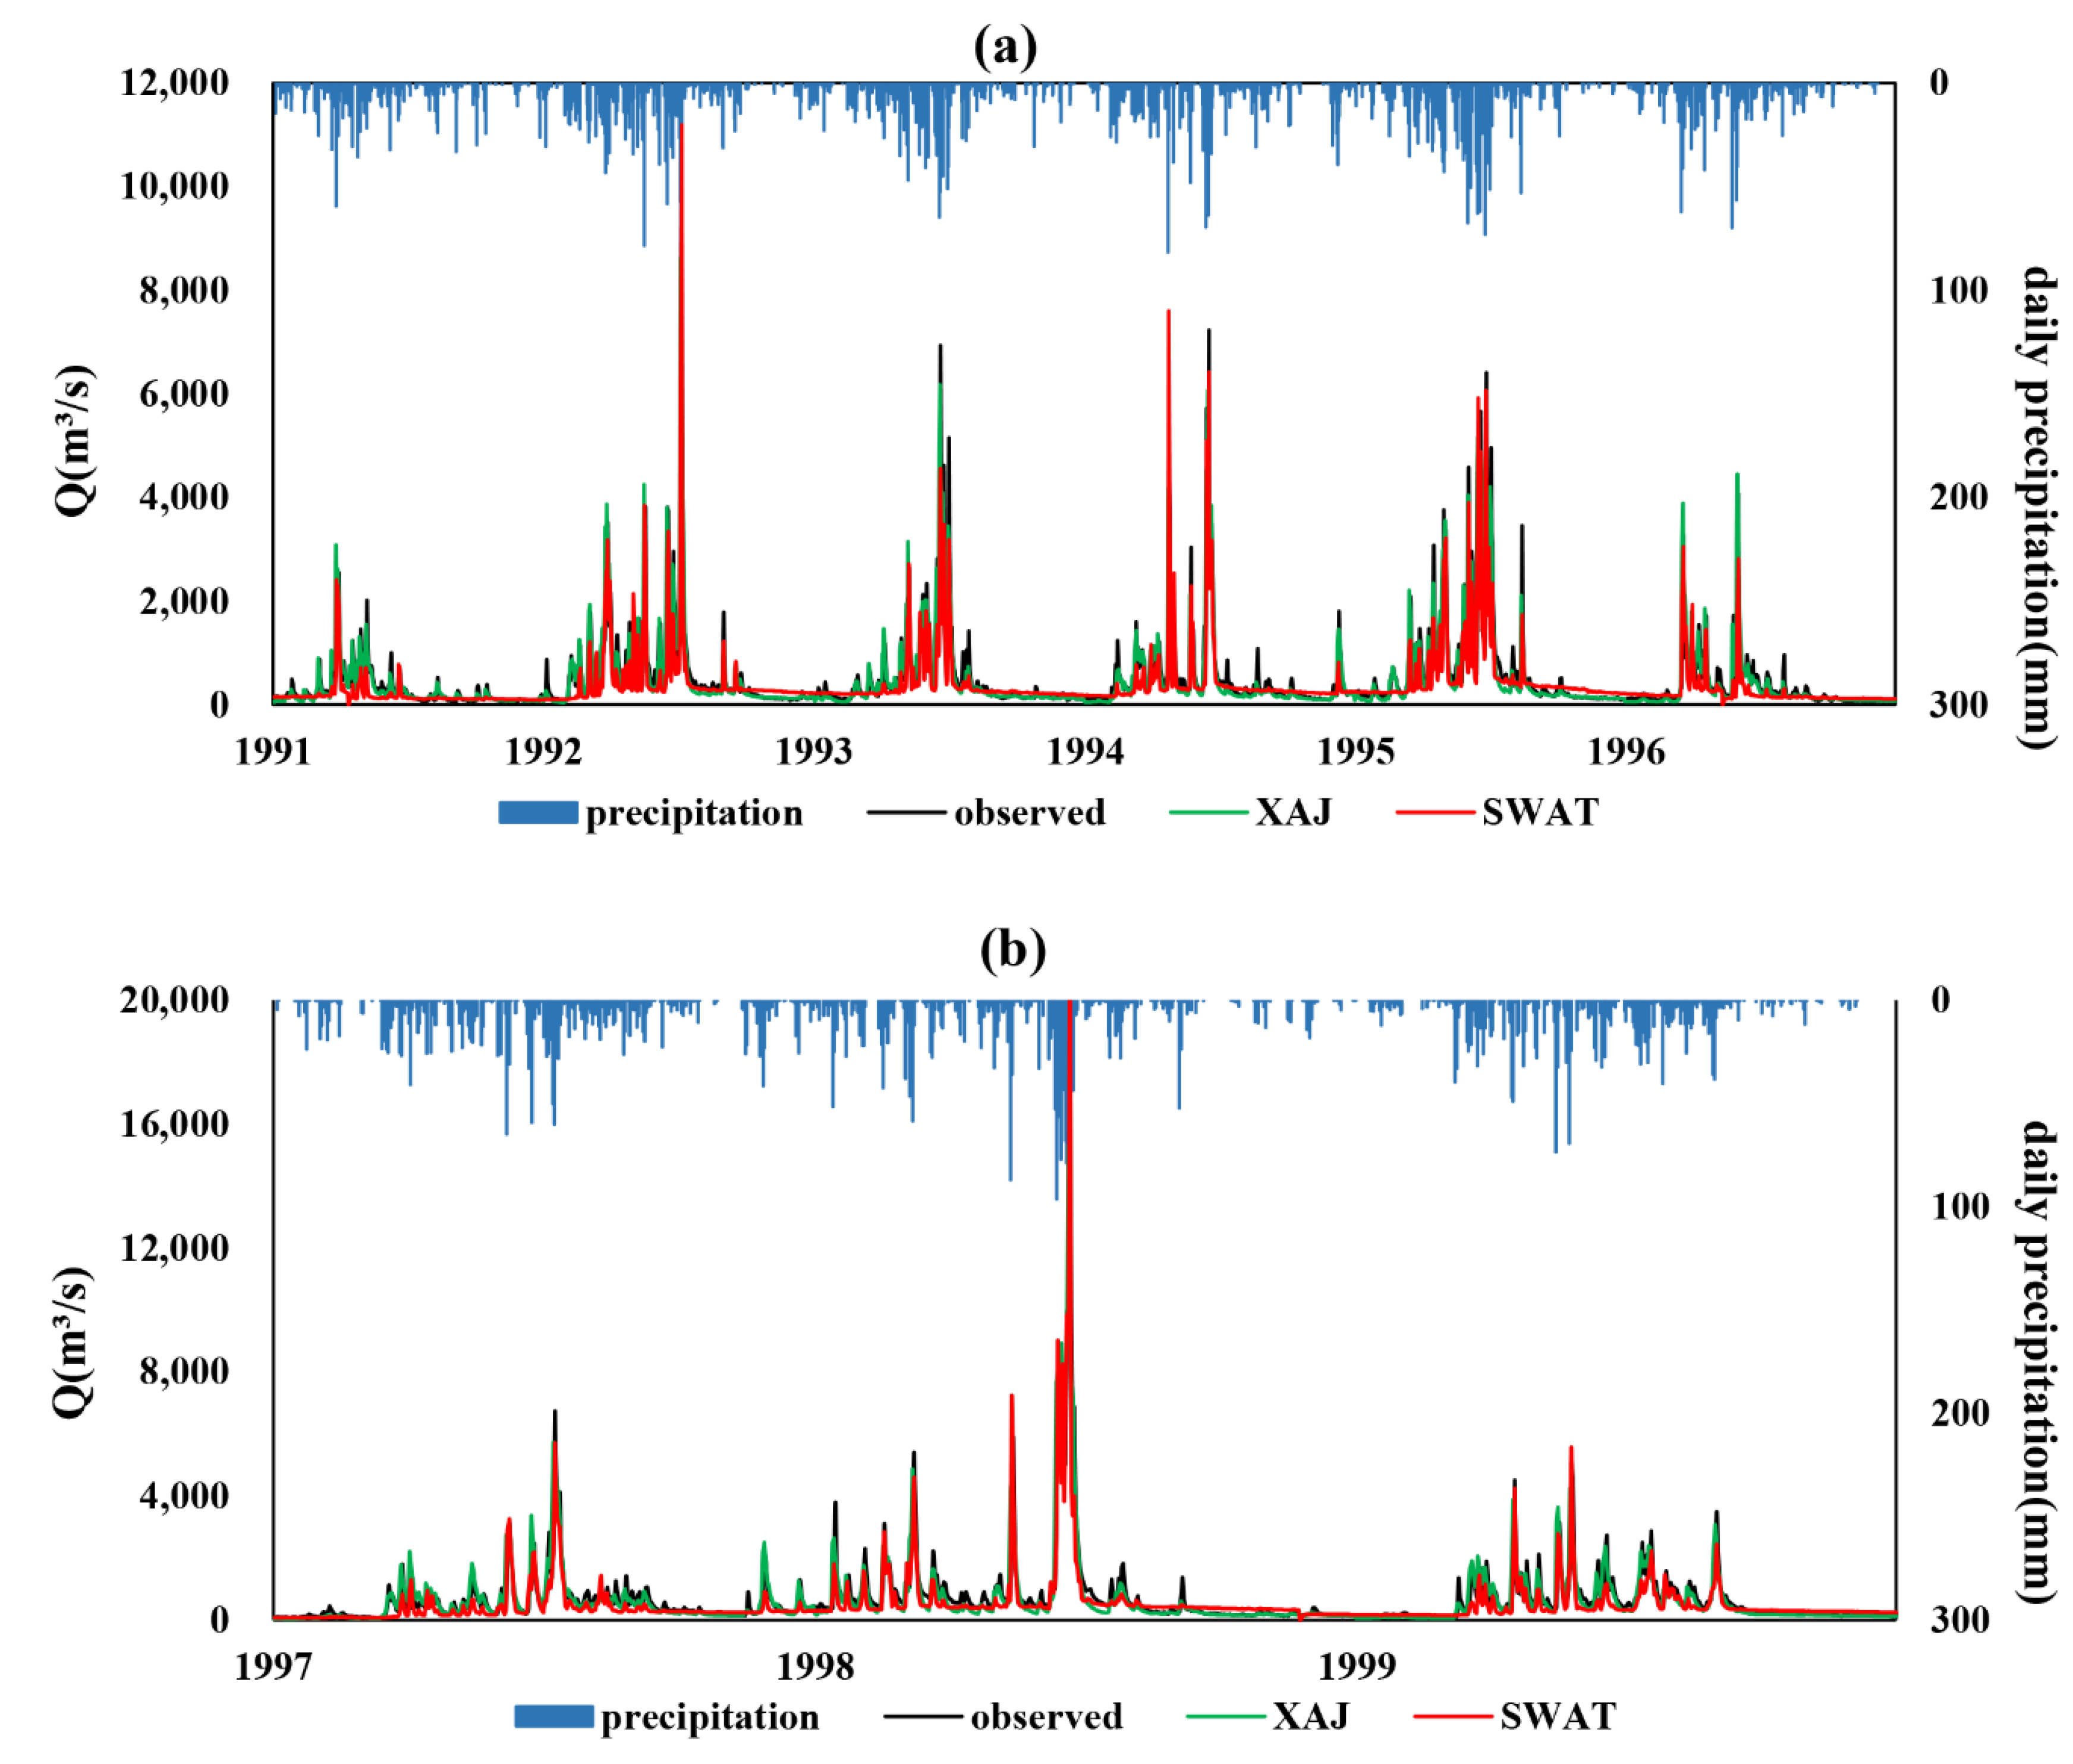
The performance of the SWAT model was nearly positively correlated with precipitation. The annual precipitation for 1992, 1995, 1997 and 1998 were all above 2000 mm. Simulation of daily discharge of these years was better in terms of R
2 and NSE. The annual precipitation for 1991 and 1996 was smaller and the simulation of these two years was much worse.
Figure 3a, b show the time series of observed data and simulation results of the XAJ model and the SWAT model during the calibration and validation periods. During both the calibration and validation periods, the SWAT model simulated better than the XAJ model during flood season. This is very important because about 60% of the precipitation fell in flood season. Generally, the daily simulation results obtained from the XAJ and SWAT models demonstrated decent applicability and could consequently represent a preliminary basis for further event-based floods simulation.
3.3. Analysis of Model Performance in Flood Simulation
3.3.1. Simulation Results
Calibration and validation of the sub-daily SWAT model in flood simulation were conducted using SWAT-CUP and a few modifications were made to it to accommodate the hourly time-scale input. The results of calibration and validation for XAJ and the sub-daily SWAT model are listed in
Table 5. During the calibration period, the sub-daily SWAT model performed better than the XAJ model with R
2 ranging from 0.5 to 0.89 and NSE ranging from 0.33 to 0.85, compared with 0.07 to 0.92 and 0.2 to 0.92 of R
2 and NSE for the XAJ model, respectively. During the validation period, both of these models improved. The average R
2, NSE and PBIAS for the SWAT model was 0.73, 0.56 and −6.76, respectively, and the average R
2, NSE and PBIAS for the XAJ model was 0.65, 0.50 and −2.88, respectively. Generally, the SWAT model did better than the XAJ model according to R
2 and NSE. The results of NSE values were better than a previous study [
18], as the model had been calibrated and validated over flood periods only.
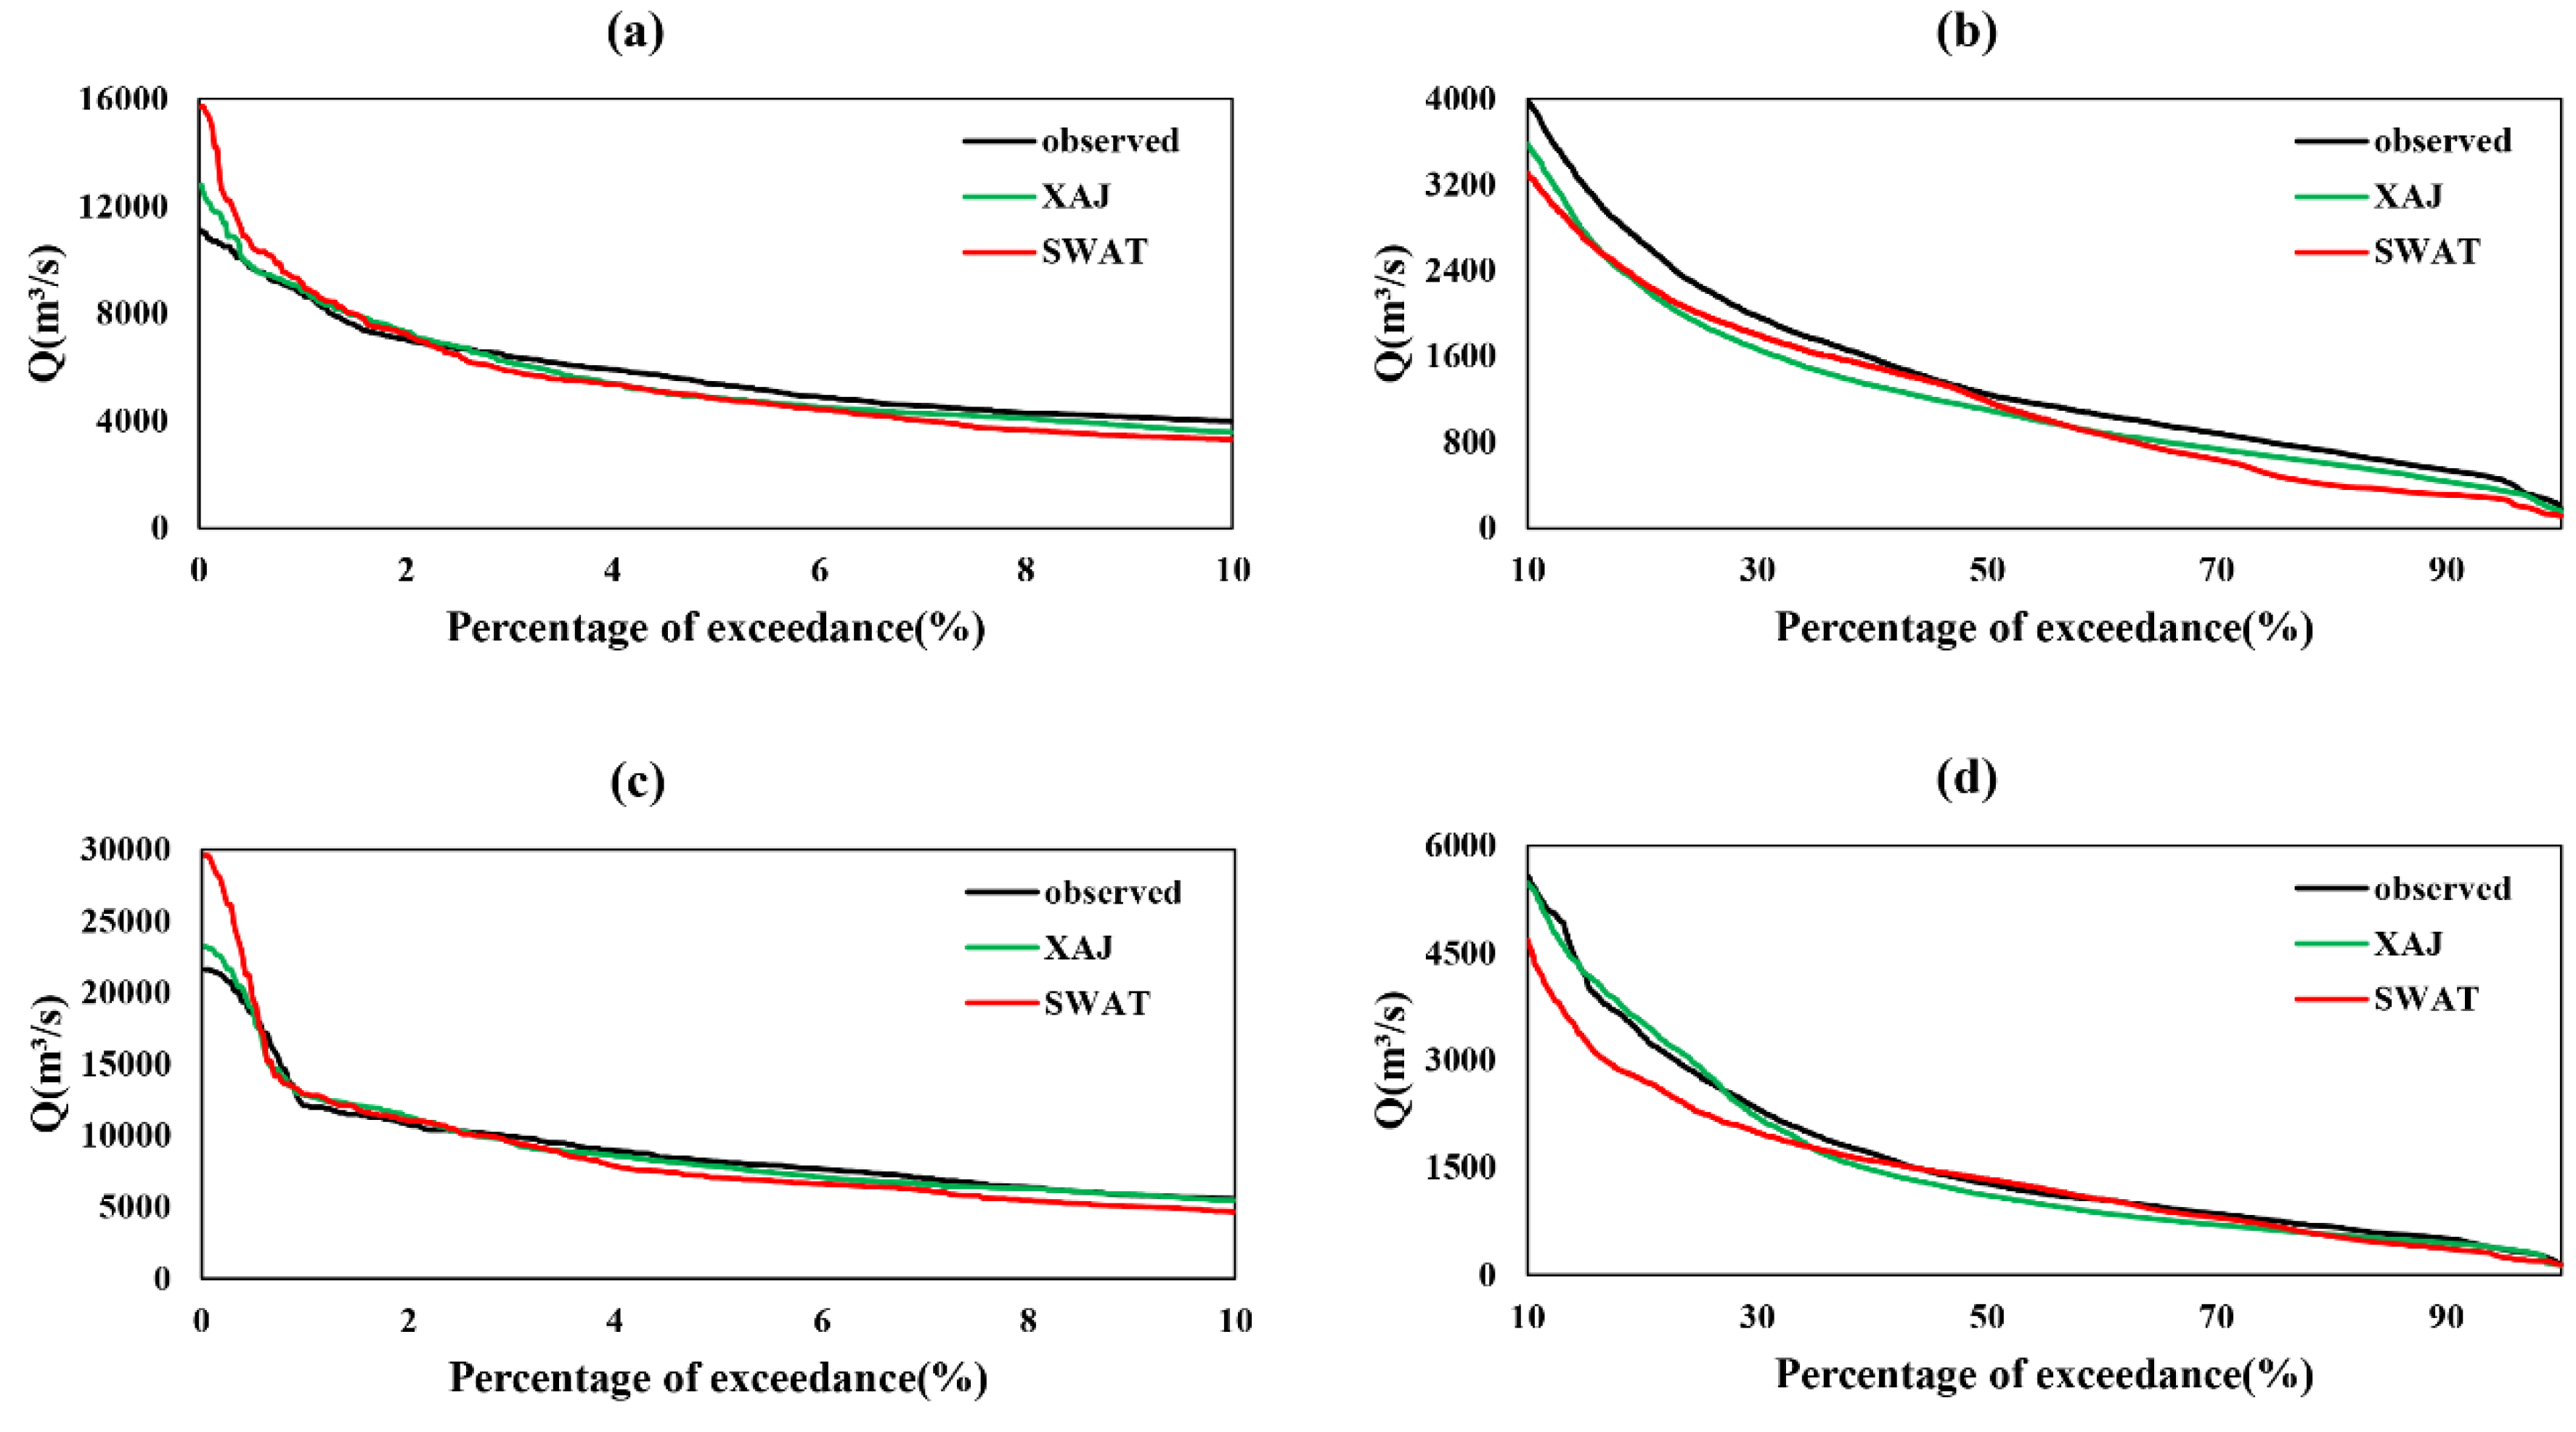
We also plotted flow duration curves (FDCs) in
Figure 4 to evaluate the agreement between observations and simulations. Both the XAJ and SWAT models overestimated extreme high flows (<1% exceedance) during calibration and validation periods, and it was further obvious in the SWAT model. While the SWAT model could capture high flows (~2% exceedance) perfectly. During the calibration period, the SWAT model predicted better in terms of medium flows (~50% exceedance) but had a poor performance in terms of low flows. During the validation period, it was the opposite. The XAJ model performed satisfactorily in estimating medium flows while the SWAT model had better agreement in low flows. Both of the two models overestimated high flows and underestimated low flows as a whole. The models responded differently to extremely high and extremely low flows. Therefore, the responses of the models to different conditions [
39,
40,
41] need further study.
3.3.2. Performance of SWAT and XAJ Model in Event-Based Floods
Table 5 summarizes the statistical performance measures for runoff, peak flow and occurrence time of peak flow. During the calibration period, the average RRE and RPE of the XAJ model were −8.78% and 11.59%, respectively, while the two values of the SWAT model were −13.06% and −7.82%, respectively. The SWAT model simulated better in terms of RPE. During the validation period, it showed the same conclusion. The distributed model consistently performed better than the lumped model in simulating peak flow [
42]. However, we need to consider the simulation of each single event-based flood to evaluate the event-based flood simulation capability of the SWAT model. Depending on the standard, the XAJ model simulated better than SWAT. There were four floods unqualified during the calibration period and three floods unqualified during the validation period. Meanwhile, there were six floods and four floods unqualified during the calibration and validation periods of the SWAT model, respectively. Both the XAJ and SWAT model reproduced the event-based floods fairly well. The error of occurrence time of peak flow (PTE) for each flood was also calculated. The SWAT model performed better than the XAJ model. The average values of PTE of the SWAT model during calibration and validation period were −6 h and −2 h, respectively, while the average values of the XAJ model were 18 h and −3 h, respectively. Both the XAJ and SWAT models could simulate the occurrence time of peak flow well during the validation period. However, the XAJ model predicted unsatisfactorily during the calibration period with the average PTE of 18 h, which indicated that the peak flow simulated by the XAJ model occurred later than the measured peak flow overall. The SWAT model can capture the occurrence time of peak flow perfectly and this is crucial for flood forecasting.
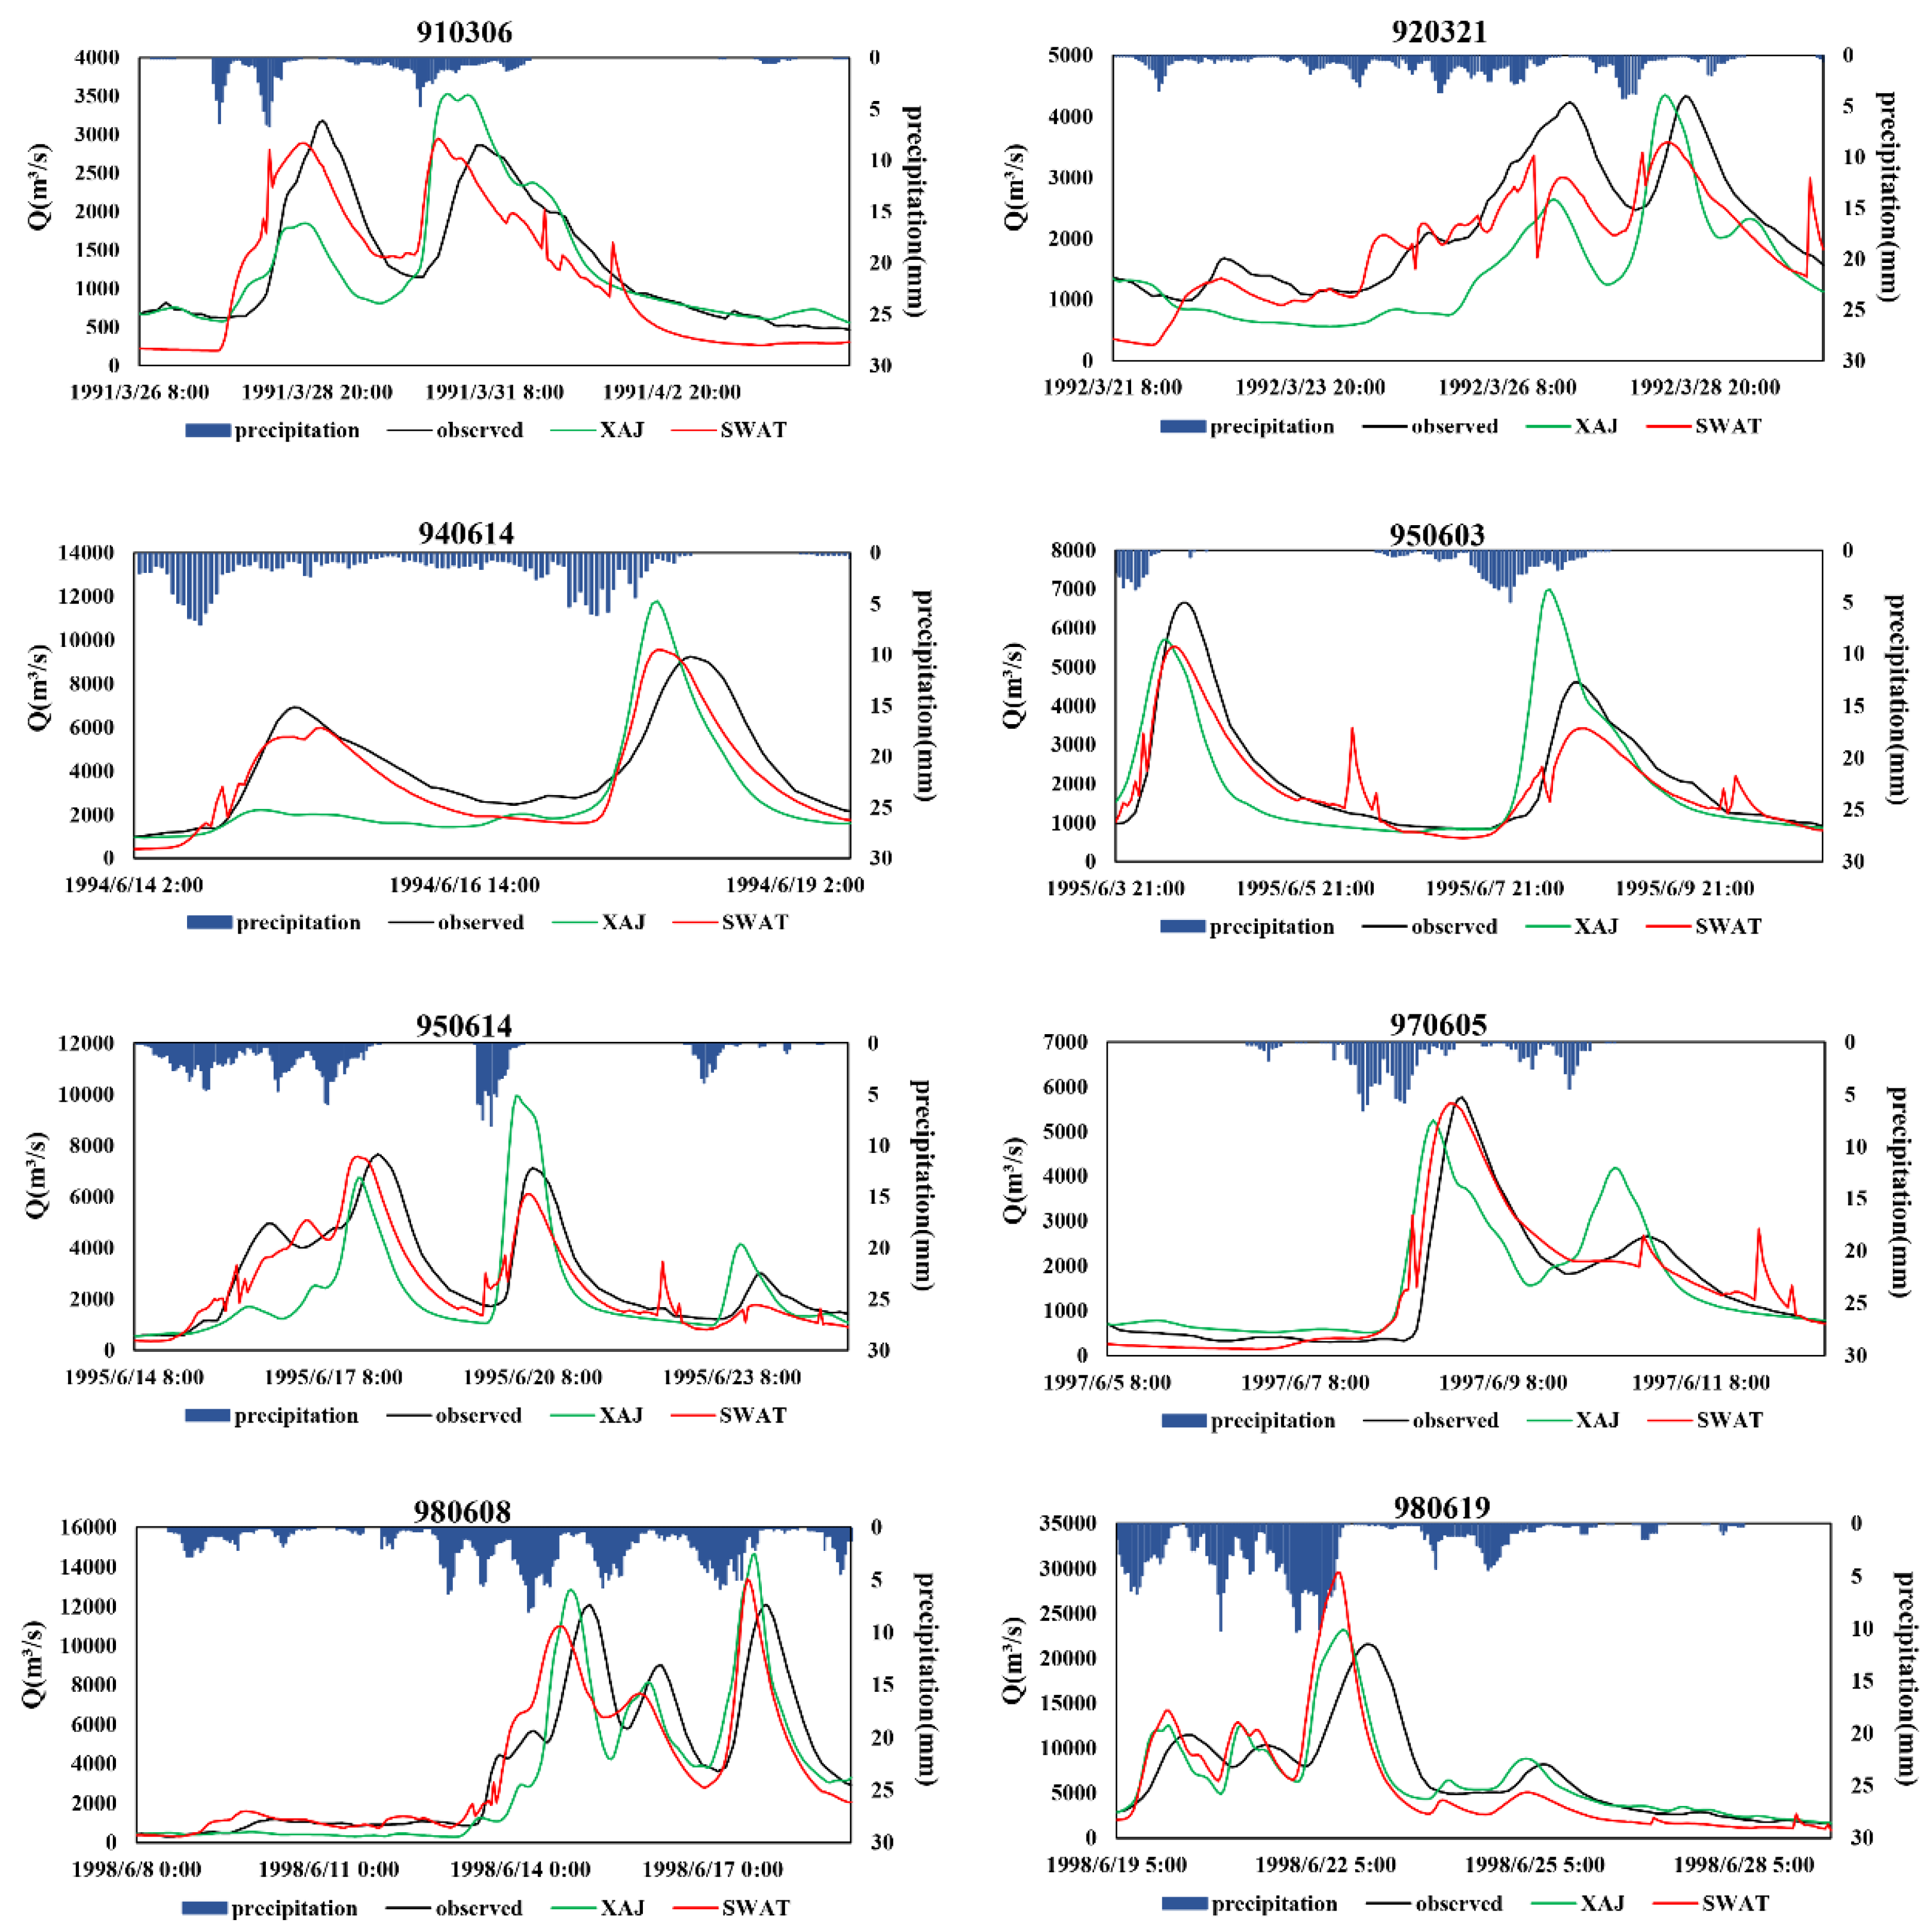
Figure 5 compared observed and simulated discharges by XAJ and SWAT models for eight event-based floods. The SWAT model had a poor performance in the beginning of most floods and it was particularly evident in the first flood of the year (Flood 910306, 920321 and 970605). It tended to underestimate the low flows. It is implied that antecedent conditions are very important for the model simulation [
16]. In the XAJ model, initial hydrological information of event-based floods, such as soil moisture content, was captured through daily simulation. Even though we used the same method in the SWAT model, the results were still limited by precipitation data. As mentioned above, hourly precipitation data were only available during floods and the data during non-flood periods were obtained from daily precipitation. This may bring some error to the calculation of initial hydrological information of floods, especially the first flood of the year. The rain gauges resolution and accuracy of measurements were very important and may affect the model outputs [
43]. During extreme events, precipitation measurements may not be accurate [
44]. Therefore, in extreme flood (Flood 980619), the SWAT model vastly overestimated the peak flow. The same conclusions could also be found in the FDCs. Recession flows were also badly simulated. This might be ascribed to the calculation of base flow. Base flow was calculated at daily time-scale and had an equal distribution of the daily estimates to each time step. Though the SWAT model had a poor performance in low flows, it had an improvement in simulating high and medium flows [
15,
18]. As mentioned above, the SWAT model performed better in terms of RPE, and this is particularly evident in the picture (Flood 940614, 950614, 970605 and 980608). It is worth noting that all of these floods had multiple peak flows. This showed that the SWAT model was capable of capturing multiple flood peaks accurately.
3.4. Effect of Spatial Scale on SWAT Model
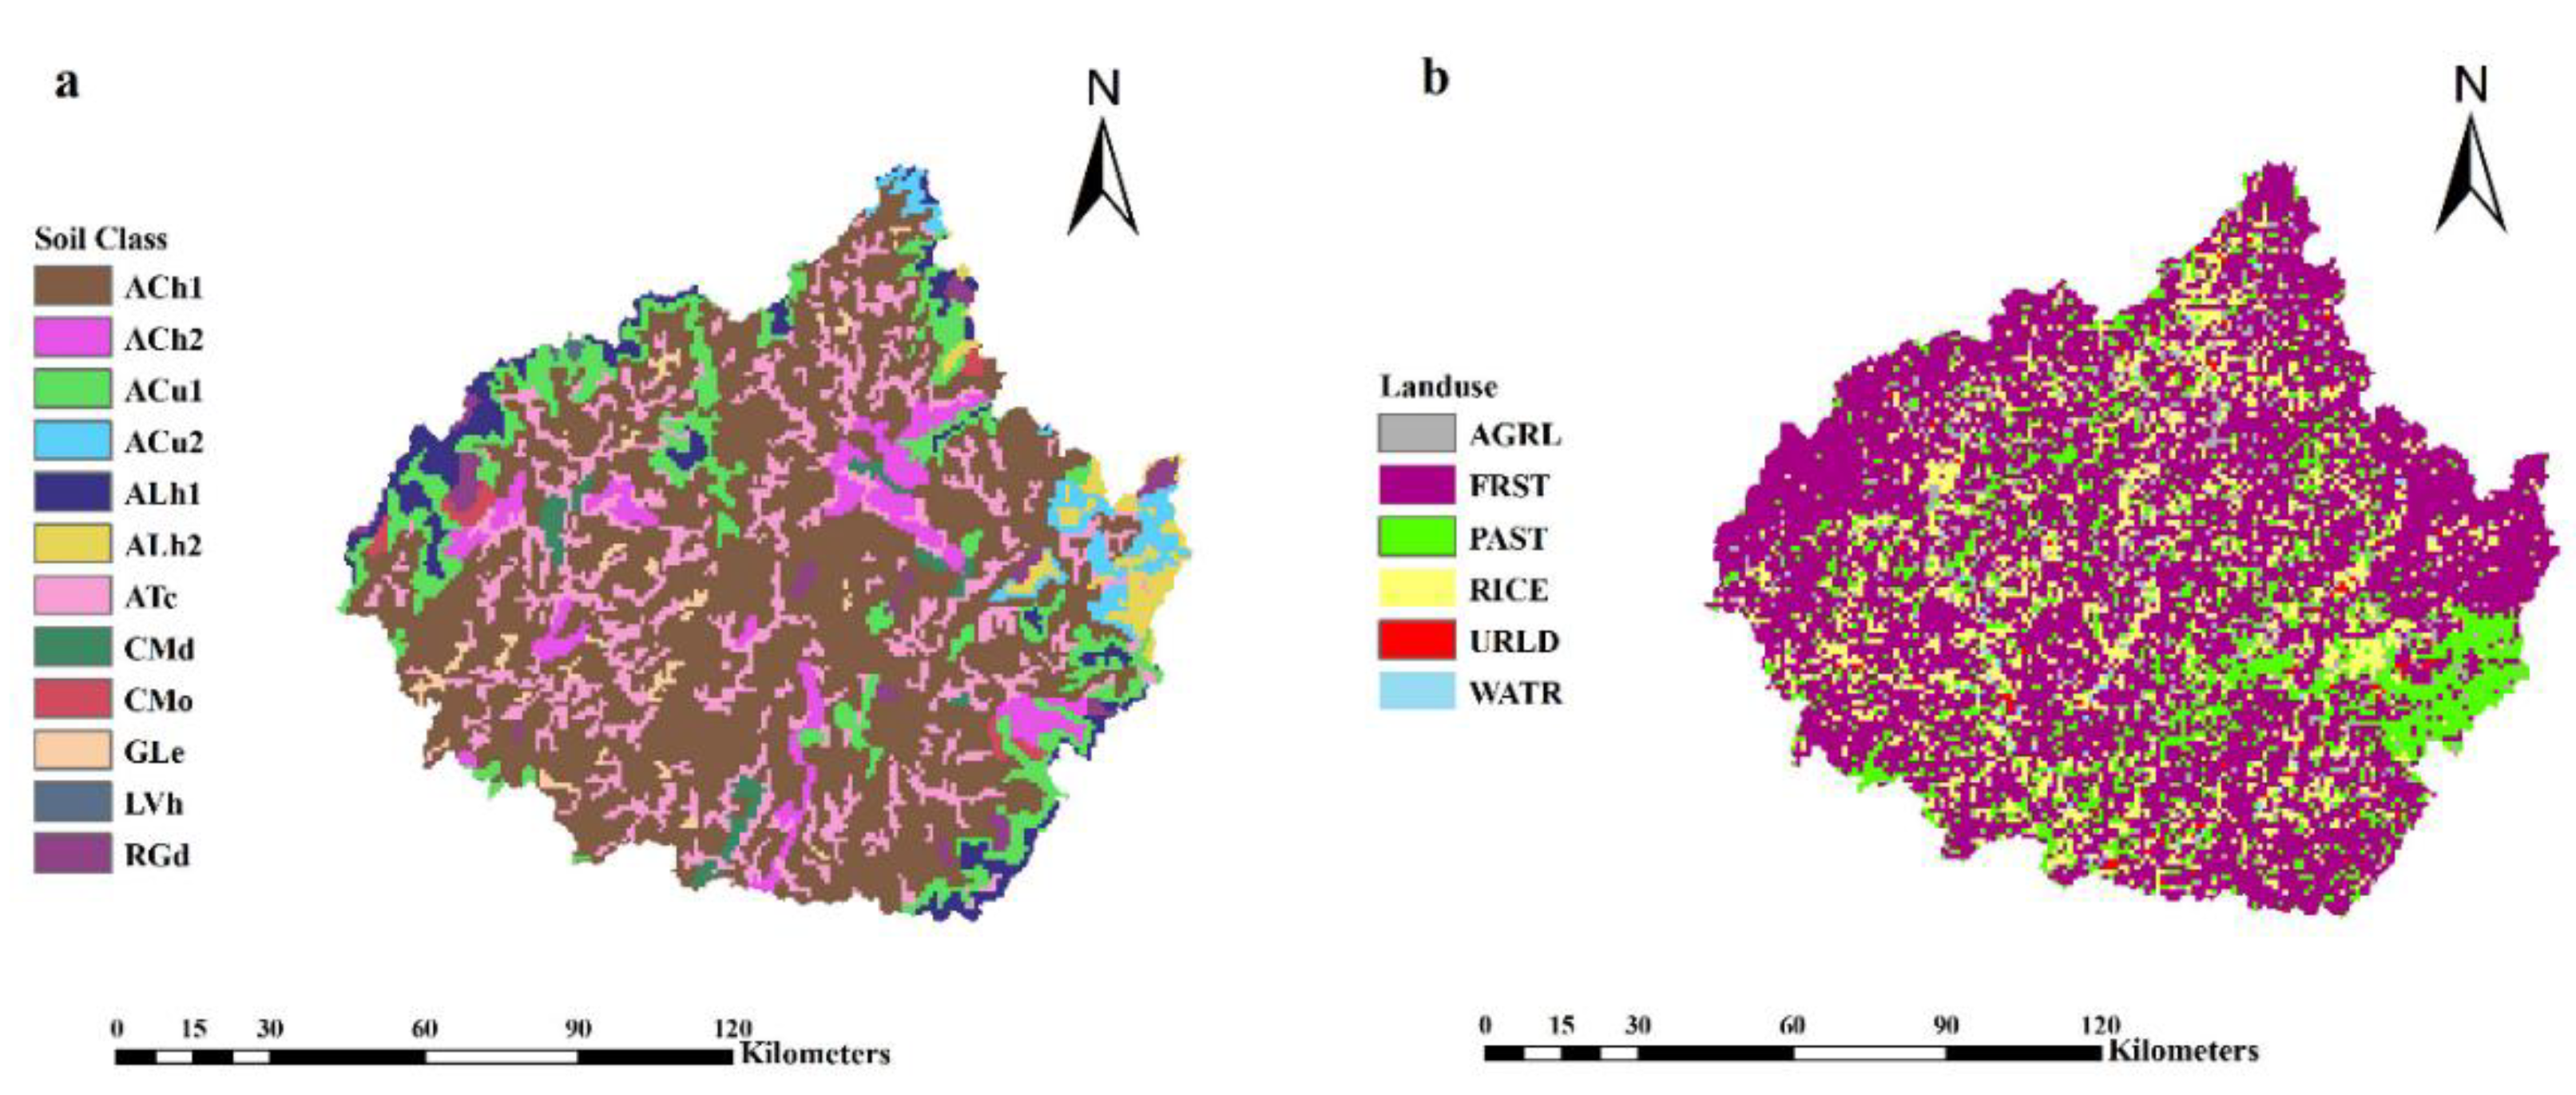
Due to the spatial heterogeneity of hydrological conditions of a river basin, such as topography, land use and soil type, hydrological phenomena also change accordingly. Research on the spatial scale is very important for the application of hydrological models. It is of great practical significance to utilize the hydrological data of a larger basin to deduce the hydrological characteristics of a smaller watershed.
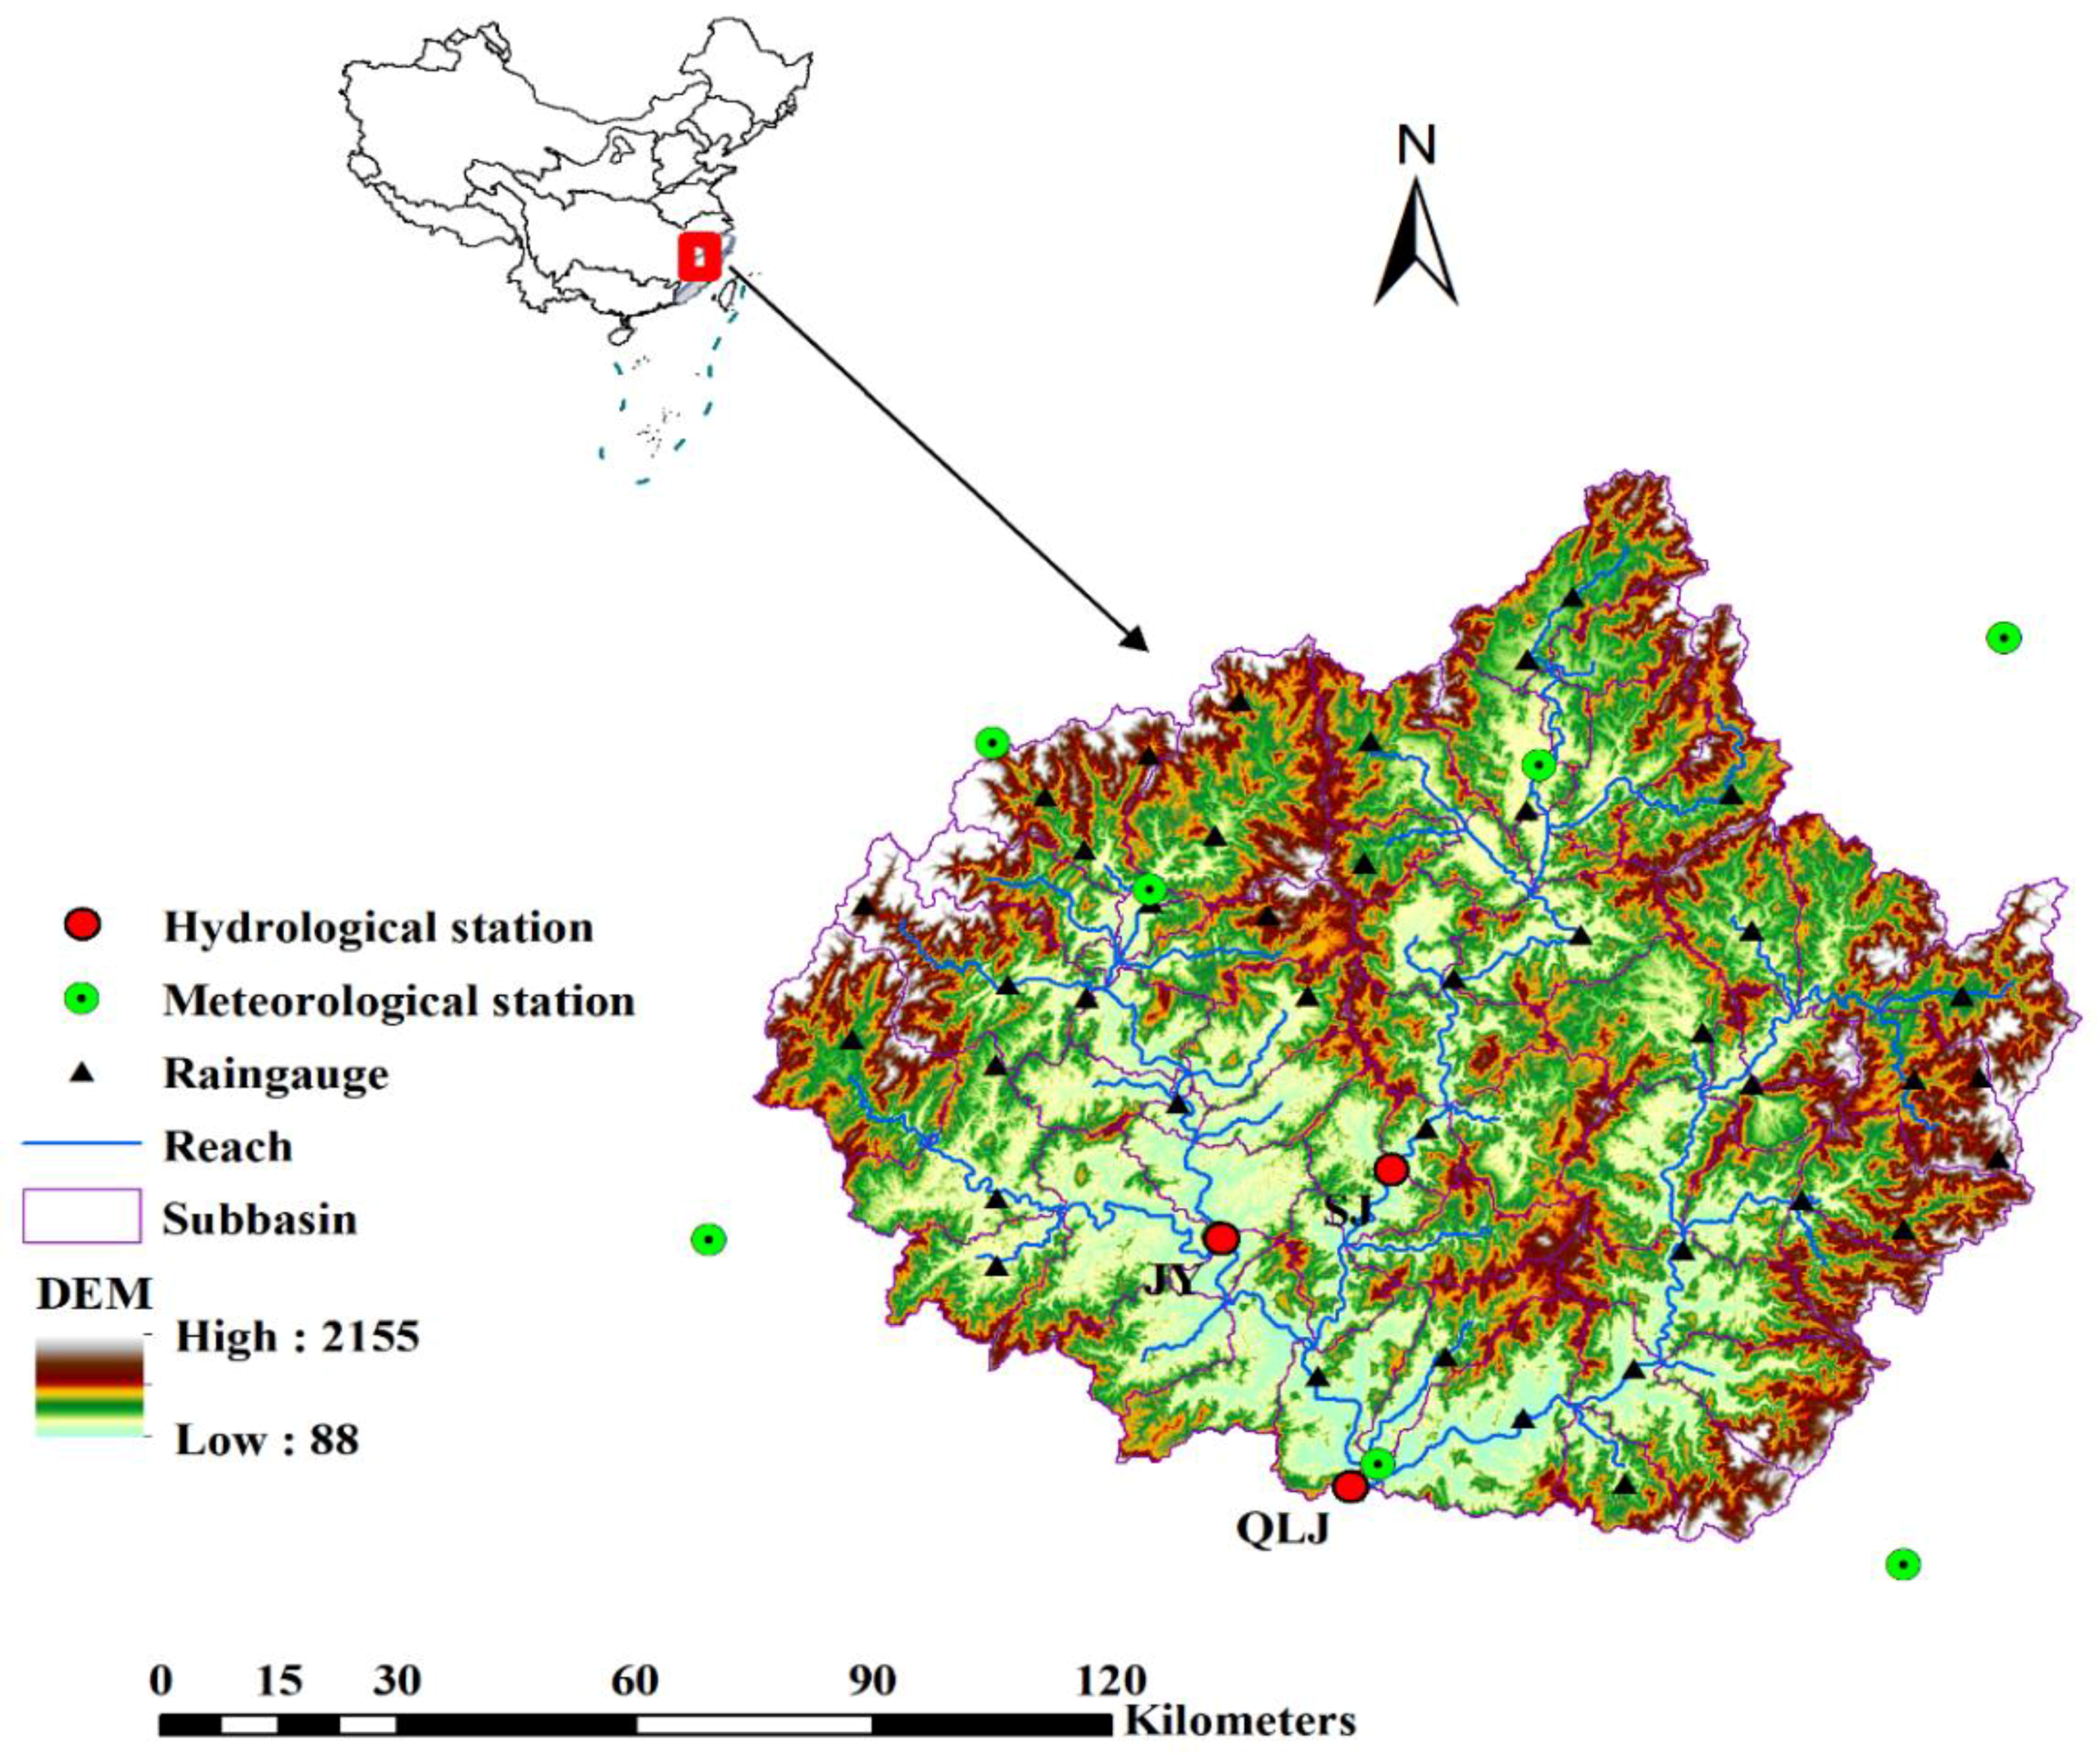
To evaluate the effect of spatial scale on the SWAT model, the team took JY and SJ station as an example. Their locations are marked in
Figure 1 and the basic information of these three stations is presented in
Table 6. The catchment areas of JY and SJ station were much smaller than the area of QLJ station. There were also some differences in their land use and soil types. We simulated floods in JY and SJ stations using the parameters calibrated by QLJ station and calculated R
2, NSE and PBIAS for each flood.
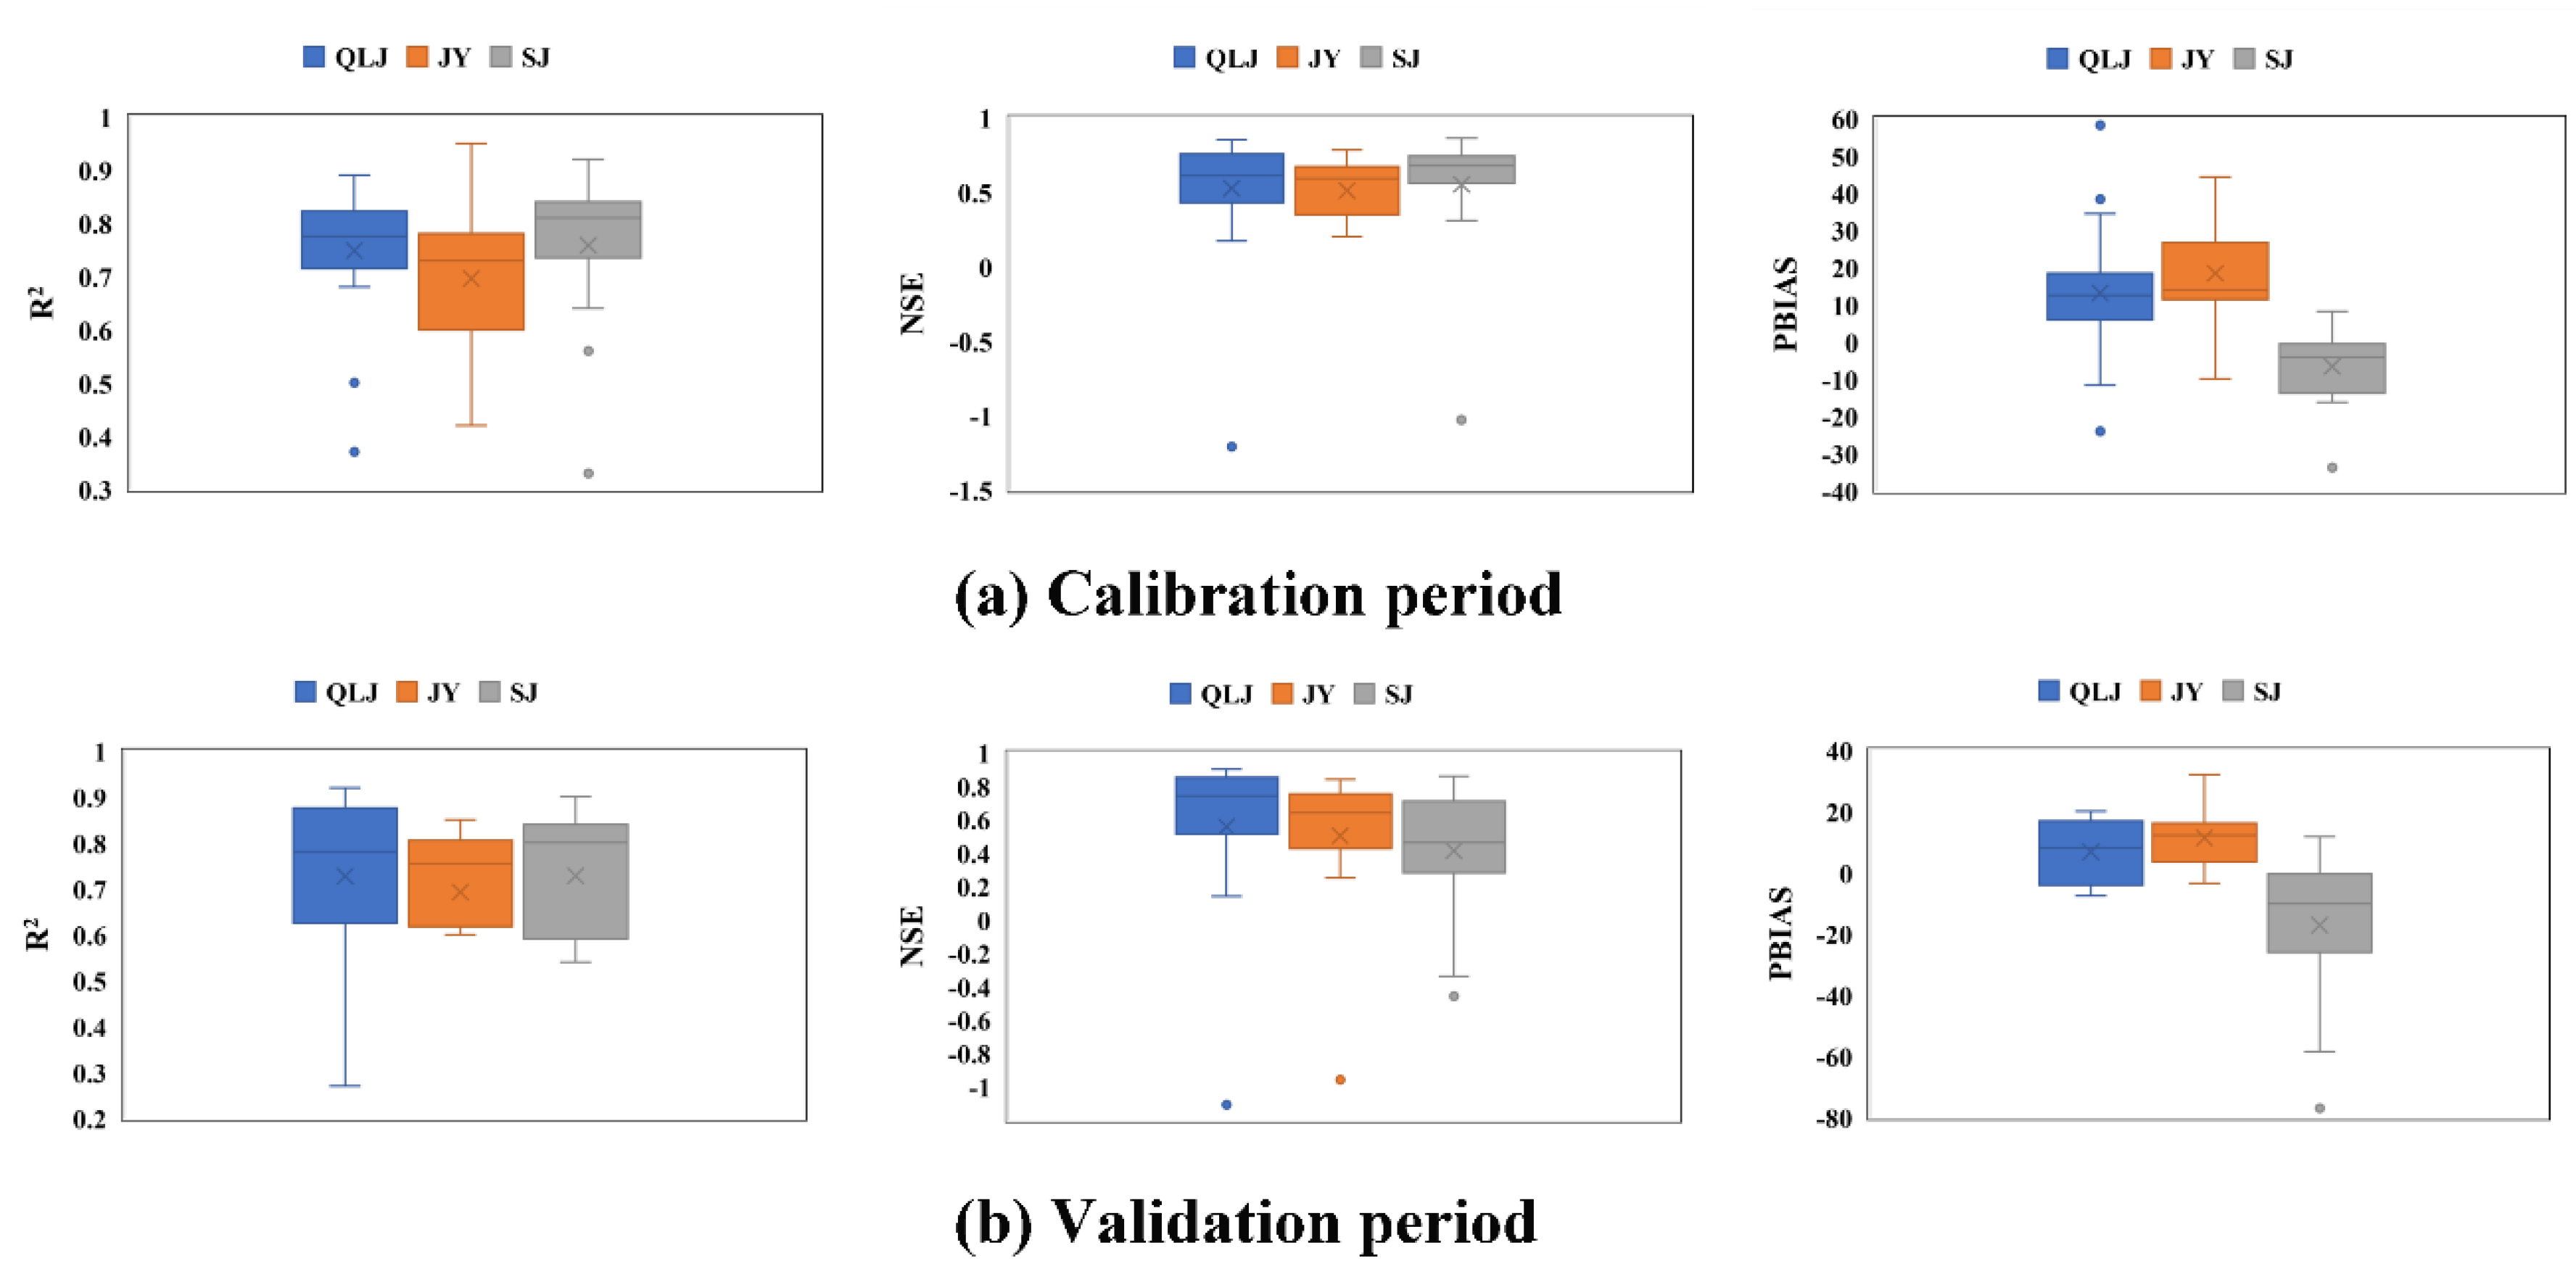
Figure 6 shows the boxplots of R
2, NSE and PBIAS for these three stations. During the calibration period, R
2 and NSE of these stations did not change much. However, they had a different reaction according to PBIAS. The PBIAS values of QLJ and JY station were 13.06 and 18.42, respectively, while the PBIAS value of SJ station was −6.28. It is implied that the SWAT model underestimated flow regimes in QLJ and JY stations but overestimated flow regimes in SJ station. On the whole, SJ station behaved the best during the calibration period. During the validation period, the SWAT model performed better in QLJ station. JY station showed good consistency with QLJ station while SJ station had the worst performance.
The qualification ratios of these three stations were also summarized according to the standard mentioned above. In QLJ station, there were 25 floods qualified among 36 floods, the qualified ratio was 69.4%. While there were 20 floods qualified among 33 floods in JY station and 20 floods qualified among 30 floods in SJ station. The qualified ratio was 60.6% and 66.7%, respectively. Among 25 floods qualified in QLJ station, 16 floods were likewise qualified in JY station and 14 floods were qualified in SJ station. About half of the floods qualified in QLJ station were qualified in JY and SJ station simultaneously. The results showed that the SWAT model had a good applicability at different spatial scales.
4. Conclusions
The SWAT model has been extensively used for long-term simulations with daily, monthly or yearly time-scales. This paper developed the sub-daily SWAT model for Qilijie basin. We evaluated the sub-daily SWAT model in flood simulation and compared it with the XAJ model.
Both the XAJ and SWAT models behaved satisfactorily in the simulation of event-based floods and had a similar qualified ratio. The XAJ model performed better than the sub-daily SWAT model in terms of RRE, but sub-daily SWAT had a better performance in reproducing peak flow and was good at capturing the occurrence time of peak flow. The sub-daily SWAT model had an improvement in simulating high and medium flows and had showed its capacity of simulating floods with multiple peaks accurately. Hence, the SWAT model has great potential for flood simulation.
The effect of spatial scale on the SWAT model was also evaluated in this research. The results showed that the SWAT model had a good applicability at different spatial scales and could deduce the hydrological characteristics of a smaller watershed using parameters from a larger basin. This is a valuable reference to research the effect of spatial scale on hydrological models.
However, the performance of the SWAT model in flood simulation was affected by precipitation data. Hourly time-scale precipitation data were only available during flood seasons in China and we estimated hourly precipitation during non-flood periods by assuming a uniform distribution in daily precipitation. Hence, the SWAT model simulated badly in the beginning of floods and it would perform better with accurate precipitation input. The SWAT model also performed poorly in estimating low flows and this might be attributed to the daily calculation of base flow. The feasibility of using the sub-daily SWAT model for flood simulation in large regulated regions remains to be further studied.

 ,
, 


