Article

Investigation on the Effect of Structural Parameters on Cavitation Characteristics for the Venturi Tube Using the CFD Method

1
Research Centre of Fluid Machinery Engineering and Technology, Jiangsu University, Zhenjiang 212013, China
2
Department Ingeniera Rural y Agroalimentaria, Unidad Hidráulica, Universitat Politècnica de València, C/Camino de Vera s/n, 46022 Valencia, Spain
*
Author to whom correspondence should be addressed.
Water 2019, 11(10), 2194; https://doi.org/10.3390/w11102194
Submission received: 30 August 2019 / Revised: 8 October 2019 / Accepted: 18 October 2019 / Published: 22 October 2019
(This article belongs to the Special Issue Pipeline Fluid Mechanics)

Abstract

:
The venturi tube is a special kind of pipe which has been widely applied in many fields. Cavitation is one of the most important research issues for the Venturi tube. Hence, three key structural parameters (contraction angle, diffusion angle and contraction ratio) were selected to investigate the influence of different factors on cavitation characteristics, using the computational fluid dynamics (CFD) method. A series of experiments for measuring the relationship between differential pressure and flow rate were carried out to verify the accuracy of the simulation method. Results showed that the simulation results had a high accuracy and the numerical method was feasible. The average vapor volume fraction of cross-section from the throat in the axial direction increased with increasing contraction angle. The cavity length increased with increasing contraction angle. The average volume fraction in the diffusion section rapidly decreased with increasing diffusion angle. The diffusion angle had no significant effect on the cavitation characteristics in the throat section and had a significant influence in the diffusion section. The average vapor volume fraction increased with decreasing contraction ratio. The contraction ratio had no significant effect on the cavity length under the same differential pressure. The average vapor volume fraction increased with decreasing contraction ratio. However, the variation in the throat section was less than the diffusion section. Under the same inlet and outlet pressure, the cavity lengths for different contraction ratios were basically the same, which indicated that the contraction ratio had no significant effect on the cavity length.

1. Introduction

The venturi tube is a special kind of pipe which has been widely applied in pipeline flow measurement, internal combustion engine pressurization systems, natural gas transmission, industrial waste gas cleaning, and dust removal [1,2]. Pak and Chang [3] developed a computational model for the interactive three-phase flow in a Venturi scrubber to estimate pressure drop and collection efficiency. Zhao et al. [4] installed a Venturi after the intercooler in order to improve a diesel engine’s introduction ability to recirculate the exhaust gas. Wang et al. [5] developed a novel type of Venturi ejector reactor to overcome the insufficiency of chemical reaction in the stirred-tank reactor in a yellow phosphorus purification system. Quiroz-Pérez et al. [6] presented a theoretical analysis of the effect produced by Venturi devices in gas wells.
The effects of the structural parameters of the Venturi tube and differential pressure on velocity and pressure distribution, pressure drop, and mass flow rate have already been widely investigated. Ghassemi and Fasih [7] designed three small size Venturis with different throat diameters and investigated the effect of throat diameter on mass flow rate. Sun and Niu [8] studied the effect of the structural parameters (such as throat taper, throat contraction ratio, and throat length) on the hydraulic performance (such as outlet average velocity, minimum pressure, and critical pressure) and established a power function relationship between the outlet average velocity and differential pressure. Ashrafizadeh and Ghassemi [9] studied the effects of upstream and downstream pressures, as well as structural parameters, such as the throat diameter, throat length, and diffuser angle, on the mass flow rate and critical pressure ratio. Lu et al. [10] conducted a series of experiments to investigate the effect of geometry parameters (contraction angle, throat diameter, throat length and diffusion angle) on the conveying properties and on the pressure reduction effects in the flow of gas–solid mixtures through the Venturi tube. Manzano et al. [11] analyzed their influence of structural parameters on the velocity distribution. Zhang [1] investigated the influence of the contraction ratio, the ratio of the throat section length to diameter, the diffusion angle and the differential pressure between inlet and outlet on the mass flux and asymmetric flow.
According to Bernoulli’s Principle, the liquid velocity in the throat section increases when liquid passes through the Venturi tube. As a result, the pressure in the throat section simultaneously decreases until it reaches the saturated vapor pressure of the liquid. At this time, cavitation begins to occur at the throat and diffusion section and a mixture flow of vapor and liquid generates in this region. More and more studies have shown that the hydrodynamic cavitation can evidently promote the decomposition of harmful substances [12,13,14,15]. Kim et al. [16] investigated the feasibility of the Venturi cavitation system for sludge pretreatment to increase biodegradability and found that cavitation was beneficial in increasing biodegradability. Wang et al. [17] conducted an experiment to investigate the effect of hydrodynamic cavitation on TiO2 photocatalytic degradation of tetracycline by using a Venturi tube and found that hydrodynamic cavitation had a positive role and can prevent photocatalytic particles from agglomeration. Boczkaj et al. [18] indicated that the hydrodynamic cavitation can reduce the total pollution load in the effluent from the production of bitumens in advanced oxidation processes. Thanekar et al. [19] demonstrated that hydrodynamic cavitation combined with ozone can be effectively used as pretreatment for improving the biodegradability of Dichlorvos (DDVP). Hence, with the development of such technologies, the Venturi tube has already been widely used in wastewater treatment because of its cavitation characteristics.
For the cavitation characteristics of the Venturi tube, many studies have been conducted on the emergence and development of cavitation, the instability of cavitation and the effect of cavitation on hydraulic performance. Sato et al. [20] observed the various behaviors of a traveling bubble cavitation in a Venturi from inception to collapse using a high-speed video camera system. Cai et al. [21] analyzed the effects of liquid temperature, cavitation number and inlet pressure of the Venturi tube on the radial motion of the bubble and the pressure pulse. Abdulaziz [22] conducted an experiment on a small-type Venturi tube under varying upstream, throat, and downstream conditions, proposed a model to predict the water vapor void fraction, and reported that the average vapor void fraction in a cavitating Venturi was mainly dependent on the pressure ratio. Brinkhorst et al. [23] contrastively analyzed the cavitation characteristics for a Herschel-Venturi Tube and International Organization for Standardization (ISO) 9300 toroidal nozzle using the computational fluid dynamics (CFD) method. Chen et al. [24] indicated that the quasi-periodic pressure fluctuations in sheet/cloud cavitation were highly related with the time evolution of the cavitation behaviors and the acceleration caused by the changes in the cavity volume was the main source of the excited pressure fluctuations. Tomov et al. [25] studied the development process of cavitation in a transparent horizontal Venturi nozzle by using high-speed photography. Long et al. [26] investigated the global cavitation behavior in a Venturi tube and indicated that the cavity length was only the function of the pressure ratio or the cavitation number, independent of the inlet pressures. Zhu et al. [27] analyzed the unsteady cavitation characteristics of liquid nitrogen flows through a Venturi tube under different pressure ratios and temperatures.
In some applications, the Venturi tube needs to generate cavitation as easily as possible, such as in the aforementioned wastewater treatment. In contrast, the Venturi tube needs to avoid generating cavitation in some other application fields, for instance, the Venturi is used as a chemical injector in irrigation systems and it is necessary to suck as much liquid as possible without generating cavitation at this point. However, few studies have been carried out to evaluate the influence of structural parameters on cavitation capacity. Therefore, the specific objectives of this research were to analyze the influence of key structural parameters on cavitation characteristics for the Venturi tube using the CFD method, and provide references for the engineering design and application.

2. Materials and Methods

2.1. Physical Model

Figure 1 presents a structural diagram of the Venturi tube which consists of a contraction section, a throat section, and a diffusion section. The contraction ratio is defined as the ratio of the diameter of the throat section to the inlet diameter, which can be calculated using the following equation:
γ = d D i n
where γ is contraction ratio, d is throat diameter (mm) and Din is inlet diameter (mm).
Zhang [1] found that the throat length had no discernible effect on the hydraulic performance. Hence, three parameters, including contraction angle, diffusion angle, and contraction ratio, were selected, to investigate the influence of those parameters on cavitation characteristics. The method of single-factor analysis was adopted to conduct a contrast experiment in an item-by-item approach, and to research the influence of the three parameters on cavitation characteristics. Table 1 presents various structural parameters of the Venturi model for CFD analysis. Both the inlet and outlet diameters were 50 mm and the length of throat was 10 mm.

2.2. Mesh Generation

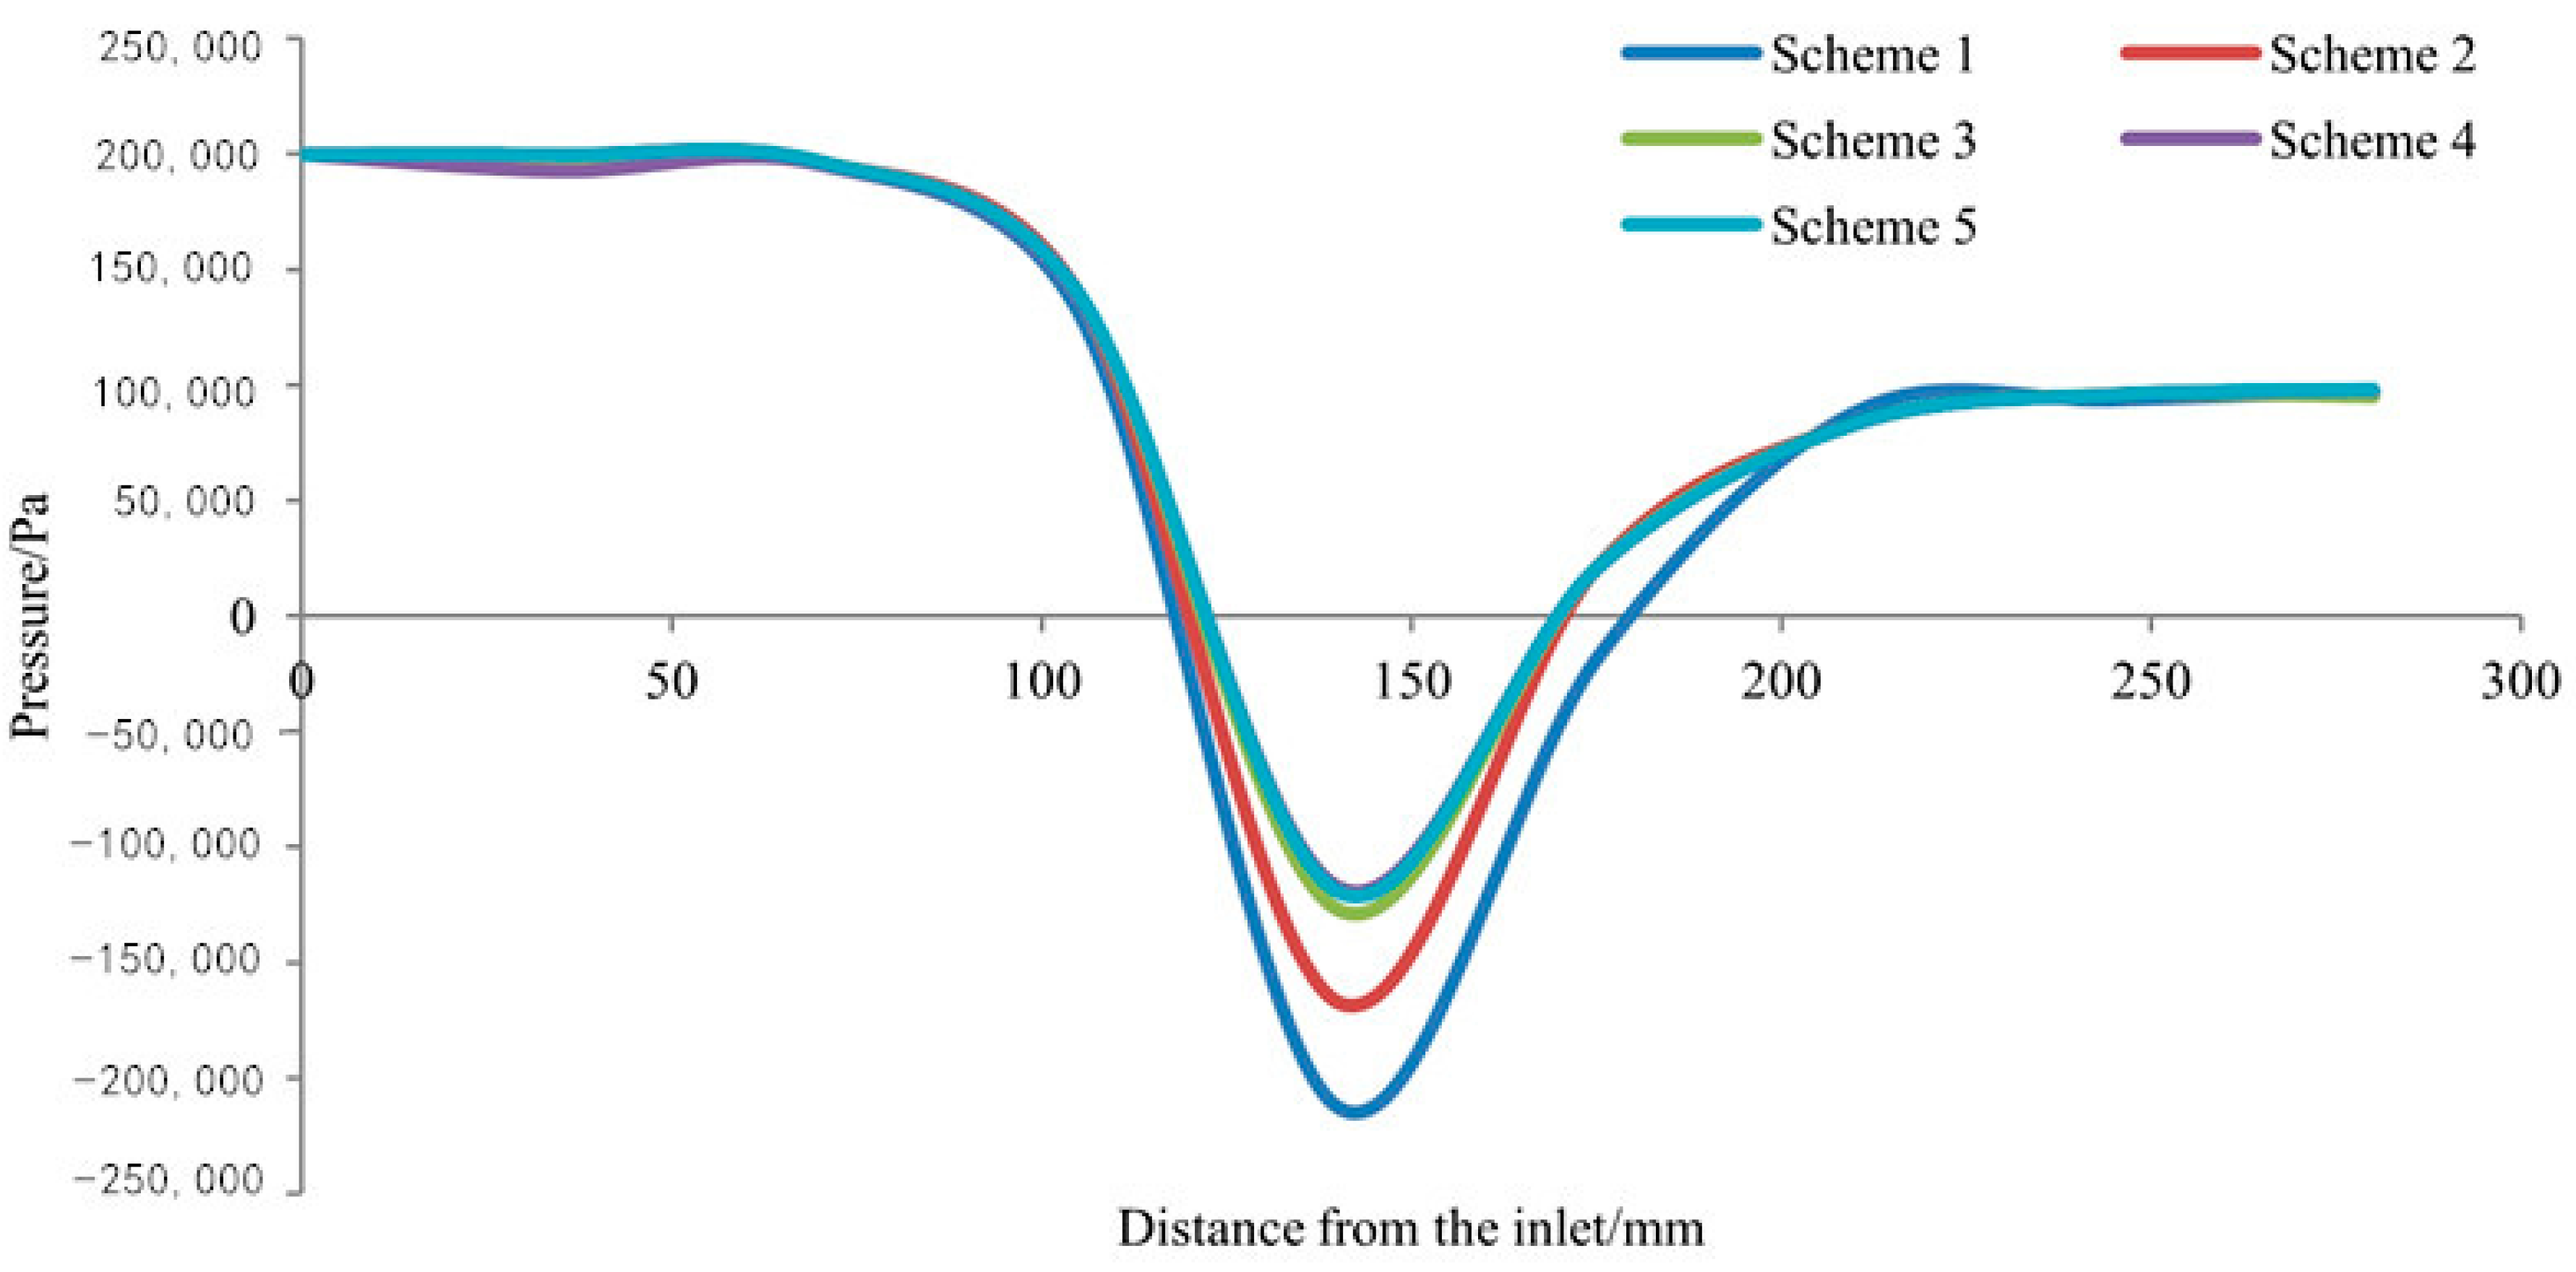
The grid of the computational domain was generated by ANSYS ICEM (ANSYS, Inc. Canonsburg, PA, USA), as shown in Figure 2. The mesh quality has a direct influence on the accuracy of simulation results, and high quality is required in the numerical simulations for improving the accuracy of the result and reducing the computational time. Hence, structured hexahedral cells were used to discretize the computational domain. In order to minimize the influence of grid number on the simulation results, a grid independency test was carried out with five different grid numbers at an inlet pressure of 0.20 MPa and an outlet pressure of 0.10 MPa. The results are shown in Table 2, in which Scheme 3 represents the grid number with the best compromise between accuracy and computational time. This is because the differences in the simulated inlet pressure of the grids with more cells were less than 0.5% of the value of this grid. In order to further test the grid independence, Figure 3 shows the static pressure distribution along the axial with different grid numbers. It can be seen from the Figure 3, for the Scheme 3–5, the static pressure distribution basically had no change as the number of grids increases. Hence, the grid number of about 200,000 was applied to each Venturi model with different structural parameters.

2.3. Numerical Approach

In the present simulation, the governing equations for fluid flow were solved using the CFD software ANSYS CFX. The basic governing equations for the turbulent mixture flow are given by:
ρ m t + ( ρ m u j ) x j = 0
ρ m u i t + ( ρ m u i u j ) x j = p x i + x j [ ( μ m + μ t ) ( u i x i + u j x j 2 3 u k x k δ i j ) ]
where ρm, u, p donate mixed medium density, velocity, and pressure, respectively. x and the subscripts i, j, k represent the coordinate direction. μm is dynamic viscosity of the mixture. μt is turbulent viscosity of the mixture. δij is the Kronecker delta.
For the cavitation simulation, the homogeneous cavitation model that was implemented in ANSYS CFX was carried out. The liquid-vapor mass transfer due to cavitation, governed by the vapor volume fraction transport, is expressed by the following equation:
ρ v α v t + ( ρ v α v v j ) x j = R e R c
where ρv is the vapor density, αv is the vapor volume fraction, and vj is a velocity component in xj direction, Re and Rc are the mass transfer rates correspond to the evaporation and condensation during the cavitation process respectively. In this study, the Rayleigh-Plesset model was applied and the Rayleigh-Plesset equation describing the growth of a gas bubble in a liquid is given by:
R e = F v 3 α n ( 1 α v ) ρ v R B 2 3 p v p ρ l ,   p <   p v
R c = F c 3 α v ρ v R B 2 3 p p v ρ l ,   p   >   p v
where RB is the bubble radius, pv is the pressure in the bubble (assumed to be the vapor pressure at the liquid temperature), p is the pressure in the liquid surrounding the bubbler, ρl is the liquid density, αn is a nucleation site volume fraction, F is an empirical factor depend on condensation and vaporization designed for different rates.
The re-normalisation group (RNG) k-ε turbulent model was chosen to solve the Reynolds-averaged Naviere Stokes (RANS) equations. A pressure inlet boundary condition was given by setting various inlet pressure values, a constant pressure outlet boundary condition was given at the outlet. The default intensity and autocompute length scale was applied for the inlet turbulence. No-slip boundary condition had been imposed on all solid surfaces. For near-wall treatment, a scalable wall function was applied in the CFD simulation [28]. High resolution was selected for the advection scheme and first order was selected for turbulence numerics for the solver setting. In order to obtain a high-accuracy simulation result, the root mean square (RMS) was selected for residual type and the residual target was set to 10−5 for all equations. According to mass conservation, the mass flow rates of inlet and outlet were both checked to ensure they were equal.

2.4. Testing System

The relationship between differential pressure and flow rate for the original Venturi tube was measured to verify the accuracy of simulation results at the National Research Center of Pumps, Jiangsu University. Figure 4 is a structural diagram of the testing system, which mainly consisted of a pump with measuring and control devices. The experimental setup was comprised of steel piping and the nominal diameter of the pipe was 50 mm. A centrifugal pump with a flow rate of 40 m3 h−1 and a lift head of 30 m delivered water to the testing system. The flow rate through the pipe was measured by an electromagnetic flowmeter with an accuracy of ±0.3%. Two pressure gauges with an accuracy of ±0.4% were installed at the upstream and downstream sections to monitor the differential pressure through the Venturi tube. Two gate valves were installed to adjust the differential pressure between the inlet and outlet sections of the Venturi tube.

3. Results and Discussion

3.1. Verification of the Simulation Method

Table 3 shows a comparison between the measured flow rate and those predicted by the numerical simulations using the experimental Venturi tube model with a contraction angle of 30°, a contraction ratio of 0.28 and a diffusion angle of 20°. As can be seen, a good overall agreement was observed between the simulated and experimental results. There was a small difference between the simulated and the measured values at different differential pressures, and the maximum difference was 4.96%. The mass flow rate remained unchanged when the differential pressure was greater than 0.15 MPa, and this was because the cavitation limited the water flow [29]. The result showed that the numerical approach to CFD simulation was reasonable and feasible.
Figure 5 compares the simulated cavitation cloud with the experimental cavitation cloud obtained by Long et al. [30] with the inlet pressure of 400 kPa and the outlet pressure of 279 kPa. The structural parameters adopted for simulation were the same as the experiment. The inlet and outlet diameter were both 50 mm, the throat length was 10 mm, the throat diameter was 10 mm, the contraction angle and diffusion angle were 45° and 12°, respectively. It can be seen that the shape and length of the simulated cavitation cloud were basically the same as the experimental cavitation cloud, further indicating that the numerical method was feasible.

3.2. Effects of Contraction Angle on Cavitation Characteristics

Figure 6 presents the average vapor volume fraction of the cross-section from the throat in the axial direction with different contraction angles, with inlet pressure of 400 kPa and outlet pressure of 300 kPa. It can be seen that the average vapor volume fraction increased with an increasing contraction angle. Manzano et al. [10] found that the maximum velocity in the throat section increased with an increasing contraction angle. However, the increase of water velocity in the throat section was conducive to lower pressure. Hence, the increase in the contraction angle was favorable for increasing cavitation. Under the same contraction angle, the average vapor volume fraction of the cross-section in the axial direction increased first and then decreased with increasing distance from throat. The distances in average vapor volume fraction when the four contraction angles of 15°, 30°, 45°, and 60° decreased to 0 were 22, 24, 27, and 29 mm respectively, showing that the cavitation area grows with increasing contraction angle as well.
Figure 7 presents the contour of vapor volume fraction in the throat and diffusion section with the different contraction angles. It can be seen that the emerging water vapor was clear at the beginning of the throat section and the cavitation mainly occurred near the wall of the throat and the difussion section. Ashrafizadeh and Ghassemi [9] also found the same results for small-sized cavitating Venturi. The length of the cavitation cloud increased with increasing contraction angle, and which was well accordant with the analysis of the average vapor volume fraction in Figure 6.

3.3. Effects of Diffusion Angle on Cavitation Characteristics

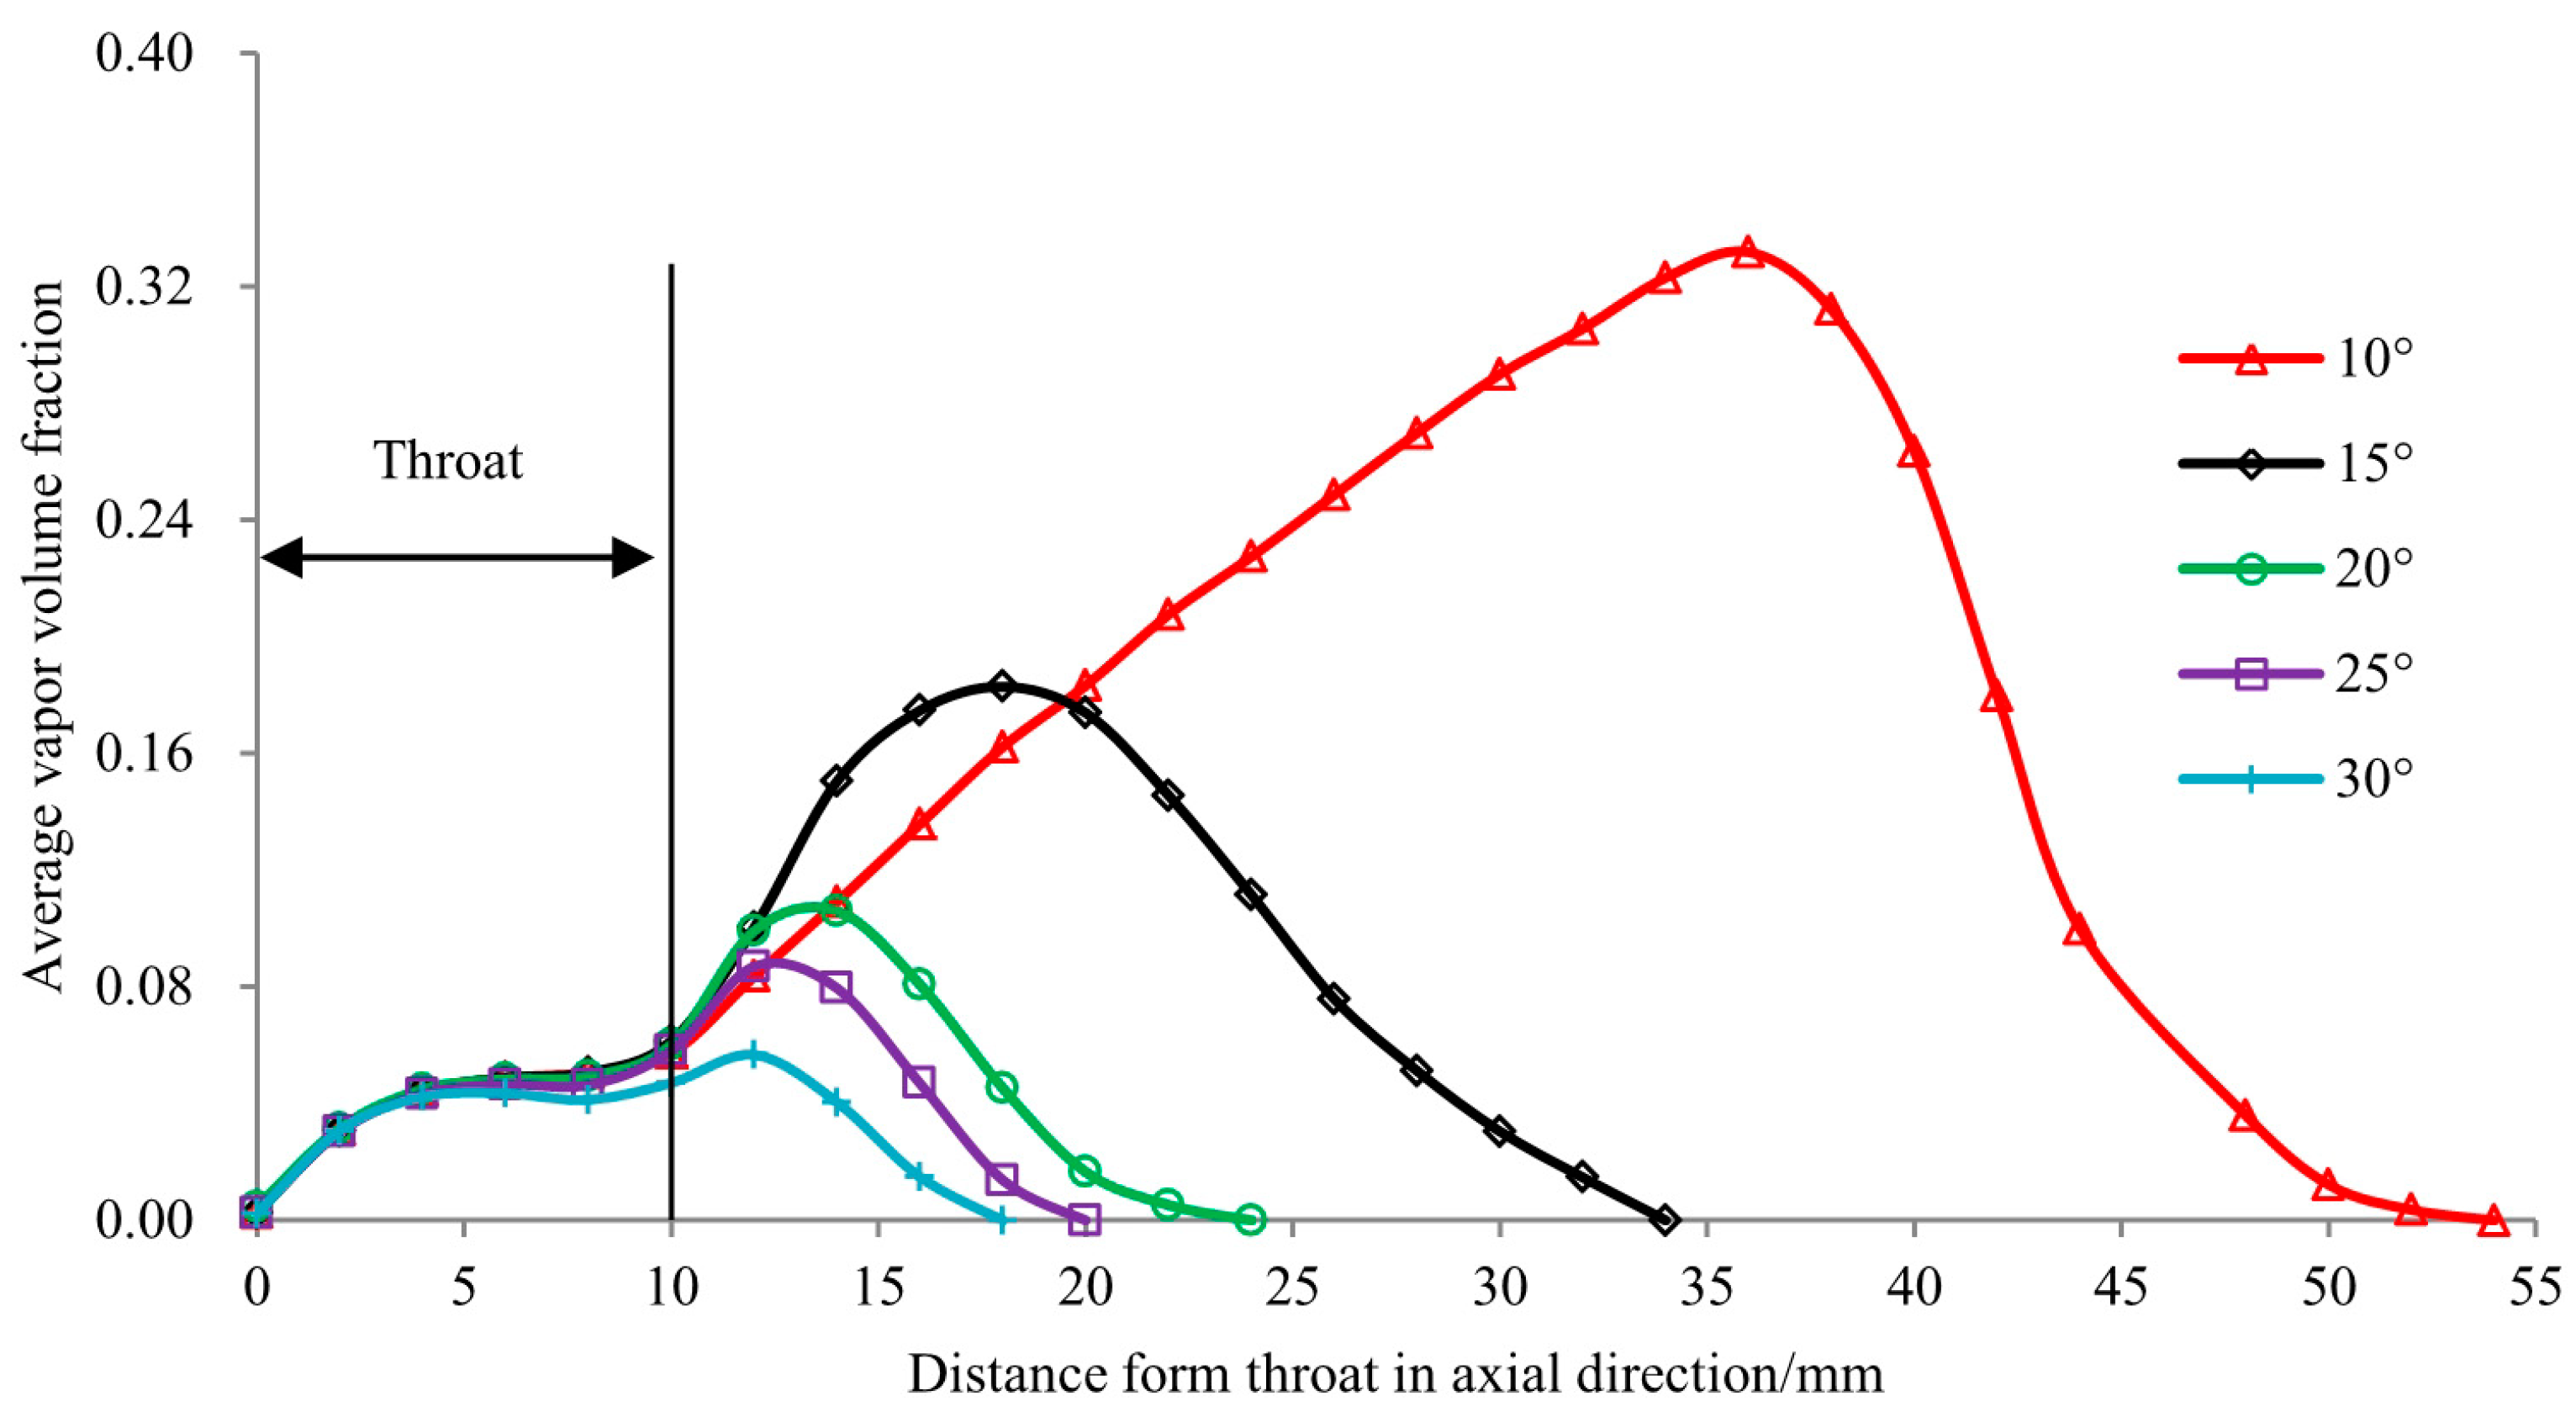
Figure 8 illustrates the average vapor volume fraction of the cross-section from the throat in the axial direction with different diffusion angles, with inlet pressure of 400 kPa and outlet pressure of 300 kPa. It can be seen that the average volume fraction in the diffusion section rapidly decreased with increasing diffusion angle. For instance, the maximum value of the average vapor volume fraction decreased from 0.057 to 0.332 as the diffusion angle increased from 15° to 30°. This result obtained using the CFD method can be proved by Zhang [1], who found that the minimum pressure in the throat section increased from 84 to 86 kPa as the diffusion angle increased from 22.5° to 37.5° for a Venturi tube, and indicated that the vacuum degree decreased with increasing diffusion angle. In addition, the area of cross-section in the diffusion section increased with increasing diffusion angle, and this can also lead to a decrease in average vapor volume fraction. Simpson and Ranade [2] also found that the diffusion angle have a significant influence on cavitation inception and evolution. Meanwhile, it can be seen in Figure 8 that the average volume fraction in the throat section remained nearly the same with the change in the diffusion angle, suggesting that the diffusion angle had no significant effect on the cavitation characteristics of the throat section.
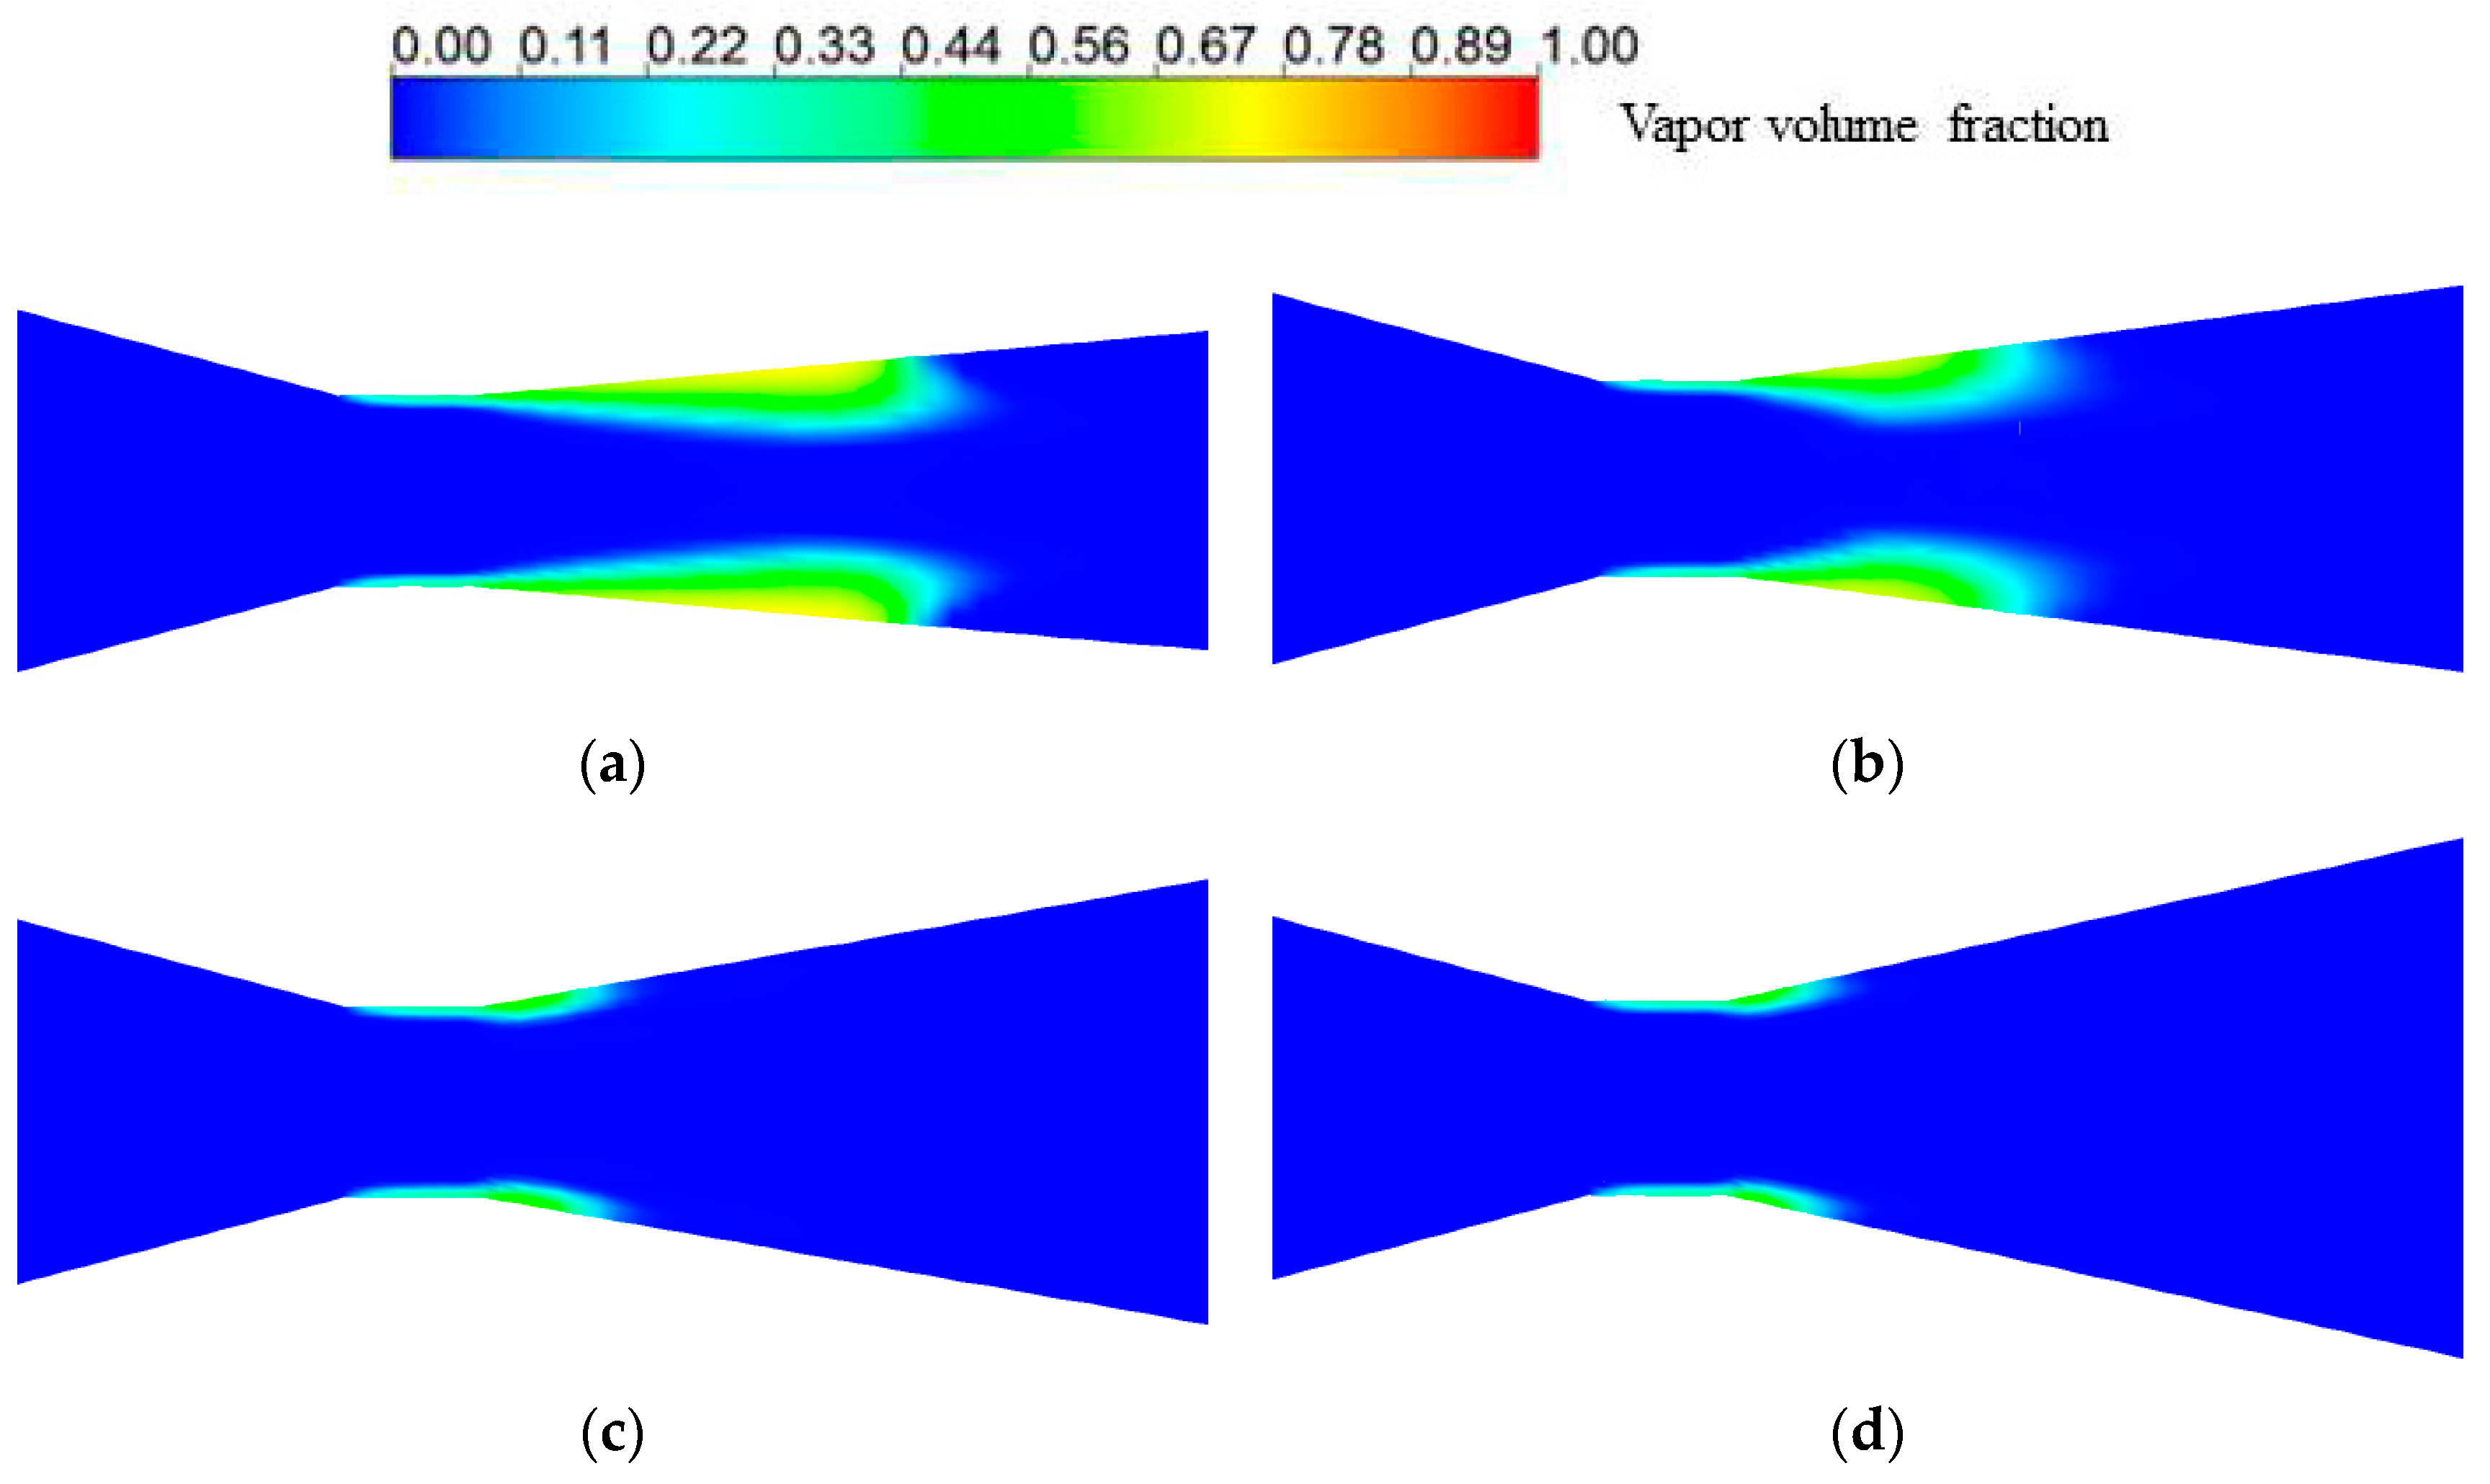
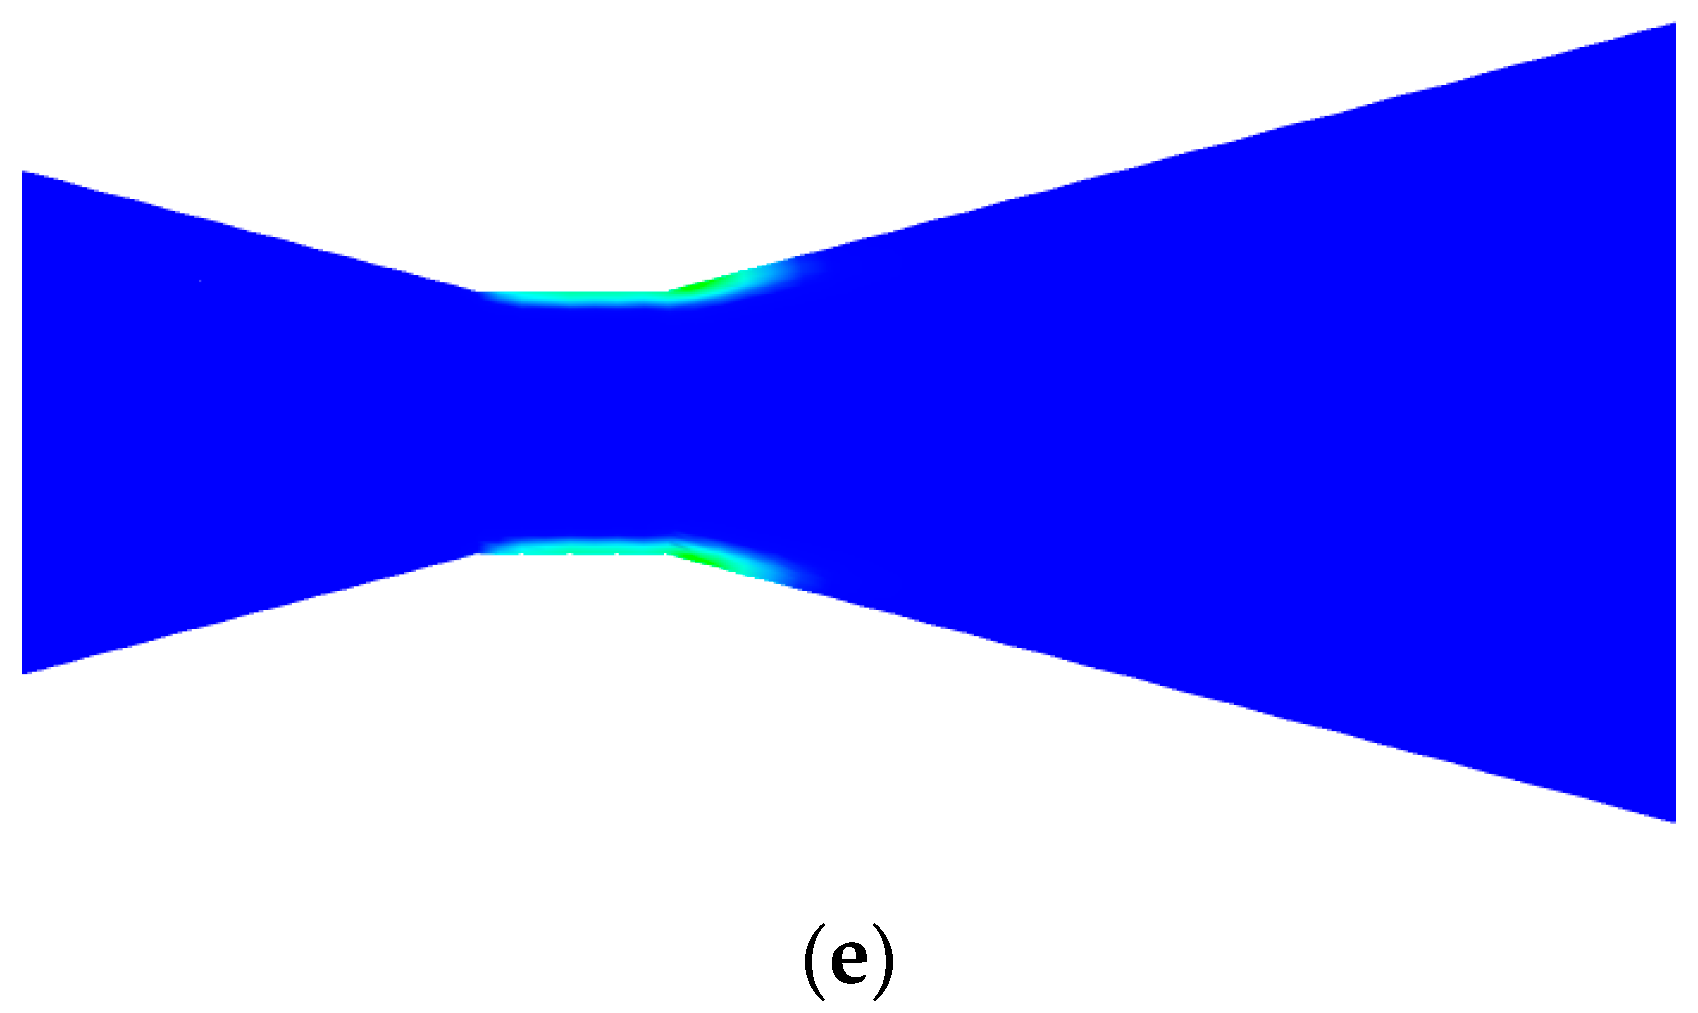
Figure 9 presents the contour of vapor volume fraction for the Venturi tube with different diffusion angles, with inlet pressure of 400 kPa and outlet pressure of 300 kPa. It was observed from Figure 9 that the length of the cavitation cloud decreased with increasing diffusion angle, and there was a very thin water vapor layer along the wall of the throat section when the diffusion angle increased to 30°. The increase in the interspace of the diffusion section resulted in the reduced relative water velocity, further hindering the generation of cavitation bubbles. In addition, as pointed out by Ashrafizadeh and Ghassemi [9], the hydraulic loss caused by the gradual expansion occurring in the diffusion section due to the situation became more similar to a sudden expansion with increase in the diffusion angle, which caused the hydraulic loss in the diffuser section increased.

3.4. Effects of Contraction Ratio on Cavitation Characteristics

Figure 10 presents the average vapor volume fraction of the cross-section from the throat in the axial direction with different contraction ratio angles, with inlet pressure of 400 kPa and outlet pressure of 300 kPa. It can be seen that the average vapor volume fraction increased with a decreasing contraction ratio. However, the variation of the average vapor volume fraction in the throat section was less than in the diffusion section, and there was little change in the throat section when the contraction ratio decreased from 0.3 to 0.2. In contrast, the average vapor volume fraction in the diffusion section increased significantly when the contraction ratio decreased from 0.5 to 0.2. Under the same inlet and outlet pressure, the cavity lengths for different contraction ratios were basically the same, suggesting that the contraction ratio had no significant influence on the cavity length under the same differential pressure.
Figure 11 depicts the contour of the vapor volume fraction for a Venturi tube with different contraction ratios, an inlet pressure of 400 kPa and outlet pressure of 300 kPa. It can be seen in Figure 11 that the shapes of the cavitation cloud for different Venturi models were almost the same under the same differential pressure. Although the decrease in the contraction ratio can improve the average vapor volume fraction in the diffusion section, the decrease in the contraction ratio still reduced the flow rate. Ashrafizadeh and Ghassemi [8] found the discharge coefficient decreased from 0.9 to 0.86 when the contraction ratio decreased from 0.375 to 0.175. Hence, the contraction ratio should be designed appropriately to be applied to different application fields.

4. Conclusions

This paper presents research on the influence of three key structural parameters (contraction angle, diffusion angle and contraction ratio) on cavitation characteristics for a Venturi tube, using the CFD method. From the results of this study, the following conclusions can be drawn.
The average vapor volume fraction of the cross-section from the throat in the axial direction increased with increasing contraction angle. Under the same contraction angle, the average vapor volume fraction increased first and then decreased with increasing distance from the beginning of the throat section. The cavitation area grew with increasing contraction angle. The emerging water vapor was clear at the beginning of the throat section and the cavitation mainly occurred near the wall of the throat and the diffusion section.
The average volume fraction in the diffusion section rapidly decreased with increasing diffusion angle. The diffusion angle had no significant effect on the cavitation characteristics in the throat section and had a significant influence on the diffusion section. The cavity length decreased with increasing diffusion angle, and there was only a very thin water vapor layer found along the wall of the throat section when the diffusion angle increased to 30°.
The average vapor volume fraction increased with decreasing contraction ratio. The contraction ratio had no significant influence on the cavity length under the same differential pressure. The average vapor volume fraction in the throat section varied less than the diffusion section with changes in the contraction ratio.

Author Contributions

P.T. conceived and structured the testing system. H.L. performed literature search, helped in experiments and analyzed the test data. P.T. and J.M.J. conducted the simulation, wrote the paper and approved the submitted version of the manuscript.

Funding

This work was supported by the National Natural Science Foundation of China (51679109; 51609104), Natural Science Research Project of Jiangsu Higher Education Institutions (19KJB470014), Special Scientific Research Fund of Agriculture Public Welfare Profession of China (Grant No. 201503130), the Natural Science Foundation of Jiangsu Province (BK20170555).

Acknowledgments

A huge thanks is due to the editor and reviewers for their valuable comments to improve the quality of this paper.

Conflicts of Interest

The authors declare no conflict of interest.

References

  1. Zhang, J.X. Analysis on the effect of venturi tube structural parameters on fluid flow. AIP Adv. 2017, 7, 065315. [Google Scholar] [CrossRef] [Green Version]
  2. Simpson, A.; Ranade, V.V. Modeling hydrodynamic cavitation in venturi: Influence of venturi configuration on inception and extent of cavitation. AIChE J. 2019, 65, 421–433. [Google Scholar] [CrossRef]
  3. Pak, S.; Chang, K. Performance estimation of a Venturi scrubber using a computational model for capturing dust particles with liquid spray. J. Hazard. Mater. 2006, 138, 560–573. [Google Scholar] [CrossRef] [PubMed]
  4. Zhao, C.; Zhu, Y.; Li, Y.; Liu, G.; Shang, T.; Zhu, J.A.; Jiao, T. Design and experimental of venturi in EGR system of turbocharged intercooled diesel engine. Trans. Chin. Soc. Agric. Eng. 2013, 29, 49–56. [Google Scholar]
  5. Wang, X.J.; Tang, L.; Jiang, Z. Numerical simulation of Venturi ejector reactor in yellow phosphorus purification system. Nucl. Eng. Des. 2014, 268, 18–23. [Google Scholar] [CrossRef]
  6. Quiroz-Pérez, E.; Vázquez-Román, R.; Lesso-Arroyo, R.; Barragán-Hernández, V.M. An approach to evaluate Venturi-device effects on gas wells production. J. Pet. Sci. Eng. 2014, 116, 8–18. [Google Scholar] [CrossRef]
  7. Ghassemi, H.; Fasih, H.F. Application of small size cavitating venturi as flow controller and flow meter. Flow Meas. Instrum. 2011, 22, 406–412. [Google Scholar] [CrossRef]
  8. Sun, Y.Q.; Niu, W.Q. Simulating the effects of structural parameters on the hydraulic performances of Venturi tube. Model. Simul. Eng. 2012, 2012, 458368. [Google Scholar] [CrossRef]
  9. Ashrafizadeh, S.M.; Ghassemi, H. Experimental and numerical investigation on the performance of small-sized cavitating venturis. Flow Meas. Instrum. 2015, 42, 6–15. [Google Scholar] [CrossRef]
  10. Lu, H.; Guo, X.; Li, P.; Liu, K.; Gong, X. Design optimization of a venturi tube geometry in dense-phase pneumatic conveying of pulverized coal for entrained-flow gasification. Chem. Eng. Res. Des. 2017, 120, 208–217. [Google Scholar] [CrossRef]
  11. Manzano, J.; Palau, C.V.; Benito, M.D.A.; Guilherme, V.D.B.; Vasconcelos, D.V. Geometry and head loss in Venturi injectors through computational fluid dynamics. Eng. Agríc. 2016, 36, 482–491. [Google Scholar] [CrossRef] [Green Version]
  12. Bethi, B.; Sonawane, S.; Potoroko, I.; Bhanvase, B.A.; Sonawane, S.S. Novel hybrid system based on hydrodynamic cavitation for treatment of dye waste water: A first report on bench scale study. J. Environ. Chem. Eng. 2017, 5, 1874–1884. [Google Scholar] [CrossRef]
  13. Yi, C.; Lu, Q.; Wang, Y.; Wang, Y.; Yang, B. Degradation of organic wastewater by hydrodynamic cavitation combined with acoustic cavitation. Ultrason. Sonochemistry. 2018, 43, 156–165. [Google Scholar] [CrossRef] [PubMed]
  14. Rajoriya, S.; Bargole, S.; George, S.; Saharan, V.K. Treatment of textile dyeing industry effluent using hydrodynamic cavitation in combination with advanced oxidation reagents. J. Hazard. Mater. 2018, 344, 1109–1115. [Google Scholar] [CrossRef]
  15. Badmus, K.O.; Tijani, J.O.; Massima, E.; Petrik, L. Treatment of persistent organic pollutants in wastewater using hydrodynamic cavitation in synergy with advanced oxidation process. Environ. Sci. Pollut. Res. 2018, 25, 7299–7314. [Google Scholar] [CrossRef] [Green Version]
  16. Kim, H.J.; Nguyen, D.X.; Bae, J.H. The performance of the sludge pretreatment system with venturi tubes. Water Sci. Technol. 2008, 57, 131–137. [Google Scholar] [CrossRef]
  17. Wang, X.; Jia, J.; Wang, Y. Combination of photocatalysis with hydrodynamic cavitation for degradation of tetracycline. Chem. Eng. J. 2017, 315, 274–282. [Google Scholar] [CrossRef]
  18. Boczkaj, G.; Gągol, M.; Klein, M.; Przyjazny, A. Effective method of treatment of effluents from production of bitumens under basic pH conditions using hydrodynamic cavitation aided by external oxidants. Ultrason. Sonochemistry. 2018, 40, 969–979. [Google Scholar] [CrossRef]
  19. Thanekar, P.; Murugesan, P.; Gogate, P.R. Improvement in biological oxidation process for the removal of dichlorvos from aqueous solutions using pretreatment based on Hydrodynamic Cavitation. J. Water Process Eng. 2018, 23, 20–26. [Google Scholar] [CrossRef]
  20. Hachino, K.; Sato, K.; Saito, Y. Inception and Dynamics of Traveling-Bubble-Type Cavitation in a Venturi. In Proceedings of the ASME/JSME 2003 4th Joint Fluids Summer Engineering Conference, Honolulu, HI, USA, 6–10 July 2003; pp. 279–285. [Google Scholar]
  21. Cai, J.; Huai, X.; Li, X. Dynamic behaviors of cavitation bubble for the steady cavitating flow. J. Therm. Sci. 2009, 18, 338–344. [Google Scholar] [CrossRef]
  22. Abdulaziz, A. Performance and image analysis of a cavitating process in a small type venturi. Exp. Therm. Fluid Sci. 2014, 53, 40–48. [Google Scholar] [CrossRef]
  23. Brinkhorst, S.; Von Lavante, E.; Wendt, G. Numerical investigation of cavitating Herschel Venturi-Tubes applied to liquid flow metering. Flow Meas. Instrum. 2015, 43, 23–33. [Google Scholar] [CrossRef]
  24. Chen, G.; Wang, G.; Hu, C.; Huang, B.; Gao, Y.; Zhang, M. Combined experimental and computational investigation of cavitation evolution and excited pressure fluctuation in a convergent–divergent channel. Int. J. Multiph. Flow. 2015, 72, 133–140. [Google Scholar] [CrossRef]
  25. Tomov, P.; Khelladi, S.; Ravelet, F.; Sarraf, C.; Bakir, F.; Vertenoeuil, P. Experimental study of aerated cavitation in a horizontal venturi nozzle. Exp. Therm. Fluid Sci. 2016, 70, 85–95. [Google Scholar] [CrossRef] [Green Version]
  26. Long, X.; Zhang, J.; Wang, J.; Xu, M.; Lyu, Q.; Ji, B. Experimental investigation of the global cavitation dynamic behavior in a venturi tube with special emphasis on the cavity length variation. Int. J. Multiph. Flow. 2017, 89, 290–298. [Google Scholar] [CrossRef]
  27. Zhu, J.; Xie, H.; Feng, K.; Zhang, X.; Si, M. Unsteady cavitation characteristics of liquid nitrogen flows through venturi tube. Int. J. Heat Mass Transf. 2017, 112, 544–552. [Google Scholar] [CrossRef]
  28. Tang, P.; Li, H.; Issaka, Z.; Chen, C. Impact forces on the drive spoon of a large cannon irrigation sprinkler: Simple theory, CFD numerical simulation and validation. Biosyst. Eng. 2017, 159, 1–9. [Google Scholar] [CrossRef]
  29. Brinkhorst, S.; Von Lavante, E.; Wendt, G. Experimental and numerical investigation of the cavitation-induced choked flow in a herschel venturi-tube. Flow Meas. Instrum. 2017, 54, 56–67. [Google Scholar] [CrossRef]
  30. Long, X.P.; Wang, J.; Zuo, D.; Zhang, J.Q.; Ji, B. Experimental investigation of the instability of cavitation in veturi tube under different cavitation stage. J. Mech. Eng. 2018, 54, 209–215. [Google Scholar] [CrossRef]
Figure 1. Structural diagram of Venturi tube.
Water 11 02194 g001
Figure 2. Computational grid.
Water 11 02194 g002
Figure 3. Static pressure distribution along the axial.
Water 11 02194 g003
Figure 4. Structural diagram of the experimental setup. 1. Electromotor 2. Pump 3. Electromagnetic flowmeter (50 mm) 4. Gate valve (50 mm) 5. Pressure gauge 6. Venturi tube 7. Pressure gauge 8. Gate valve (50 mm) 9. Water tank.
Water 11 02194 g004
Figure 5. Comparison between simulated cavitation cloud and the experimental cavitation cloud obtained by Long et al. [30] with the inlet pressure of 400 kPa and the outlet pressure of 279 kPa, (a) simulated, (b), observed by Long et al. [30].
Water 11 02194 g005
Figure 6. Average vapor volume fraction of cross-section form the throat in axial direction with different contraction angles.
Water 11 02194 g006
Figure 7. Contour of vapor volume fraction in the throat and the diffusion section with different contraction angles, (a) 15°, (b) 30°, (c) 45°, (d) 60°.
Water 11 02194 g007
Figure 8. Average vapor volume fraction of cross-section from the throat in the axial direction with different diffusion angles.
Water 11 02194 g008
Figure 9. Contour of vapor volume fraction of the Venturi tube with different diffusion angles, (a) 10°, (b) 15°, (c) 20°, (d) 25°, (e) 30°.
Water 11 02194 g009aWater 11 02194 g009b
Figure 10. Average vapor volume fraction of a cross-section from the throat in the axial direction with different contraction ratios.
Water 11 02194 g010
Figure 11. Contour of vapor volume fraction of the Venturi tube with different contraction ratios, (a) 0.1, (b) 0.2, (c) 0.3, (d) 0.4.
Water 11 02194 g011
Table 1. Structural parameters of the Venturi model for computational fluid dynamics (CFD) analysis.
Groupα (°)β (°)γ
115, 30, 45, 60200.28
23010, 15, 20, 25, 300.28
330200.2, 0.3, 0.4, 0.5
Table 2. Grid independence analysis results.
SchemeScheme 1Scheme 2Scheme 3Scheme 4Scheme 5
Grid number101,342154,683201,679284,813349,866
Mass flow rate (kg s−1)2.412.462.492.502.50
Table 3. Comparison between simulated and experimental values for mass flow rate under different differential pressures.
Inlet Pressure (MPa)Outlet Pressure (MPa)Mass Flow Rate
Measured (kg s−1)Simulated (kg s−1)Difference (%)
0.150.101.641.703.66
0.200.102.382.494.62
0.250.102.432.534.12
0.300.102.422.544.96
0.350.102.432.554.94