Article

Modelling Effects of Rainfall Patterns on Runoff Generation and Soil Erosion Processes on Slopes

1
Institute of Hydrology and Water Resources, Zhejiang University, Hangzhou 310058, China
2
State Key Laboratory of Hydraulics and Mountain River Engineering, Sichuan University, Chengdu 610065, China
3
School of Water Resource & Hydropower, Sichuan University, Chengdu 610065, China
*
Author to whom correspondence should be addressed.
Water 2019, 11(11), 2221; https://doi.org/10.3390/w11112221
Submission received: 19 September 2019 / Revised: 18 October 2019 / Accepted: 22 October 2019 / Published: 25 October 2019

Abstract

:
Rainfall patterns and landform characteristics are controlling factors in runoff and soil erosion processes. At a hillslope scale, there is still a lack of understanding of how rainfall temporal patterns affect these processes, especially on slopes with a wide range of gradients and length scales. Using a physically-based distributed hydrological model (InHM), these processes under different rainfall temporal patterns were simulated to illustrate this issue. Five rainfall patterns (constant, increasing, decreasing, rising-falling and falling-rising) were applied to slopes, whose gradients range from 5° to 40° and projective slope lengths range from 25 m to 200 m. The rising-falling rainfall generally had the largest total runoff and soil erosion amount; while the constant rainfall had the lowest ones when the projective slope length was less than 100 m. The critical slope of total runoff was 15°, which was independent of rainfall pattern and slope length. However, the critical slope of soil erosion amount decreased from 35° to 25° with increasing projective slope length. The increasing rainfall had the highest peak discharge and erosion rate just at the end of the peak rainfall intensity. The peak value discharges and erosion rates of decreasing and rising-falling rainfalls were several minutes later than the peak rainfall intensity.

1. Introduction

Rainfall patterns and landform characteristics are controlling factors of the runoff and soil erosion processes in natural catchments [1,2]. Due to climatic change and climatic variability, rainfall events commonly show great temporal variation in intensity, especially in hilly areas [3,4] and the peak rainfall rates within an event may dozens of times higher than the mean event rate [1,5]. Although the temporal distribution of an individual rainfall event is diverse, some patterns of such distribution in a region can be derived based on historical data (e.g., [6,7]).
Previous studies have recognized that the rainfall patterns greatly affect the runoff generation and soil erosion processes (e.g., [8,9]). Parsons and Stone [10] adopted five rainfalls with different patterns but the same total kinetic energy to the soil surface. They found that the soil erosion amount under a constant-intensity storm are reduced by about 25% compared to varied-intensity storms, and that the eroded sediments are coarser under the constant-intensity pattern. An et al. [8] used the similar rainfall patterns and indicated that, although the total runoff was nearly not affected by the rainfall pattern, the varied intensity patterns yield 1–5 times more soil losses than even-intensity patterns and the rising pattern resulted in a consistently higher soil loss relative to the other four rainfall patterns. Conversely, Dunkerley [3] performed rainfall simulations of varying intensity profile in a dryland intergrove (runoff source area) and discovered that the late peak events showed runoff ratios that were more than double those of the early peak events and the constant rainfall yielded the lowest total runoff, the lowest peak runoff rate. The reason was inferred to be the reductions in soil infiltration capacity during late rainfall. Zhai et al. [11] applied a distributed hydrological model at the basin scale, and found that the rainfall patterns have significant impact on the rainfall threshold of flood warning, which the flood rainfall threshold of advanced rainfall is the highest.
However, in most studies on rainfall pattern at plot scale, spatially distributed results of infiltration and soil erosion processes were not carefully considered. The temporal variation of precipitation can lead to corresponding spatial and temporal variations of infiltration, overland flow generation, and further soil erosion. Only considering runoff and soil erosion data at plot outlet, like many previous study did, will miss some important information (e.g., distributed cumulative infiltration or erosion depth) within the study area for comprehensive interpreting the influence of rainfall pattern on runoff and soil erosion processes.
In recent years, many studies on slopes have reported that observed runoff coefficient in Hortonian runoff processes decreases with increasing slope length, and variance of runoff reduces as slope scale increases (e.g., [12,13]). A reason was that the runoff generated upslope can infiltrate in downslope areas, which was called the run-on infiltration [14] or the re-infiltration [15]. Although rainfall characteristics such as duration were one of the major factors affecting runoff generation at different slope scales (e.g., [16]), it is still unknown how slope length influences the effect of temporal rainfall pattern on rainfall-runoff and soil erosion processes.
Slope steepness was an important topographic factor of hillslope rainfall-runoff and soil erosion processes. At plot scale, contradictory results were derived regarding slope effects on infiltration (e.g., [17,18]) and soil erosion (e.g., [19,20]). Besides, some researchers observed that runoff volume and soil loss on slopes increases with increasing slope angle till a critical slope angle of 20°–30° (e.g., [21]), while others reported that soil erosion is not correlated with slope gradient in tilled fields (e.g., [22]). However, a majority of the studies focusing on slope steepness neglected the influence of rainfall temporal variation. There is a lack of systematically studies on the effect of slope gradient under different rainfall patterns.
Numerical modelling is an effective approach to reveal spatial and temporal impacts of rainfall patterns on infiltration, overland flow and soil erosion processes at slopes with wide ranges of steepness and length, which can broaden the limitation of the artificial rainfall experiment (e.g., a plot with a few meters long [8]). Further, strictly controlling factors such as initial condition and soil property, the effect of rainfall patterns can be specifically focused. As a mature hydraulic model, Integrated Hydrology Model (InHM) can quantitatively simulate surface (2D) and subsurface (3D) hydrologic responses to rainfall in a fully coupled approach [23,24]. Previously, InHM has been successfully applied in the simulations of hillslope hydrology and slope failure (e.g., [23,25]). As this physics-based hydrological model employs fundamental physics laws to describe natural processes [26], its output results have clear physical meanings and can be used to generalize our understanding of rainfall pattern effects on runoff and soil erosion processes.
The main purpose of this study is to investigate the impact of rainfall temporal patterns on infiltration, runoff generation and soil erosion on slopes with a range of slope lengths and gradients, using a physically based modelling approach. These modelling results are expected to improve the theoretical basis for hillslope runoff and soil erosion prediction, which will be further helpful in soil conservation planning and land management.

2. Methodology

2.1. InHM Model

The Integrated Hydrology Model (InHM) was originally developed by VanderKwaak [27], which exceeds the specifications of the hydrologic-response model proposed by Freeze and Harlan (1969) that the model based upon the numerical solution to an almost-complete set of coupled partial differential equations which describe water movement processes at surface and in unsaturated and saturated subsurface [26]. With the advantage of the model that it doesn’t need a priori assumption of a dominant runoff-generation mechanism [28,29], InHM is capable of accurately simulating dynamic infiltration, runoff and sediment processes under temporal varying rainfall. Previous studies have shown that the calibrated model reproduced accurately measured runoff and soil erosion results on semiarid hillslopes during constant-intensity rainfall-simulation events [28,30]. The equations and a detailed description of InHM can be found in VanderKwaak [27], VanderKwaak and Loague [26] and Heppner et al. [30].

2.2. Model Setup

Runoff and soil erosion processes were simulated and analysed on slopes with four horizontal projective slope lengths (25 m, 50 m, 100 m and 200 m), which were all 40 m wide and 3 m deep. For each horizontal projective length, nine slope gradients from 5° to 40° in 5° increments were considered, and identical rainfall amount revieved on slope surfaces was ensured for different slope gradients due to the constant horizontal projective length. In total, for each rainfall scenario the runoff and erosion processes were simulated for 36 slopes. The schematic representation of the 200 m slope used in the simulation was shown in Figure 1 as an example. To avoid the influence of the downstream outlet boundary, the overall projective slope length of the 3D finite element meshes were 220 m. The vertical nodal spacing (Dz) in the mesh varies from 0.01 to 0.1 m; the horizontal nodal spacing (Dx, Dy) is 0.5 m. The 3-m mesh depth was sufficient for short-time simulation of rainfall-runoff events and deep groundwater movement was not considered in this study. The boundary conditions contain impermeable boundaries (A-E-H-D, B-F-G-C, E-F-G-H), flux boundary (A-E-F-B) and permeable boundary (A-B-C-D, C-G-H-D). The total numbers of the nodes and the elements of the 200 m slope 3D meshes are 35,721 and 70,400, respectively.
In this modelling study, the parameters of the plots (Table 1) were obtained from Ran et al. [28] who calibrated and validated the InHM parameters via the plot-scale experiments of Horton overland flow and surface erosion on the silty clay loam slopes within the Los Alamos National Laboratory [31]. The slope gradient of their experimental plot was 25.8° and its vegetation coverage was 61%, which was an ideal condition for hillslope runoff and soil erosion study. A 1-h 40 mm h−1 rainfall event is approximately equivalent to a 5-year return period event in that area.

2.3. Rainfall Scenarios

In this study, five temporal patterns of rainfall intensity were designed: constant rainfall intensity, increasing rainfall intensity, decreasing rainfall intensity, rising-falling rainfall intensity and falling-rising rainfall intensity (Figure 2).
Similar rainfall scenarios were also adopted by other researchers foucusing on temporal patterns of rainfall (e.g., [3,33]). All the five rainfall patterns had a 1-h duration and 40 mm rainfall depth. Previously, many studies focusing on rainfall patterns adopted extremely high rainfall intensities in their rainfall simulations [1]. For instance, Flanagan et al. [34] used rainfall rates that peaked at 250 mm h−1 and Parsons and Stone [10] adopted rainfall rates in the range 46.4–170.8 mm h−1. The rainfall intensities of this study were within the range of 1–80 mm h−1, which reprensents a more general condition.

3. Results

3.1. Hydrological Responses

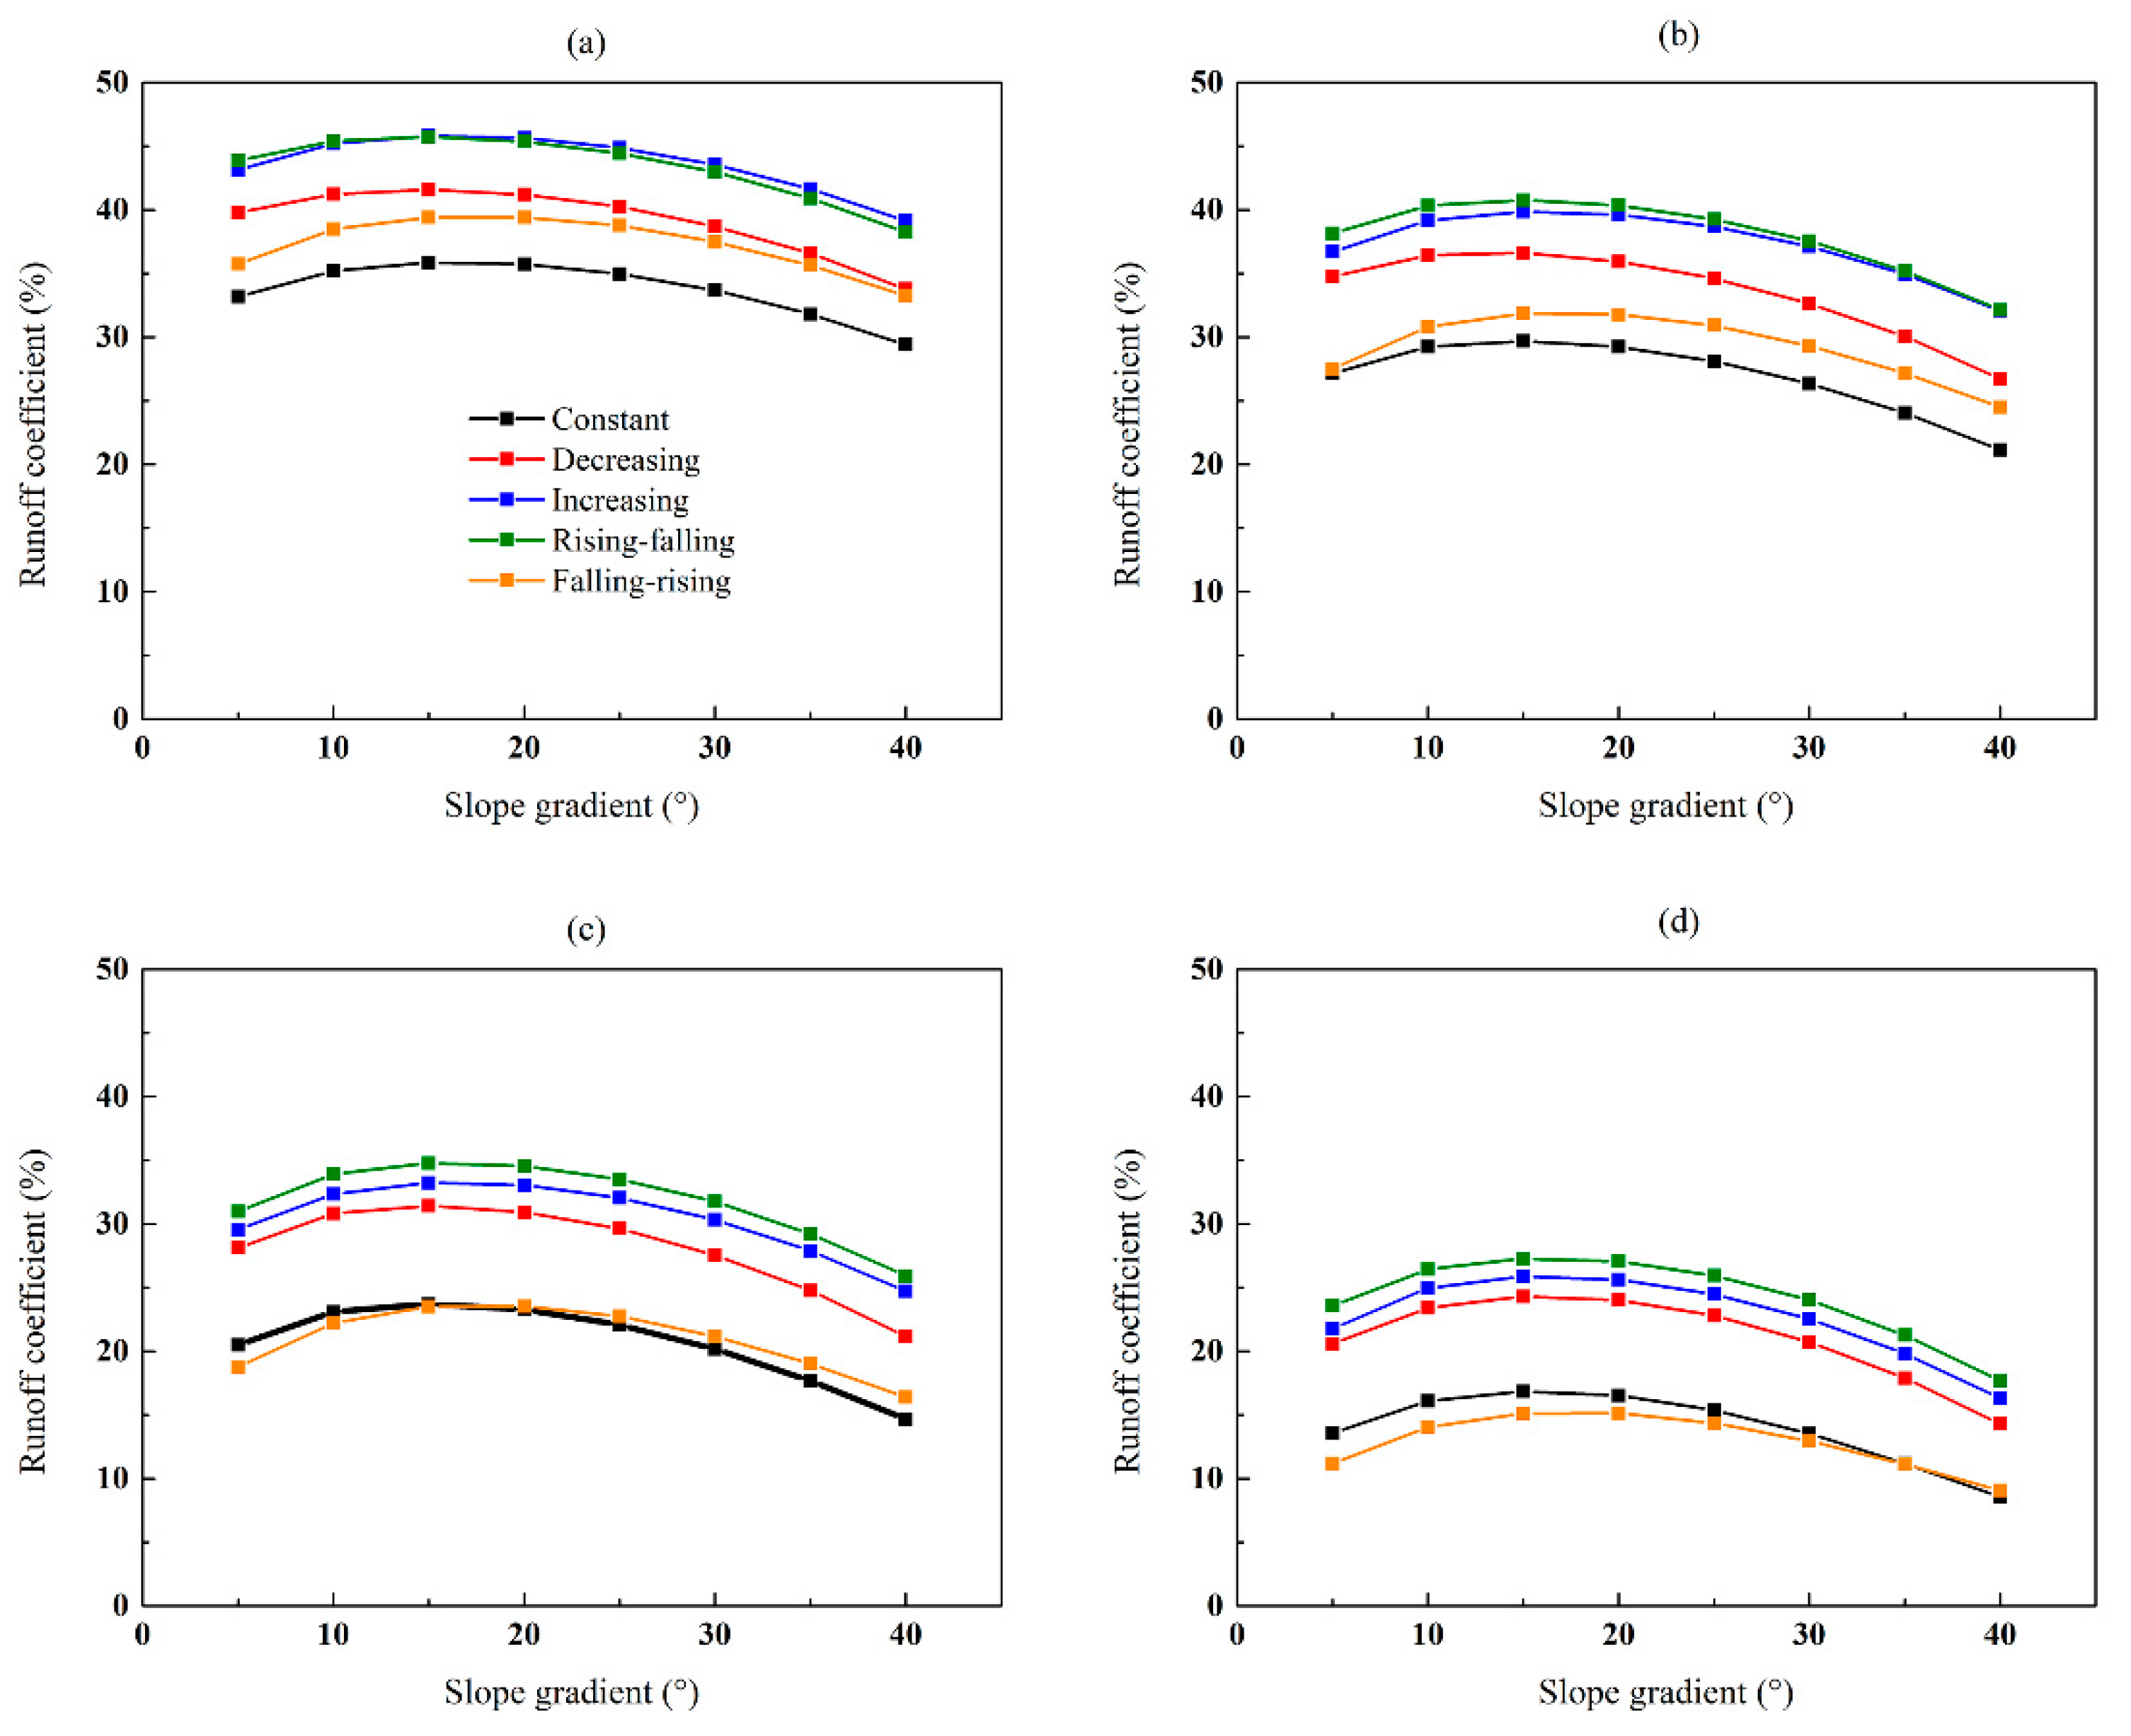
The modelling results of runoff in the rainfall scenarios at the different projective slope lengths were summarized in Table 2. Generally, the increasing and rising-falling rainfalls had the largest total runoff, and the constant and falling-rising rainfalls had the least total runoff. The constant rainfall had the lowest total runoff when the slope length was shorter than 100 m. At a same slope gradient, the relative difference between the total runoff of different rainfall patterns was up to 111% (Table 2). The runoff coefficient at different projective slope lengths were shown in Figure 3. The runoff coefficient increased with increasing slope gradient until 15° and then decreased to the lowest value at 40° slope. The runoff coefficients of the rising-falling rainfalls were close to those of the increasing rainfalls at the 25 m slope, then they gradually became higher as slope length increased. As the projective slope length increased, the runoff coefficient of all the five rainfall patterns decreased, and that of the falling-rising rainfall decreased most greatly.
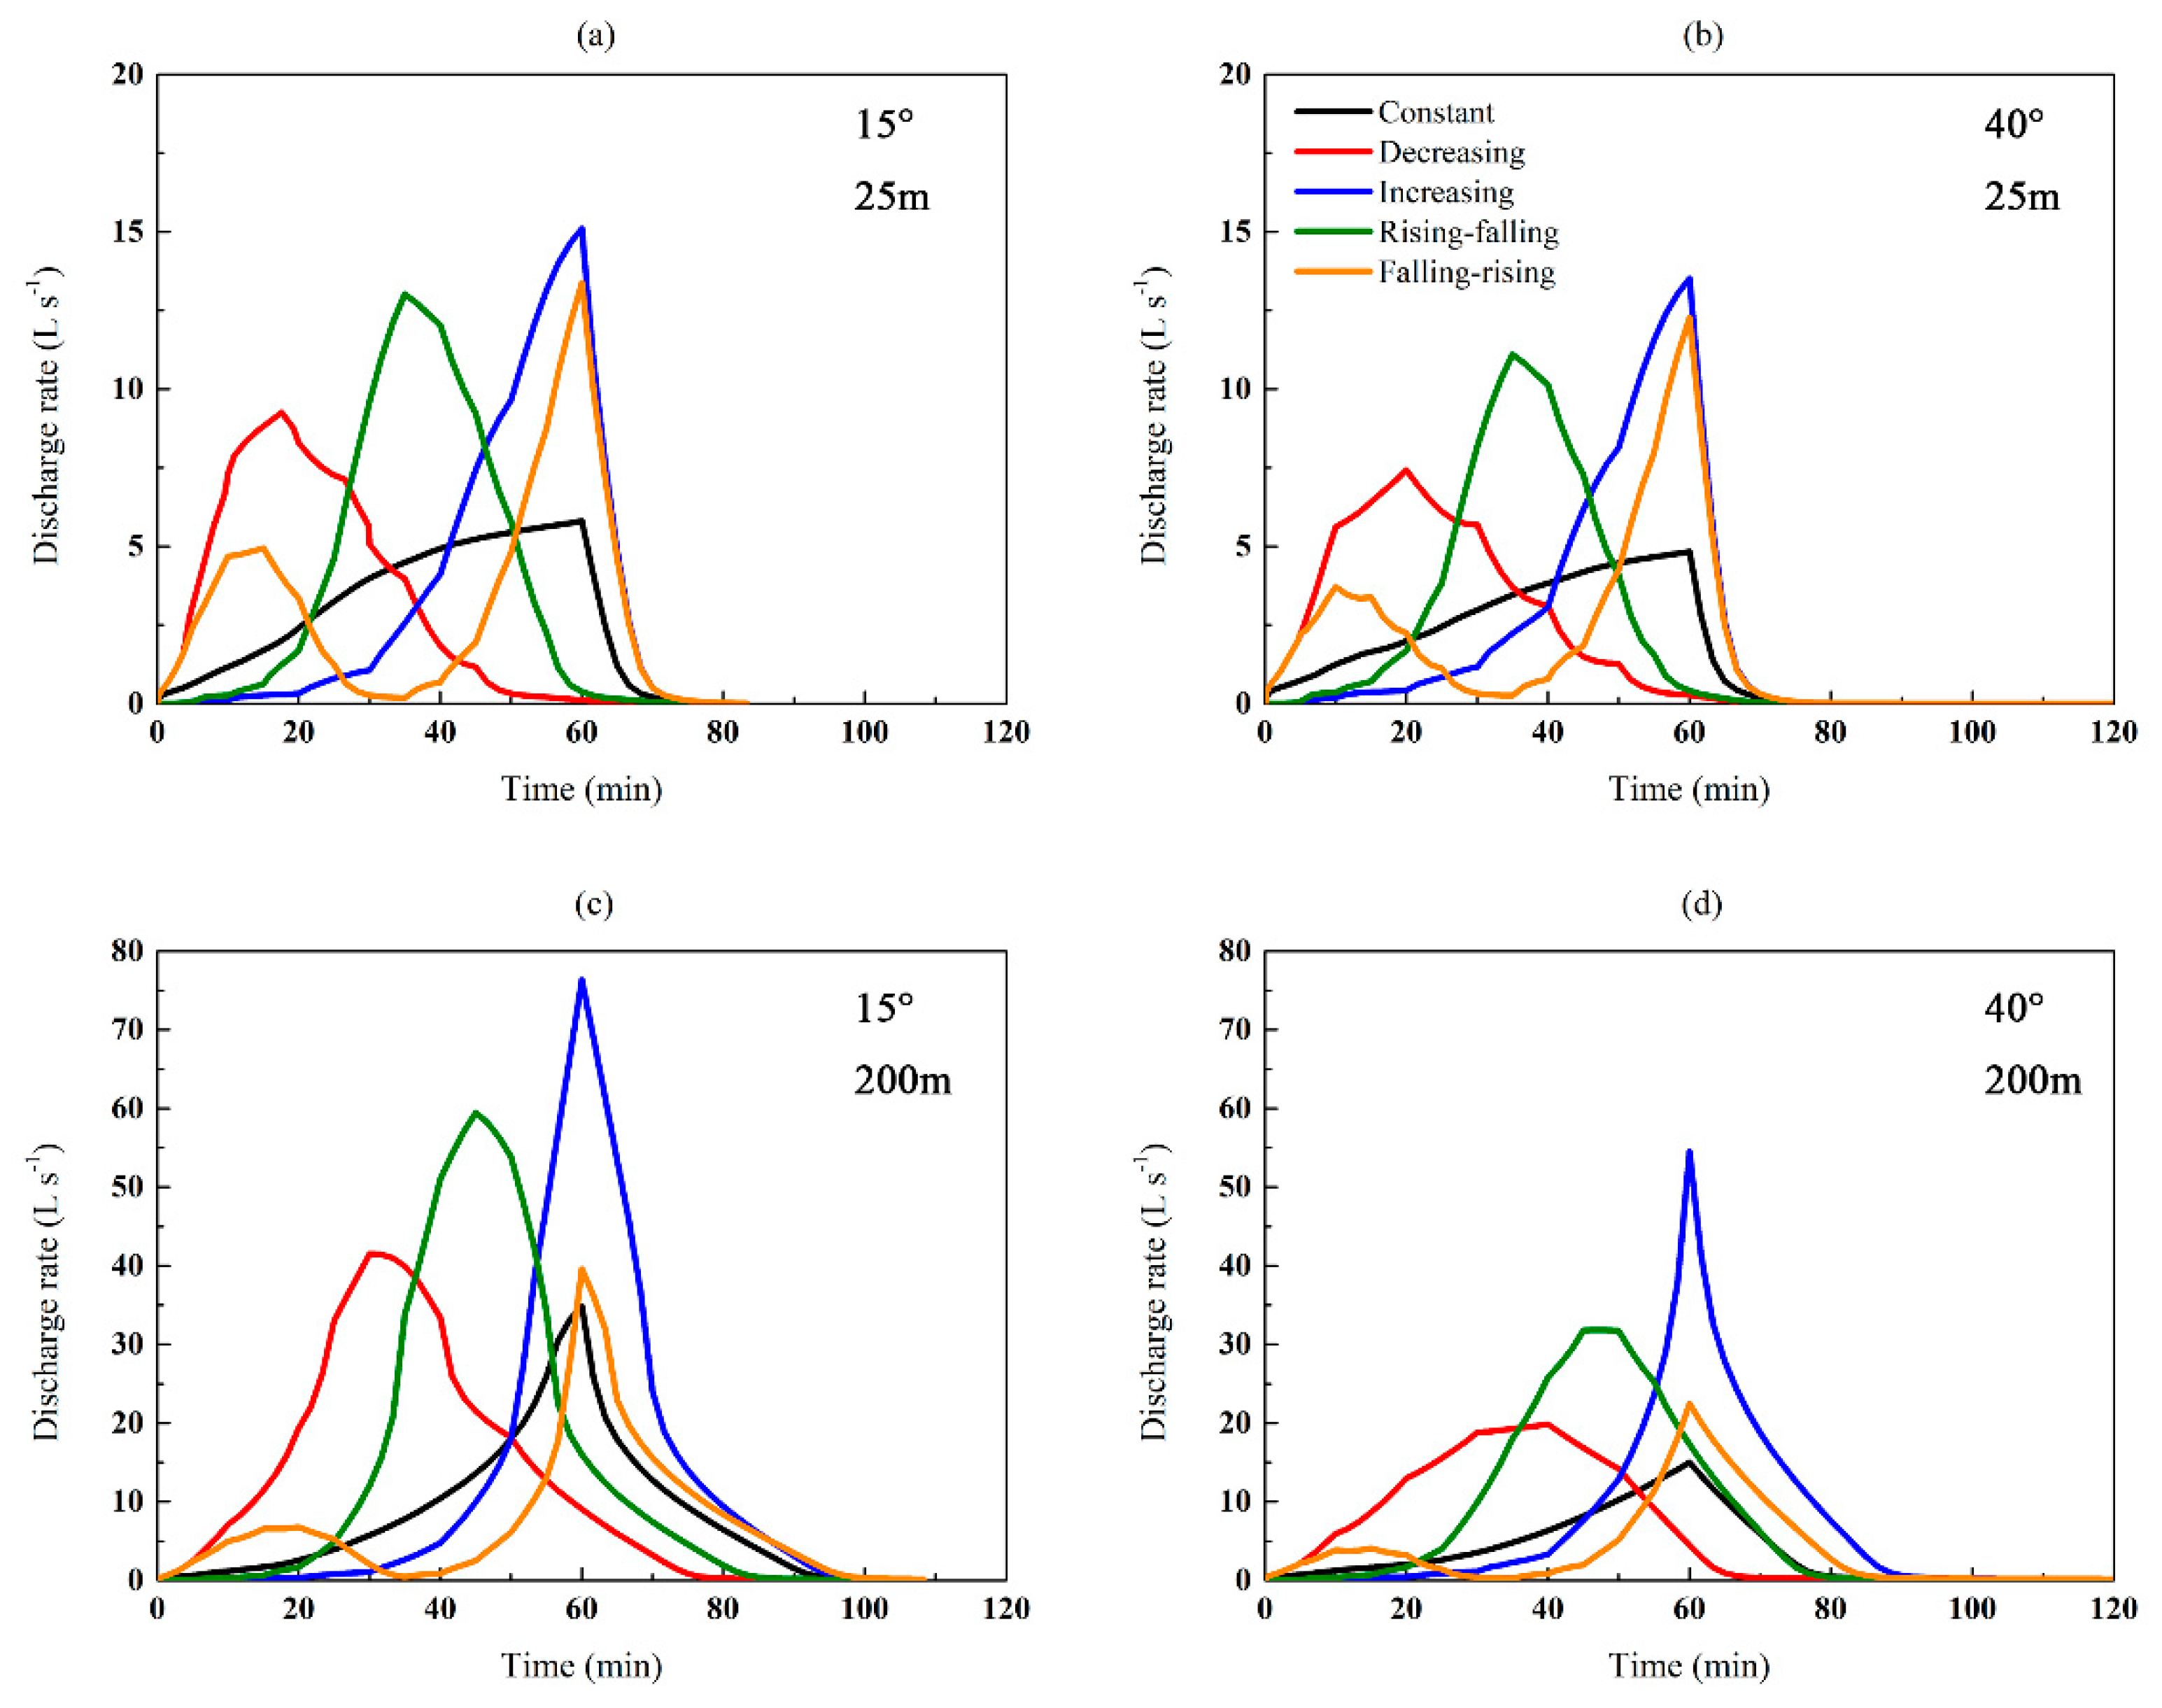
The peak discharge of the constant rainfall was the lowest (e.g., Figure 4). For increasing rainfall, the discharge rate kept increasing with time and reached the highest peak value among the five rainfall patterns at the end of the event. For the decreasing and rising-falling rainfalls, the peak discharges (Figure 4) were several minutes after the rainfall intensity decreased (Figure 2). The peak discharge of the falling-rising rainfall dropped a lot compared with other rainfalls as the projective slope length increased from 25 m to 200 m.

3.2. Soil Erosion

The soil erosion results of the rainfall scenarios at different projective slope lengths were summarized in Table 3. Similar to the hydrologic-response results, the increasing and rising-falling rainfalls had the largest total soil erosion, and the constant and falling-rising rainfalls had the least total soil erosion. This is due to the fact that rainfall-runoff was the controlling factor for soil erosion at the plot scale. Besides, at a same slope gradient, the relative difference between the soil erosion amounts of different rainfall patterns was up to 381% (Table 3). In general, relative differences in soil erosion among the five rainfall patterns were higher than relative differences in runoff under the same condition. The soil erosion amount at the different projective slope lengths were shown in Figure 5. Different from the runoff coefficient, the slope gradients that had the peak values of soil erosion amount were around 25°–40°, and this critical slope gradient decreased as projective slope length increased. Soil erosion amount of the rising-falling rainfalls became higher than that of the increasing rainfalls when slope length over 50 m. When the slope lengths were 25–100 m, soil erosion amount of the constant rainfalls were the lowest among the five rainfall patterns; while it became higher than that of the falling-rising rainfall when the slope length was 200 m. The sedigraphs were similar with the corresponding hydrographs. However, the erosion rate at the 40° slope with 25 m slope length was much higher than that at the 15° slope (Figure 6a,b), even the hydrographs at the two slopes only had small differences (Figure 4a,b). An example under rising-falling rainfall with 25 m slope length was shown in Figure 7.

4. Discussion

4.1. Effect of Rainfall Patterns on Total Runoff and Soil Erosion at Different Slope Lengths

For constant rainfalls, their total runoff and soil erosion were lower than those of increasing rainfalls, decreasing rainfalls and rising-falling rainfalls. It was consistent with previous studies. Dunkerley [3] observed that the runoff ratios of varying intensity rainfalls were 85–570% larger than that of constant rainfall and Wang et al. [35] found that the constant rainfall produced the lowest sediment yield at around 61.8% of the average soil loss for the increasing rainfall. Comparing the cumulative infiltration of increasing rainfalls, decreasing rainfalls and rising-falling rainfall with that of constant rainfalls (Figure 8), their gaps almost reached the highest value when slope was around 12 m, and then gradually stabilized as projective slope length increased. Thus, the differences in total runoff and soil erosion between these inconstant and constant rainfalls increased with increasing slope length. However, the total runoff and soil erosion amount of the constant rainfall become larger than those of falling-rising rainfall when the projective slope length was over 100 m (Figure 3 and Figure 5). Previous experimental studies did not find this as their plots were much shorter than 100 m. For instance, Wang et al. [35] adopted 2 m-long flume and Parsons and Stone [10] used 2.45 m-long flume in their rainfall exerpiments.
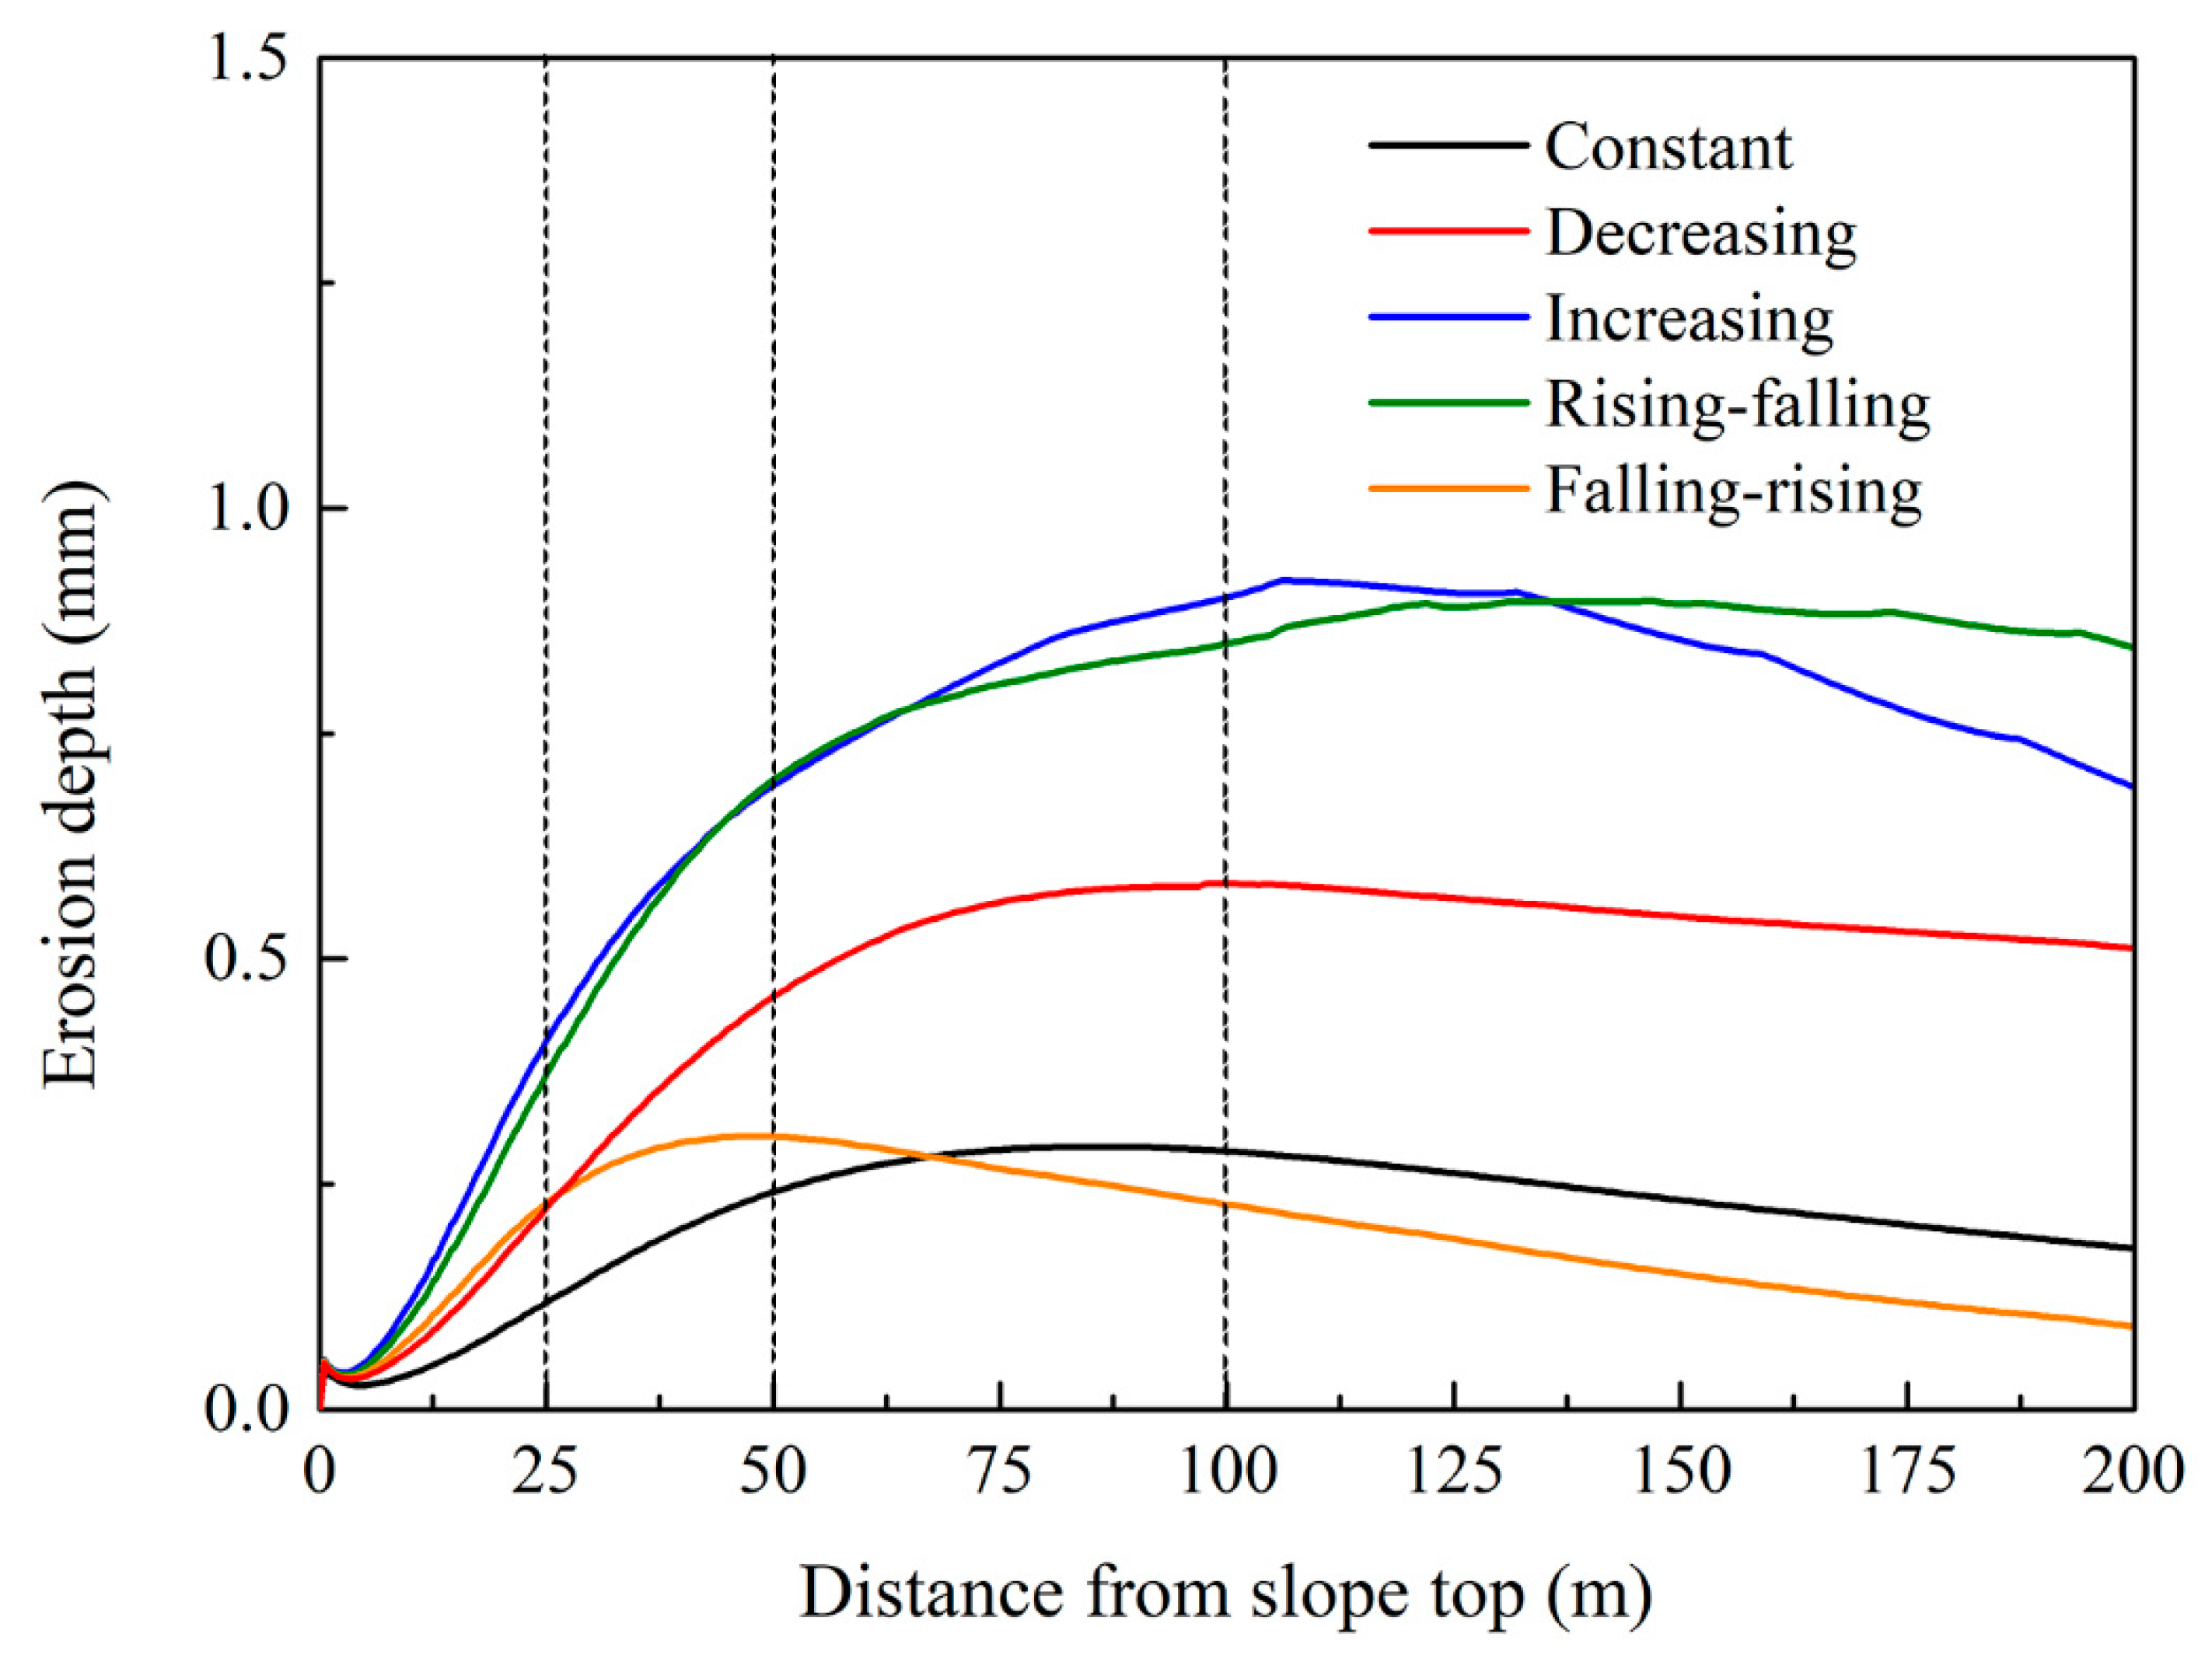
The cumulative infiltration of the constant rainfall along the slope axis was the highest, until the projective slope length was around 50 m as the cumulative infiltration of falling-rising rainfall became larger (Figure 8). When the slope was short, compared with the constant rainfall, there was not much water infiltrated downstream the slope during the low rainfall intensity period (i.e., rainfall intensity = 1 mm h−1) under the falling-rising rainfall, because the runoff generated during the first rainfall peak quickly flowed out of the slope. Thus, the cumulative infiltration of falling-rising rainfall was lower than the constant rainfall when projective slope length was shorter than 50 m (Figure 8), leading to larger total runoff, peak discharge (Figure 3a and Figure 4a) and erosion depth (Figure 9) than those of the constant rainfall. As slope length increased, for the falling-rising rainfall, the runoff generated during the first half of the event lasted longer before flowed out so that more water infiltrated downstream the slope during the low rainfall intensity period. Meanwhile, the recession period of the falling-rising rainfall became much longer than that of the constant rainfall (e.g., Figure 4c,d), which dramatically increased the cumulative infiltration (Figure 8). Due to these reasons, when slope length was over 100 m, the runoff coefficient of the constant rainfall became higher than that of the falling-rising rainfall (Figure 3c,d). Because of less infiltration downstream, less sediment deposited downstream the slope under the constant rainfall than the falling-rising rainfall (Figure 9), resulting in higher soil erosion amount when the slope length was over 100 m (Figure 5c,d). The results of the falling-rising rainfall indicated that, the runoff and soil erosion amount of such multi-peak rainfall may even lower than those of the uniform rainfall, especially when the slope length was long.
The total runoff and soil erosion of decreasing rainfall were much lower than those of increasing rainfall and rising-falling rainfall. It was in agreement with the experimental research on small plots by Dunkerley [3], which found the runoff ratio of late peak rainfall was double that of early peak rainfall, and numerical simulation research by Zhai et al. [11], which reported that the delayed rainfall pattern yield higher flood volume and peak than the early peak pattern. The reason was that the soil infiltrability remained high in the early part of the event under decreasing rainfall [36]. Higher cumulative infiltration of decreasing rainfall compared with those of increasing rainfall and rising-falling rainfall was obvious, especially when the projective slope length was shorter than 50 m (e.g., Figure 8). Moreover, the smaller total runoff and peak discharge under decreasing rainfall (e.g., Figure 4a,c) led to shallower erosion depth (Figure 8), due to much lower stream power and sediment transport capacity.
The simulation results also indicated that the rising-falling rainfall had the highest runoff and soil erosion amount than other rainfall patterns when projective slope length was over 50 m (Table 2 and Table 3), which was not consistent with previous studies. Dunkerley [3] indicated that the late peak rainfall had the highest peak runoff rate and runoff ratio. An et al. [8] reported that in their rainfall experiments the soil loss under increasing rainfall were the highest. The main reason was that, compared with rising-falling rainfall, the increasing rainfall had much longer recession period when slope was long (e.g., Figure 4c,d), leading to larger amount of infiltration and sediment deposition.

4.2. The Impact of Slope Gradient on Total Runoff and Erosion under Five Rainfall Patterns

From Figure 3 and Figure 5 it can be seen that, for all the five different rainfall patterns, total runoff or total soil erosion showed a trend that it increased with increasing slope gradient and then gradually decreased after a critical slope. The critical slope of the total runoff was 15°, which was independent of rainfall pattern and projective slope length. Taking the rising-falling rainfall as an example, Figure 10 shows the cumulative infiltration distribution along the slope axis at 10°–20° slopes. For slopes lower than 15° (e.g., 10°), overland flow velocity was slower than that on the 15° slope, thus leading to more infiltration, especially when the projective slope length was over 30 m (Figure 10). For slope steeper than 15° (e.g., 20°), because the slope length was longer than the 15° slope, overland flow had to travelled longer path to reach the outlet and caused more infiltration. It can be seen in Figure 10 that cumulative infiltration difference between 15° and 20° slopes was mainly lay in area 10–50 m and 150–200 m from the slope top. Wu et al. [37] also found the critical slope for runoff rate was around 11° regardless of rainfall duration and slope length through a modified Green-Ampt model. The critical slope of total runoff may be affected by the surface condition (e.g., vegetation coverage, surface roughness) and the soil property (e.g., permeability, soil surface sealing), which worth further investigation.
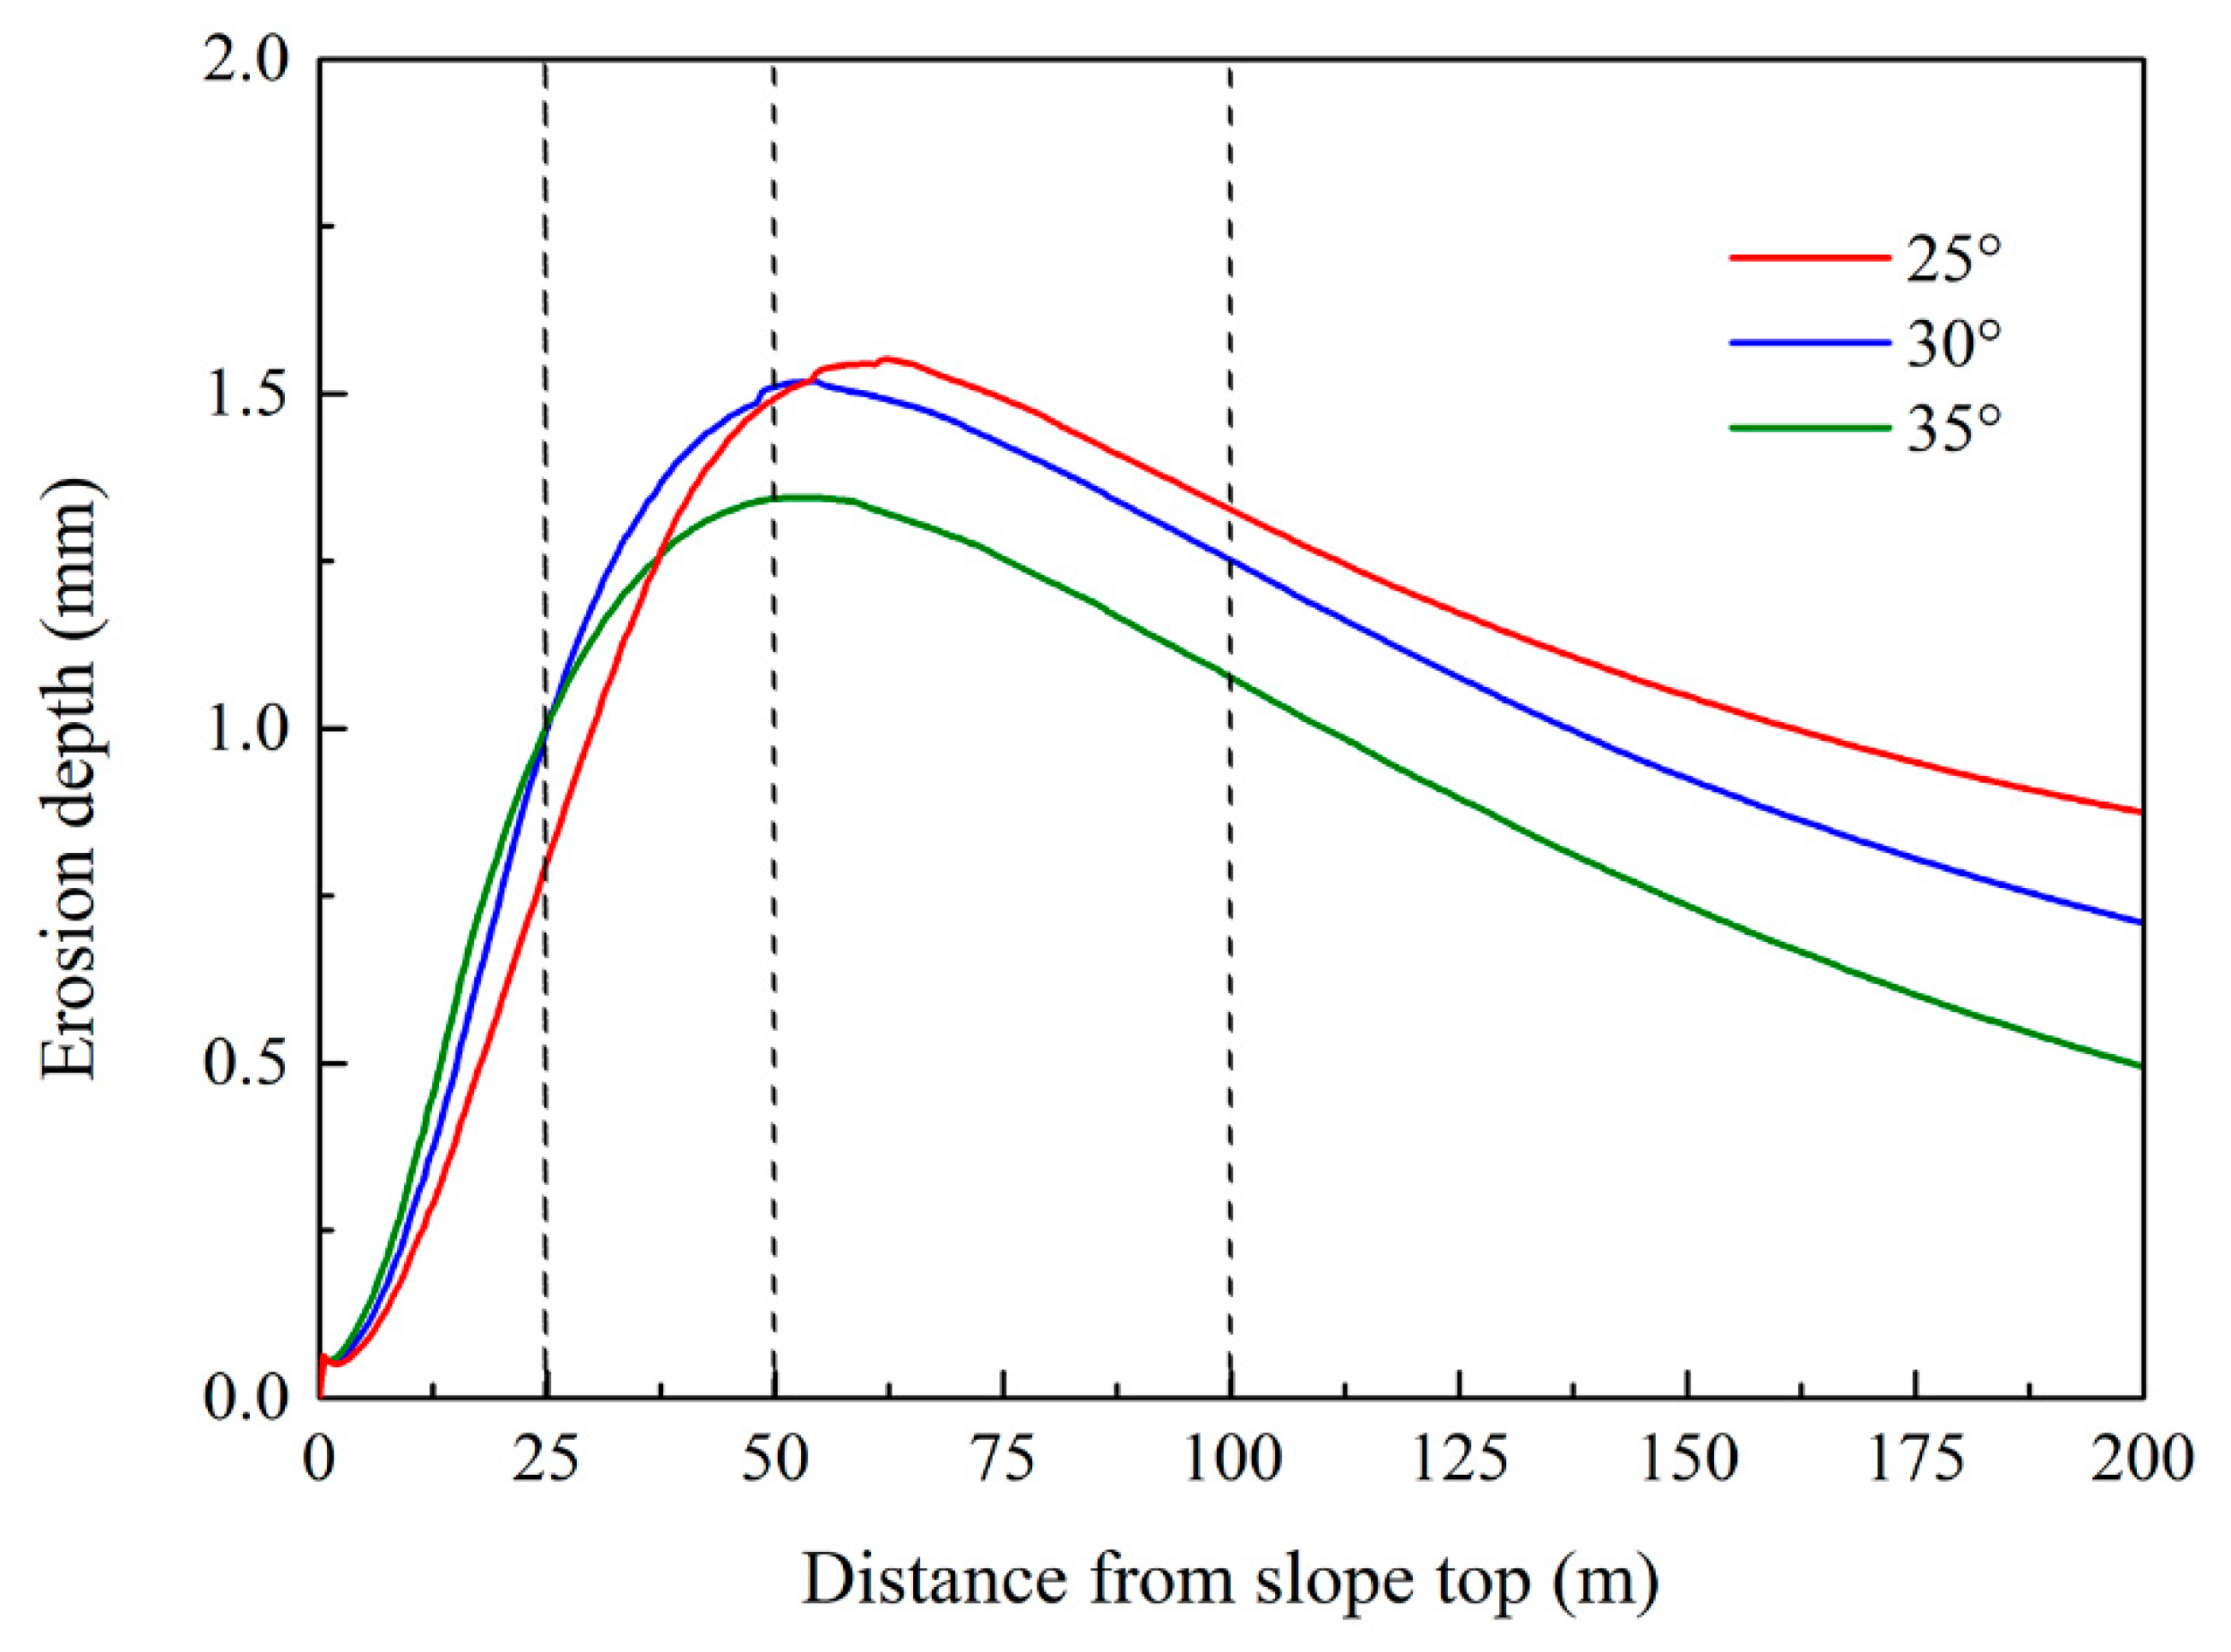
The critical slope of soil erosion amount decreased from 35° to 25° when projective slope length increased under five different rainfall patterns (Figure 5), except for constant rainfall at 25 m slope length. Such simulation result was close to the range of critical slope of soil loss often observed in the field, which was 20°–30° (e.g., [21,38]). The smaller critical slope maybe because their rainfall experiments adopted slopes with equal length. Generally, the critical slope for the constant rainfall was 5° larger than those of other rainfalls. Taking the rising-falling rainfall as an example, Figure 11 shows the erosion depth distribution along the slope axis at 25°–35° slopes. At 35° slope, the erosion depth curve rose more quickly than other slopes as projective slope length increased to 25 m, due to higher flow velocity and shear stress. Thus, the critical slope of soil erosion amount was 35° for the slope shorter than 25 m. As mentioned above, for slope steeper than 15°, the increase of slope gradient resulted in longer slope length and more infiltration. As the projective slope length increased, for each rainfall pattern, the reduction of runoff from 25° slope to 35° slope became larger (Figure 3) so that more sediment deposited on the slope. In consequence, the erosion depth curve at 25° slope finally reached the highest peak and decreased much slower than the other slopes when the projective slope length over 50 m (Figure 11). The critical slope of soil erosion amount was 25° for the slope longer than 100 m.

4.3. Effect of Rainfall Patterns on Runoff and Soil Erosion Peaks

The time and value of the peak discharge as well as peak erosion rate were greatly influenced by the rainfall pattern. For the non-constant rainfall patterns, the increasing rainfall had the highest peak discharges and peak erosion rates, which was also mentioned in previous studies (e.g., [33]). Under increasing rainfall, as the rainfall intensity gradually increased and the surface gradually became saturated, the discharge rate and soil erosion rate kept increasing and reached the highest peak discharge and erosion rate (e.g., Figure 4 and Figure 6) [39].
Because the infiltrability of the surface soil was high in the early part of the event, the decreasing and rising-falling rainfalls generally had lower peak discharges and peak erosion rates than the increasing rainfall (Figure 4 and Figure 6). The peak discharge and erosion rate of increasing rainfall were reached just at the end of the peak rainfall intensity, while those of decreasing rainfall were several minutes later than the end of the peak rainfall intensity. High infiltrability of the surface soil in the early part of the event may be also the reason for the delay of the peak discharge and erosion rate, which dramatically slowed down the runoff generation process. Under rising-falling rainfall, the time of the peak discharge and erosion rate was also later than the end of the peak rainfall intensity, but the time was shorter than that under decreasing rainfall as its peak time was during the middle of the event.
For the falling-rising rainfall, as the two high rainfall intensity periods were separated by the low-rainfall-intensity period (Figure 2), the rainfall amount for peak discharge was much less than other non-constant rainfalls. Thus, the peak discharges and erosion rates were lower than those the increasing rainfall (Figure 4 and Figure 6). As projective slope length increased, the effect of rainfall amount was more important so that the peak discharge and erosion rate under falling-rising rainfall was even lower than those of the decreasing rainfall on the 200 m slope.

4.4. Benefits and Future Work

This research work provided comprehensive theoretical studies on effects of rainfall patterns at slope scale. Even though it lacked field measurements as validation, the parameters of the slope that used in this study were well validated previously so the simulation results were rational and realistic for runoff and sediment research. The lumped and distributed simulation results showed how rainfall patterns affected runoff generation and soil erosion processes on the wide ranges of slope gradient (5° to 40°) and length (25–200 m), which can improve the accuracy of hillslope runoff and soil erosion prediction and be helpful for catchment flood management.
Table 4 illustrates the comparison between this study and previous studies, aiming at identifying the differences and emphasizing the findings of this study. In the future, the effect of rainfall patterns on hydrological responses at catchment scale will be explored. This study indicated that slope length and steepness may have great influence on the impact of rainfall patterns, and different features of hillslope length and steepness in a natural catchment will be carefully considered. Besides, rainfall patterns with multi-peak (e.g., falling-rising rainfall) showed great variety in runoff and soil erosion amount at different slope length compared with other rainfall patterns so more research effort can be put into it.
Additionally, in the modelling study a stable slope surface was assumed, which meant that evolution of rill was not considered on the surface. On steep and long hillslopes, rill may generate under heavy rainfall (e.g., [40]). As the surface flow and related soil erosion characteristics in rills are different from those in an interrill area [41], it may influence the runoff generation and erosion dynamics at various scales. Although addressing the influence of rill was beyond the scope of this study, it is worth further investigations.

5. Conclusions

In this study, the effect of rainfall pattern on runoff generation and soil erosion processes on slopes were analysed through numerical modelling. The modelling work provides infiltration, runoff and soil erosion differences among five rainfall patterns on wide ranges of slope gradient (5° to 40°) and slope length (25–200 m). The simulation result indicated that the rising-falling rainfall generally had the largest total runoff and soil erosion amount. The constant rainfall did not have the lowest total runoff and soil erosion amount when the projective slope length was over 100 m, which was higher than the falling-rising rainfall. The critical slope of the total runoff was 15°, which was independent of rainfall pattern and slope length. However, the critical slope of the soil erosion amount varied, which decreased with increasing projective slope length from 35° to 25°. And the critical slope for the soil erosion of the constant rainfall was generally 5° larger than that of other rainfalls. The increasing rainfall had the highest peak discharge and erosion rate just at the end of the peak rainfall intensity, while those of the decreasing and rising-falling rainfalls were lower and were several minutes later than the end of peak rainfall intensity.
These findings are helpful to improve the knowledge of the characteristics in runoff generation and soil erosion processes under various rainfall patterns at slopes, and they may be also beneficial for further understanding of hillslope morphology and ecology. Further work will be required for adequate meteorological and hydrological data to gain a more comprehensive understanding of rainfall pattern effects on hydrological processes at larger scale.

Author Contributions

Conceptualization, Q.R. and F.W.; Investigation, F.W. and J.G.; Writing—Original Draft Preparation, F.W. and J.G.; Writing—Review & Editing, Q.R. and J.G.

Funding

This research was funded by National Key Research and Development Program of China (2016YFC0402404) and National Natural Scientific Foundation of China (51679209).

Conflicts of Interest

The authors declare no conflict of interest.

References

  1. Dunkerley, D. Rain event properties in nature and in rainfall simulation experiments: A comparative review with recommendations for increasingly systematic study and reporting. Hydrol. Process. 2008, 22, 4415–4435. [Google Scholar] [CrossRef]
  2. Farrick, K.K.; Branfireun, B.A. Soil water storage, rainfall and runoff relationships in a tropical dry forest catchment. Water Resour. Res. 2014, 50, 9236–9250. [Google Scholar] [CrossRef]
  3. Dunkerley, D. Effects of rainfall intensity fluctuations on infiltration and runoff: Rainfall simulation on dryland soils, fowlers gap, australia. Hydrol. Process. 2012, 26, 2211–2224. [Google Scholar] [CrossRef]
  4. Singh, V.P. Effect of spatial and temporal variability in rainfall and watershed characteristics on stream flow hydrograph. Hydrol. Process. 1997, 11, 1649–1669. [Google Scholar] [CrossRef]
  5. Cerdan, O.; Bissonnais, Y.L.; Couturier, A.; Bourennane, H.; Souchère, V. Rill erosion on cultivated hillslopes during two extreme rainfall events in normandy, france. Soil Tillage Res. 2002, 67, 99–108. [Google Scholar] [CrossRef]
  6. Dolšak, D.; Bezak, N.; Šraj, M. Temporal characteristics of rainfall events under three climate types in slovenia. J. Hydrol. 2016, 541, 1395–1405. [Google Scholar] [CrossRef]
  7. Huff, F.A. Time distribution of rainfall in heavy storms. Water Resour. Res. 1967, 3, 1007–1019. [Google Scholar] [CrossRef]
  8. An, J.; Zheng, F.L.; Han, Y. Effects of rainstorm patterns on runoff and sediment yield processes. Soil Sci. 2014, 179, 293–303. [Google Scholar] [CrossRef]
  9. Dunkerley, D. An approach to analysing plot scale infiltration and runoff responses to rainfall of fluctuating intensity. Hydrol. Process. 2017, 31, 191–206. [Google Scholar] [CrossRef]
  10. Parsons, A.J.; Stone, P.M. Effects of intra-storm variations in rainfall intensity on interrill runoff and erosion. Catena 2006, 67, 68–78. [Google Scholar] [CrossRef]
  11. Zhai, X.Y.; Guo, L.; Liu, R.H.; Zhang, Y.Y. Rainfall threshold determination for flash flood warning in mountainous catchments with consideration of antecedent soil moisture and rainfall pattern. Nat. Hazards 2018, 94, 605–625. [Google Scholar] [CrossRef]
  12. Chen, L.; Sela, S.; Svoray, T.; Assouline, S. Scale dependence of hortonian rainfall-runoff processes in a semiarid environment. Water Resour. Res. 2016, 52, 5149–5166. [Google Scholar] [CrossRef]
  13. Parsons, A.J.; Brazier, R.E.; Wainwright, J.; Powell, D.M. Scale relationships in hillslope runoff and erosion. Earth Surf. Process. Landf. 2006, 31, 1384–1393. [Google Scholar] [CrossRef]
  14. Langhans, C.; Govers, G.; Diels, J.; Stone, J.J.; Nearing, M.A. Modeling scale-dependent runoff generation in a small semi-arid watershed accounting for rainfall intensity and water depth. Adv. Water Resour. 2014, 69, 65–78. [Google Scholar] [CrossRef] [Green Version]
  15. Guntner, A.; Bronstert, A. Representation of landscape variability and lateral redistribution processes for large-scale hydrological modelling in semi-arid areas. J. Hydrol. 2004, 297, 136–161. [Google Scholar] [CrossRef] [Green Version]
  16. Stomph, T.J.; Ridder, N.D.; Steenhuis, T.S.; Giesen, N.C.V.D. Scale effects of hortonian overland flow and rainfall-runoff dynamics: Laboratory validation of a process-based model. Earth Surf. Process. Landf. 2002, 27, 847–855. [Google Scholar] [CrossRef]
  17. Assouline, S.; Ben-Hur, M. Effects of rainfall intensity and slope gradient on the dynamics of interrill erosion during soil surface sealing. Catena 2006, 66, 211–220. [Google Scholar] [CrossRef]
  18. Essig, E.T.; Corradini, C.; Morbidelli, R.; Govindaraju, R.S. Infiltration and deep flow over sloping surfaces: Comparison of numerical and experimental results. J. Hydrol. 2009, 374, 30–42. [Google Scholar] [CrossRef]
  19. Defersha, M.B.; Quraishi, S.; Melesse, A. The effect of slope steepness and antecedent moisture content on interrill erosion, runoff and sediment size distribution in the highlands of ethiopia. Hydrol. Earth Syst. Sci. 2011, 15, 2367–2375. [Google Scholar] [CrossRef]
  20. Shi, Z.H.; Fang, N.F.; Wu, F.Z.; Wang, L.; Yue, B.J.; Wu, G.L. Soil erosion processes and sediment sorting associated with transport mechanisms on steep slopes. J. Hydrol. 2012, 454, 123–130. [Google Scholar] [CrossRef]
  21. Cheng, Q.; Ma, W.; Cai, Q. The relative importance of soil crust and slope angle in runoff and soil loss: A case study in the hilly areas of the loess plateau, north china. GeoJournal 2008, 71, 117–125. [Google Scholar] [CrossRef]
  22. Chaplot, V.A.M.; Le Bissonnais, Y. Runoff features for interrill erosion at different rainfall intensities, slope lengths, and gradients in an agricultural loessial hillslope. Soil Sci. Soc. Am. J. 2003, 67, 844–851. [Google Scholar] [CrossRef]
  23. Ebel, B.A.; Loague, K.; Montgomery, D.R.; Dietrich, W.E. Physics-based continuous simulation of long-term near-surface hydrologic response for the coos bay experimental catchment. Water Resour. Res. 2008, 44, 137–149. [Google Scholar] [CrossRef]
  24. Ran, Q.; Keith, L.; Verkwaak, J.E. Hydrologic-response-driven sediment transport at a regional scale, process-based simulation. Hydrol. Process. 2012, 26, 159–167. [Google Scholar] [CrossRef]
  25. Ebel, B.A.; Loague, K.; Borja, R.I. The impacts of hysteresis on variably saturated hydrologic response and slope failure. Environ. Earth Sci. 2010, 61, 1215–1225. [Google Scholar] [CrossRef]
  26. VanderKwaak, J.E.; Loague, K. Hydrologic-response simulations for the r-5 catchment with a comprehensive physics-based model. Water Resour. Res. 2001, 37, 999–1013. [Google Scholar] [CrossRef]
  27. VanderKwaak, J.E. Numerical Simulation of Flow and Chemical Transport in Integrated Surface-Subsurface Hydrologic Systems. Ph.D. Thesis, University of Waterloo, Waterloo, ON, Canada, 1999. [Google Scholar]
  28. Ran, Q.; Heppner, C.S.; Vanderkwaak, J.E.; Loague, K. Further testing of the integrated hydrology model (inhm): Multiple-species sediment transport. Hydrol. Process. 2007, 21, 1522–1531. [Google Scholar] [CrossRef]
  29. Ran, Q.; Hong, Y.; Li, W.; Gao, J. A modelling study of rainfall-induced shallow landslide mechanisms under different rainfall characteristics. J. Hydrol. 2018, 563, 790–801. [Google Scholar] [CrossRef]
  30. Heppner, C.S.; Ran, Q.; Vanderkwaak, J.E.; Loague, K. Adding sediment transport to the integrated hydrology model (inhm): Development and testing. Adv. Water Resour. 2006, 29, 930–943. [Google Scholar] [CrossRef]
  31. Johansen, M.P.; Hakonson, T.E.; Breshears, D.D. Post-fire runoff and erosion from rainfall simulation: Contrasting forests with shrublands and grasslands. Hydrol. Process. 2001, 15, 2953–2965. [Google Scholar] [CrossRef]
  32. Van Genuchten, M.T. A closed-form equation for predicting the hydraulic conductivity of unsaturated soils. Soil Sci. Soc. Am. J. 1980, 44, 892–898. [Google Scholar] [CrossRef]
  33. Gao, J.; Kirkby, M.; Holden, J. The effect of interactions between rainfall patterns and land-cover change on flood peaks in upland peatlands. J. Hydrol. 2018, 567, 546–559. [Google Scholar] [CrossRef] [Green Version]
  34. Flanagan, D.C.; Foster, G.R.; Moldenhauer, W.C. Storm pattern effect on infiltration, runoff, and erosion. Trans. ASAE 1988, 31, 546–559. [Google Scholar] [CrossRef]
  35. Wang, B.; Steiner, J.; Zheng, F.; Gowda, P. Impact of rainfall pattern on interrill erosion process. Earth Surf. Process. Landf. 2017, 42, 1833–1846. [Google Scholar] [CrossRef]
  36. Xue, J.; Gavin, K. Effect of rainfall intensity on infiltration into partly saturated slopes. Geotech. Geol. Eng. 2008, 26, 199–209. [Google Scholar] [CrossRef]
  37. Wu, S.; Yu, M.; Chen, L. Nonmonotonic and spatial-temporal dynamic slope effects on soil erosion during rainfall-runoff processes. Water Resour. Res. 2017, 53, 1369–1389. [Google Scholar] [CrossRef]
  38. Liu, Q.Q.; Xiang, H.; Singh, V.P. A simulation model for unified interrill erosion and rill erosion on hillslopes. Hydrol. Process. 2006, 20, 469–486. [Google Scholar] [CrossRef]
  39. Dunkerley, D. Stemflow production and intrastorm rainfall intensity variation: An experimental analysis using laboratory rainfall simulation. Earth Surf. Process. Landf. 2014, 39, 1741–1752. [Google Scholar] [CrossRef]
  40. Fang, H.; Sun, L.; Tang, Z. Effects of rainfall and slope on runoff, soil erosion and rill development: An experimental study using two loess soils. Hydrol. Process. 2015, 29, 2649–2658. [Google Scholar] [CrossRef]
  41. Wirtz, S.; Seeger, M.; Ries, J.B. Field experiments for understanding and quantification of rill erosion processes. Catena 2012, 91, 21–34. [Google Scholar] [CrossRef]
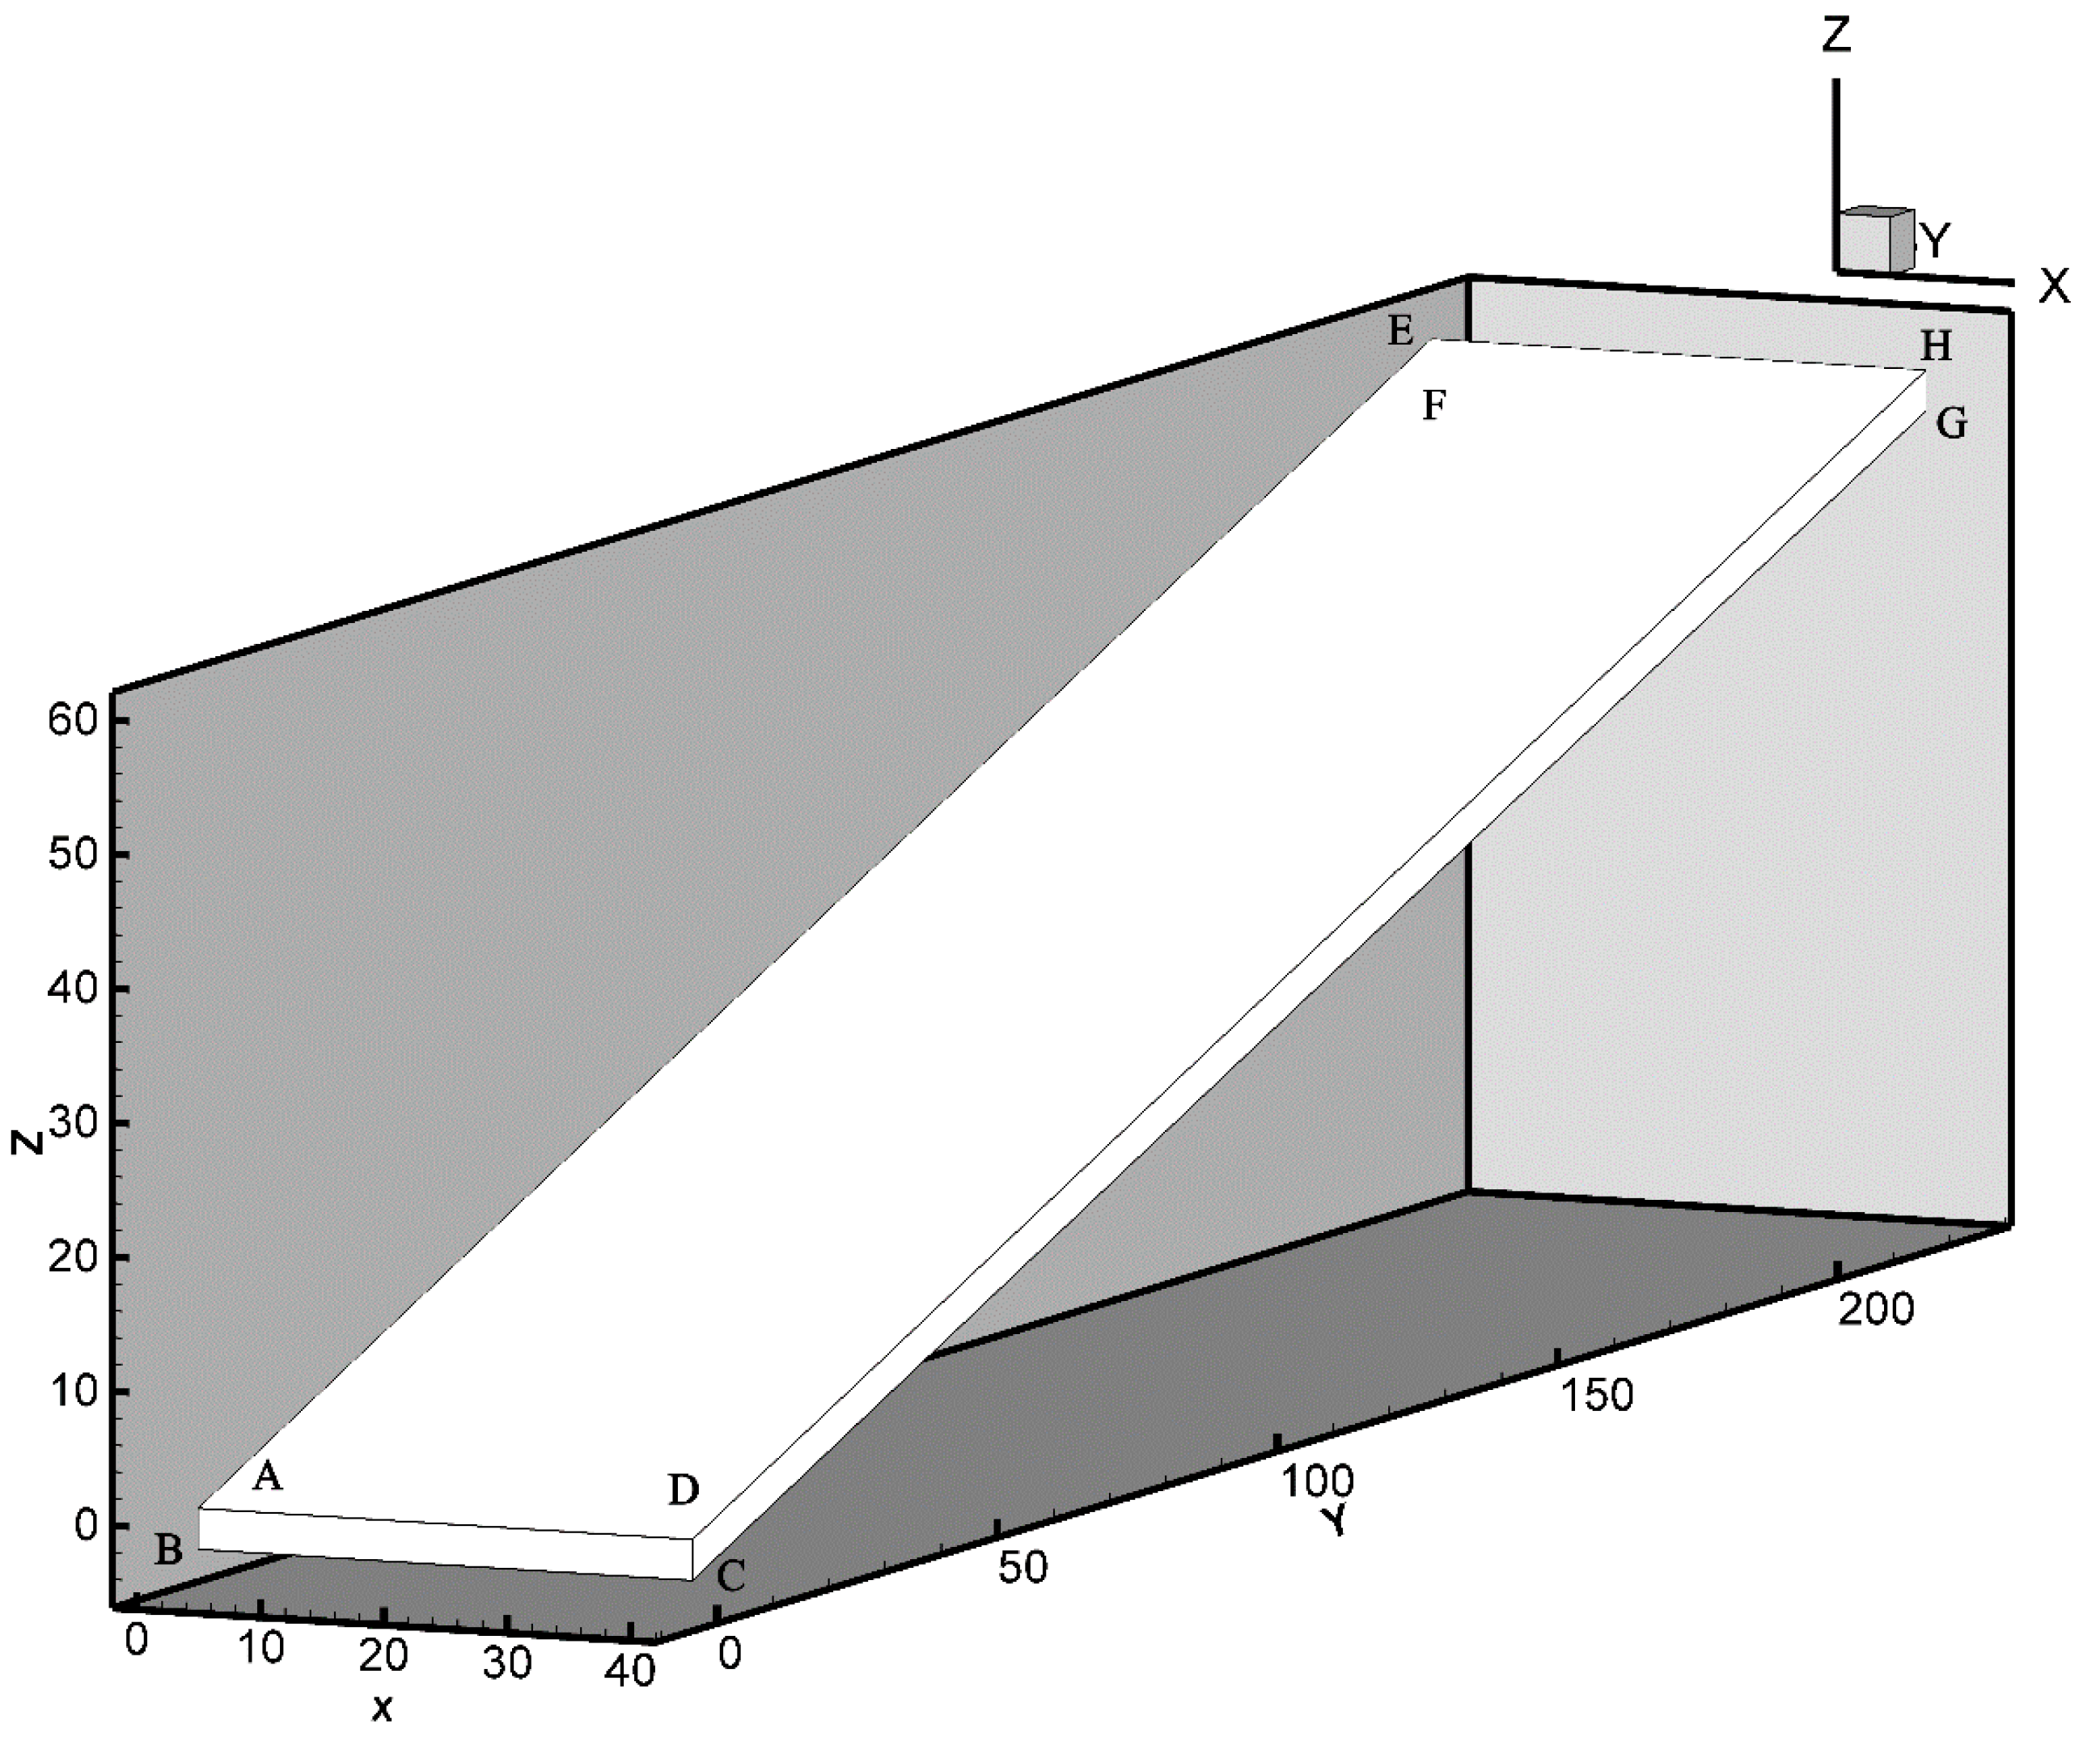
Figure 1. The schematic representation of the 200 m slope used the InHM modeling, and A-H represents each of the boundary nodes.
Water 11 02221 g001
Figure 2. Five different rainfall patterns. (a) constant, (b) decreasing, (c) increasing, (d) rising-falling and (e) falling-rising.
Water 11 02221 g002
Figure 3. The runoff coefficient at different slopes with projective slope lengths of (a) 25 m, (b) 50 m, (c) 100 m and (d) 200 m.
Water 11 02221 g003
Figure 4. The hydrographs of five different rainfall patterns with 25 m and 200 projective slope lengths at 15° slope (a,c) and 40° slope (b,d), respectively.
Water 11 02221 g004
Figure 5. The soil erosion amount at different slopes with projective slope lengths of (a) 25 m, (b) 50 m, (c) 100 m and (d) 200 m.
Water 11 02221 g005
Figure 6. The sedigraphs of five different rainfall patterns with 25 m and 200 projective slope lengths at 15° slope (a,c) and 40° slope (b,d), respectively.
Water 11 02221 g006
Figure 7. The comparison between the hydrographs and the sedigraphs under rising-falling rainfall at 25 m slope.
Water 11 02221 g007
Figure 8. The cumulative infiltration distribution along the slope axis at the 15° slope.
Water 11 02221 g008
Figure 9. The erosion depth distribution along the slope axis at the 15° slope.
Water 11 02221 g009
Figure 10. The cumulative infiltration distribution along the slope axis under rising-falling rainfall at 10°–20° slopes.
Water 11 02221 g010
Figure 11. The erosion depth distribution along the slope axis under rising-falling rainfall at 25°–35° slopes.
Water 11 02221 g011
Table 1. Parameters for the simulation.
ParametersValue
Porosity0.46
Species average grain diameter2.0 × 10−5 m
Manning coefficient0.275
Initial water table−5 m
Mobile water depth (i.e., depression storage)5 × 10⁻⁴ m
Height of microtopography0.01 m
Soil-water retention function (van Genuchten approach [32])α: 1.0
n: 1.23
θr: 0.088
Saturated hydraulic conductivity (Ks)10.8 mm h−1
Rainsplash coefficient2.93
Table 2. Simulated results of total runoff (m3) at different projective slope lengths.
Projective Slope Length (m)Rainfall Pattern10°15°20°25°30°35°40°
25Constant13.314.114.314.314.013.512.711.8
Decreasing15.916.516.616.516.115.514.613.5
Increasing17.318.118.318.318.017.416.715.7
Rising-falling17.618.218.318.117.817.216.415.3
Falling-rising14.315.415.815.815.515.014.313.3
50Constant21.723.423.723.422.521.119.216.9
Decreasing27.829.229.328.727.726.124.021.4
Increasing29.431.331.931.731.029.728.025.7
Rising-falling30.532.332.632.331.430.128.225.7
Falling-rising22.024.625.525.424.723.521.719.6
100Constant32.836.937.937.235.332.328.323.5
Decreasing45.049.350.349.547.444.139.633.9
Increasing47.351.853.252.951.348.544.639.5
Rising-falling49.654.355.655.353.650.846.841.5
Falling-rising30.035.637.637.736.433.930.426.2
200Constant43.451.553.952.949.243.335.727.4
Decreasing65.974.977.876.873.066.357.245.7
Increasing69.779.982.882.078.372.163.452.2
Rising-falling75.484.687.386.683.076.968.056.6
Falling-rising35.844.948.448.446.041.435.529.1
Table 3. Simulated results of total soil erosion (kg) at different projective slope lengths.
Projective Slope Length (m)Rainfall Pattern10°15°20°25°30°35°40°
25Constant66201385610867114914261666
Decreasing11636470311161586208725462574
Increasing179599119819612888371539653888
Rising-falling175567111417972607344637173620
Falling-rising10235272211911757232925922618
50Constant227794159025303527446548004248
Decreasing4111452293547296704783775346590
Increasing586211644427445963610,15498429102
Rising-falling58121274426733810,01710,48099939123
Falling-rising2611058231439315598625862105762
100Constant54721994662756610,40110,84596227629
Decreasing10604111879514,52318,10217,59015,87813,242
Increasing1571605312,78717,74519,75319,72018,44716,318
Rising-falling1559596212,57919,62021,46521,17319,70317,396
Falling-rising48721864993838910,82711,32010,5899150
200Constant9554250919314,61817,35816,38413,3739548
Decreasing2205903719,43628,85030,83128,97724,98219,345
Increasing289513,00227,69932,26233,44931,75328,03022,777
Rising-falling317913,56229,35934,86536,06334,38930,60525,198
Falling-rising6603370786612,56415,04614,90113,04710,428
Table 4. Comparison of the findings between the current and previous studies.
SourceExperiment SetupScenario ArrangementFindingComparison with This Study
Parsons and Stone [10]2.43 m-long, 0.9 m-width, 0.2 m-depth flume, 10° slope, three soil types. Intensity from 46.4 to 170.8 mm h−1, 93.9 mm h−1 on average.A constant-intensity storm are reduced by about 25% compared to varied-intensity storms.1. Conform part: Total runoff and soil erosion were lower than those of increasing, decreasing and rising-falling rainfalls.
2. Non conform part: The rising-falling rainfall generally had the largest runoff and soil erosion amount, while the constant rainfall did not have the lowest ones when the projective slope length was over 100 m.
An et al. [8]8 m-long, 1.6 m-width, 0.2 m-depth flume, 5° and 10° slope, pre wetted silt loam soil.Intensity from 50 to 100 mm h−1, 75 mm h−1 on average.Soil loss from varying-intensity rainfalls was 1.13 to 5.17 times greater than that from even-intensity rainfall. Soil loss under increasing rainfall were the highest.
Dunkerley [3]0.5 m × 0.5 m plot, 0.2° slope, loam soil.Intensity peaked at 30 mm h−1, 10 mm h−1 on average.Late peak events had the highest peak runoff rate and runoff ratio, which were more than double those of the early peak events. The constant rainfall yielded the lowest total runoff and runoff rate.
Wang et al. [35]2 m-long, 1 m-width, 0.5 m-depth flume, 10° slope, pre wetted clay loam soil.Intensity from 50 to 100 mm h−1, 75 mm h−1 on average.The constant rainfall produced the lowest sediment yield at around 61.8% of the average soil loss for the increasing rainfall, which had the highest soil loss.
Zhai et al. [11] Hydrological simulation study at catchment around 100 km2.Intensity from 7 to 69 mm h−1, about 20 mm h−1 on averageThe delayed rainfall pattern yield higher flood volume and peak than the early peak pattern.Consensus
Wu et al. [37]Theoretical framework work at 22.1 m long slopes from 0.5° to 60°.No description.Critical slope for runoff rate was around 11° regardless of rainfall duration and slope lengthThe critical slope of the runoff was close, and was also independent of slope length.
Cheng et al. [38]2 m × 5 m plot, 5° to 25° slope, sandy loam soil. 72 mm h−1 rainfall for 30 min.Soil loss increased with increasing slope angle till the critical slope angle of 20°–30°.The range of critical slope of the soil erosion was close.