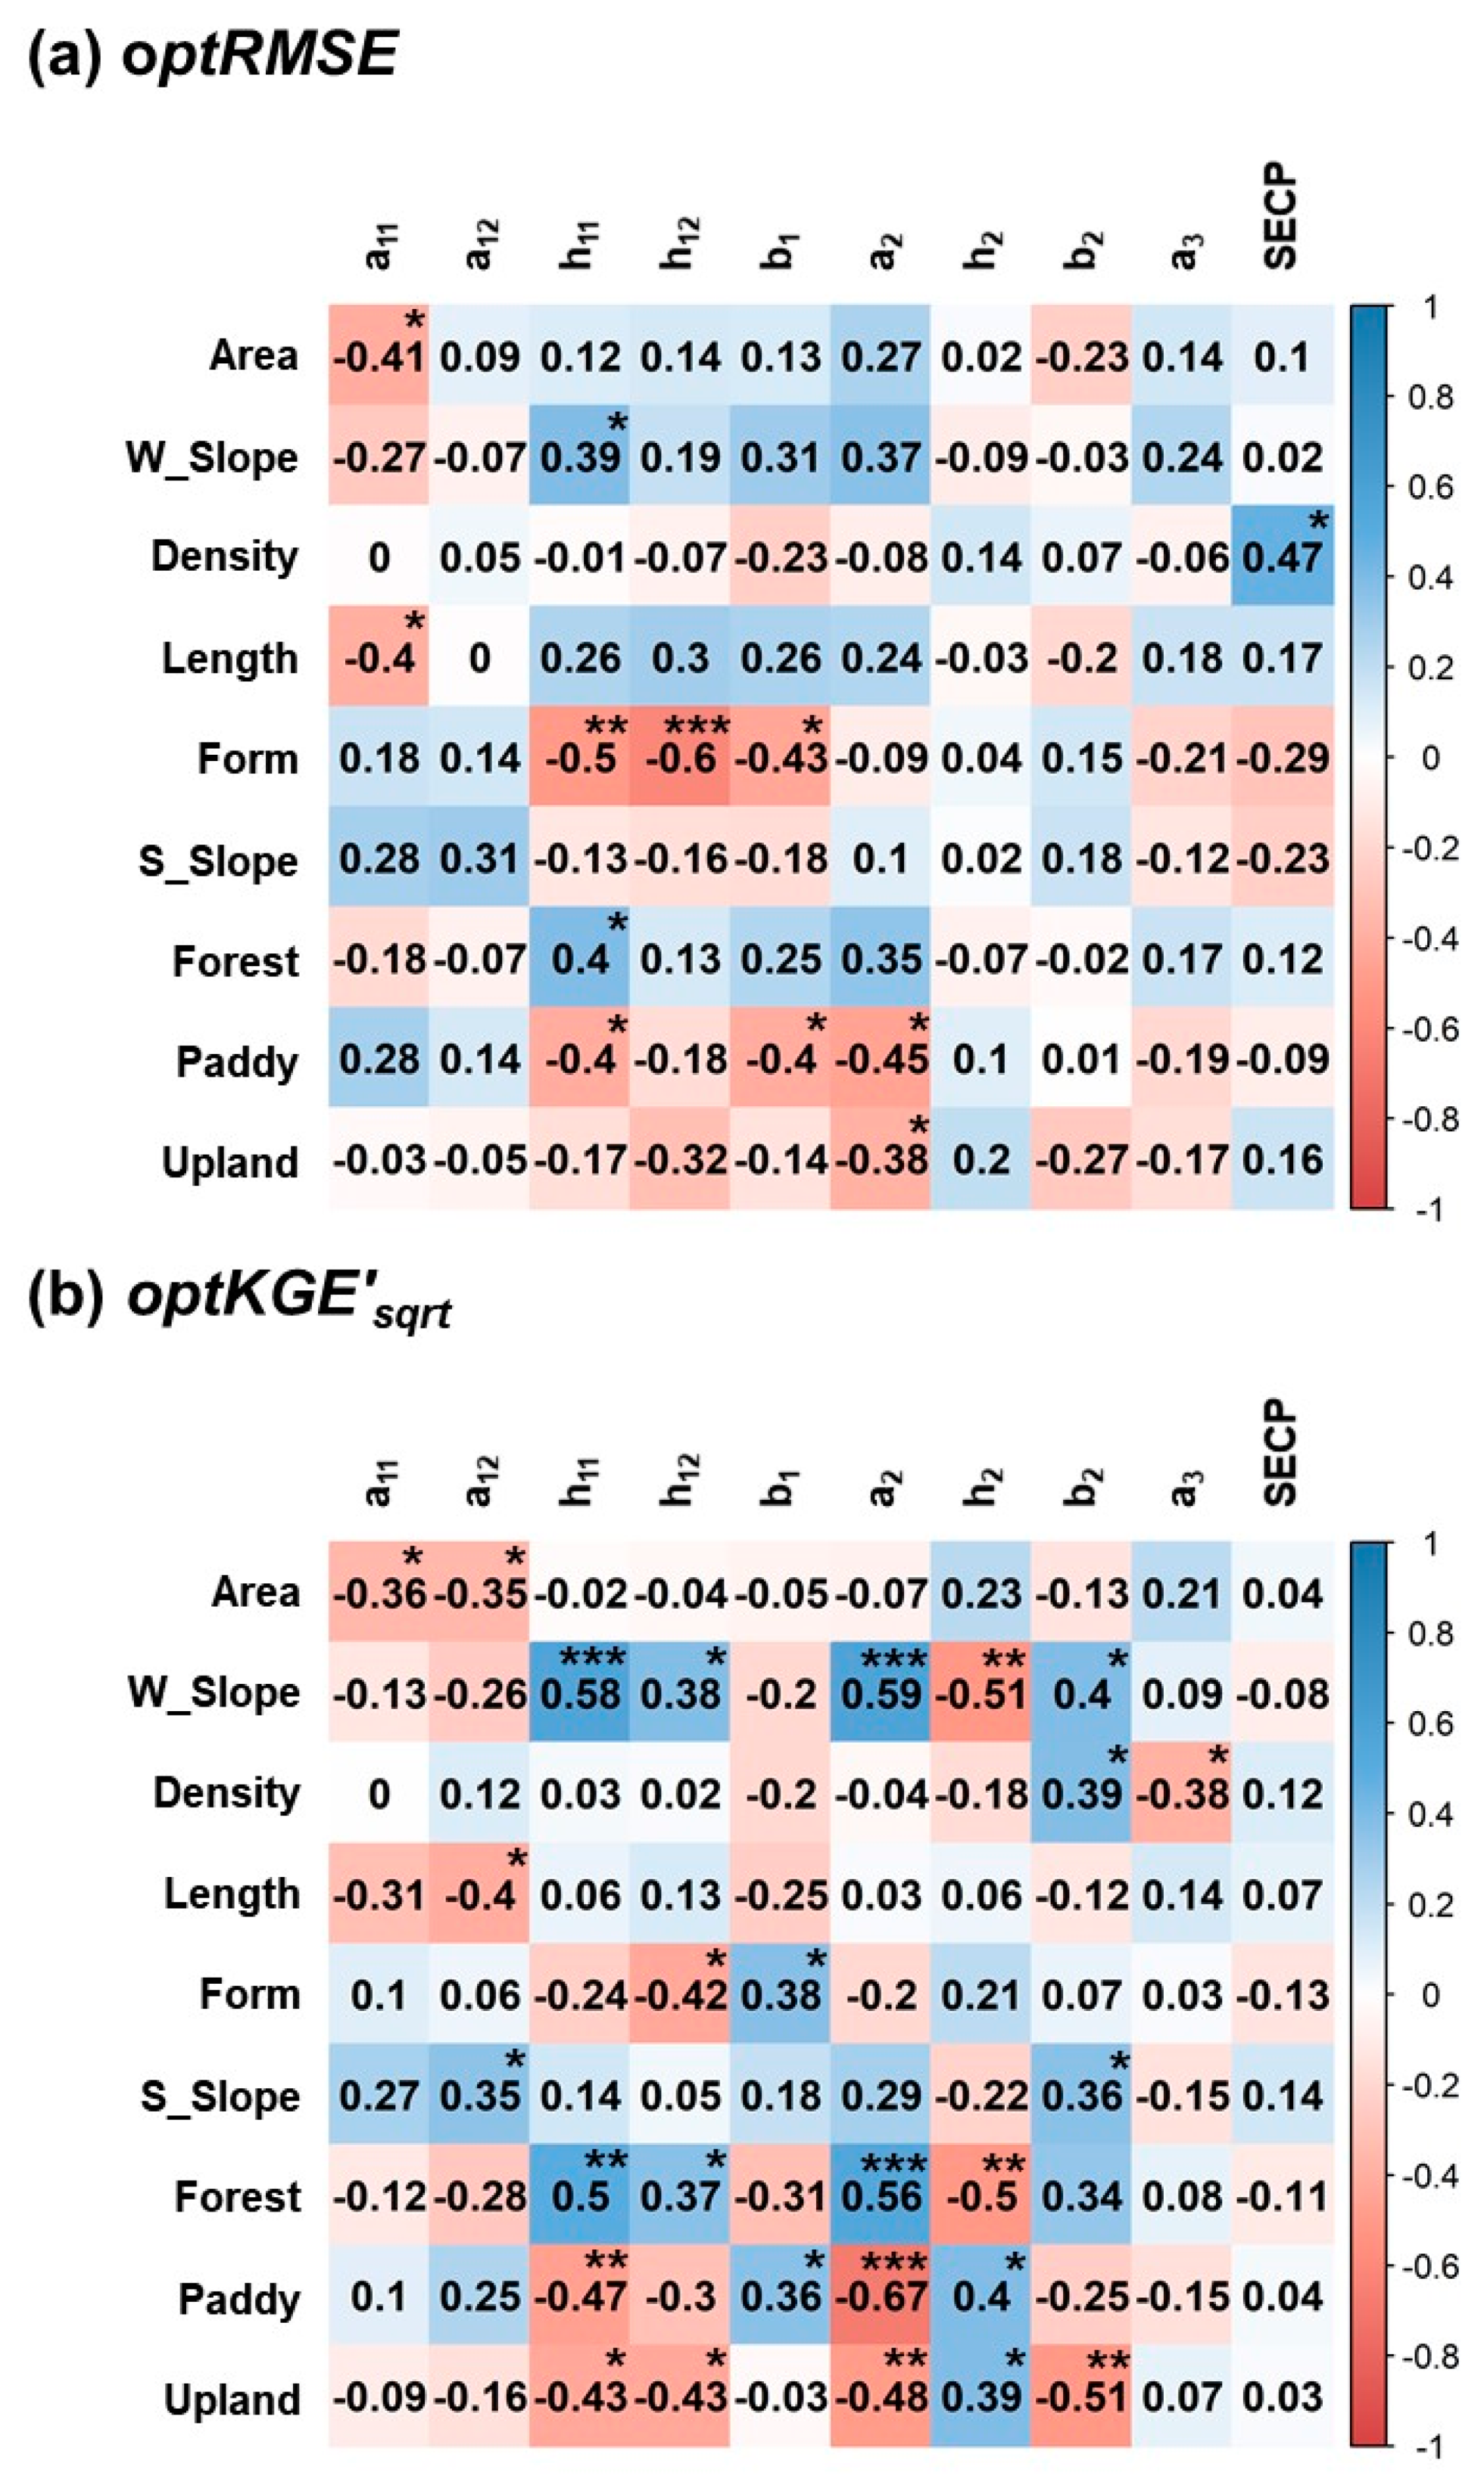
4.2.1. Regionalization of the 3-Tank Model
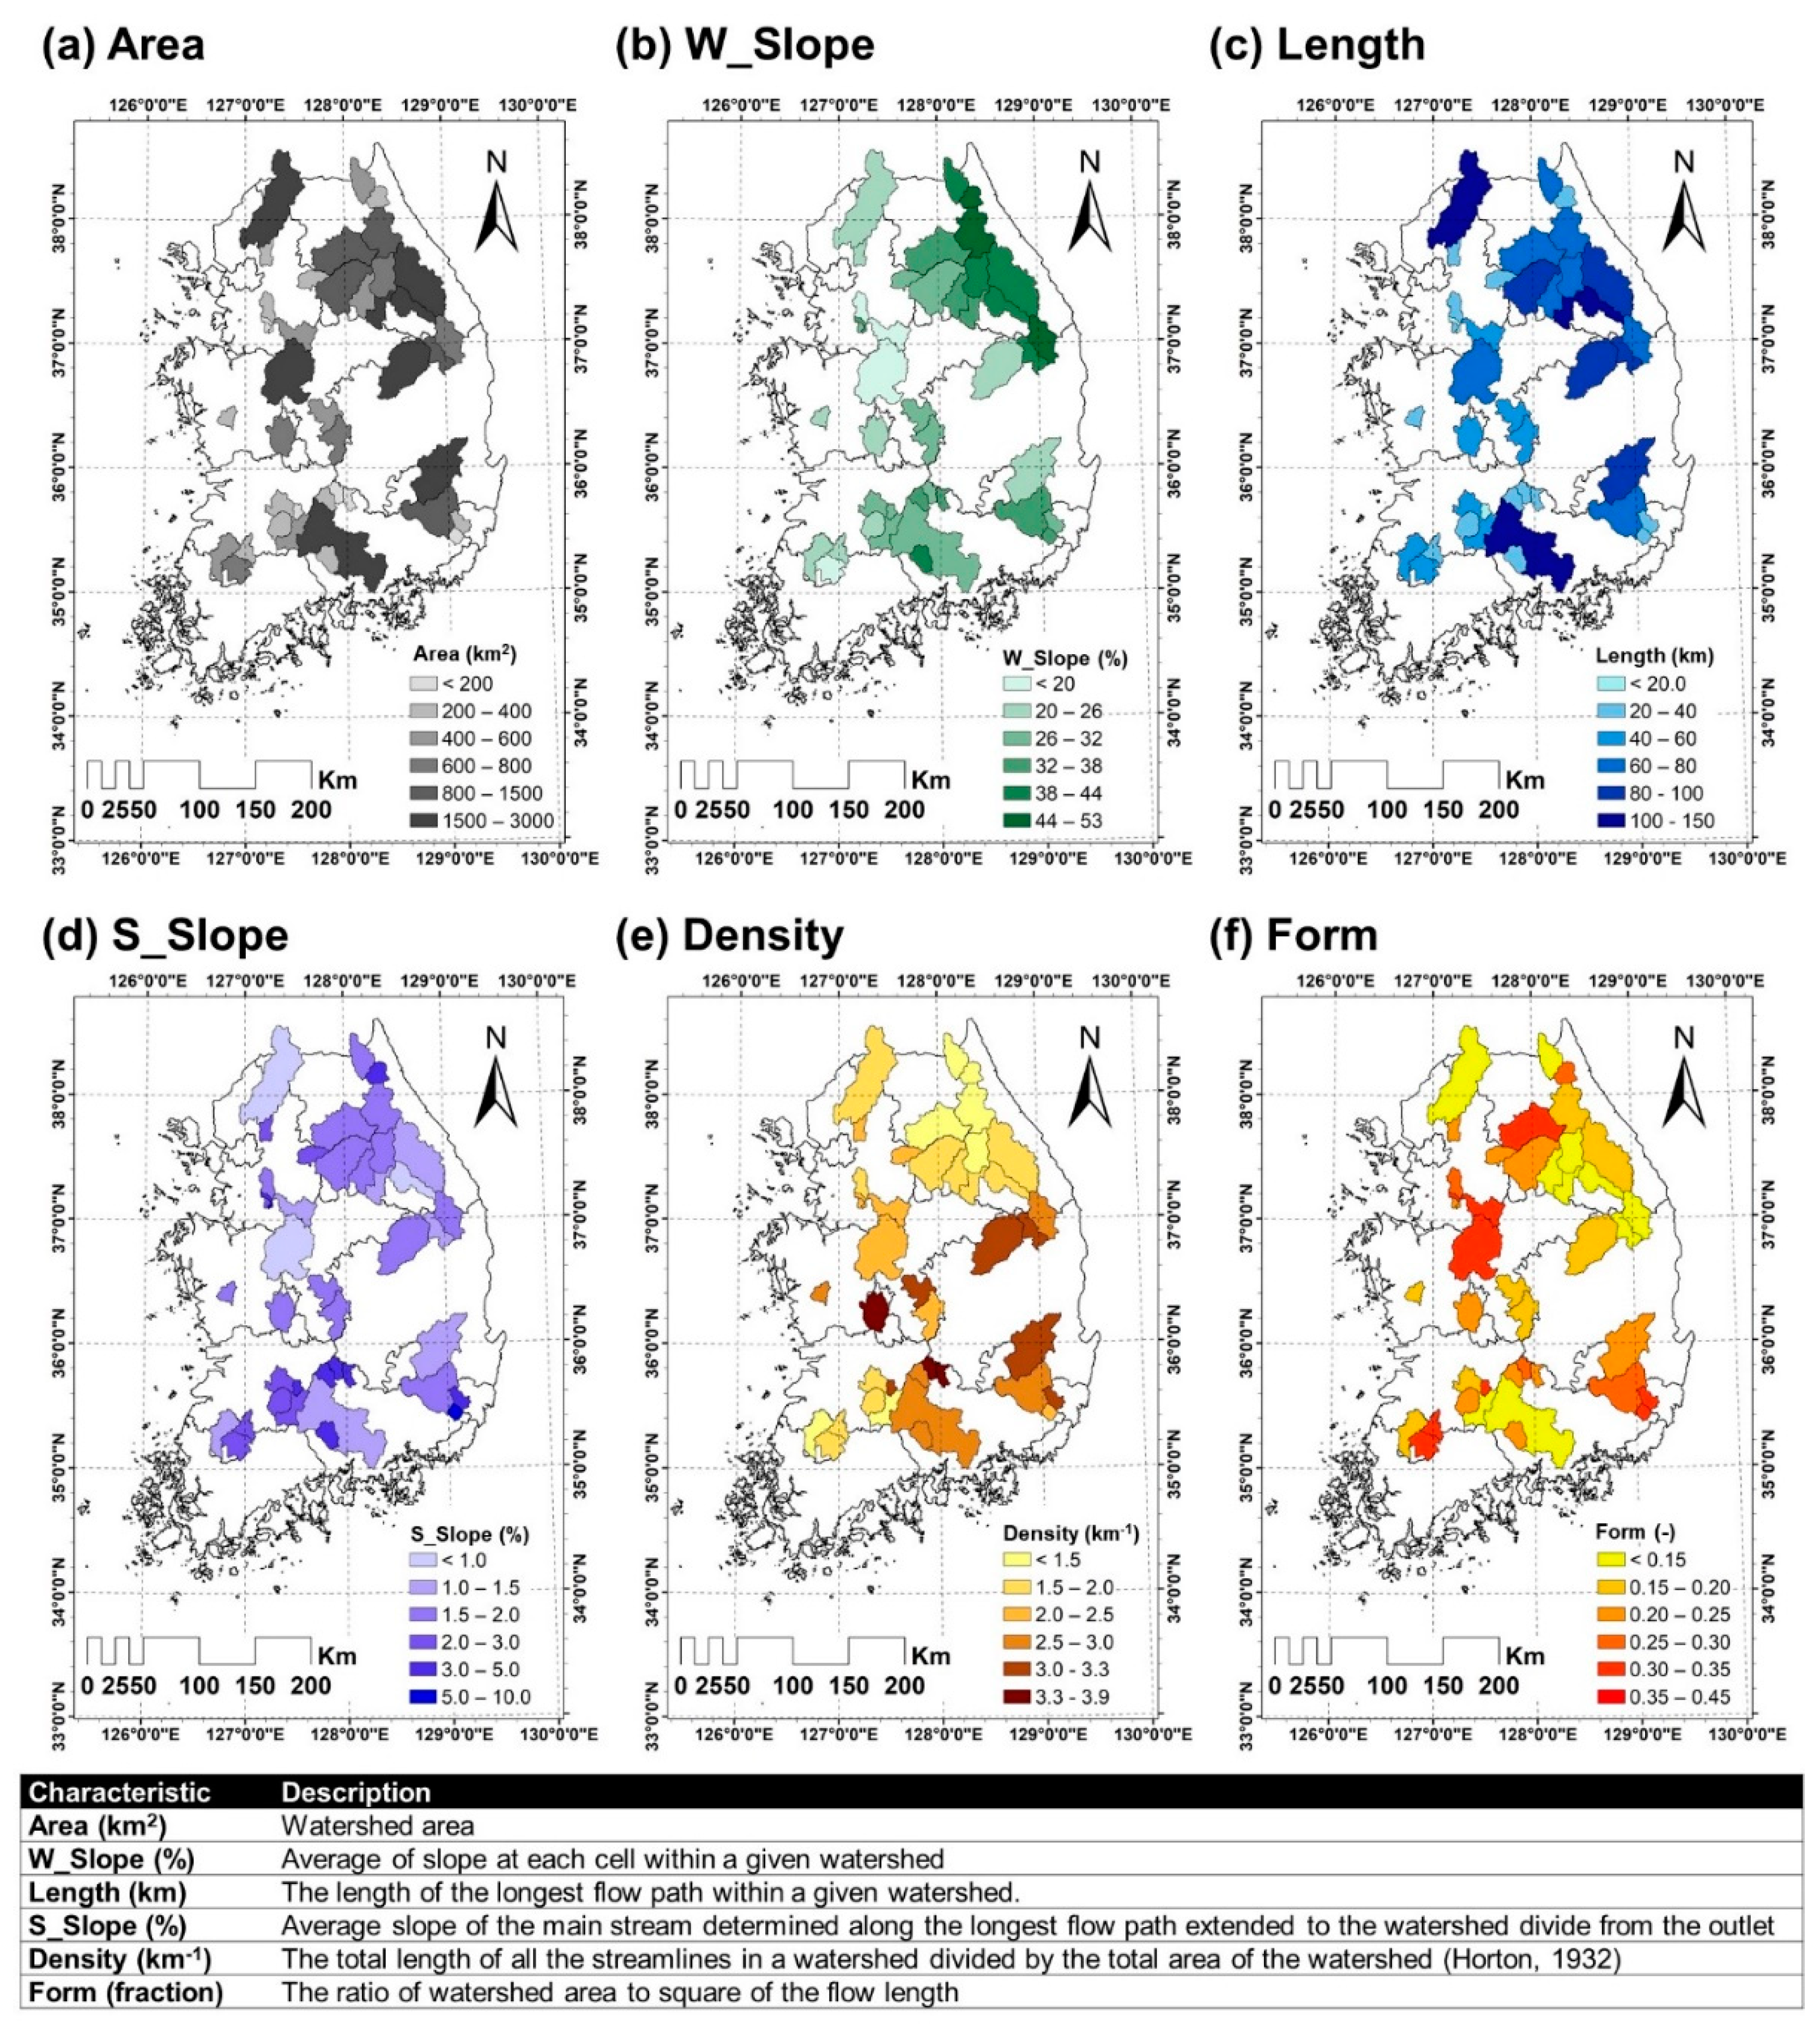
The correlation structure between calibrated parameter values and selected hydrologic features of the watersheds was investigated to identify key watershed characteristics (
Figure 5). At least six of the parameters were correlated (
,
) to one or more of the watershed features. The five parameters that were associated with the first layer (or the top tank) of the 3-Tank model, including
,
,
,
, and
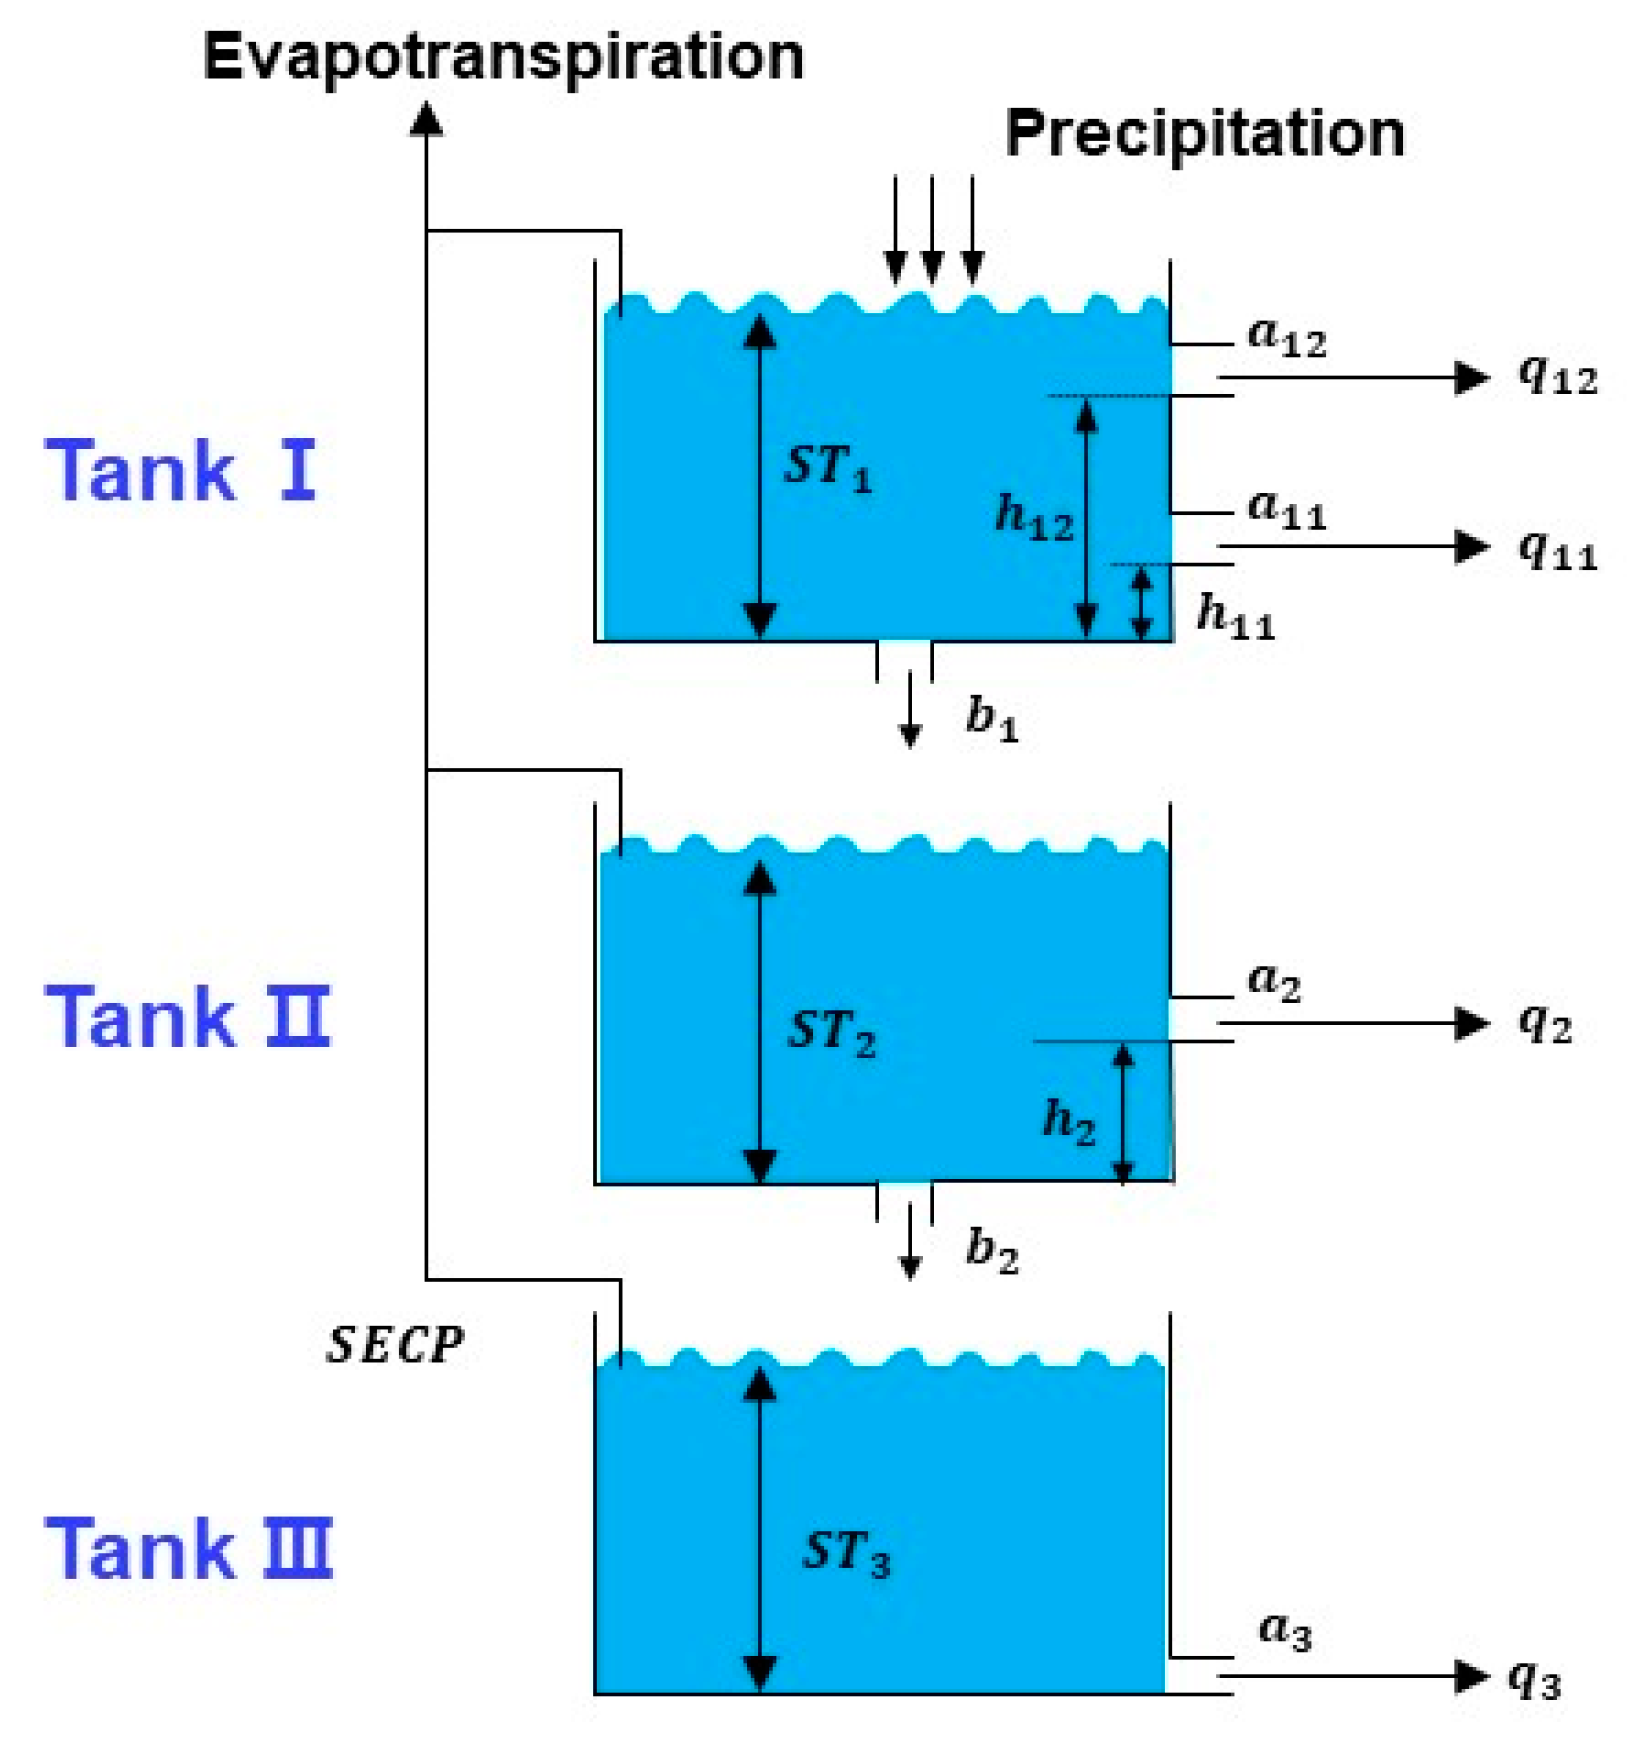
, turned out to be correlated to topographic factors, such as W_Slope, Length, S_Slope, and Form. Such a correlation structure was expected, as the first layer of a Tank model is usually introduced to simulate hydrological processes happening on the ground surface, such as direct runoff generation and routing [
8,
9,
13].
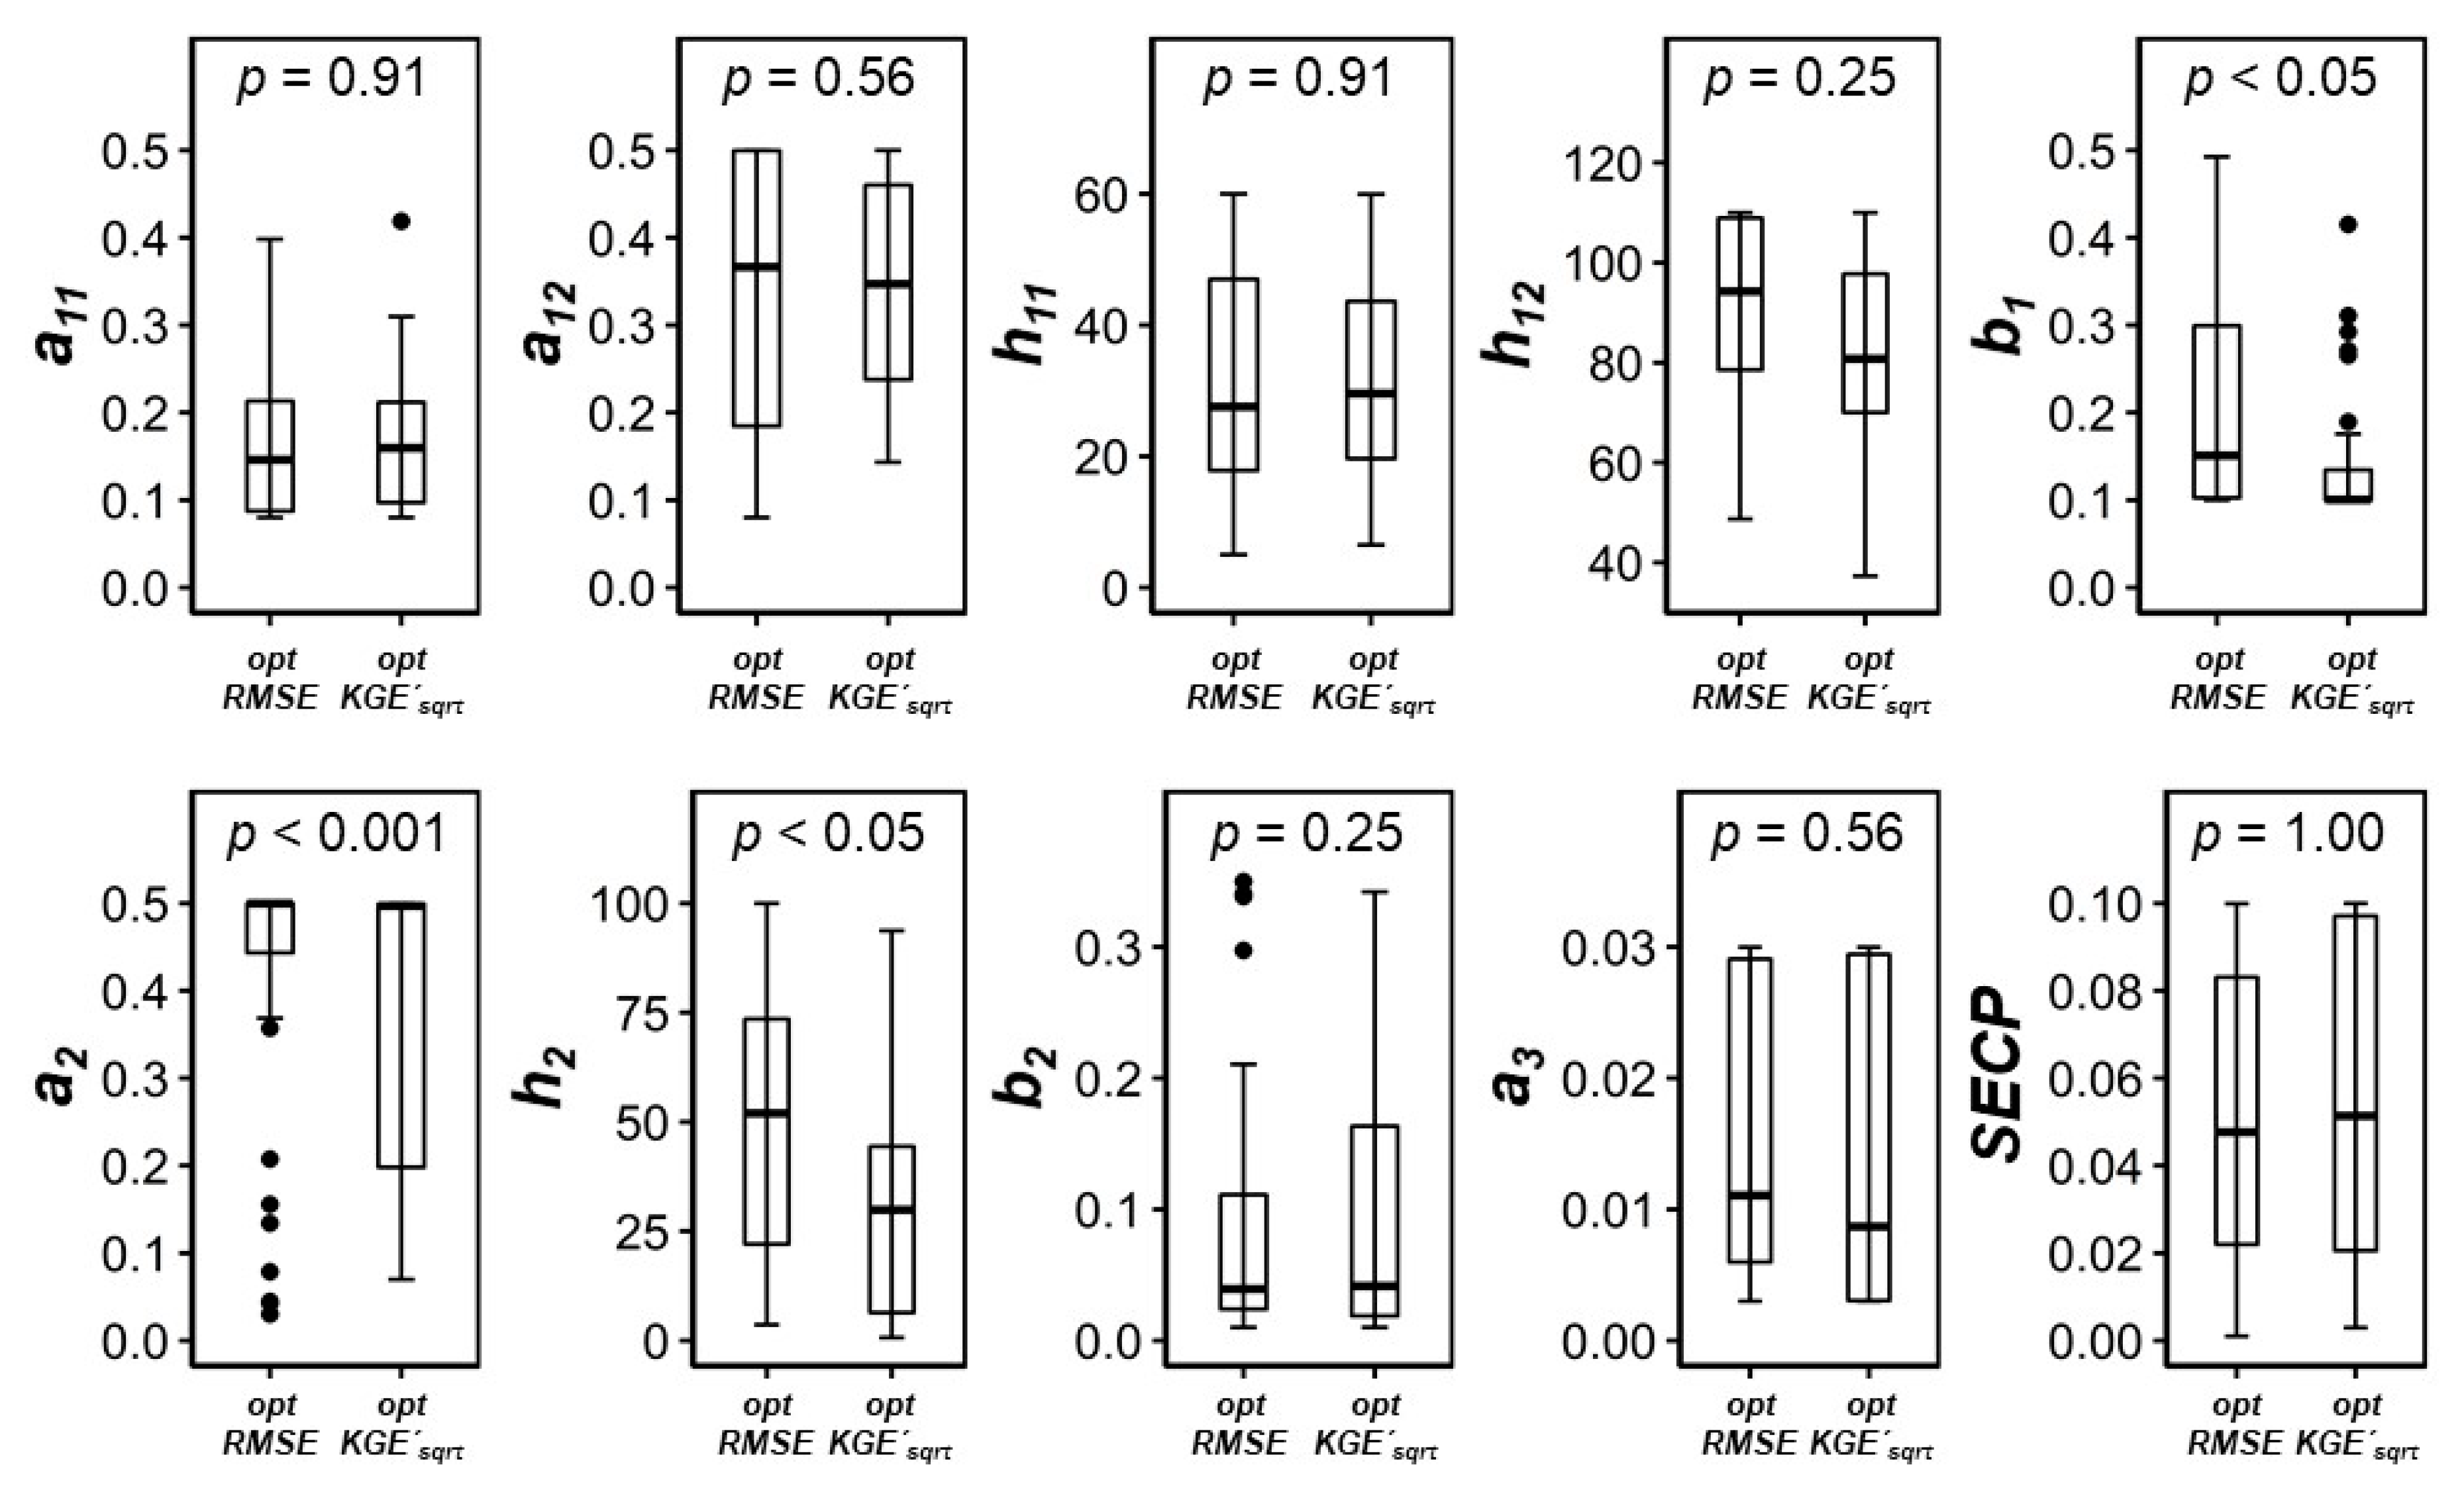
In the case of using the objective function of
, close correlation structures (
,
) were found in between Form and the heights of two side outlets of the first layer,
and
(
Figure 5). When
was employed as the objective function, however,
showed a close relationship with W_Slope (
,
), and
. was associated with Form (
,
) and Upland (
,
). The outlet heights,
and
, of the first layer control the quick runoff response and high (and peak) flow of a watershed, respectively, and they control the surface storage capacity at the beginning of an event (
) and the total surface storage capacity (
) of the upper layer [
8,
17,
37,
65]. Thus, the findings imply that direct runoff of the study watersheds is relatively heavily controlled by Form, W_Slope, and Upland than the other watershed features, which is corroborated by our understanding and previous studies [
8,
66,
67,
68].
The parameters of the second tank (
,
, and
and third tank (
) determine the shapes of recession and baseflow-only parts of a streamflow hydrograph [
8]. The calibrated values of
are relatively strongly correlated to Paddy, regardless of the types of objective functions. In the case of calibrating with
,
was found to be correlated to W_Slope (
,
) or Forest (
,
), and
was also correlated to Upland (
,
). The calibrated values of
were associated with Density (
,
) when
was used as the objective function; however, the parameter did now show any statistically significant relationship with the watershed characteristics in the case of the
objective function.
4.2.2. Performance of the Regionalized 3-Tank Models
The two regional models (
and
) were developed by relating the calibrated values of parameters to the watershed characteristics (
Table 4 and
Table 5). Regression equations were assigned to parameters that were at least “moderately” (
) correlated to any of the watershed features. When the correlation structure between the parameter values and watershed features was weak (
), the median of the parameter values that had been calibrated to individual study watersheds was used to represent the overall average value of the parameter [
15]. When
was used as the objective function in the calibration, stronger correlation structures were found between the parameter values and watershed characteristics as compared to the
(
Figure 5,
Table 4 and
Table 5).
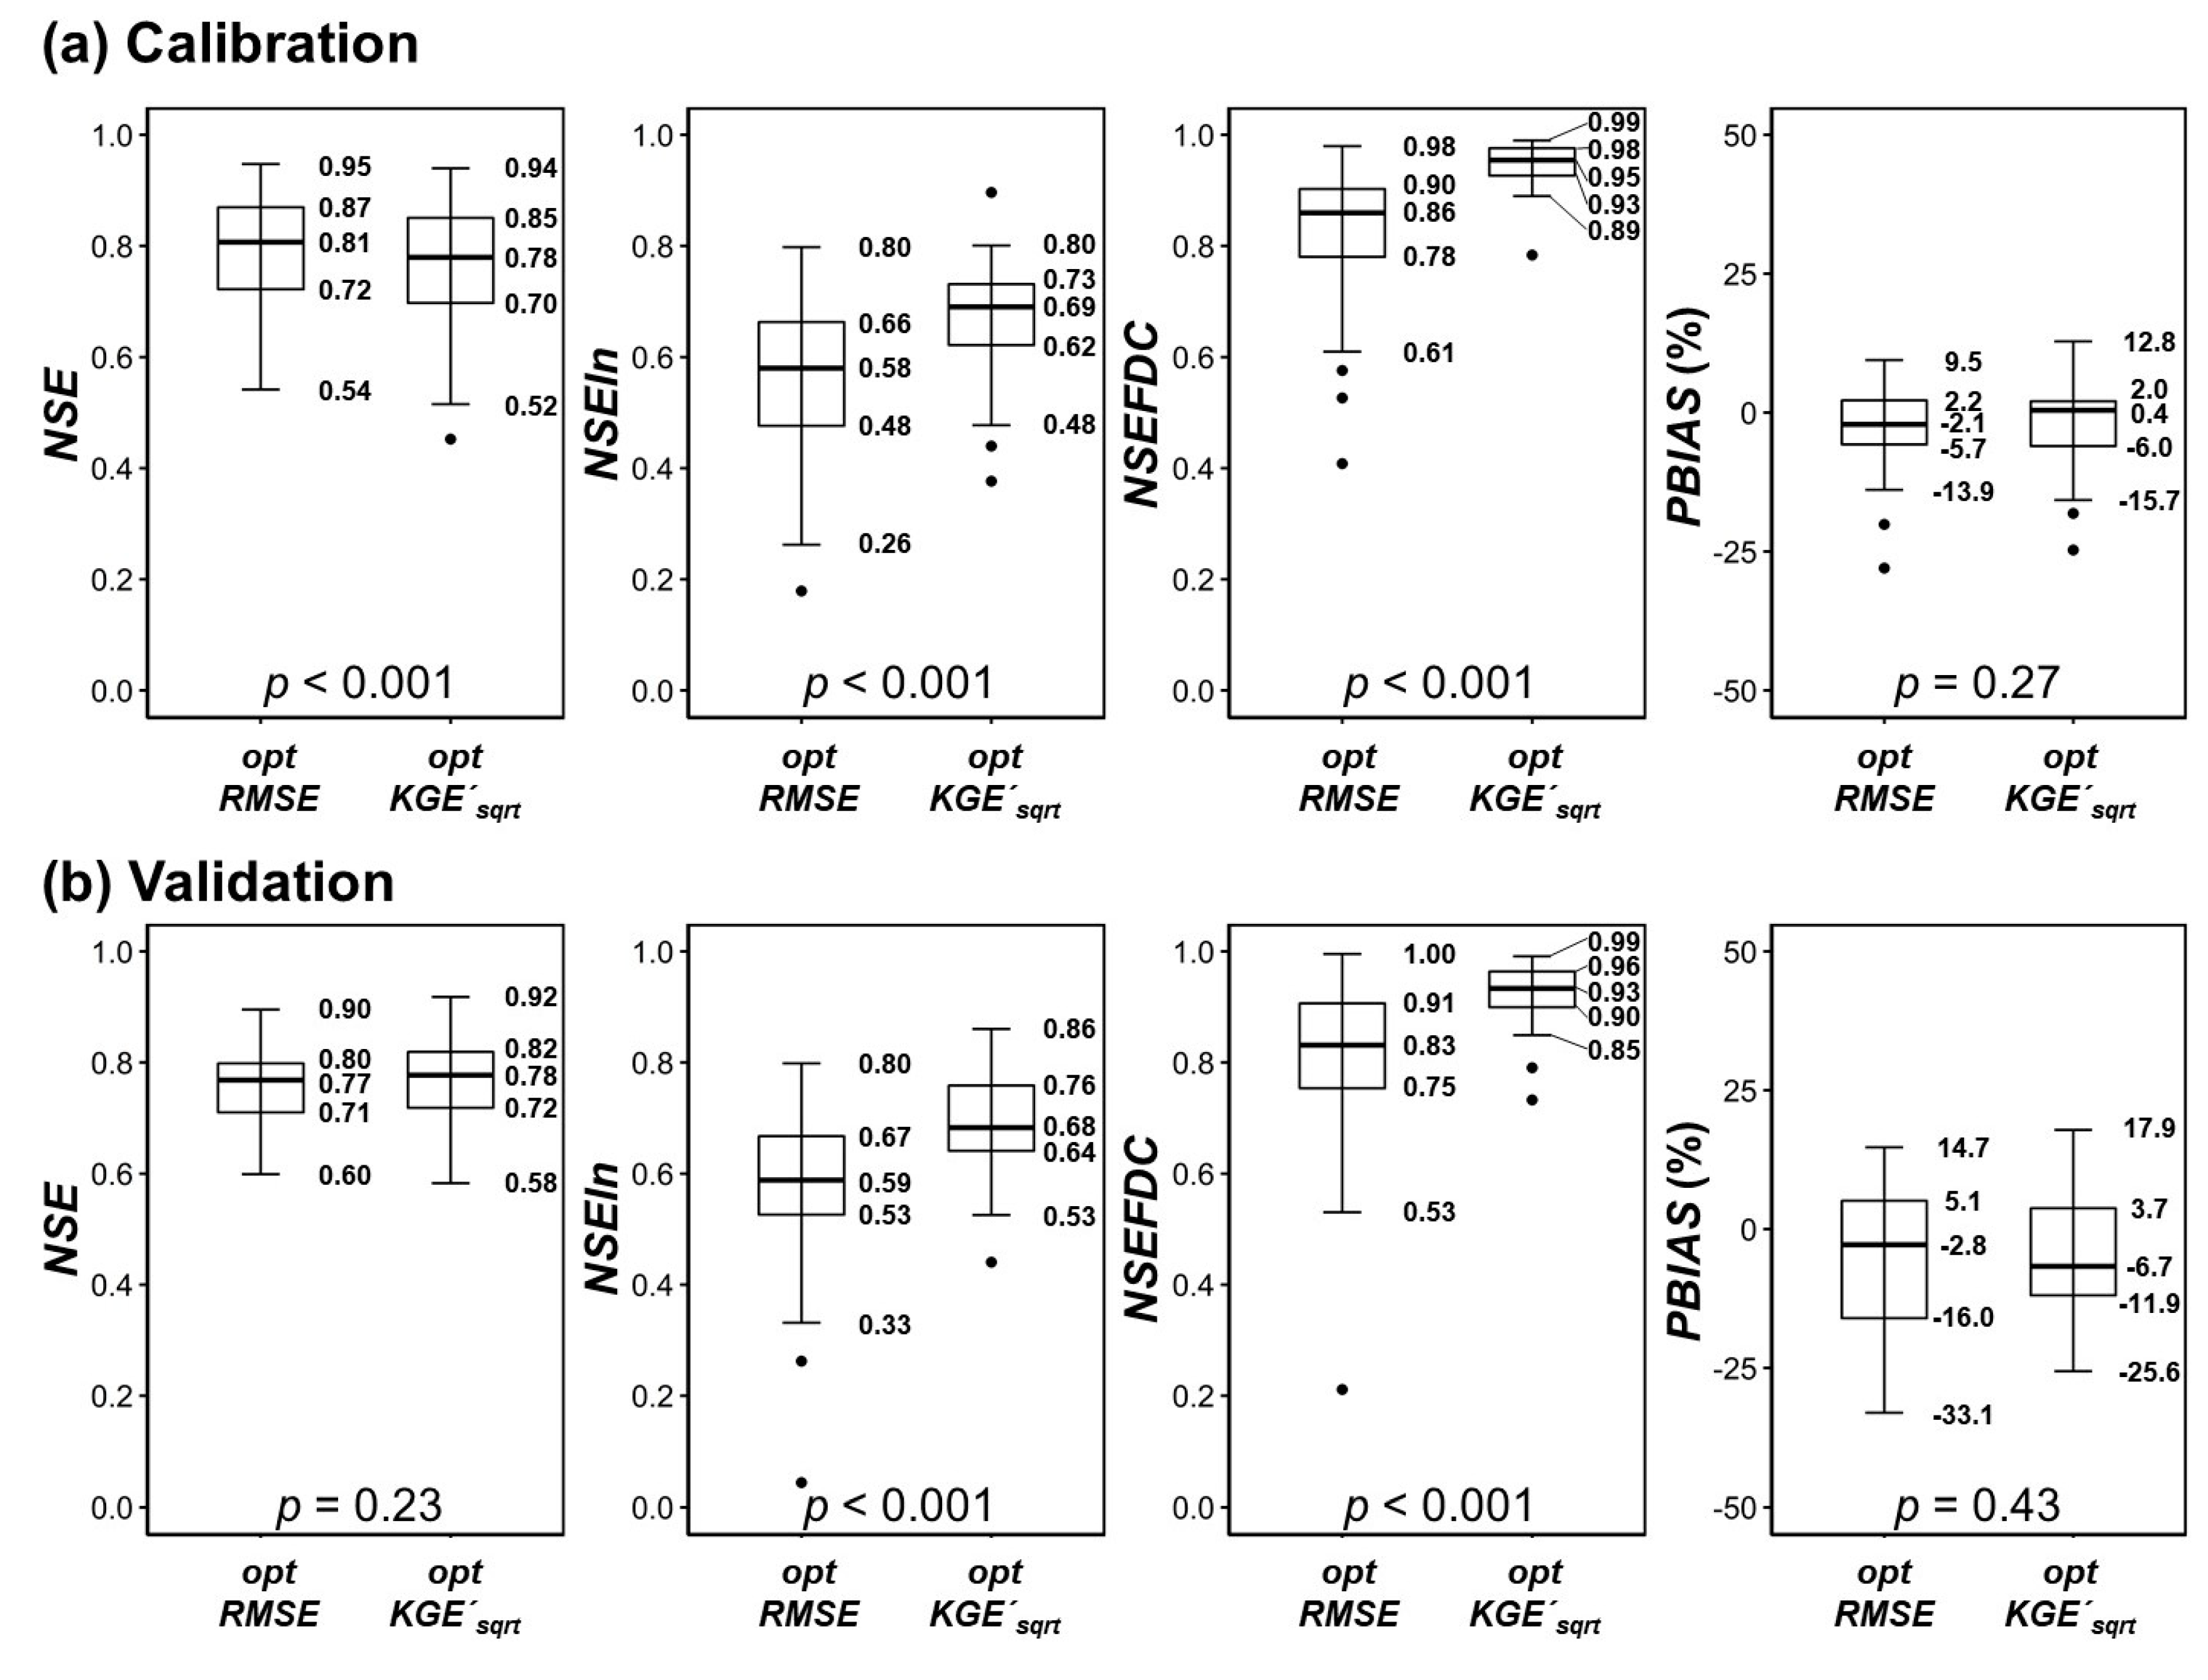
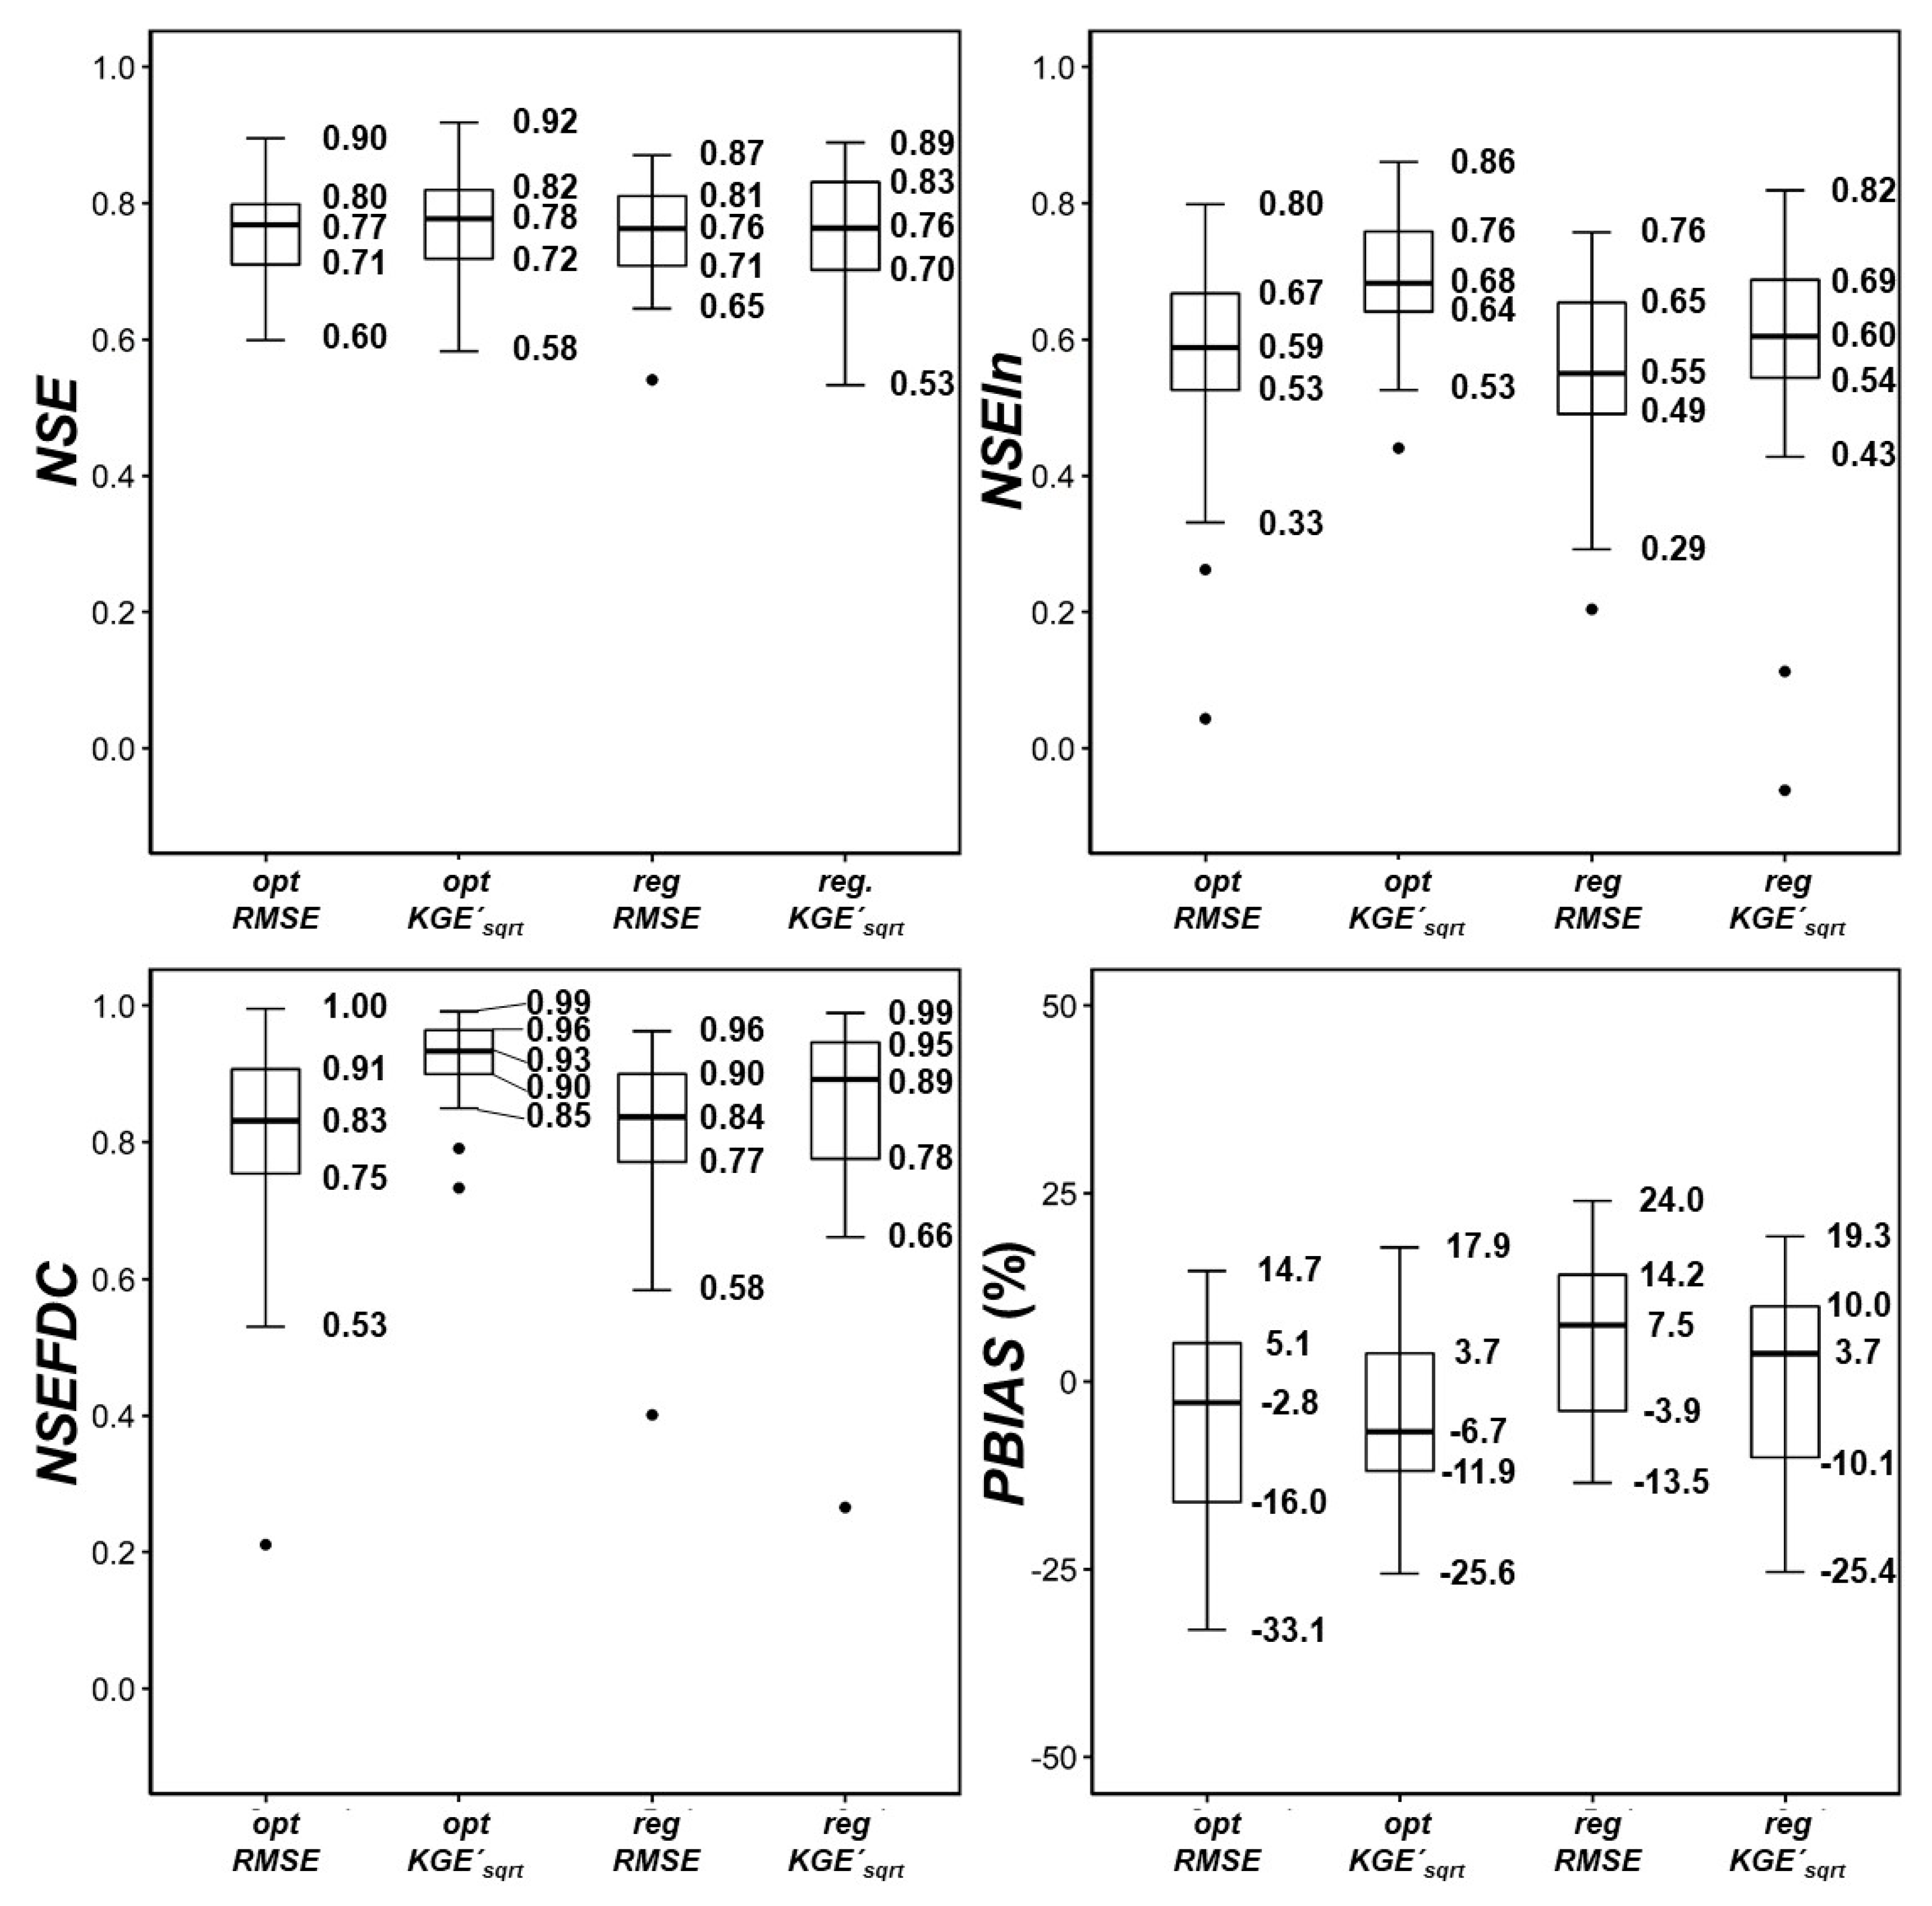
The accuracy of the regionalized 3-Tank models was evaluated by comparing the model performance statistics provided by the calibrated and regionalized models for the 39 study watersheds employed in the regionalization (
Figure 6). A one-way analysis of variance (ANOVA) was carried out to determine the statistical significance of differences between the performance statistics of the four groups (
,
,
, and
). Subsequently, a post-hoc Tukey honest significant difference (HSD) test was performed to facilitate a pairwise comparison of the performance statistics provided by the models [
8,
69].
Overall, the two regionalized models (
and
) provided similar accuracy to that of the calibrated models (
and
). There was no statistically significant difference between the
values achieved by the four models (
), which implied that regionalization can predict high (or peak) flow at the level of accuracy similar to those of the calibrated models. In terms of
and
, however,
yielded better performance than the
, presumably because
yielded better accuracy than
regRMSE (
). However,
and
provided similar accuracy (
). The
slightly underestimated the overall runoff volume (e.g., positive
) as compared to
; this may be attributed to
providing more balanced views on model performance than the
[
8,
45,
47].
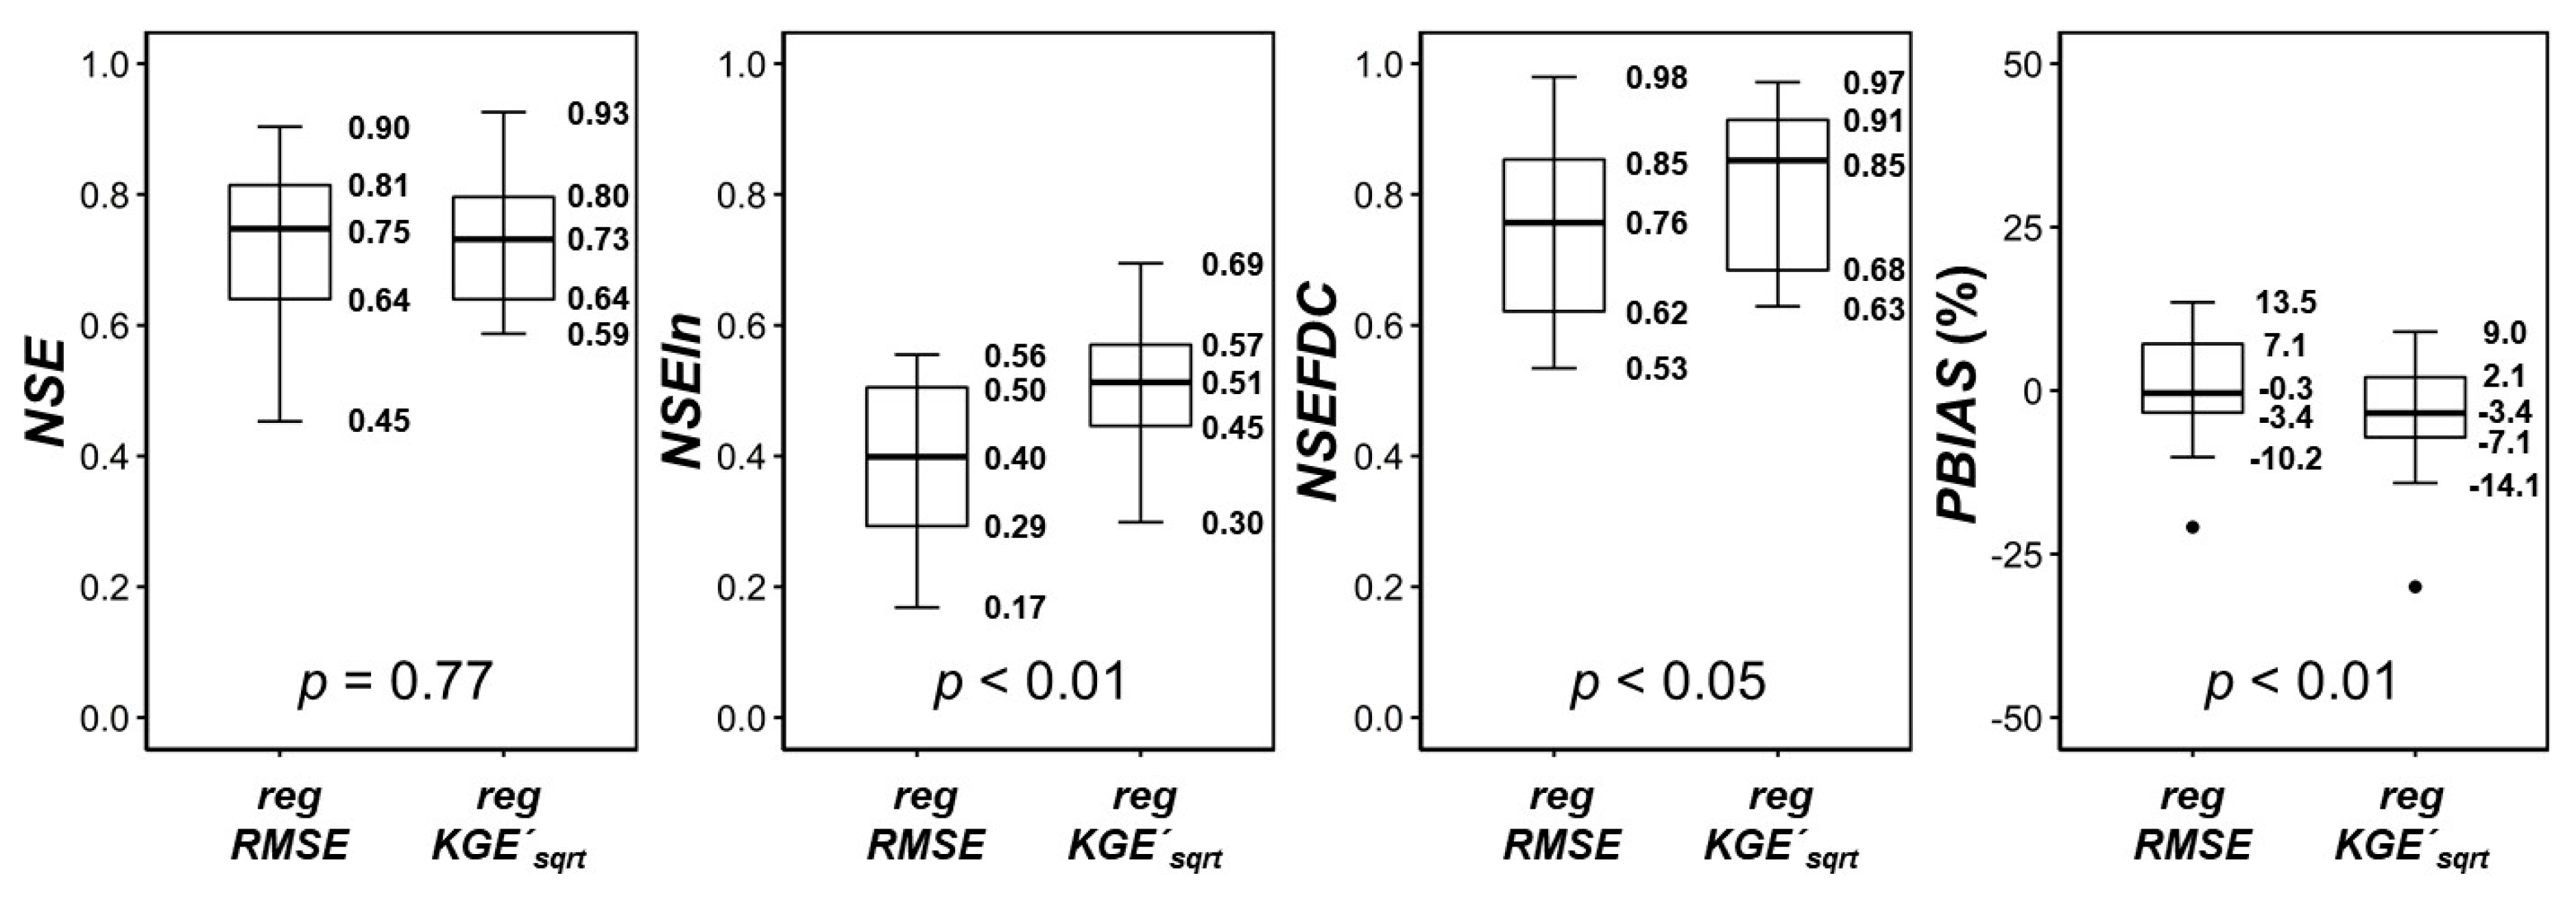
The performance of the regionalized models (
and
) was further investigated by applying them to the other 10 study watersheds that were not used in the regionalization processes (
Figure 7). The sample size was small (
); therefore, the non-parametric Wilcoxon signed-rank test was conducted to test the significance of any differences between the performance statistics provided by the two regionalized models at a significance level of 5%. The
model yielded
,
, and
significantly better than those of
while they provided statistically similar
values. Such results highlight the potential of
as a strategy for RR model regionalization.
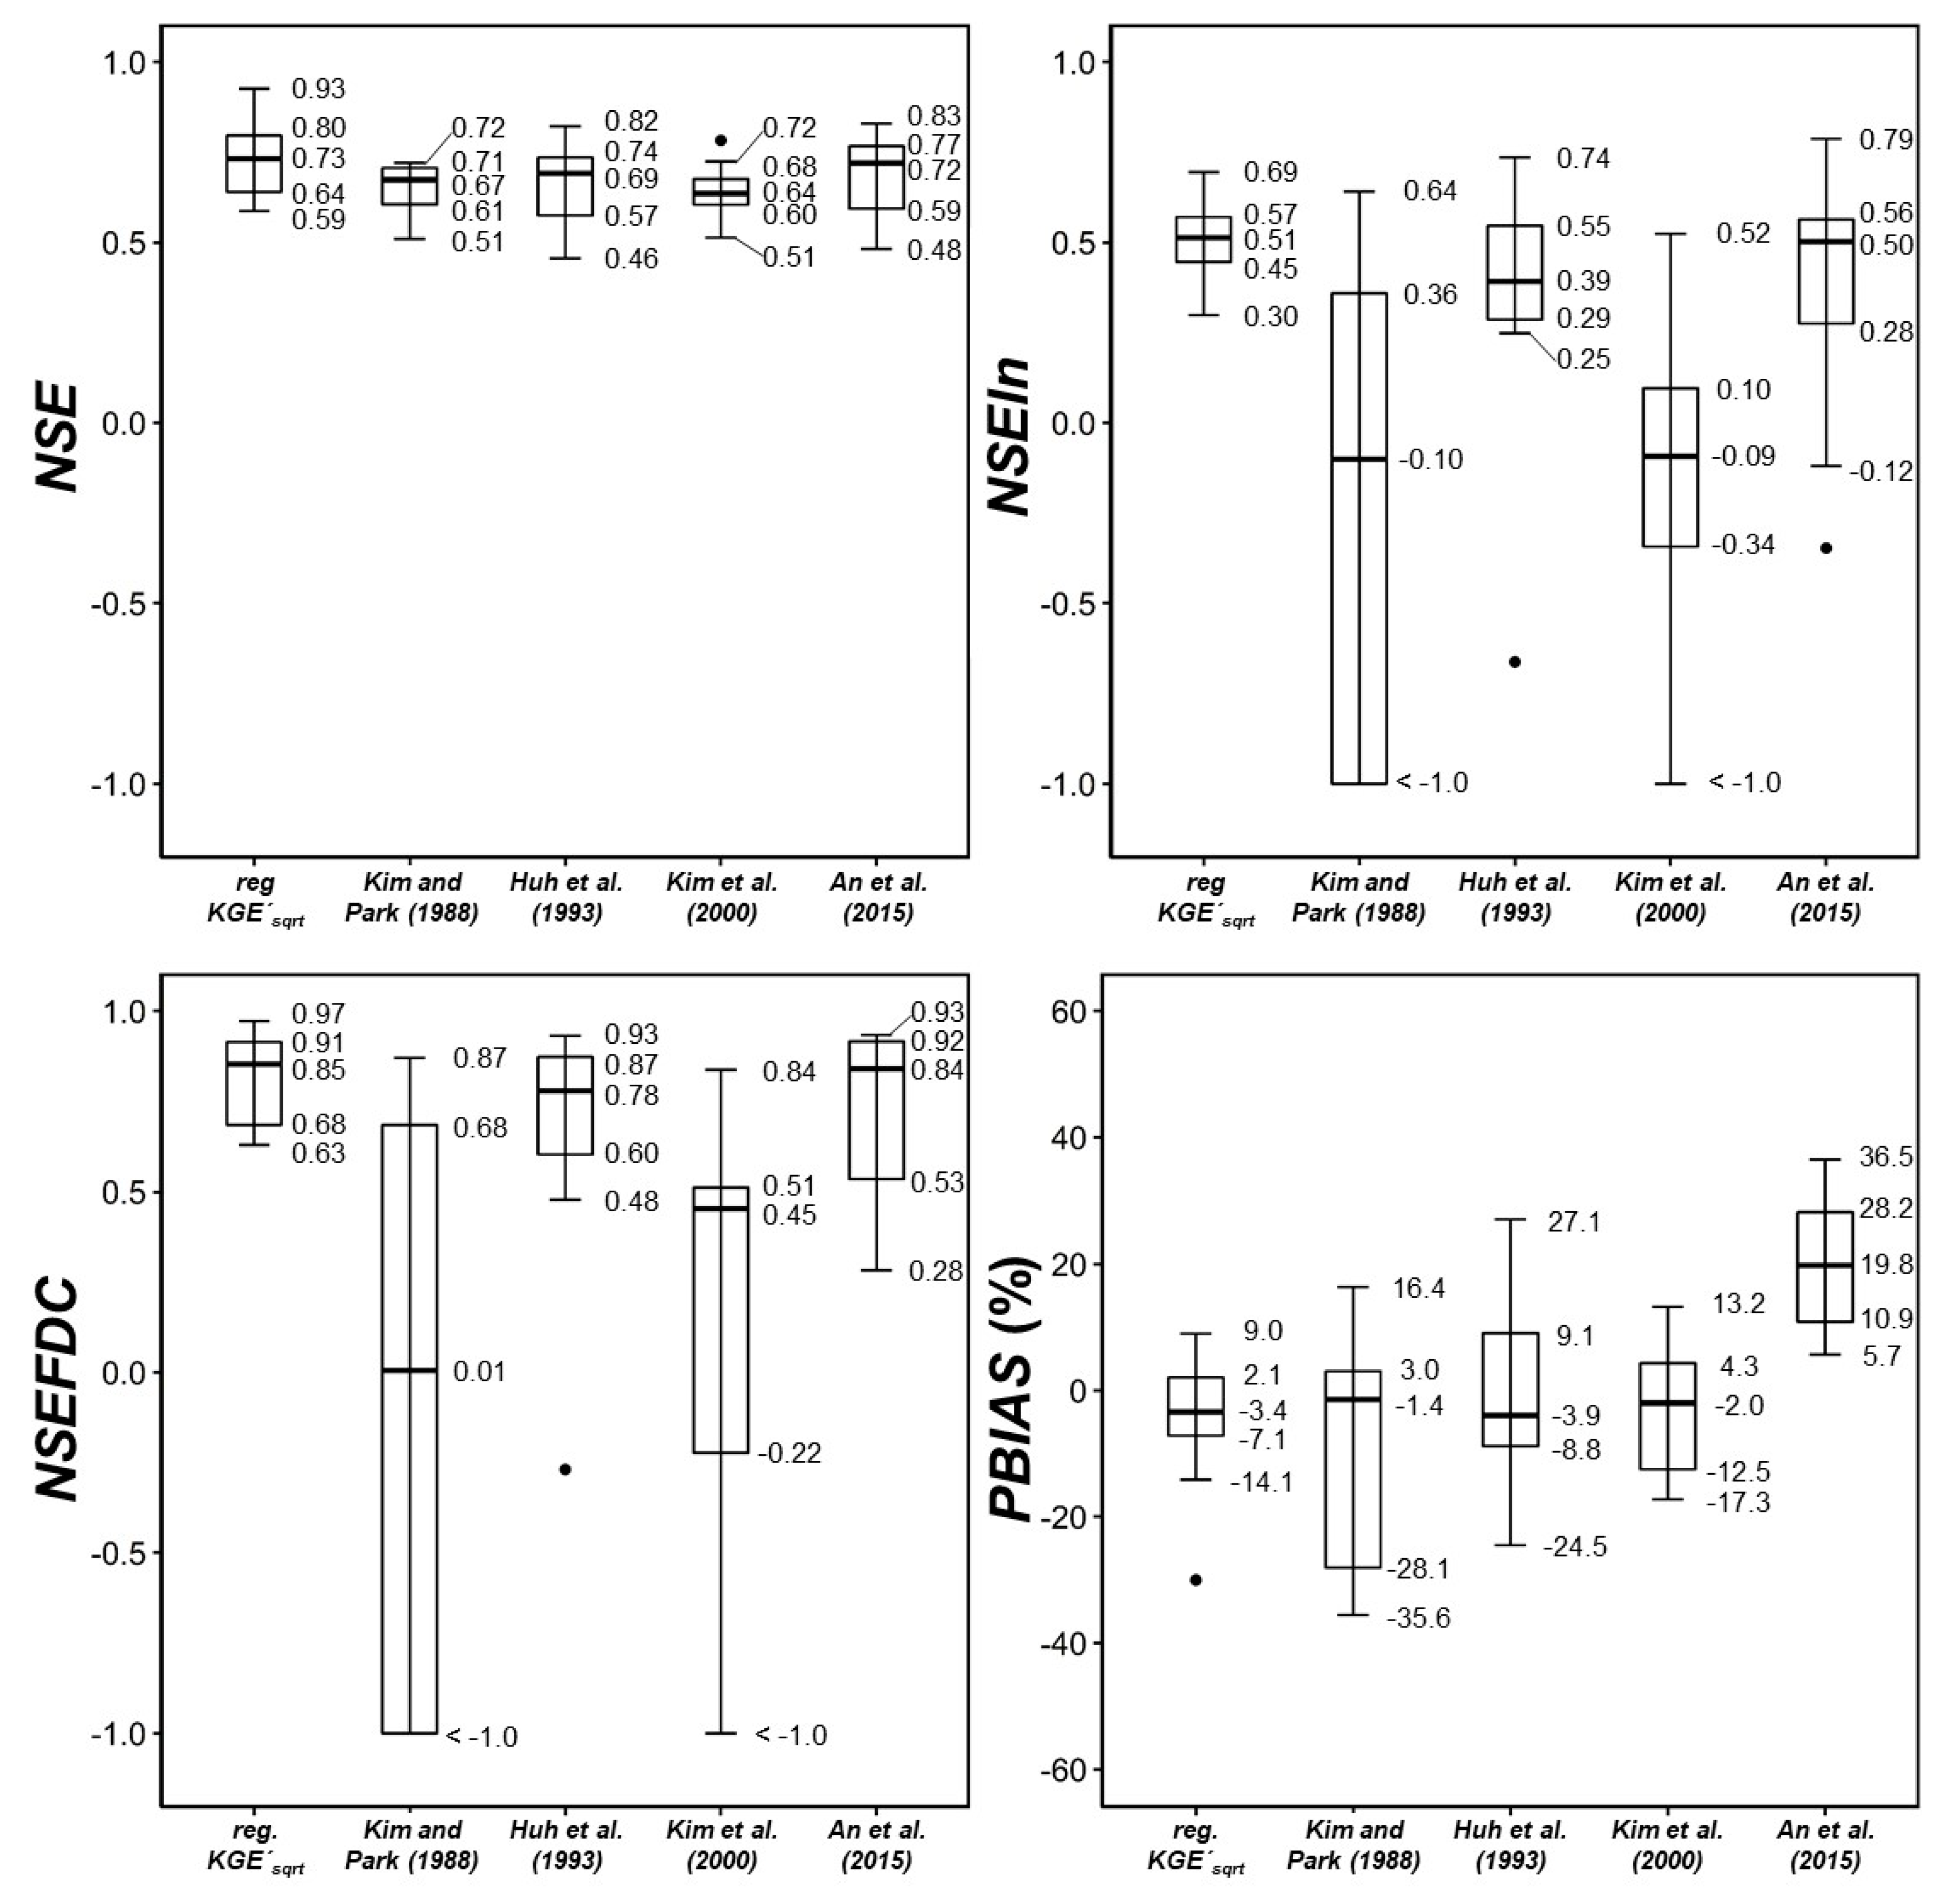
The performance of the two models was compared with that of other regionalized models using the 10 validation watersheds (
Table 6). As seen in the comparison, the two models regionalized in this study outperformed the others in terms of
and
. The 3-Tank models regionalized by Kim et al. [
41] provided a performance that was comparable to that of this study. However, An et al. [
18] reported relatively poor performance as compared to others. We applied one-way ANOVA and HSD tests to see if there were significant differences between the performance statistics provided by the 3-Tank models regionalized for the 10 validation watersheds (
Figure 8).
The five regionalized models employed different regression equations that explained the relationships between parameter values and watershed characteristics, but there was no statistically significant difference between the
values provided by them (
). In terms of
and
, however,
provided significantly better performance as compared to ones that had been developed in Kim and Park [
13] and Kim et al. [
41]. The 3-Tank model regionalized by An et al. [
18], yielded
and
values similar to those by
(
), but the model significantly underestimated runoff volume (positive
) compared to the other models (
). The regionalized model of Huh et al. [
40] provided a level of efficiency similar to that of
, but
outperformed the model in terms of the model evaluation criteria that are commonly employed in hydrological modeling practices [
57] (
Table 6).
The relatively worse performances of the models reported by Kim and Park [
13] and Kim et al. [
41], reproducing low flow, might be related to the models being developed on manually calibrated parameters; thus, the local optima could be used for regionalization (
Table 2). In addition, the studies did not calibrate models by considering low flow efficiencies in the development process. Huh et al. [
40] and An et al. [
18] employed automatic optimizations (
Table 2), and their models provided better low flow performances. However, the models produced relatively worse performances as compared to
as these studies used
as an objective function (
Table 2), which may yield less balanced results than the case when
is used.
In this study, we compared the prediction performance of two regionalized 3-Tank models that were calibrated with two different objective functions,
and
. From the comparison, we found that the models could predict high flow and water balance of the 49 study watersheds at acceptable levels of accuracy (
Table 6,
Figure 6,
Figure 7 and
Figure 8). We also saw that the use of
that has been widely employed as an objective function in the regionalization studies provided relatively poor performance in reproducing low flow and FDC compared to the use of
. Such a result is not surprising because
considers flow variability more explicitly when evaluating model accuracy while
is still sensitive to peak or high flow [
47]. It is worth noting that
gained significantly higher
and
values but slightly lower
efficiency as compared to
(
Figure 3). Such a finding suggests that when low flow is one of the modeling outputs of interest, we should not solely rely on statistics including
and
that have been commonly used but also know that the statistics are very sensitive to high flow. Instead, combining alternative statistics, such as
and
, could provide a balanced view point to model evaluation [
8,
9,
55,
70].
The
and its variants are kinds of the Euclidian distance (ED) between the optimal and ideal points for correlation, bias, variance, and variability (Equations (10)–(15)). Pfannerstill et al. [
71] proposed another form of the ED (
, Equation (17)) as an objective function. The two ED measures,
s and
, are similar to each other because both consider pairwise differences (
and
), water balance (
and
), and flow variability (
,
,
,
, and
):
where
,
, and
are RMSE-observations standard deviation ratio (
) [
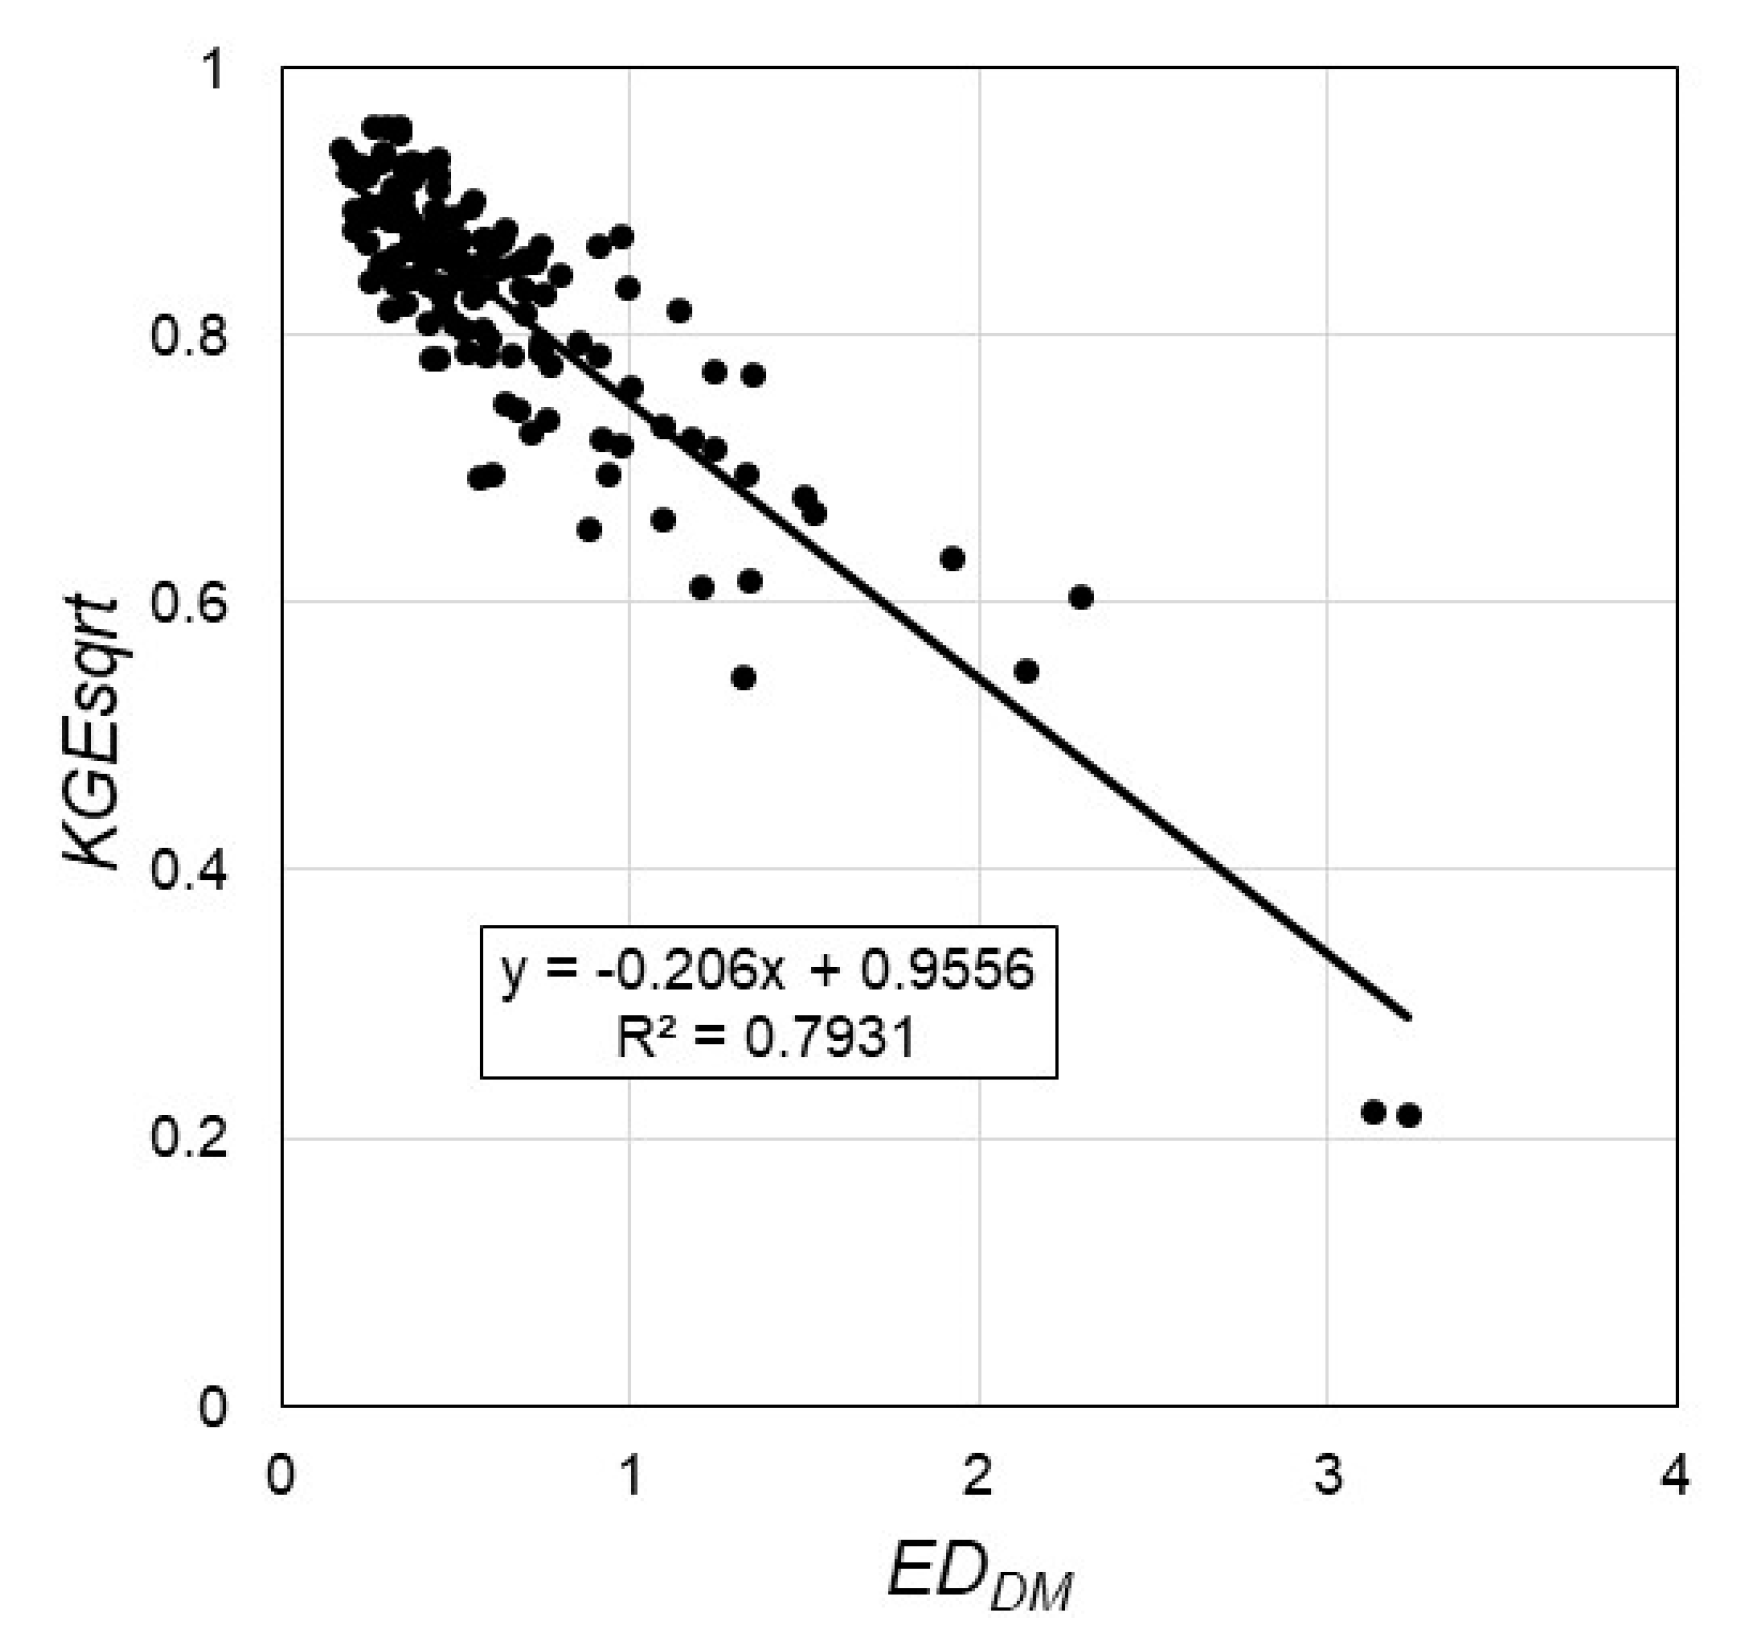
64] for the FDC segments of 0% to 5%, 5% to 20%, and 20% to 70%, respectively. We found that the values of
are highly correlated with those of
in the study dataset (
;
Figure 9). Such a finding implies that the ED-based statistics including
s and
could serve as an objective function to efficiently count for the multiple evaluation aspects in an RR model regionalization.


