Article

Fine Characterization of the Effects of Aquifer Heterogeneity on Solute Transport: A Numerical Sandbox Experiment

1
School of Water Resources and Environment, China University of Geosciences, Beijing 100083, China
2
Institute of Groundwater and Earth Sciences, Jinan University, Guangzhou 510632, China
3
Department of Hydrology and Water Resources, University of Arizona, Tucson, AZ 85721, USA
4
School of Civil and Resource Engineering, University of Science and Technology Beijing, Beijing 100083, China
*
Author to whom correspondence should be addressed.
Water 2019, 11(11), 2295; https://doi.org/10.3390/w11112295
Submission received: 4 September 2019 / Revised: 21 October 2019 / Accepted: 30 October 2019 / Published: 1 November 2019
(This article belongs to the Section Hydrology)

Abstract

:
Hydraulic conductivity (K) and the specific storage coefficient (S) are among the most important hydrogeological parameters of an aquifer. Traditionally, the hydrogeological parameters of a field aquifer system are mainly determined through a range of experiments that are both time-consuming and of poor operability. To accurately characterize aquifer heterogeneity, a synthetic sandbox is constructed using VSAFT2 (Variably Saturated Flow and Transport utilizing the Modified Method of Characteristics, in 2D) as a reference aquifer system by incorporating multilevel a priori geologic information into the sandbox configuration. The spatial distribution of the field of hydraulic conductivity (i.e., K) is inversely obtained by hydraulic tomography (HT). Then HT is compared with traditional kriging-estimated method in the fine characterization of aquifer heterogeneity, and the optimal K field is eventually selected to predict the solute transport. The influence of the number of pumping cycles on the accuracy of heterogeneity characterization is also discussed. The results show that the accuracy of the inversely obtained K field is improved with the increased number of pumping cycles. When incorporating multilevel a priori geological information, HT can characterize aquifer heterogeneity more finely than traditional kriging, and there is also a very good fitting of solute transport between the optimally estimated K field and the reference K field. Our study highlights the importance of the fine characterization of aquifer heterogeneity for the prediction of solute transport.

1. Introduction

Groundwater contamination and remediation have become very important issues. The heterogeneous nature of geologic bodies results in the heterogeneous hydrological properties of geologic media accordingly [1]. The complex spatial structure of aquifer media leads to the uncertainty of groundwater flow, thereby aggravating the uncertainty of groundwater contaminant transport [2]. Previous studies have shown that the accuracy of the spatial distribution of hydrogeological parameters directly affects the hydrogeological evaluation and prediction when solute transport is considered [3,4,5]. Therefore, it is particularly important to characterize the aquifer heterogeneity with high accuracy.
Traditional methods for determining the hydrogeological parameters of field aquifers mainly include the pumping test, injection test, slug test, and water level recovery test [6]. However, the core samples and pumping test data obtained from field sampling are a bit limited to a certain extent. In recent decades, the efficient use of field and experimental data to invert the spatial distribution of hydraulic conductivity (K) has been widely studied by hydrogeologists [7,8]. At the end of the 20th century, Yeh et al. [9] developed a hydraulic tomography (HT) method that was different from the traditional methods. By incorporating the computerized axial tomography (CAT) and the geophysical tomography concepts, HT uses the inversion model VSAFT2 [10] to obtain the spatial distribution of K field, thereby characterizing aquifer heterogeneity with high accuracy.
To date, numerous satisfactory results have been achieved in the characterization of aquifer heterogeneity using HT, mainly in the spatial estimation of K field and the specific storage coefficient (S). For example, Illman et al. [11] and Liu et al. [12] collected the hydraulic head response data for the steady state portion of a pumping test using a laboratory sandbox experiment and then estimated the parameter K using numerical simulation. Illman et al. [13] and Cardiff et al. [14] conducted pumping tests at a field test site and estimated the K value using the same method. These studies have demonstrated the advantages of HT through laboratory sandbox experiments, field tests, and numerical simulation. In addition, previous studies also have compared the equivalent homogenization method (an effective parameter/macrodispersion approach) [15] and kriging method (a heterogeneous approach using ordinary kriging based on core samples) [16] with HT in terms of the ability to characterize the heterogeneity of experimental sandboxes, and found that HT was most accurate one in predicting K and hydraulic head, but it was only comparable with kriging with slight improvement [15]. By incorporating multilevel a priori geological information into the sandbox configurations of previous studies, this study aims to explore the role of HT in the improvement of the accuracy of the K field prediction, as well as the influence of aquifer heterogeneity, with higher accuracy for the solute transport. Particularly, different from the previous studies, we focus on the smaller scales of each layer of heterogeneity. The results of this study would provide a better understanding of the fine characterization of aquifer heterogeneity for the prediction of solute transport.

2. Materials and Methods

2.1. Numerical Sandbox Construction

In reference to Zhao [17], the sandbox is divided into 18 layers, and the working areas of the corresponding layers are drawn using VSAFT2 (Figure 1), which is two-dimensional in the vertical cross-section. There is a total of 48 wells, and their positions are determined according to Liu [12]. VSAFT2 is used to mesh the constructed sandbox area into finite elements, and the entire model consists of 73 rows and 163 columns of 1-cm square unit elements. The thickness of the sandbox is set as 10.2 cm, and the more detailed information about the sandbox is introduced in Zhao [17], including sand types and initial K of 18 layers. When in a forward simulation of VSAFT2, the first step is that the homogeneous initial K is assigned for the entire working area (here, we focus on the smaller scales, which means the initial K in a specific layer is homogeneous, but varies for different layers, as shown in Figure 1). Then random seeds, variance, and correlation scale are all set to the same under various conditions. Among them, the uncertainty of variance is slightly higher and, in addition, the uncertainty set by different experimenters can vary noticeably. Next, a reference K field with 18-layered randomness is produced in the middle process. Finally, the synthetic reference H (head) field in 8 pumping tests is obtained by the VSAFT2, and it should be noted that, for every pumping test, we could obtain a group of head data at 46 observation ports (excluding the injection and pumping wells), and finally there are 8 groups of observations of head data that are used in the kriging and hydraulic tomography. In contrast, in an inverse simulation, the spatial distribution of K field is derived from a given H field, and here we discuss the best one (note that initial S is 3.94 x 10⁻⁵ cm−1 for each layer, but we do not focus on S field in this study). The variance in this study is set to 0.01 cm2/s2 because the hydraulic conductivity of the layers in the sandbox itself is approximately 0.1 cm/s [17]. Considering the a priori geological information, the correlation scale at a small level is used as the correlation scale for the entire area. That is, the correlation lengths in the horizontal and vertical direction are set at 20 cm and 8 cm, respectively. As the inner heterogeneity of hydraulic conductivity of each layer is studied, there exists prior information for 18 layers compared with the unique K in each layer. In other words, we could know finer characterization for the sandbox at the first instance so that we call it “multilevel prior information”.

2.2. Pumping Tests

In the forward model, a zero-flow boundary condition is set at the periphery. Because the model is at a vertical section to exclude other factors, such as the effects of model errors and gravity [18,19], all initial heads are assumed as the total head (i.e., 100 cm). A total of 8 pumping test conditions are designed, and each group contains 46 observation heads, which are regarded as the reference heads. The locations of pumping/injection wells in each group of pumping tests are selected according to Illman [16]. Well spacing optimization is outside of the scope of this study [20,21,22]. The rate is 0.48 cm3/s for both pumping and injection for all 8 pumping tests, and it is set to be negative for pumping and positive for injection.
It is worth noting that head response data are obtained from the pumping test. However, because signals of head are easily transmitted through aquifers, it is not sufficient to only examine the degree of hydraulic head fitting; solute transport must also be predicted. During the simulation of tracer solute transport in the present study, a solute at a concentration of 1513 mg/mL was first injected for 10 s, followed by continuous injection of water until 6000 s, and finally the solute transport was quantitatively analyzed.

2.3. Methods

In this study, not only does the entire sandbox area have a large-scale heterogeneity, but each layer also has a smaller-scale heterogeneity of its own. As a priori geological information is assigned to the 18 layers, we first discuss the equivalent homogenization method. The corresponding homogeneity model is different from the previous theoretical homogeneity model in that each layer is treated as homogeneous (i.e., the K of each layer is a constant) [16] in the test, and the initial value of K is determined according to the hydraulic conductivity of different sand layers in Appendix A of Zhao [17] to examine the effect of the number of pumping cycles on the accuracy [23].
The hydrogeological parameters of aquifers (e.g., K) are random variables changing with the spatial position, which can be analyzed by the geological statistical methods. The core of geostatistics is “Kriging”, which is also called Kriging spatial interposition. Kriging is a stochastic linear estimation method based on the observed values of variables at different positions or some known parameters, as well as the a priori information on variable spatial statistical structures [24,25]. It obtains the optimal unbiased estimation of geological variables and quantitatively analyzes the uncertainty of the corresponding estimates. The value at an unknown point can be estimated by the weighted sum of known observation values. However, the Kriging is not suitable for the limited core samples, as well as the smaller scales.
HT estimation is a method of using the successive linear estimate (SLE) to estimate the spatial distribution of hydrogeological parameters [26]. It is an extension to the spatial random linear estimation (kriging or cokriging) [9]. In essence, HT collects nonredundant information through a limited number of wells, and some previously uncollected information could be added during each pumping test [27,28,29]. Assimilation of such data series with HT can provide a more accurate description of the aquifer. When estimating the hydraulic conductivity K based on observed head response data yielded from pumping tests, the SLE considers the nonlinear relationship between hydrogeological parameters (such as K) and system responses (such as H) [30,31]. Its core algorithm is as follows [32]:
f ^ ( r + 1 ) ( x m ) = f ^ ( r ) ( x m ) + j = 1 n h ω m j ( r ) ( ϕ j ( x j ) ϕ j ( r ) ( x j ) ) = f ^ ( r ) ( x m ) + j = 1 n h ω m j ( r ) [ ( h j ( x j ) + H ( x j ) ) ( h j ( r ) ( x j ) + H ( x j ) ) ] = f ^ ( r ) ( x m ) + j = 1 n h ω m j ( r ) ( h j ( x j ) h j ( r ) ( x j ) )
where f ^ ( r ) is the estimated value at x m from the rth iteration;   ϕ j ( x j ) is the observed head at x j ; ϕ j r ( x j ) is the head value calculated using the current f ^ ( r ) ( x ) ; H ( x j ) is the average head calculated using the unconditional mean K value with no added information; h j ( x j ) and h j r ( x j ) are the disturbance terms for observed and calculated heads, respectively; and ω m j ( r ) is the weight of the difference between the observed and estimated values at point x j for the estimated f at point x m in the rth iteration.
In the solute transport analysis method, the displacement of solute particles is determined using the concept of spatial moments. The zeroth moment M 0 represents the total mass, and the ratio of the first to the zeroth moment, μ x , represents the mean position the solute reaches at this time. Solute transport can be quantitatively evaluated according to the conservation of mass concentration and the deviation of displacement at the central point. In this study, the total mass concentrations (mg/mL) of the reference field and the estimated field are estimated by using the zeroth moment, i.e., by multiplying the concentration at each point by time and then calculating the integral. Note that the effective porosity was set to 0.36 for all cases. The computed value of the longitudinal dispersivity is 52.08 cm. The transverse dispersivity values are zero.

3. Results and Discussion

3.1. Equivalent Homogeneous Conceptual Model

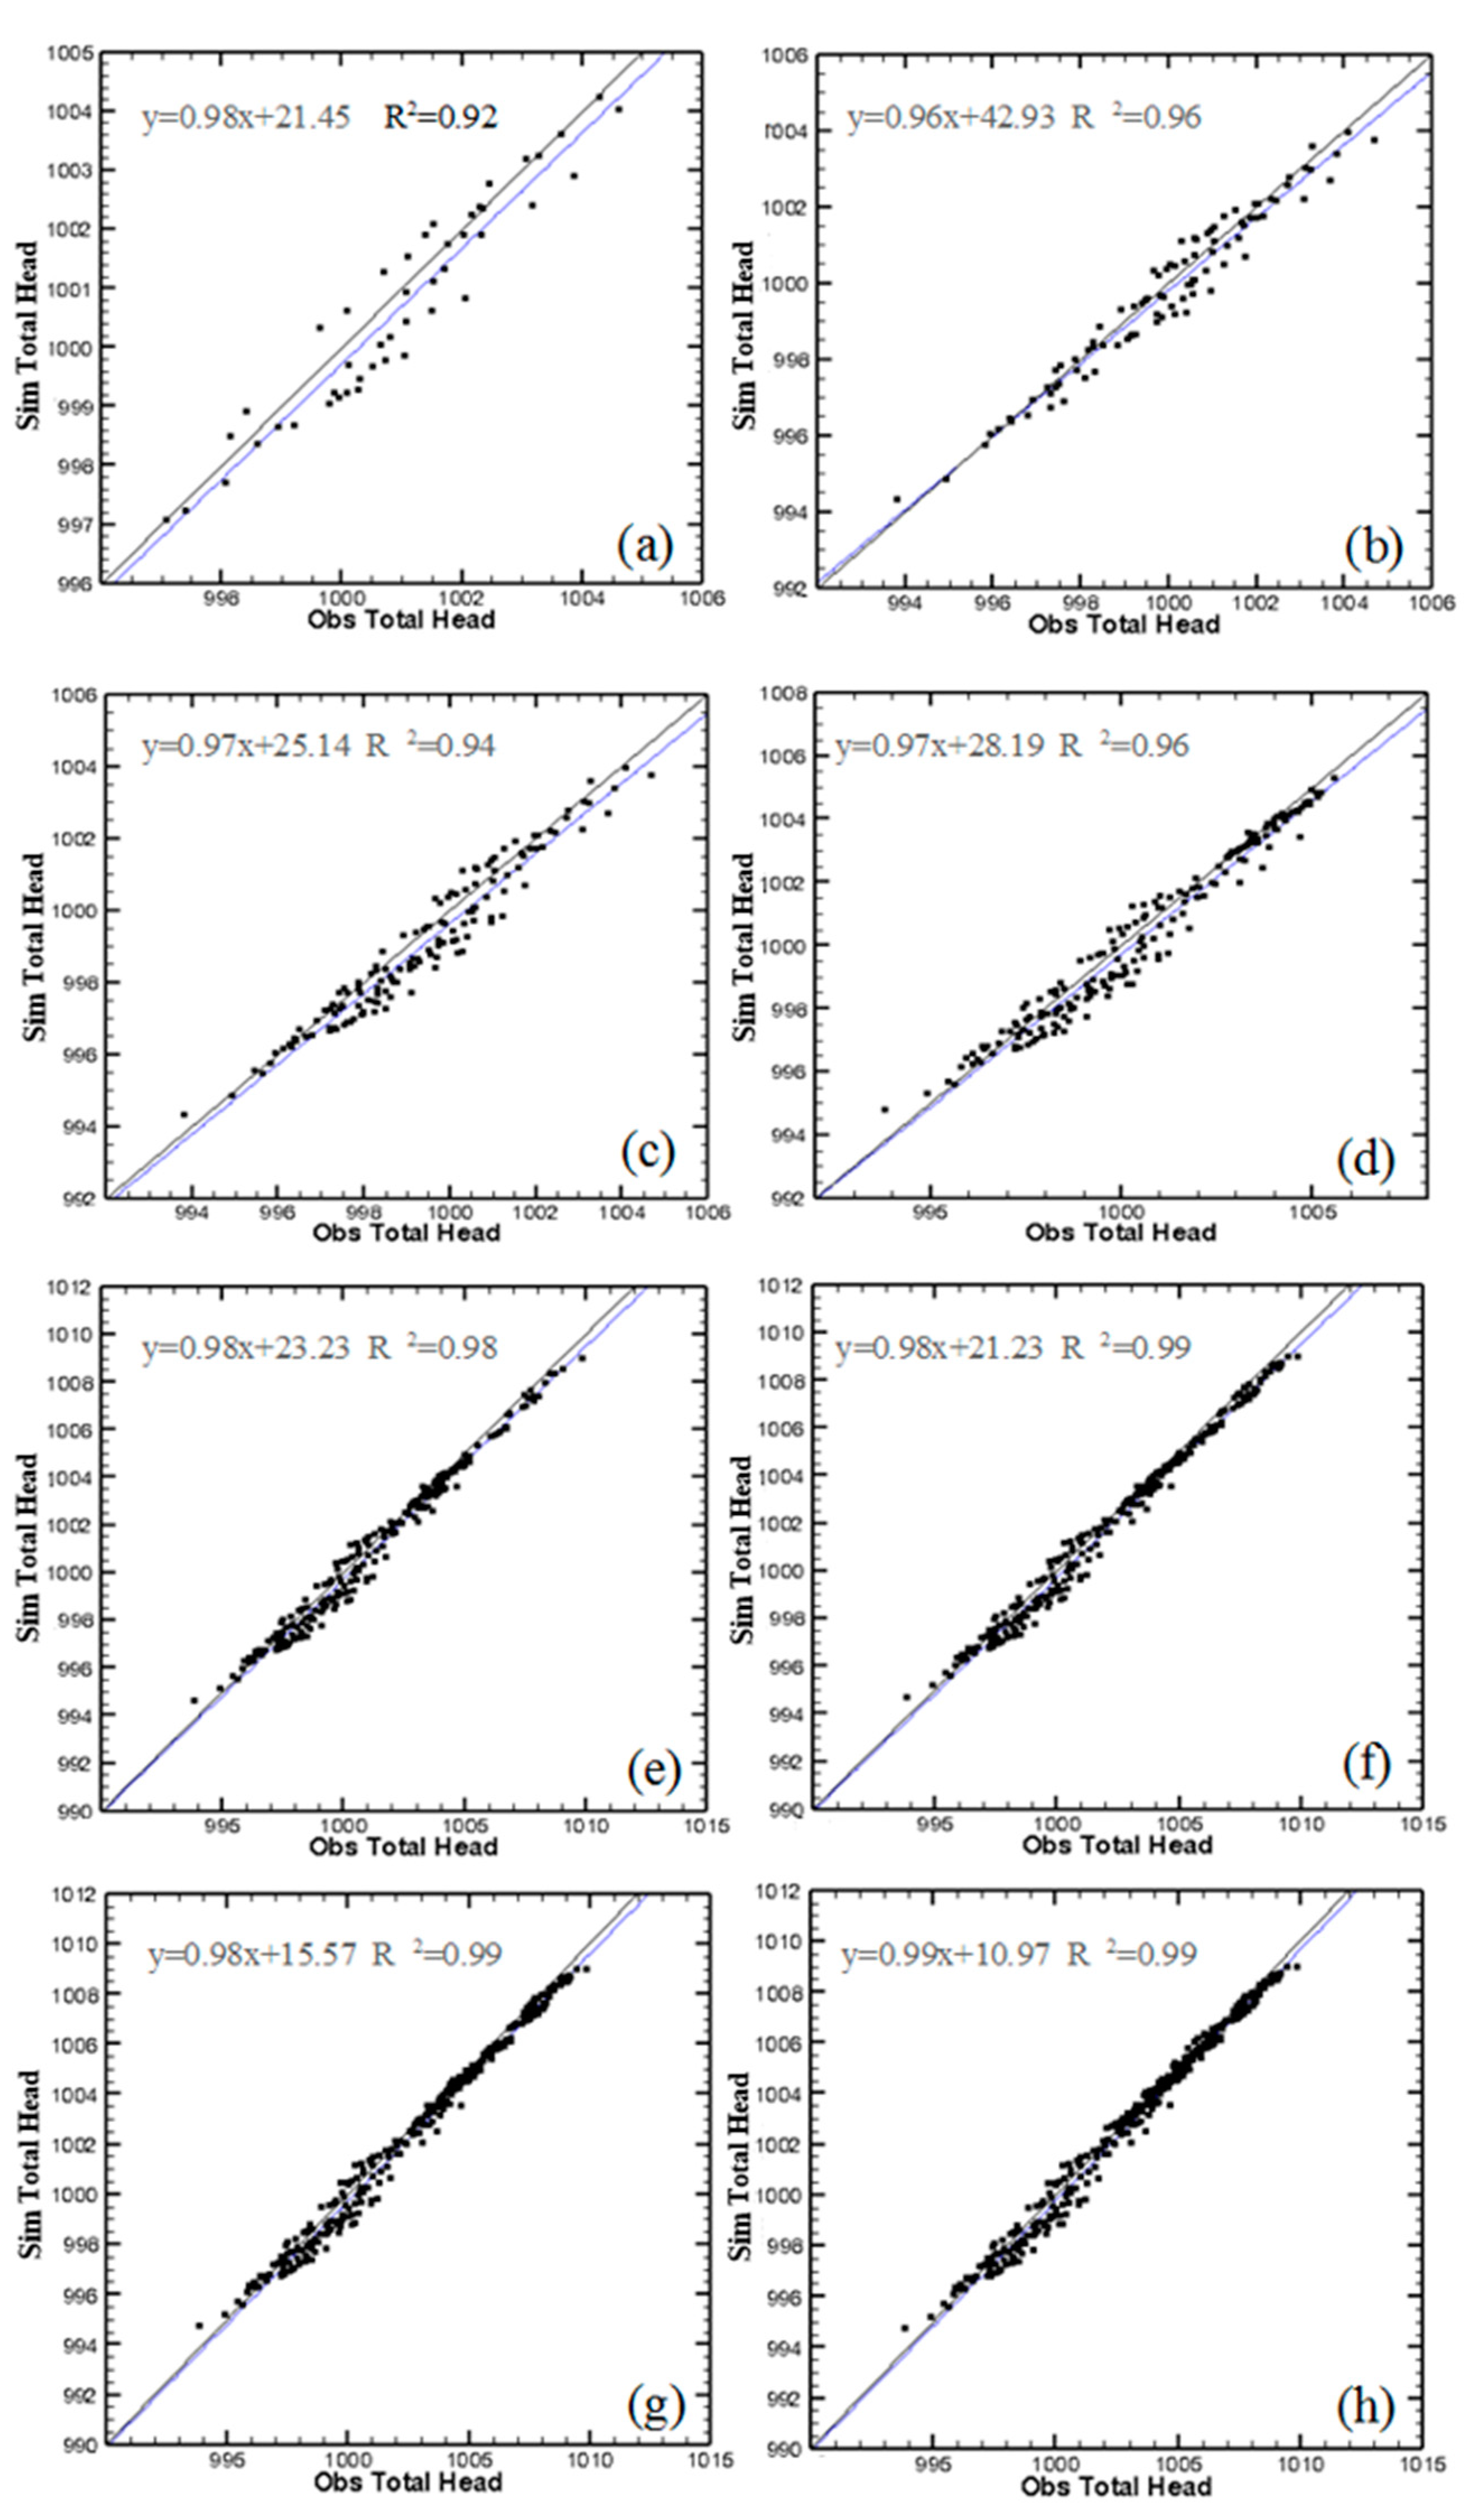
The equivalent homogenization method only considers the fitting of the head and can be used to evaluate the effect of the number of pumping cycles on the accuracy. Figure 2a–h show the fitting between the observed and estimated head values of 46 wells as the number of pumping cycles increases from one to eight. These figures indicate that the scatter points are more concentrated on the 45° line as the number of pumping cycles increases and that the correlation coefficient R2 gradually increases. However, R2 has reached 0.99 upon the completion of the 6th pumping test, after which there is no notable increase in the accuracy. Therefore, when we determine the best accuracy, we do not need more pumping tests, which can save more energy and is less time-consuming.

3.2. Heterogeneity Characterization by Kriging

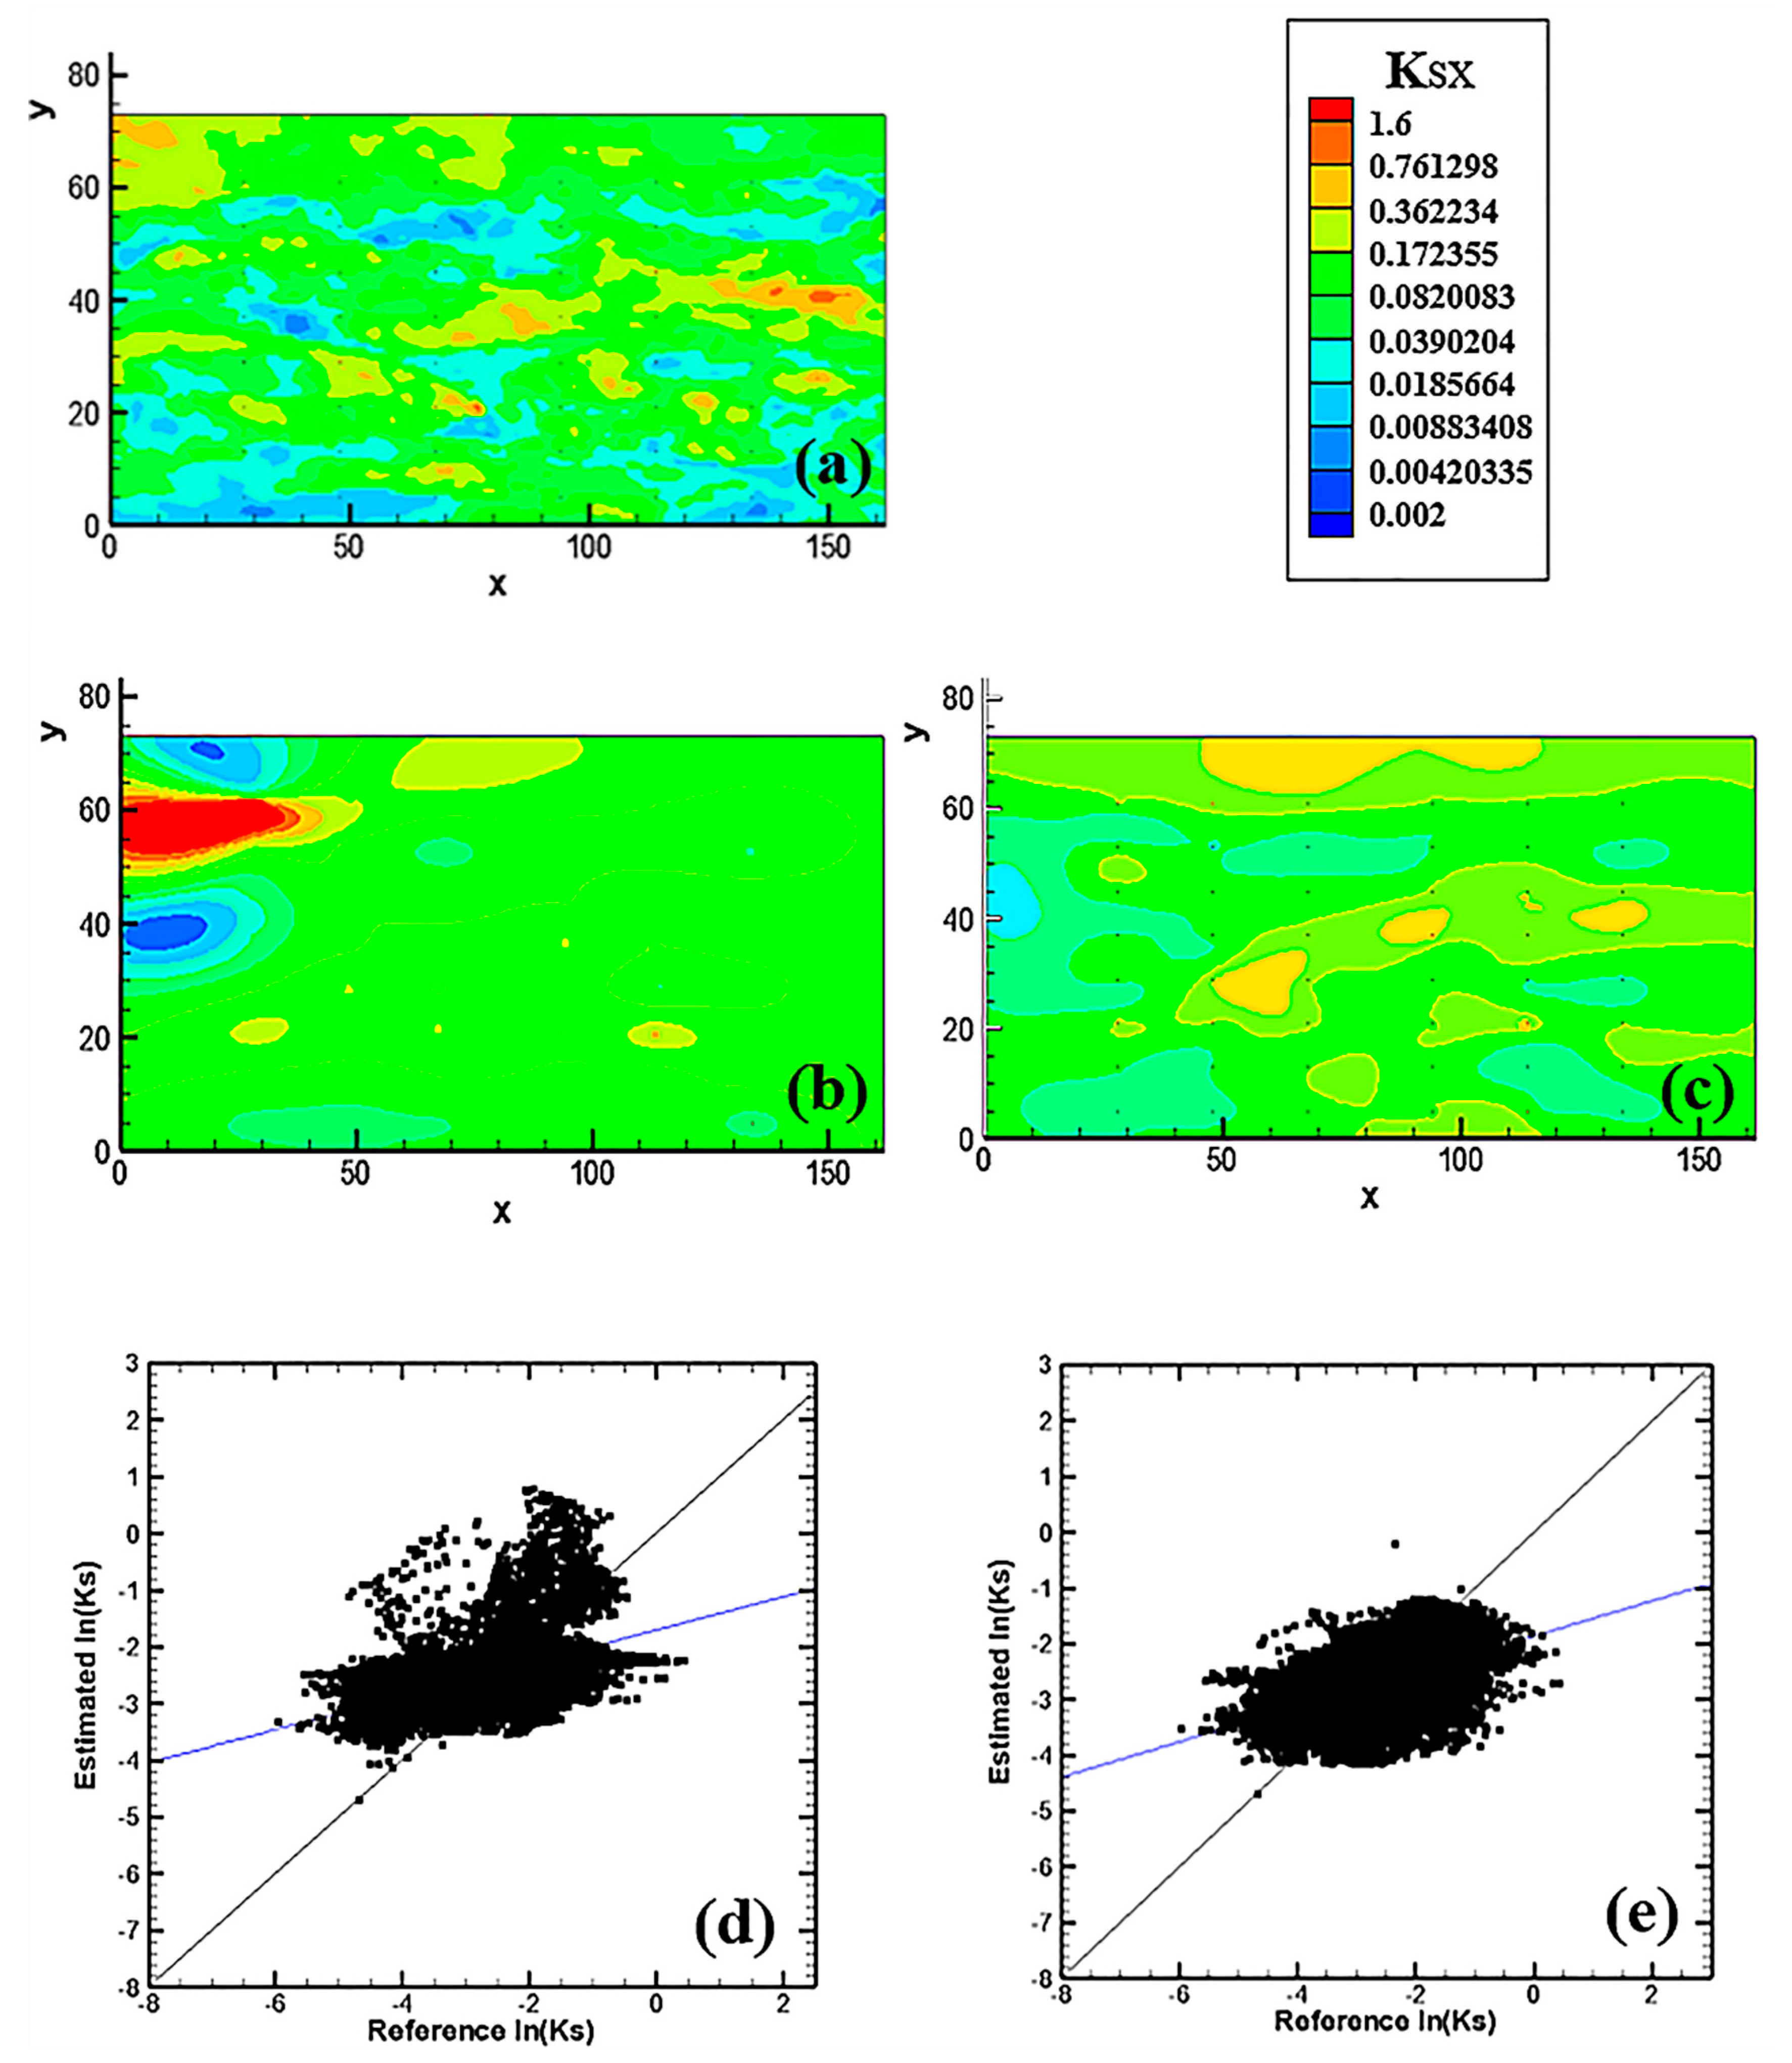
Linear estimation was performed by kriging using the reference K values (hard data) corresponding to the 48 ports. We assume that the core sample data can be directly extracted by VSAFT2. Two scenarios were conducted, one without and the other with multilevel a priori geological information. The results are shown in Figure 3. Figure 3a shows the distribution of the reference K field, and Figure 3b,c represent the distribution of the K field estimated by the two scenarios. A comparison of the two scenarios reveals that the inverted K field provides clearer hierarchical information and better characterization of heterogeneity, indicating that incorporation of multilevel, small-scale a priori geological information can improve the accuracy of the estimated K field. It should be noted that because kriging is an estimation method based on interpolation and extrapolation, the resulting estimated K field has a distribution with a relatively smooth hierarchical outline [33,34].
In addition, it can be observed from the scatter plots that the correlation coefficient R2 is 0.25 and the slope is 0.32 in Figure 3e and R2 is 0.21 and the slope is 0.29 in Figure 3d. The scatter points in Figure 3e are more concentrated and the blue line is closer to the 45° line, suggesting that kriging method which considers smaller scales has a better overall fitting. In summary, the incorporation of multilevel a priori geological information enables more accurate characterization of heterogeneity, indirectly proving the importance of hierarchical information.

3.3. Heterogeneity Characterization by HT

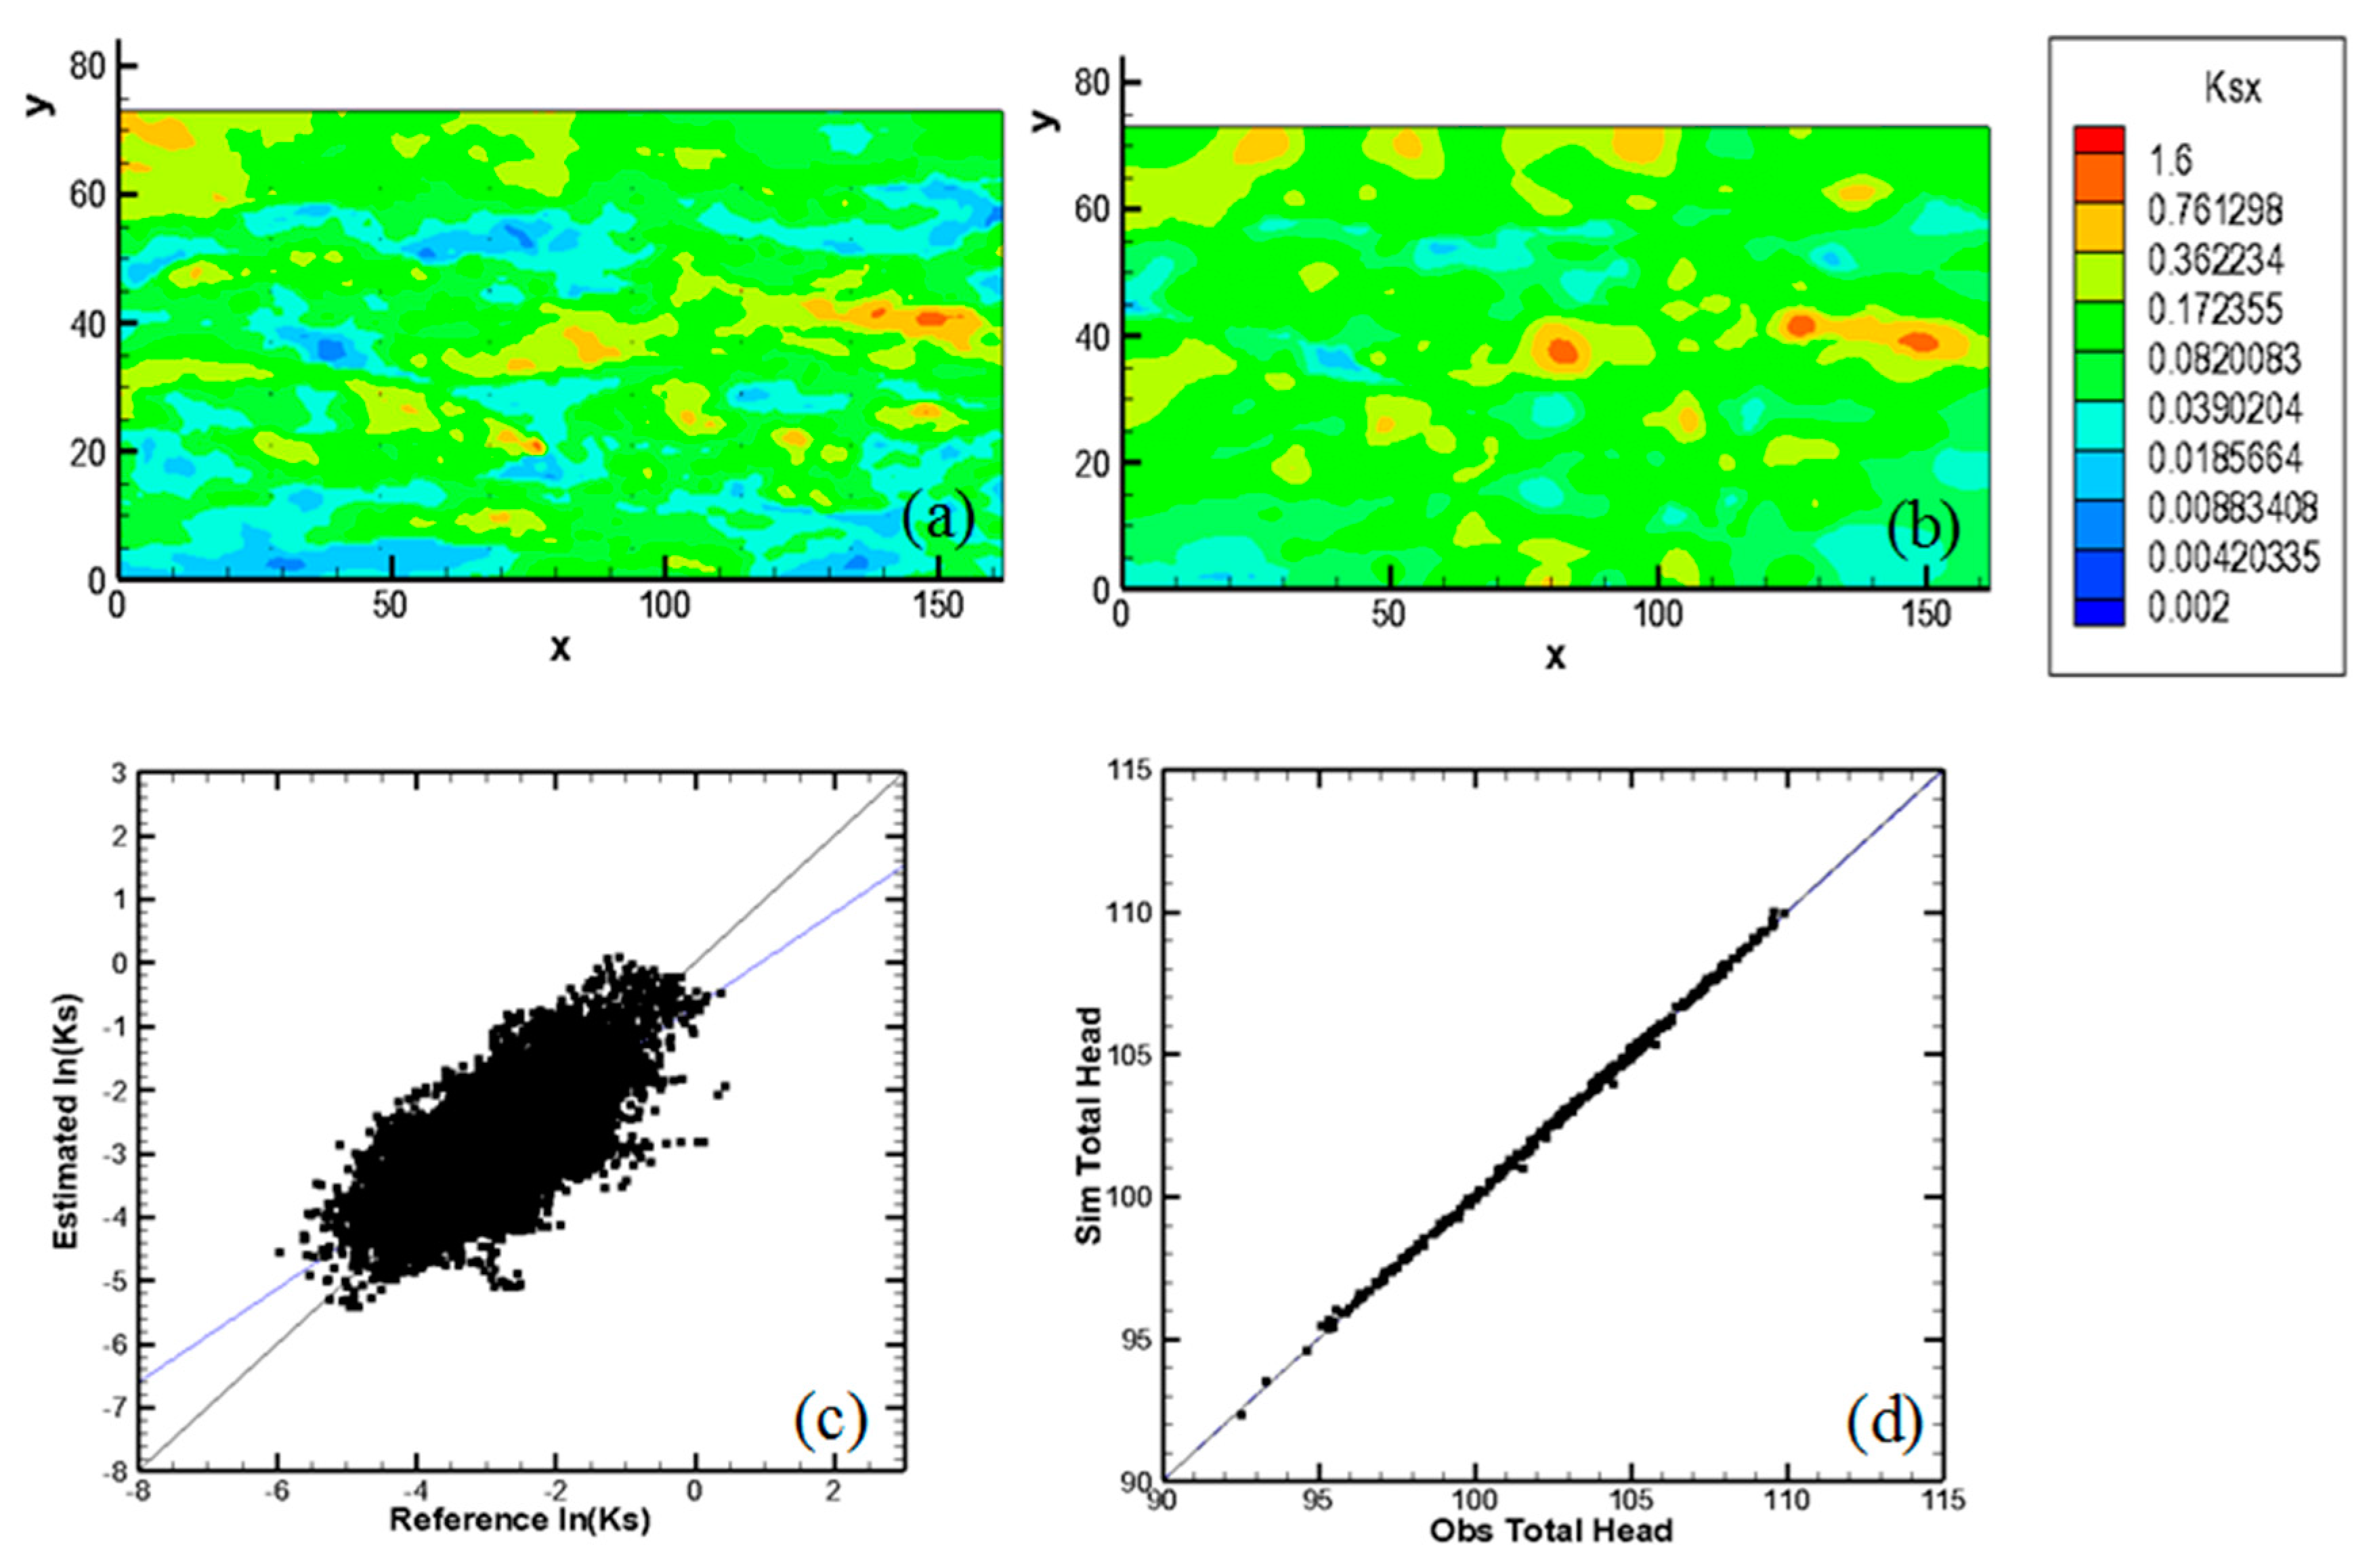
The estimated value of K for the entire work area is inverted with the VSAFT2 model by inputting the 8 groups of observed head data under forward modeling into the HT model. Figure 4a,b show the spatial distributions of the reference K field and the HT-estimated K field, respectively. It can be seen that the interlayer information is more significant and the hierarchical outline is more clearly characterized; the spatial distribution trends of K values agree very well, with one-to-one correspondence in the high-K and low-K regions. Moreover, the slope of the scatter plot in Figure 4c reaches 0.74, which is very close to the 45° line, and the correlation coefficient R2 reaches 0.58 (compared with the maximum correlation coefficient of 0.25 by kriging method), indicating that the HT-estimated K field is quantitatively closer to the reference field. Therefore, HT remarkably improves the simulation of the K field and hydraulic head compared with the kriging estimation.

3.4. Tracer Test

3.4.1. Comparison of Concentration Contours in the Reference Field and the Estimated Field

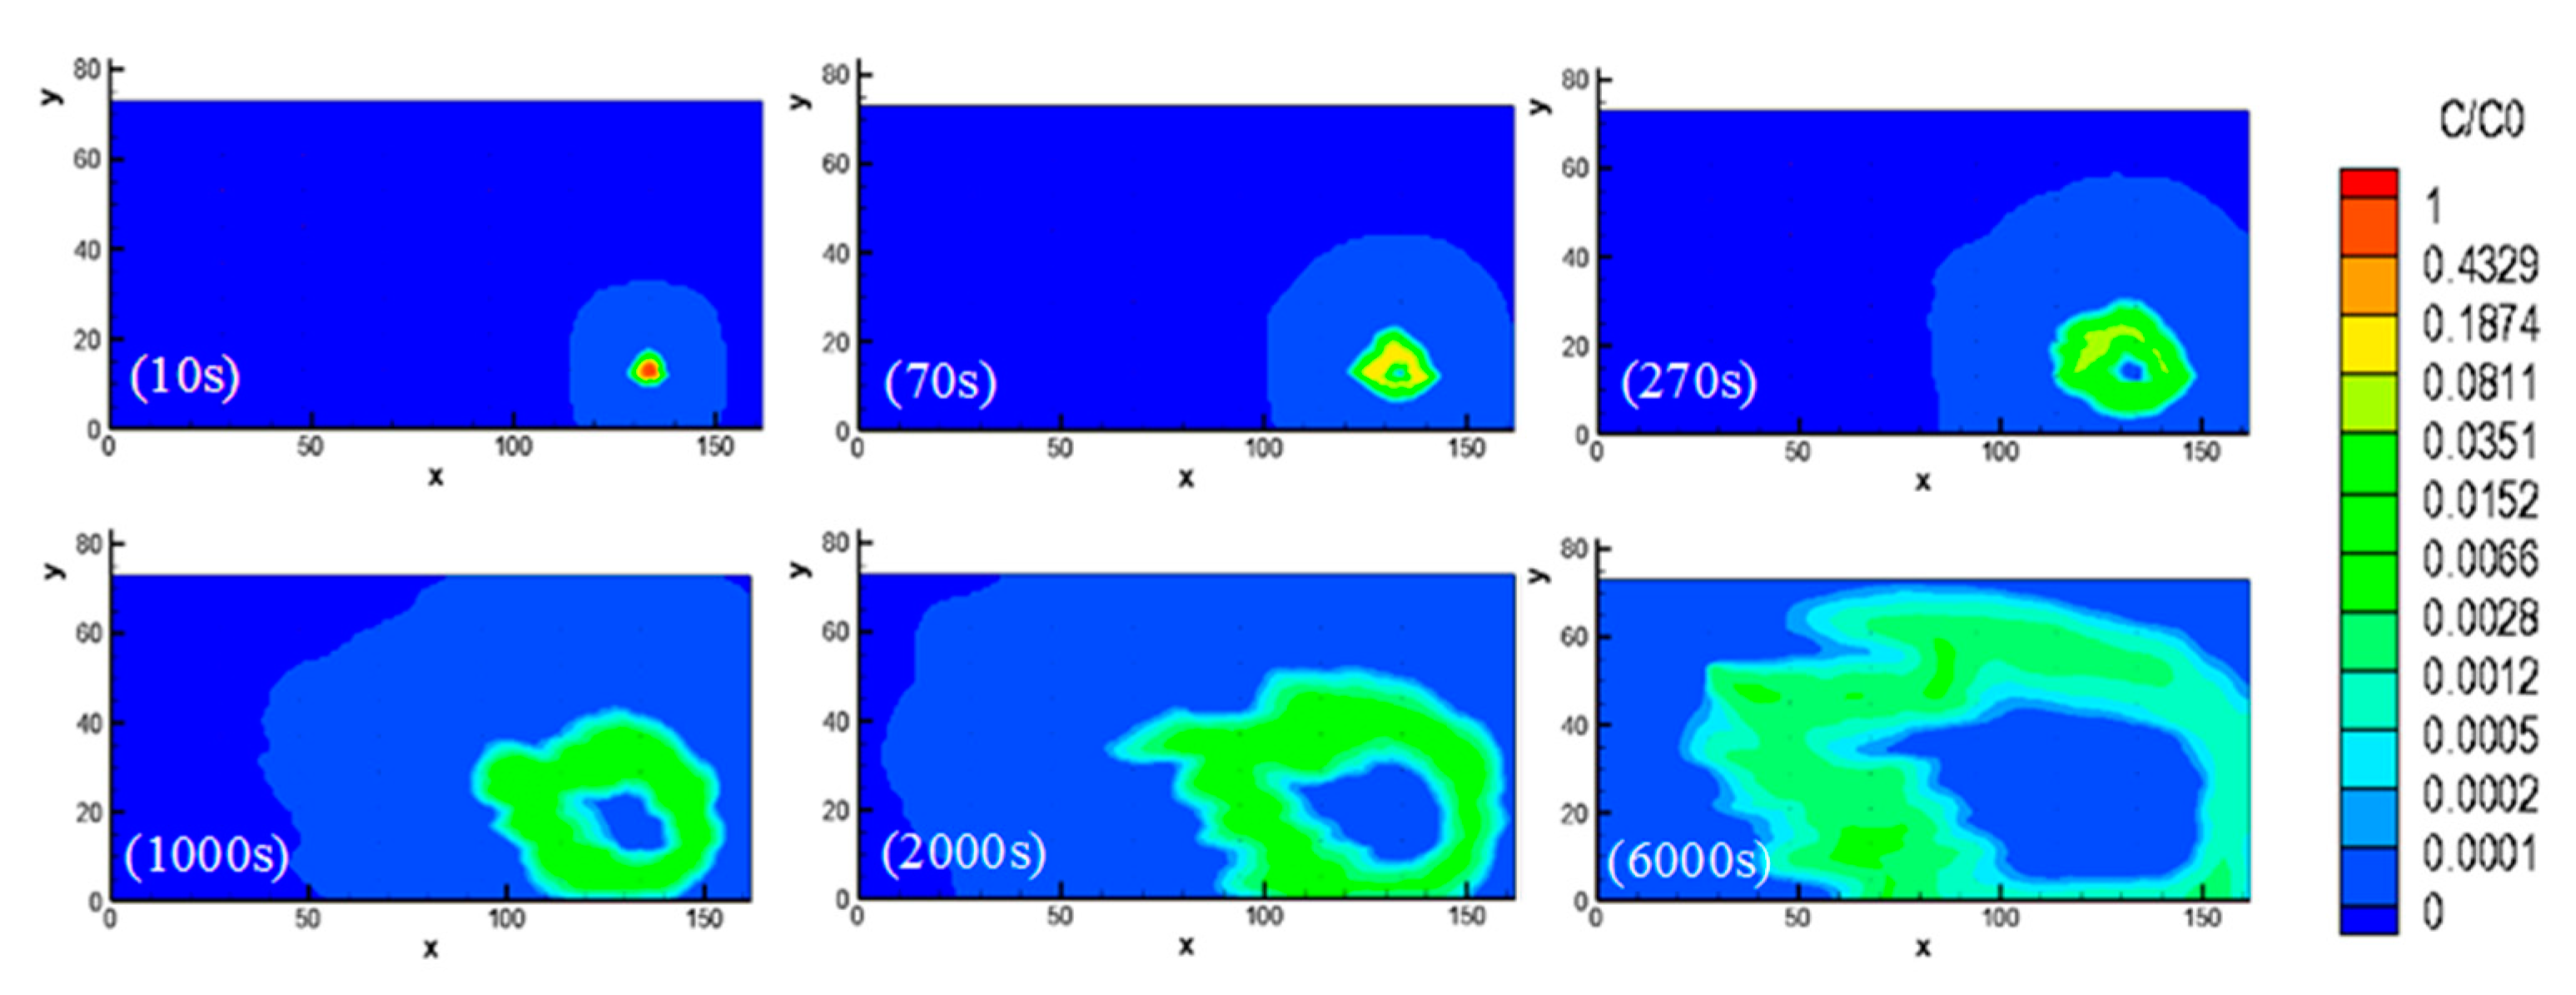
Figure 5 shows the positions of solute transport simulated at output time points of 10 s, 70 s, 270 s, 1000 s, 2000 s, and 6000 s under the reference K field in a group of pumping/injection tests (by pumping at well #7 and injecting solute–water mixture at well #42). Figure 6 shows the positions of simulated solute transport under the optimal estimated K field. In the figure, the concentrations have been normalized so that a darker color represents a higher concentration. A comparison of Figure 5 and Figure 6 reveals that the positions corresponding to each time point are approximately the same and the transport direction and the diffusion range of the tracer coincide well, indicating that the HT-derived optimal estimated K field can sufficiently predict the transport direction and concentration of solute.

3.4.2. Mass Conservation of Solute Concentration

Table 1 presents the total mass of the reference and estimated fields at different time points. The correlation coefficient between the total mass concentrations of the reference field and the estimated field is greater than 0.96, indicating that the total mass concentration was properly estimated. It should be noted that before the solute was pumped out of well #7, the theoretically calculated total mass concentration of the solute should have been equal to the total mass concentration of the injected solute (1513 mg/mL) multiplied by the injection time (10 s). However, the estimated concentrations shown in Table 1 are not equal to the theoretical concentrations, and such differences might be attributed to computer simulation errors.

3.4.3. Route of Solute Mean Position

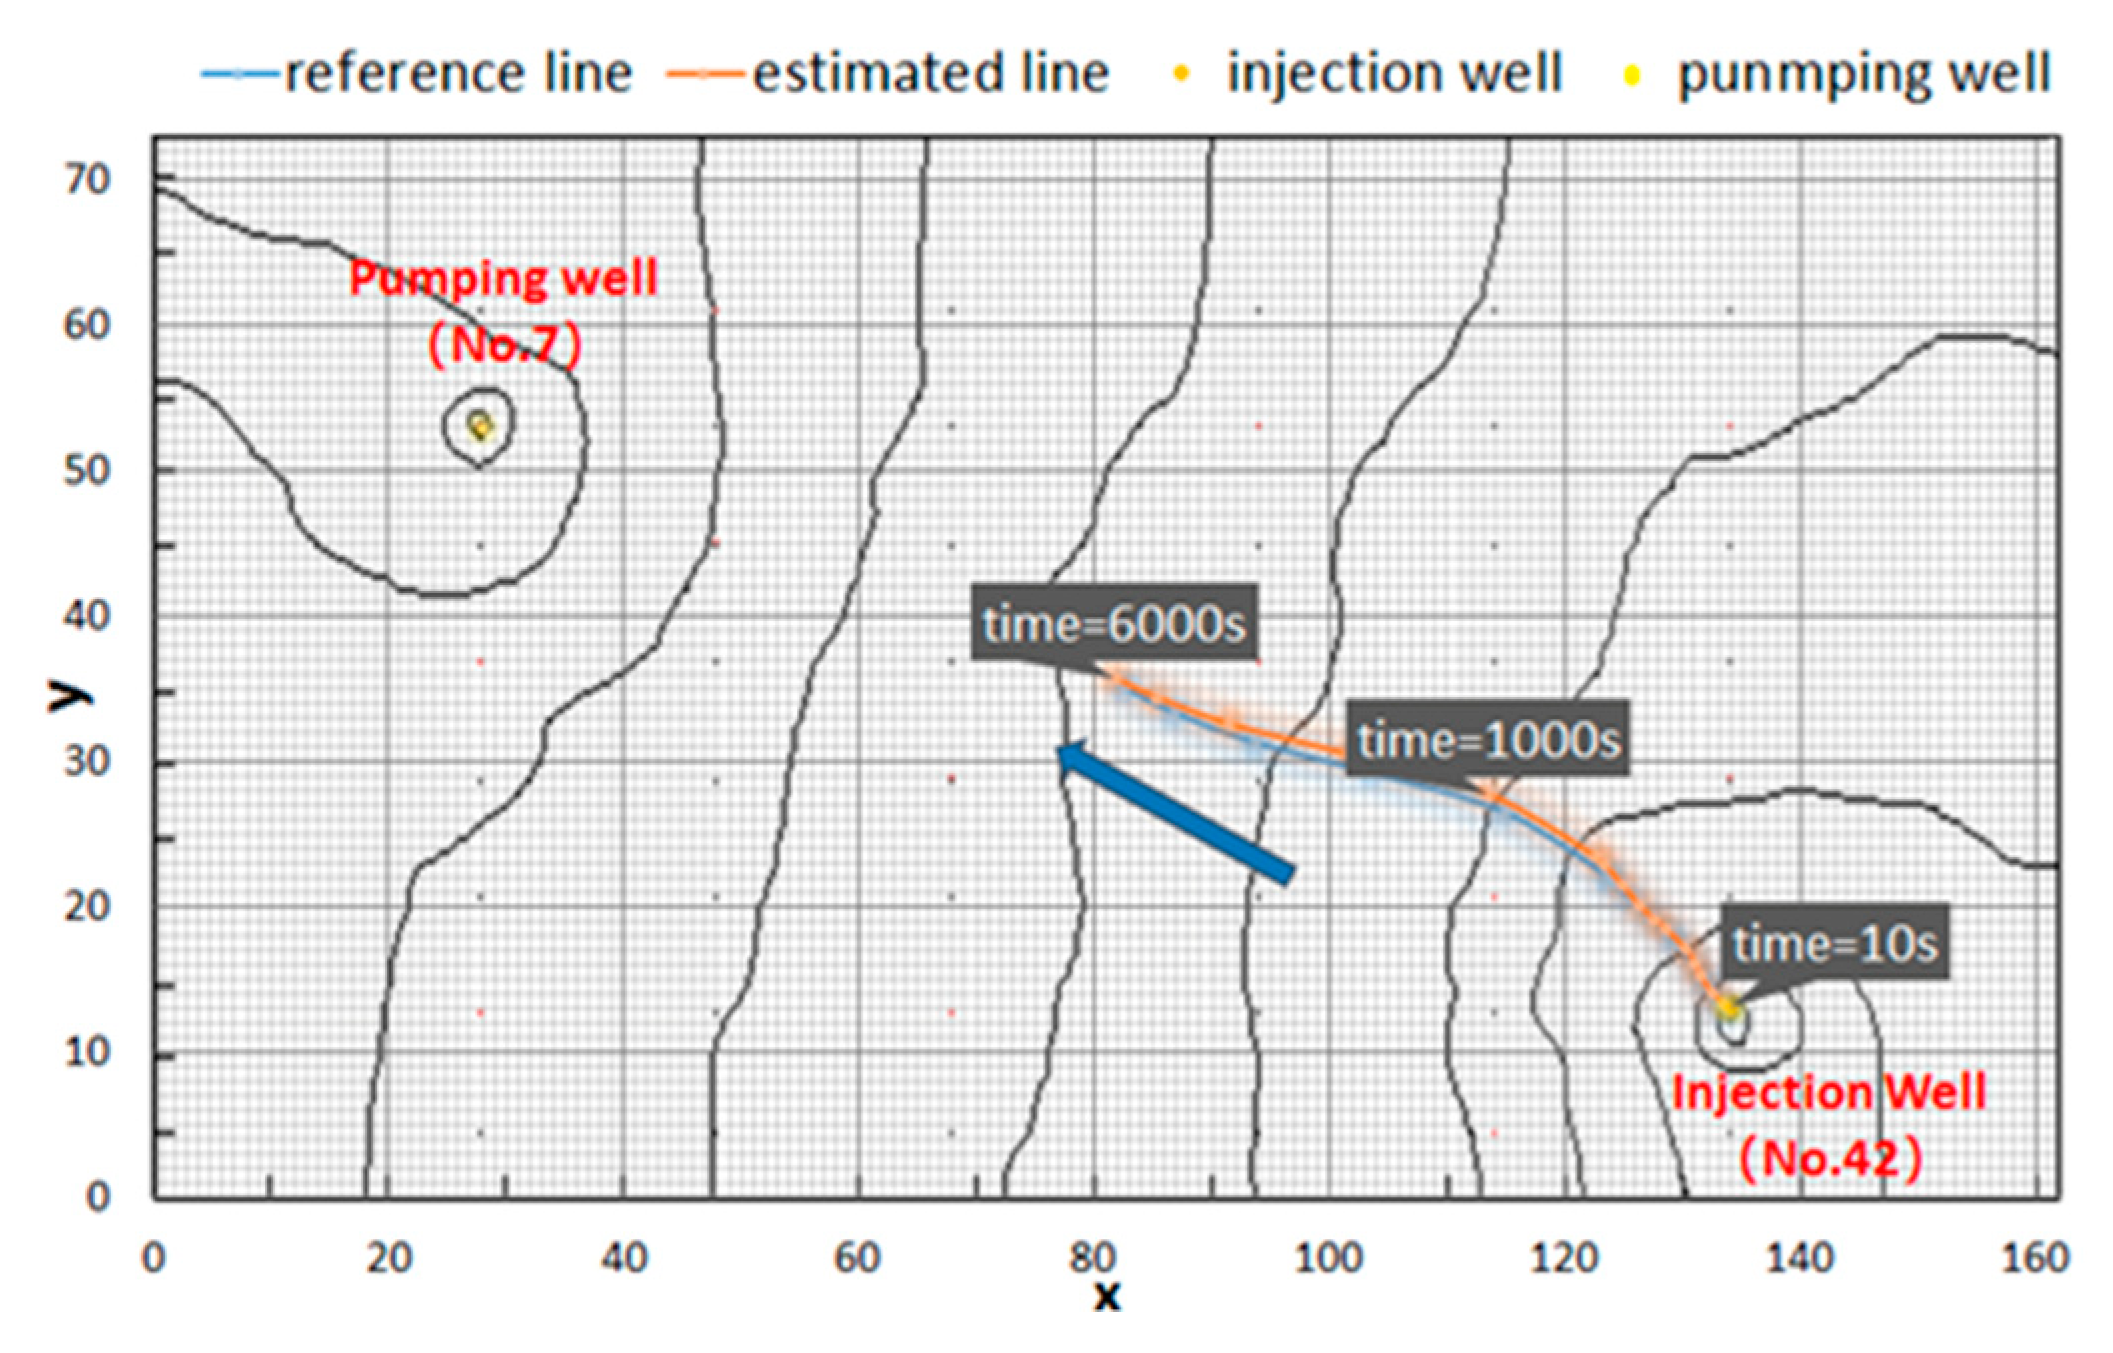
The center positions of the tracer at different time points are estimated using the ratio of the first moment to zeroth moment, μ x The direction of solution transport is recognized by determining the displacement of the mean position, and the position coordinates of the tracer at different time points are extracted and plotted on a plane, as shown in Figure 7. The curve and direction of solute displacement under the estimated field basically coincide with those under the reference field, respectively, indicating that the simulated K field can properly characterize the heterogeneity of the sandbox used in our experiment.
Table 2 shows the approximately estimated displacements of the tracer center after different periods of time and the transport velocity in each period of time. It is indicated that the transport velocity of the solute gradually decreases with the passage of time, which may be due to the decrease in the concentration gradient, the heterogeneity of the aquifer, and the radial flow in the vicinity of the wells. According to the displacement data, it can be roughly estimated that the tracer was initially pumped out at a time point between 1000 s and 2000 s. The displacement data are accumulated starting at 10 s, and it is found that the total displacement at 1000 s and 2000 s is approximately 84.95 cm and 110.29 cm. In addition, as shown in Figure 5 and Figure 6, the coordinate of the outer boundary is (x,y) = (110 cm, 25 cm) at 10s, (40 cm, 50 cm) at 1000s, and (12 cm, 70 cm) at 2000s. However, the distance between the well #7 and the outer boundary of solute plume (at 10s) is almost exactly 100 cm. That is, the time when the solute moves to the mouth of well #7 should be between 1000 s and 2000 s.
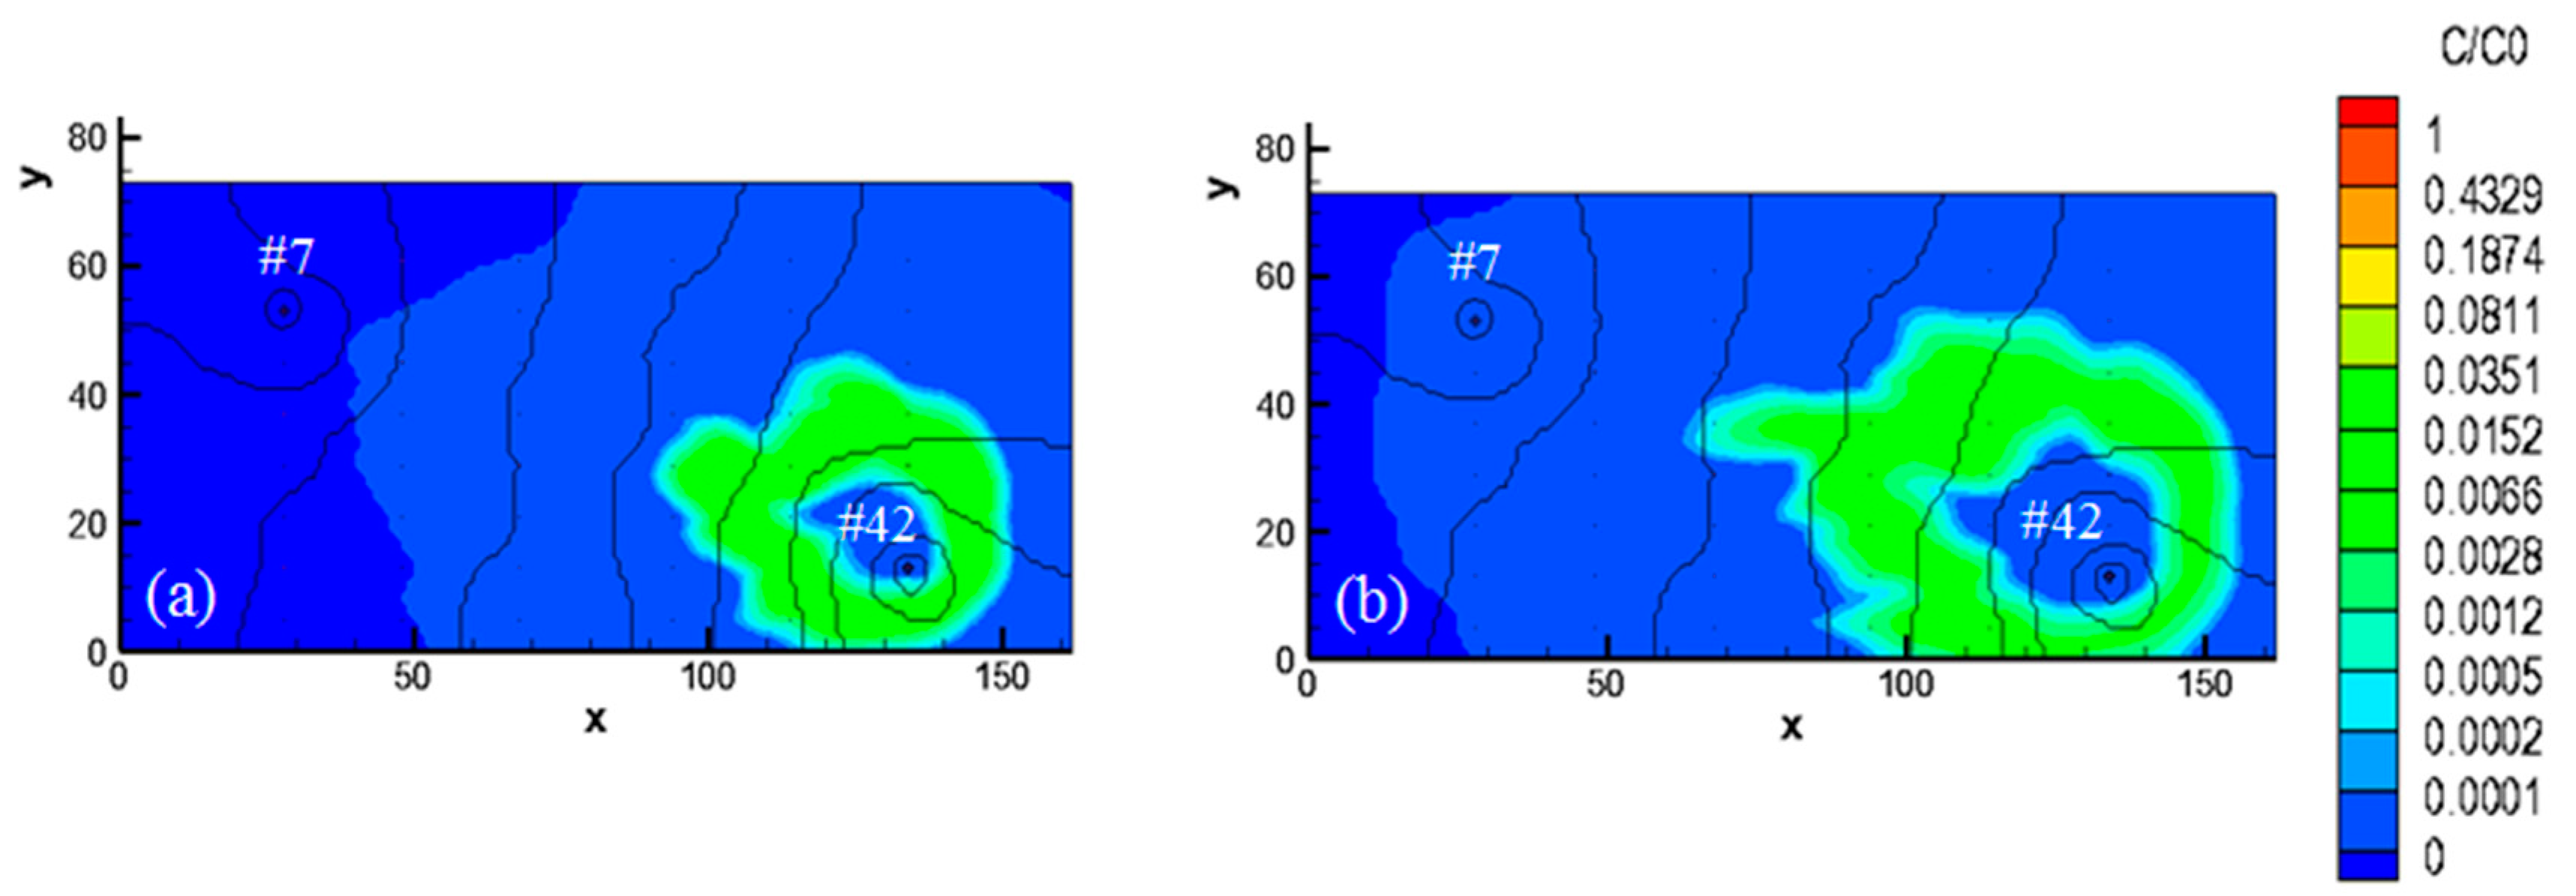
Figure 8a,b show the concentration range of the estimated field at 1000 s and 2000 s, respectively. As seen, the solute (tracer) has noticeably not arrived at well #7 at 1000 s, but the lightest blue area has already passed over well #7 at 2000 s, consistent with the conclusion of the displacement data analysis. Considering the previous analysis, it is effectively proved that HT is able to not only fit head signals very well but also accurately predict solute transport, and it also offers a good alternative for the treatment of pollutants.

4. Conclusions

Based on a synthetic sandbox incorporated with multilevel a priori geological information, we compared the roles of kriging and HT in the fine characterization of aquifer heterogeneity. The solute transport under the optimal K field is examined, and the effects of the number of pumping cycles on the accuracy of aquifer heterogeneity are investigated in this study. The following conclusions can be drawn:
  • As the number of pumping cycles increases, the accuracy of the inversely obtained K field is improved, although this improvement is no longer significant after the 6th pumping test. For specific regional hydrogeological studies, we can use a sufficient number of pumping cycles during a field experiment and determine the number of pumping cycles beyond which the effect of this number is no longer significant, thus providing a reference for determining the number of pumping cycles needed for different hydrogeological points of the same region.
  • Incorporation of multilevel a priori geological information improves the accuracy in the estimated K field. When small-level heterogeneity is considered, the accuracy in the characterization of the K field heterogeneity of the aquifer inversely obtained by HT is generally higher than that by kriging.
  • The HT-derived optimal estimated K field is able to not only fit head signals very well but also more accurately predict solute transport, suggesting that fine characterization of aquifer heterogeneity is of great importance to the prediction of solute transport.
The sandbox used in this study is directly synthesized on a computer using VSAFT2, lacking experimental data for practical validation and containing systematic errors in the numerical model. And it should be noted that the study is 2D, which is not realistic, especially in the typical, local scenario of HT. In addition, in this study, only the analysis of spatial moments is performed in the prediction of solute transport. Future work can combine the breakthrough curves of other observation wells to investigate the accuracy in the prediction of solute transport using time moments. In addition, we will attempt to combine the time moment approach with the sandbox test data to verify the importance of fine characterization of aquifer heterogeneity in actual applications.

Author Contributions

Conceptualization, Y.Z.; methodology, Y.Z., C.W., T.-C.J.Y.; software, T.-C.J.Y.; writing—original draft preparation, Y.Z.; writing—review and editing, C.W.; funding acquisition, C.W.; resources, Y.Z., C.W., B.X.H., T.-C.J.Y., Y.H., W.L.

Funding

This research was funded by the National Natural Science Foundation of China, grant No. 51879108, the Natural Science Foundation of Guangdong Province, China, grant No. 2018A030310653, the high-level talent project for the “Pearl River Talent Plan” of Guangdong Province, grant No. 2017GC010397, the Youth Innovative Talents Project for Guangdong Colleges and Universities, grant No. 2017KQNCX010, and the Fundamental Research Funds for the Central Universities, grant No. 21617301.

Acknowledgments

We thank Yuli Wang for valuable comments on experimental design and study results.

Conflicts of Interest

The authors declare no conflict of interest.

References

  1. Zech, A.; Attinger, S.; Cvetkovic, V.; Dagan, G.; Teutsch, G. Is unique scaling of aquifer macrodispersivity supported by field data? Water Resour. Res. 2015, 51, 7662–7679. [Google Scholar] [CrossRef] [Green Version]
  2. Copty, N.K.; Findikakis, A.N. Quantitative estimates of the uncertainty in the evaluation of ground water remediation schemes. Groundwater 2010, 38, 29–37. [Google Scholar] [CrossRef]
  3. Haslauer, C.P.; Rau, M.; Bárdossy, A.; Sudicky, E.A. Effects of Multidimensional Description of the Spatial Structure of Hydraulic Conductivity on Solute Transport. In Proceedings of the Agu Fall Meeting, San Francisco, CA, USA, 9–13 December 2019. [Google Scholar]
  4. Liu, G.; Butler, J.J.; Bohling, G.; Reboulet, E.C.; Knobbe, S.; Hyndman, D.W.; Zheng, C. A New Method for Rapid, High-Resolution Characterization of Hydraulic Conductivity: Application to Solute Transport at the MADE Site. Water Resour. Res. 2009, 45, H21B-0844. [Google Scholar] [CrossRef]
  5. Wang, K.; Huang, G. Impact of Hydraulic Conductivity on Solute Transport in Highly Heterogeneous Aquifer. In Proceedings of the Computer Computing Technologies in Agriculture Iv-ifip Tc 12 Conference, Nanchang, China, 22–25 October 2010. [Google Scholar]
  6. Jr, J.J.B.; Healey, J.M. Relationship between pumping-test and slug-test parameters: Scale effect or artifact? Groundwater 2010, 36, 305–312. [Google Scholar]
  7. Sihag, P.; Tiwari, N.K.; Ranjan, S. Prediction of unsaturated hydraulic conductivity using adaptive neuro- fuzzy inference system (ANFIS). ISH J. Hydraul. Eng. 2017, 25, 132–142. [Google Scholar] [CrossRef]
  8. Sihag, P. Prediction of unsaturated hydraulic conductivity using fuzzy logic and artificial neural network. Model. Earth Syst. Environ. 2018, 4, 189–198. [Google Scholar] [CrossRef]
  9. Yeh, T.C.J.; Liu, S. Hydraulic tomography: Development of a new aquifer test method. Water Resour. Res. 2000, 36, 2095–2105. [Google Scholar] [CrossRef]
  10. Yeh, T.C.J.; Srivastava, R.; Guzman, A.; Harter, T. A Numerical model for water flow and chemical transport in variably saturated porous media. Ground Water 2010, 31, 634–644. [Google Scholar] [CrossRef]
  11. Illman, W.A.; Liu, X.; Craig, A. Steady-state hydraulic tomography in a laboratory aquifer with deterministic heterogeneity: Multi-method and multiscale validation of hydraulic conductivity tomograms. J. Hydrol. 2007, 341, 222–234. [Google Scholar] [CrossRef]
  12. Liu, S.; Yeh, T.C.J.; Gardiner, R. Effectiveness of hydraulic tomography: Sandbox experiments. Water Resour. Res. 2002, 38, 51–59. [Google Scholar] [CrossRef]
  13. Illman, W.A.; Liu, X.Y.; Takeuchi, S.; Yeh, T.C.J.; Ando, K.; Saegusa, H. Hydraulic tomography in fractured granite: Mizunami Underground Research site, Japan. Water Resour. Res. 2009, 45, W01406. [Google Scholar] [CrossRef]
  14. Cardiff, M.; Barrash, W.; Kitanidis, P.K.; Malama, B.; Revil, A.; Straface, S.; Rizzo, E. A Potential-Based Inversion of Unconfined. Ground Water 2009, 47, 259–270. [Google Scholar] [CrossRef] [PubMed]
  15. Gelhar, L.W.; Gutjahr, A.L.; Naff, R.L. Stochastic analysis of macrodispersion in a stratified aquifer. Water Resour. Res. 1979, 15, 1643–1644. [Google Scholar] [CrossRef]
  16. Illman, W.A.; Berg, S.J.; Yeh, T.C. Comparison of approaches for predicting solute transport: Sandbox experiments. Ground Water 2011, 50, 421–431. [Google Scholar] [CrossRef] [PubMed]
  17. Zhao, Z. Hydraulic Tomography in Unconfined Aquifers and the Importance of Geological Data: Laboratory and Field Studies; University of Waterloo: Ontario, ON, Canada, 2016. [Google Scholar]
  18. Clyde, M.; George, E.I. Model Uncertainty. Stat. Sci. 2004, 19, 81–94. [Google Scholar]
  19. Heitman, J.L. Hartge/Horn: Essential Soil Physics, An Introduction to Soil Processes, Functions, Structure, and Mechanics. Soil Sci. 2017, 182, 1. [Google Scholar] [CrossRef]
  20. Zhao, R.; Shuai, Y.; Jie, Y.; Heng, M.; Zhang, C.; Wu, Y.; Zhang, J.; Yue, X.A. Optimization of Well Spacing to Achieve a Stable Combustion During the THAI Process. Energy 2018, 151, 467–477. [Google Scholar] [CrossRef]
  21. Luo, R.L.; Fan, J.W.; Liao, H.M.; Xu, W. Optimization of well spacing for tight sandstone gas reservoirs - case study of eastern sulige gas field. Adv. Mater. Res. 2013, 616–618, 762–766. [Google Scholar] [CrossRef]
  22. Wang, L.; Huang, K.; Deng, Q.; Dongliang, L.; Branch, T. Research of injection-production system seepage field characteristics and well spacing optimization in bohai m oilfield. J. Southwest Pet. Univ. 2013, 35, 99–108. [Google Scholar]
  23. Christensen, S.; Zlotnik, V.A.; Tartakovsky, D.M. On the use of analytical solutions to design pumping tests in leaky aquifers connected to a stream. J. Hydrol. 2010, 381, 341–351. [Google Scholar] [CrossRef]
  24. Oliver, M.A.; Webster, R. Kriging: A method of interpolation for geographical information systems. Int. J. Geogr. Inf. Syst. 1990, 4, 313–332. [Google Scholar] [CrossRef]
  25. Bargaoui, Z.K.; Chebbi, A. Comparison of two kriging interpolation methods applied to spatiotemporal rainfall. J. Hydrol. 2009, 365, 56–73. [Google Scholar] [CrossRef]
  26. Illman, W.A. Hydraulic tomography offers improved imaging of heterogeneity in fractured rocks. Groundwater 2013, 52, 659. [Google Scholar] [CrossRef] [PubMed]
  27. Liu, X.; Illman, W.A.; Craig, A.J.; Zhu, J.; Yeh, T.C.J. Laboratory sandbox validation of transient hydraulic tomography. Water Resour. Res. 2007, 43, 175. [Google Scholar] [CrossRef]
  28. Gottlieb, J.; Dietrich, P. Identification of the permeability distribution in soil by hydraulic tomography. Inverse Probl. 1995, 11, 353–360. [Google Scholar] [CrossRef]
  29. Illman, W.A.; Craig, A.J.; Liu, X. Practical issues in imaging hydraulic conductivity through hydraulic tomography. Groundwater 2010, 46, 120–132. [Google Scholar] [CrossRef]
  30. Hao, Y.; Yeh, T.C.; Xiang, J.; Illman, W.A.; Ando, K.; Hsu, K.C.; Lee, C.H. Hydraulic tomography for detecting fracture zone connectivity. Ground Water 2010, 46, 183–192. [Google Scholar] [CrossRef]
  31. Liu, X.; Kitanidis, P.K. Large-scale inverse modeling with an application in hydraulic tomography. Water Resour. Res. 2011, 47, W02501. [Google Scholar] [CrossRef]
  32. Yeh, T.C.; Khaleel, R.; Carroll, K.C. Flow through Heterogeneous Geologic Media; Hydrology and Water Resources: World Meteorological Organization Weather: Geneva, Switzerland, 2015. [Google Scholar]
  33. Hu, R.; Brauchler, R.; Herold, M.; Bayer, P. Hydraulic tomography analog outcrop study: Combining travel time and steady shape inversion. J. Hydrol. 2011, 409, 350–362. [Google Scholar] [CrossRef]
  34. Brauchler, R.; Hu, R.; Hu, L.; Jimenez, S.; Bayer, P.; Dietrich, P.; Ptak, T. Rapid field application of hydraulic tomography for resolving aquifer heterogeneity in unconsolidated sediments. Water Resour. Res. 2013, 49, 2013–2024. [Google Scholar] [CrossRef]
Figure 1. The finite element mesh of the working area of an 18-layered sandbox by VSAFT2 (Variably Saturated Flow and Transport utilizing the Modified Method of Characteristics, in 2D).
Water 11 02295 g001
Figure 2. Scatter plots of the fitting curves for the estimated and actual head values with the number of pumping cycles varying from 1 to 8: (a) 1 pumping test, (b) 2 pumping tests, (c) 3 pumping tests, (d) 4 pumping tests, (e) 5 pumping tests, (f) 6 pumping tests, (g) 7 pumping tests, and (h) 8 pumping tests. Centered. The units of axis are [mm].
Water 11 02295 g002
Figure 3. Spatial distribution of different K field: (a) the reference K field; (b) the kriging-estimated K field without a priori geological information; (c) the kriging-estimated K field with a priori information. Scatter plots of the fitting curves for LnK by kriging method: (d) without a priori geological information; (e) with a priori geological information. The units of axis are cm/s.
Water 11 02295 g003
Figure 4. Spatial distribution of different K field: (a) the reference K field; (b) the hydraulic tomography (HT)-estimated K field. Scatter plots of fitting curves: (c) the HT-estimated LnK and (d) the HT-estimated head H. The units of axis are cm/s.
Water 11 02295 g004
Figure 5. The positions of solute transport simulated at output time points of 10 s, 70 s, 270 s, 1000 s, 2000 s, and 6000 s under the reference K field in a group of pumping/injection tests. The units of axis are cm.
Water 11 02295 g005
Figure 6. The positions of simulated solute transport at output time points of 10 s, 70 s, 270 s, 1000 s, 2000 s, and 6000 s under the optimal estimated K field in a group of pumping/injection tests. The units of axis are cm.
Water 11 02295 g006
Figure 7. Transport route of the tracer center. The units of axis are cm.
Water 11 02295 g007
Figure 8. Concentration distribution of the estimated field at specific time point: (a) at 1000 s; (b) at 2000 s. The black line represents the water table contour; the light blue area represents the concentration range during solute transport; the outer boundary line is the forefront of solute transport; the round spot in the upper left corner represents the pumping well #7, and the round spot in the lower right corner represents the injection well #42. The units of axis are cm.
Water 11 02295 g008
Table 1. Total mass concentration at each time point.
Time Point (s)Concentration of Reference Field (mg/mL) Multiplied by Time (s)Concentration of Estimated Field (mg/mL) Multiplied by Time (s)
1012,617.0512,348.89
7013,389.3913,184.79
10013,530.8813,437.63
27013,965.9814,346.23
50014,235.8614,513.34
70014,176.8814,257.88
100014,047.7414,160.73
200014,030.9414,016.92
300013,845.2013,828.36
500012,698.7812,609.27
600011,431.9711,283.76
Table 2. Displacement and velocity of tracer center at different time points.
Time (s)Displacement of Reference Field (cm)Velocity of Reference Field (cm/s)Displacement of Estimated Field (cm)Velocity of Reference Field (cm/s)
100.230.02270.480.0478
702.350.03103.380.0385
1003.140.02634.250.0289
2706.360.01757.750.0191
5009.270.011810.580.0113
70011.280.010112.530.0097
100014.030.008915.370.0094
200023.480.009425.340.0099
300034.480.011036.860.0115
500051.350.007053.180.0064
600056.030.004757.000.0038