Permeability Coefficient of Low Permeable Soils as a Single-Variable Function of Soil Parameter


Abstract
:1. Introduction
2. Materials and Methods
2.1. Materials
2.2. Methodology
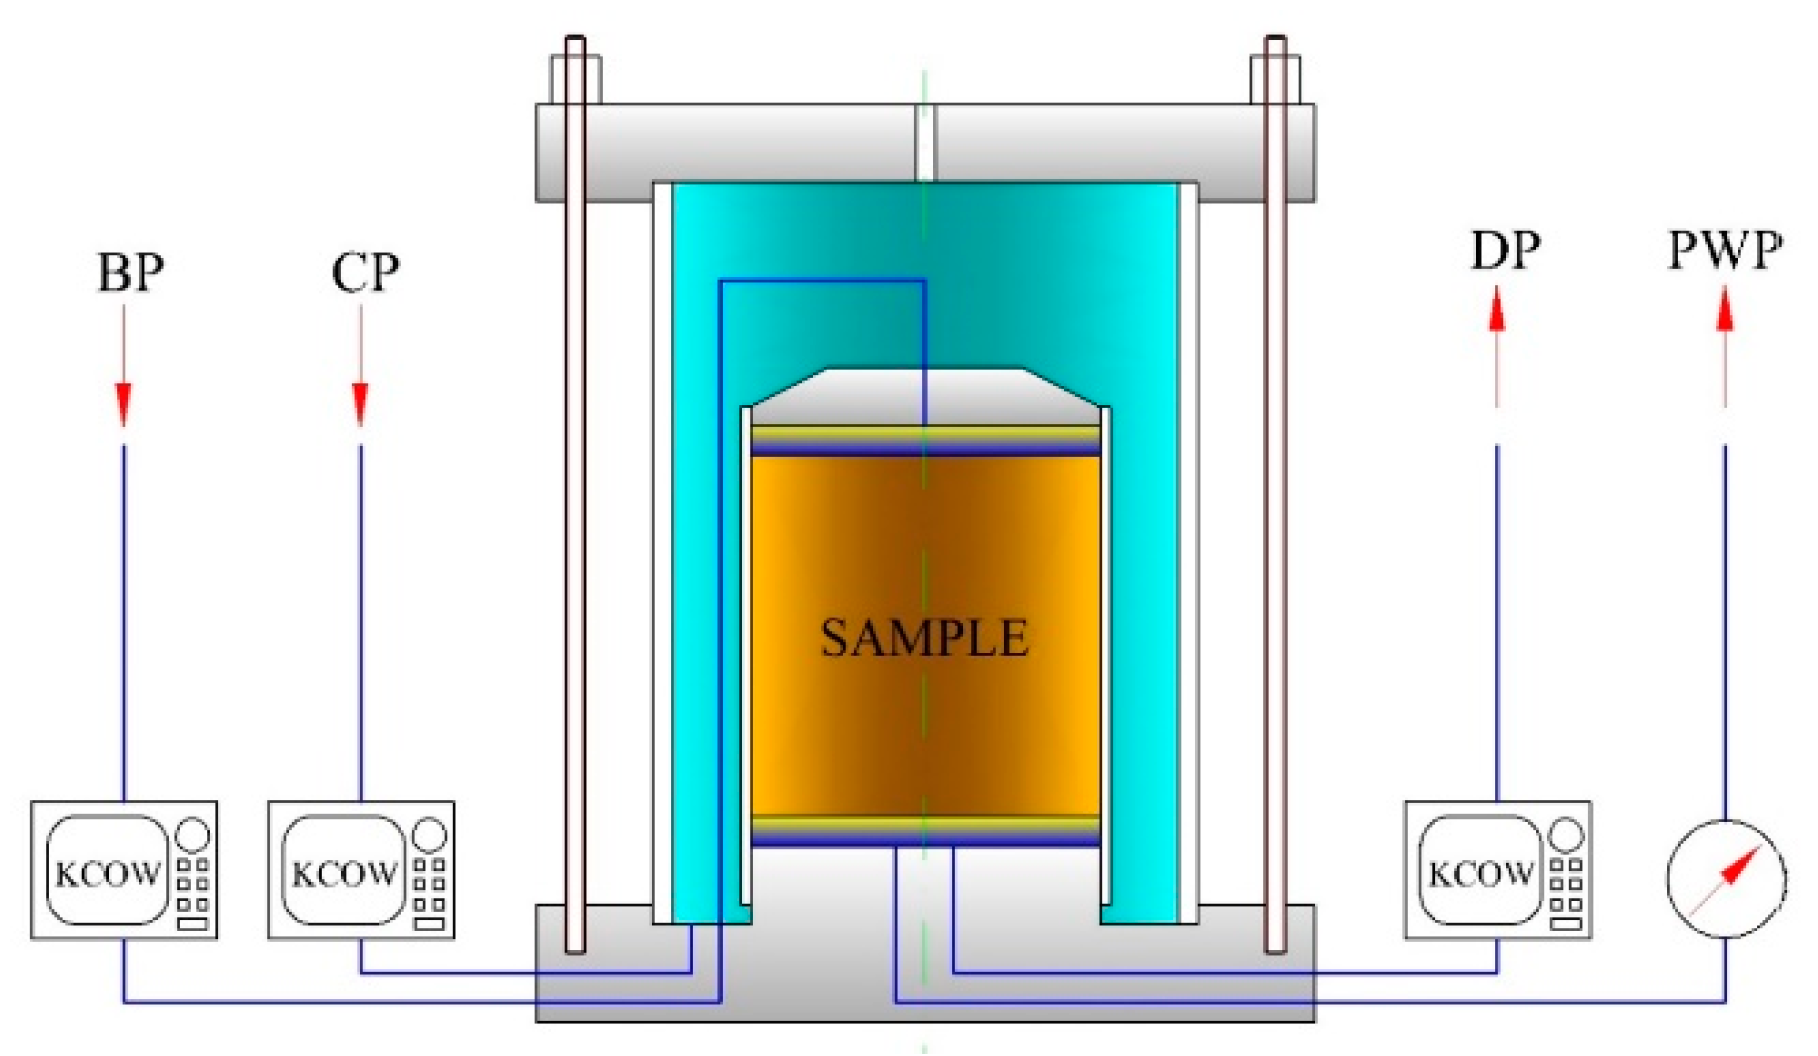
2.2.1. Experimental Method and the Test Stand
2.2.2. Sample Preparation
2.2.3. Test Procedure
- phase I—application of a small hydrostatic pressure to the lower base of the sample, so-called flushing, and
- phase II—pumping deaerated water to the sample via a closed system connected to the sample’s bottom and top, in a so-called method with the use of two back pressures.
- σ′: required effective stress (kPa),
- σ: isotropic pressure in the chamber (kPa)—in the present study, this is a pressure equal to the last pressure applied in the saturation phase, i.e., 650 kPa—, and
- ū: mean pore pressure calculated based on the formulawhere
- ub: pressure at the sample’s top (back pressure) (kPa), and
- uc: pressure at the sample’s base (kPa).
- k—permeability coefficient (m/s),
- Q—flow rate (m3/s), l—sample’s height (m),
- A—area of sample cross-section (m2), and
- Δh—difference of pressures at the sample’s top and bottom (m).
3. Results and Discussion
3.1. Raw Results
3.2. Variance Analysis
3.3. Darcianity of the Observed Flows
3.4. Empirical Regression Models
- V: pores volume, determined by the mercury intrusion porosimetry (MIP), and
- S: pores surface area, determined by the mercury intrusion porosimetry (MIP).
- power:
- logarithmic:
- exponential:
- x: analyzed soil parameter, and
- a1, a2: estimators of model parameters.
- Ip: plasticity index calculated from Ip= wLC − wpw (%), and
- a1 = 1.48 × 10⁻⁶, a2 = −2.93561.
- Dp: average pore diameter obtained using the MIP method (nm),
- a1 = 2.09 × 10⁻¹⁴, a2 = 1.85356,
- ψc2–50: convexity of particles for silt fraction obtained using the DIA method (-), and
- a1 = 4.88 × 10⁻¹⁹, a2 = −2.04 × 10⁻².
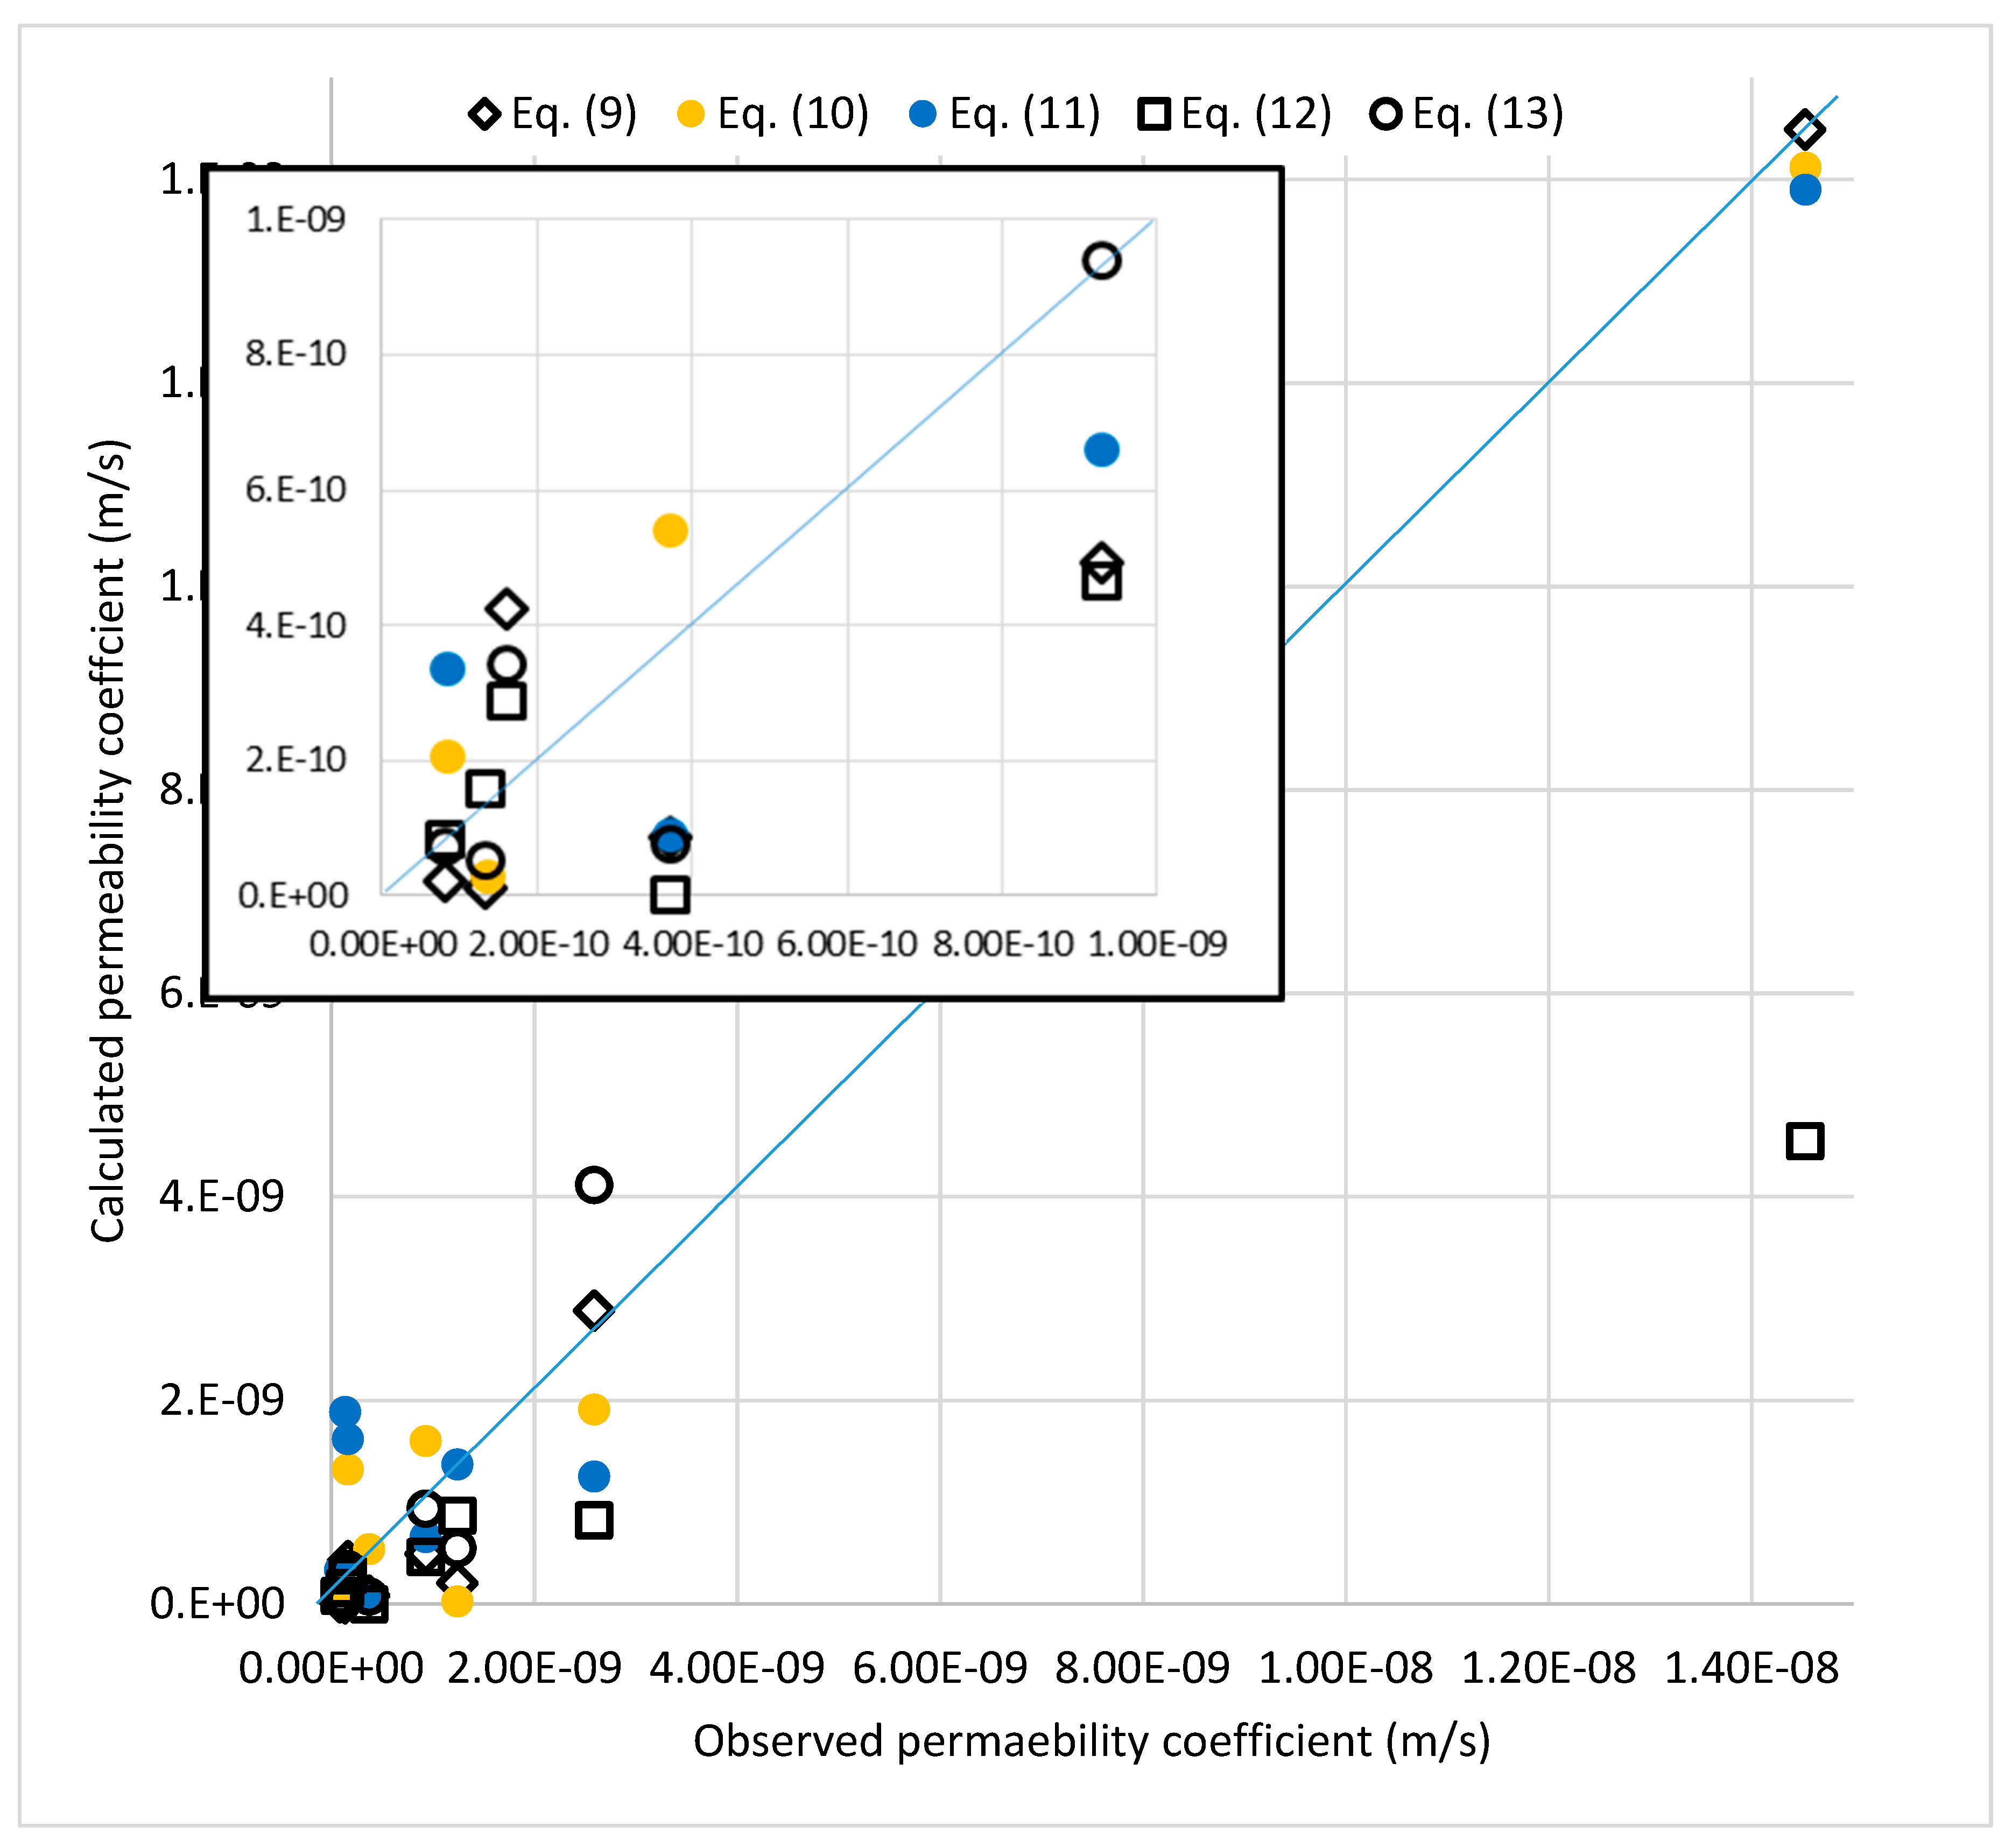
3.5. Models Validation
4. Conclusions
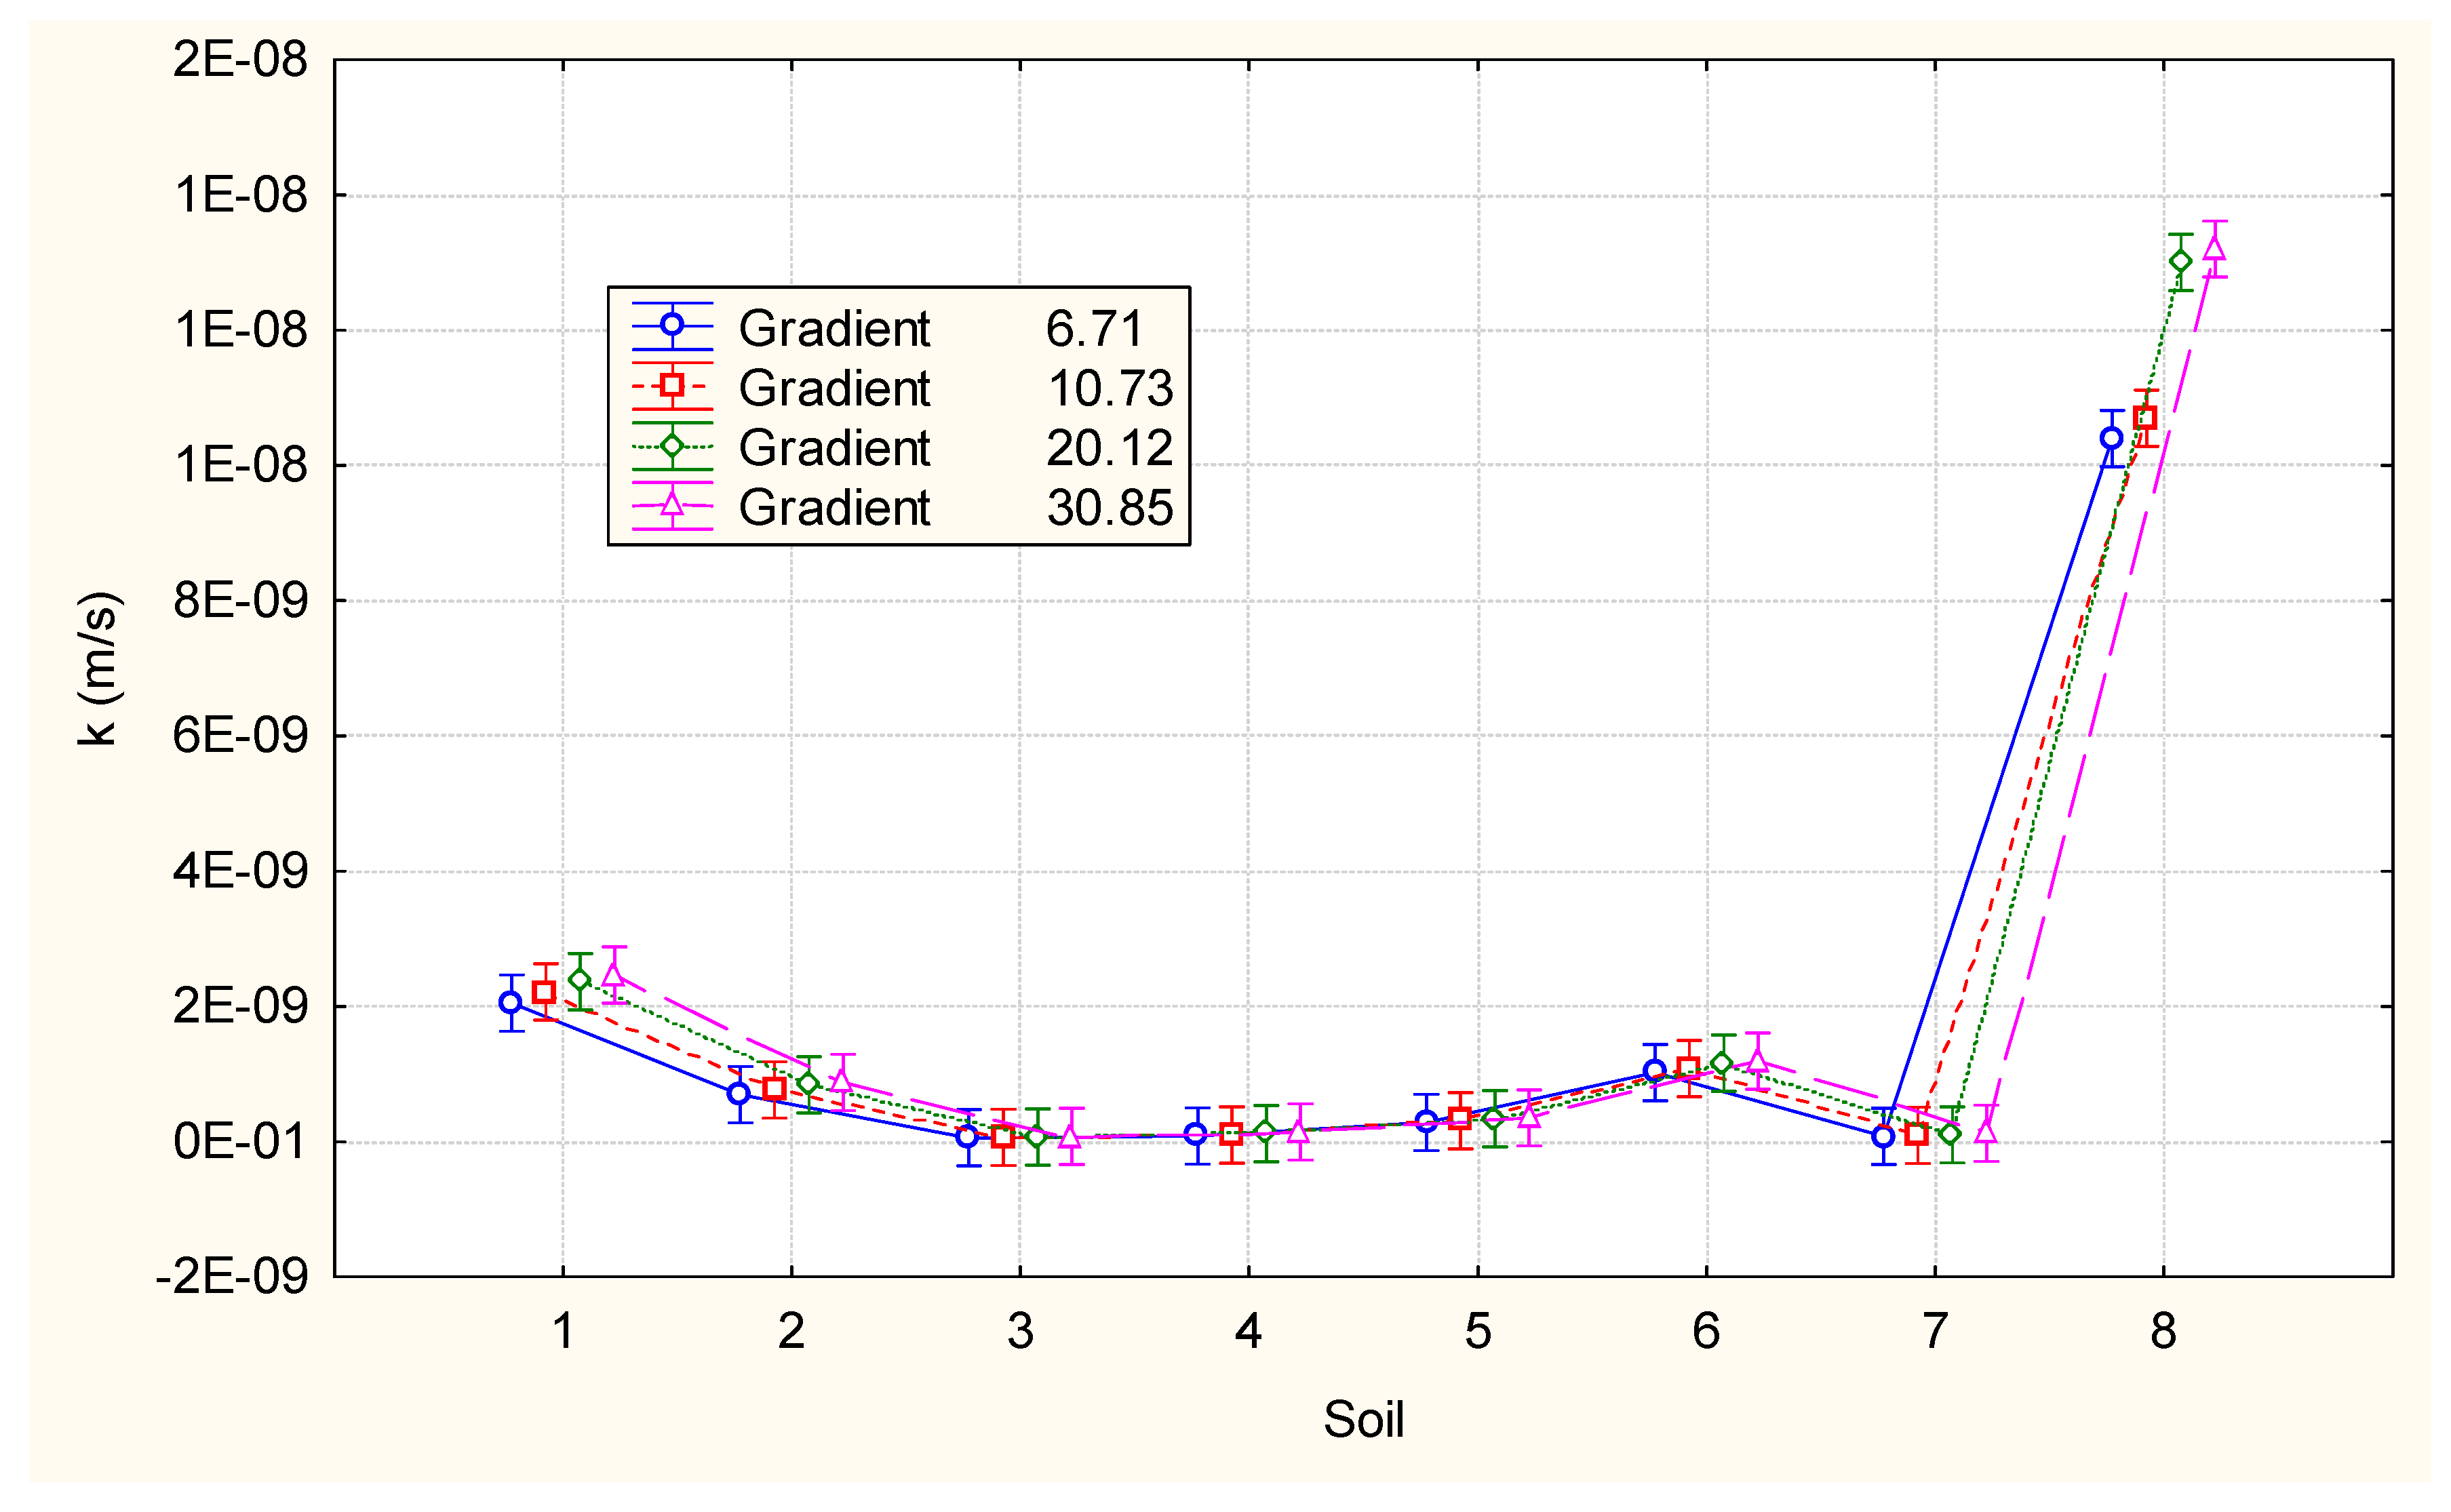
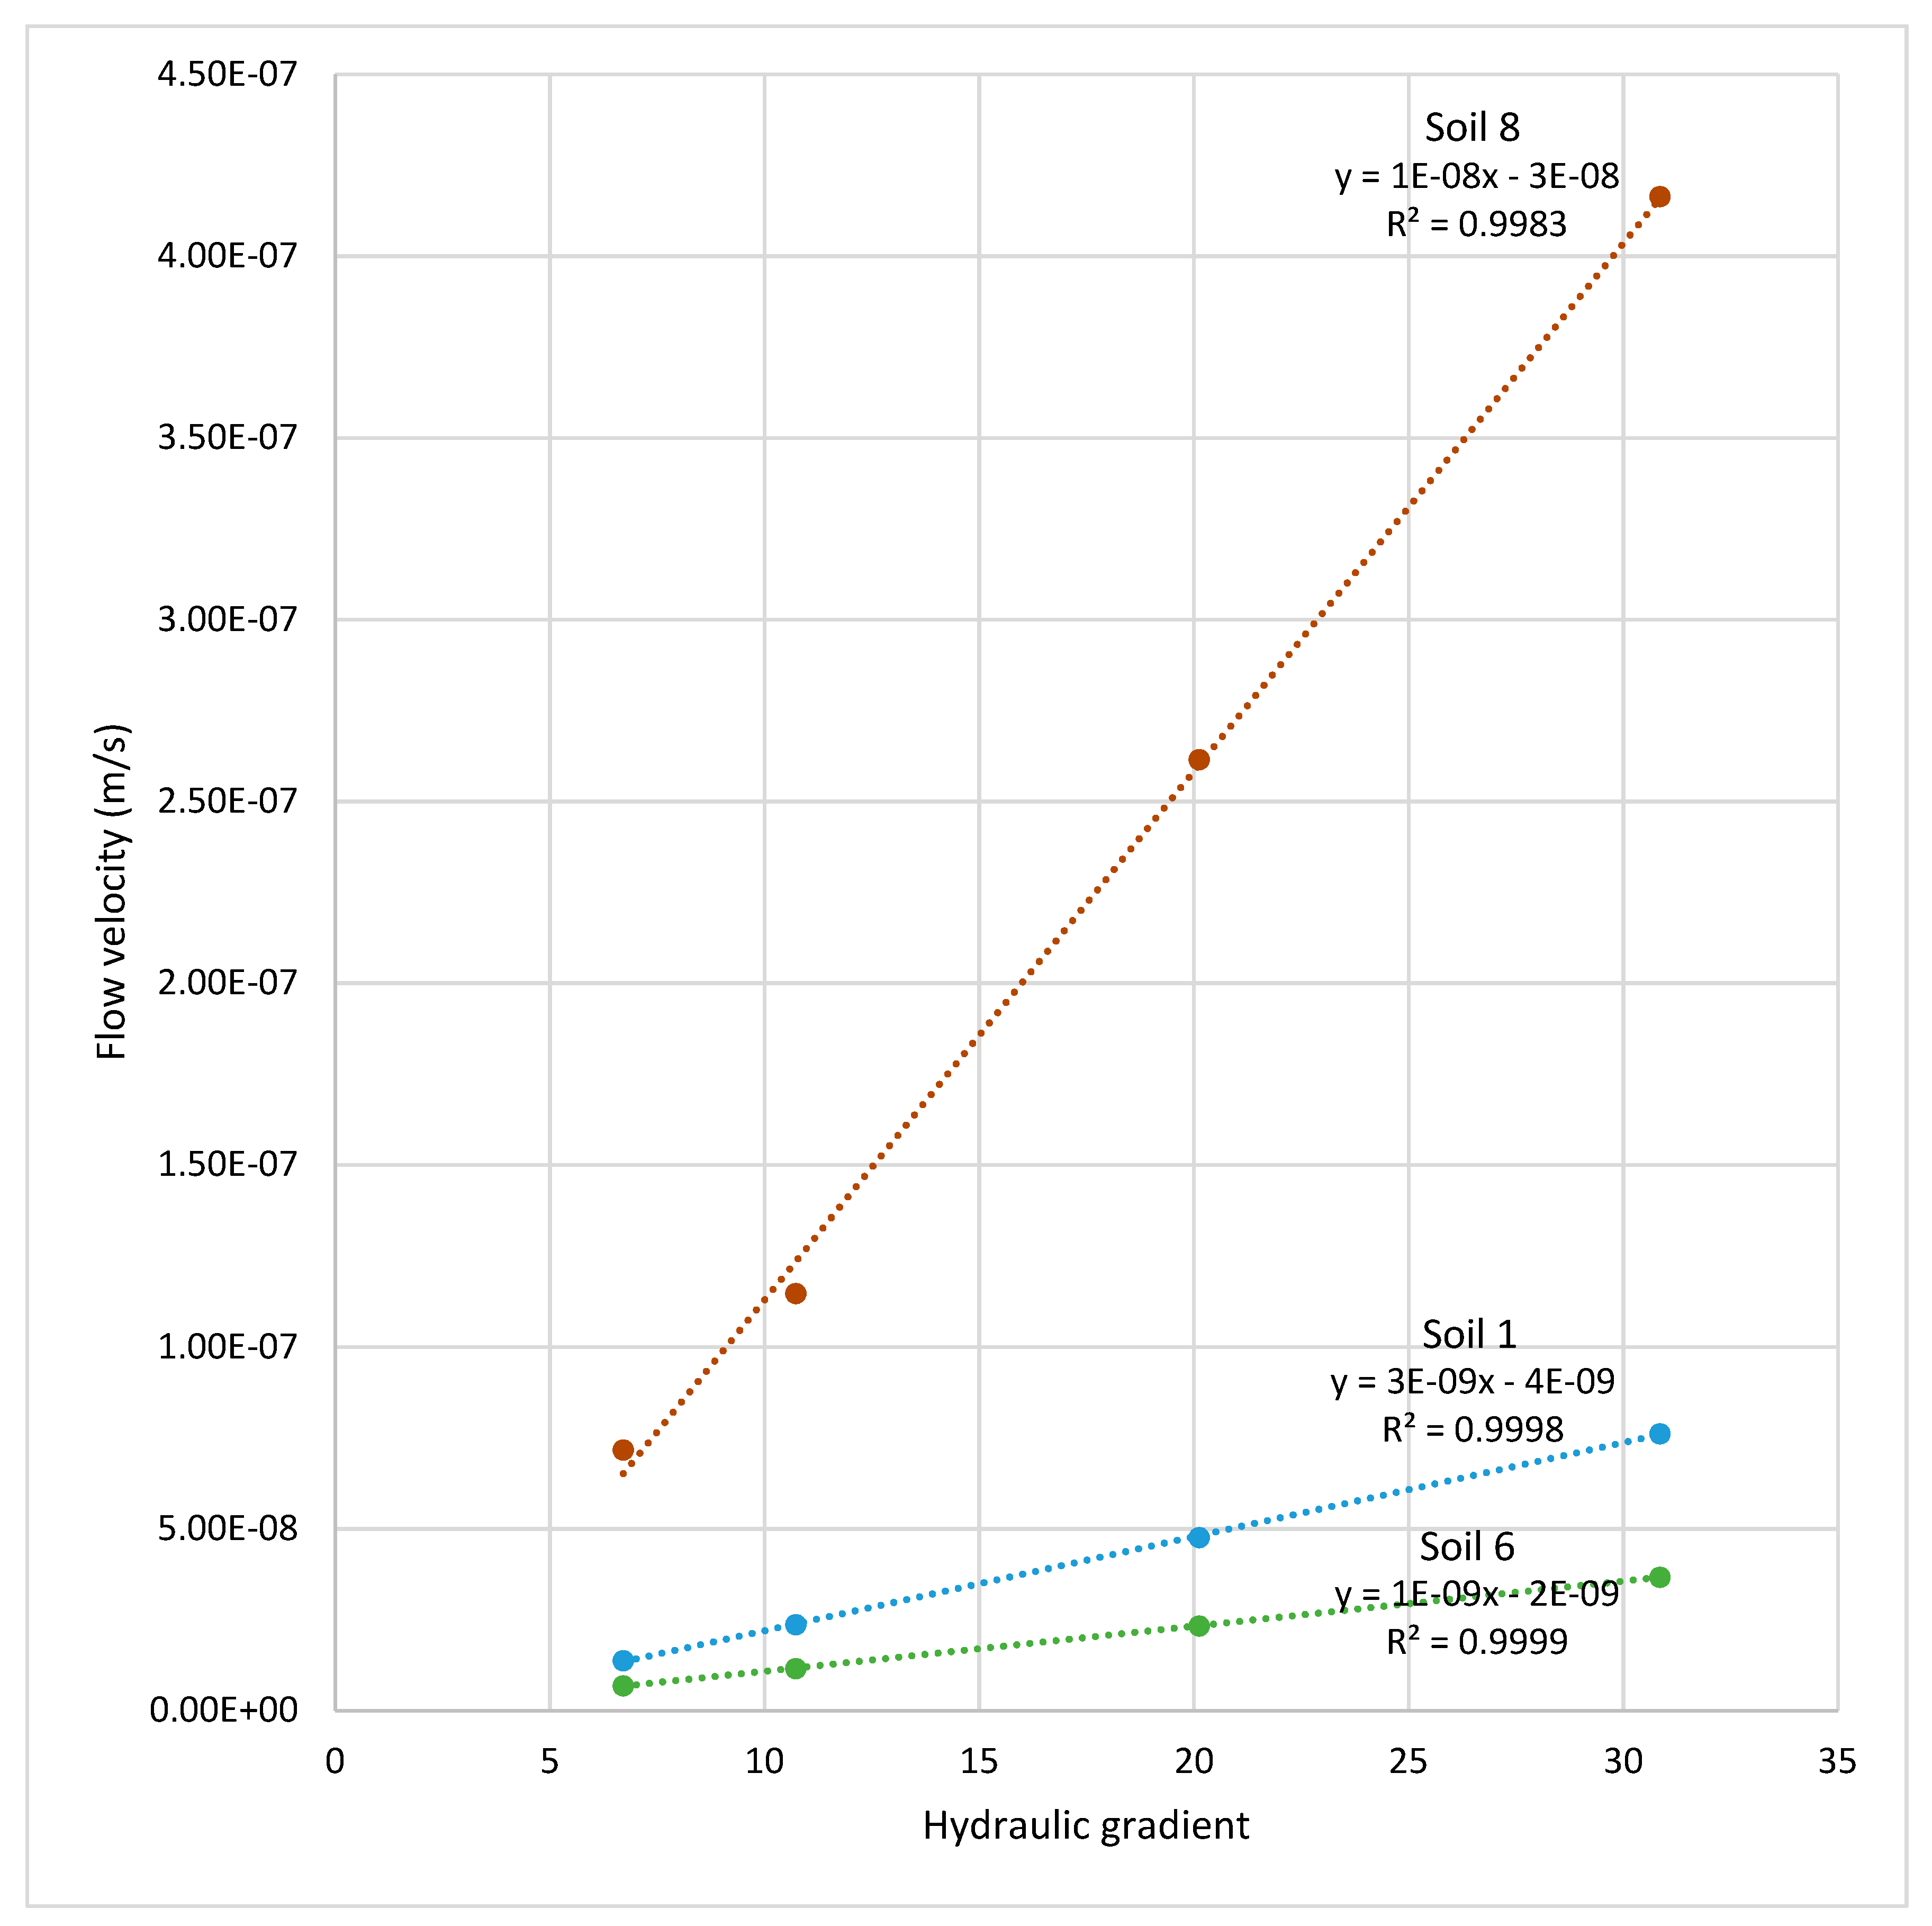
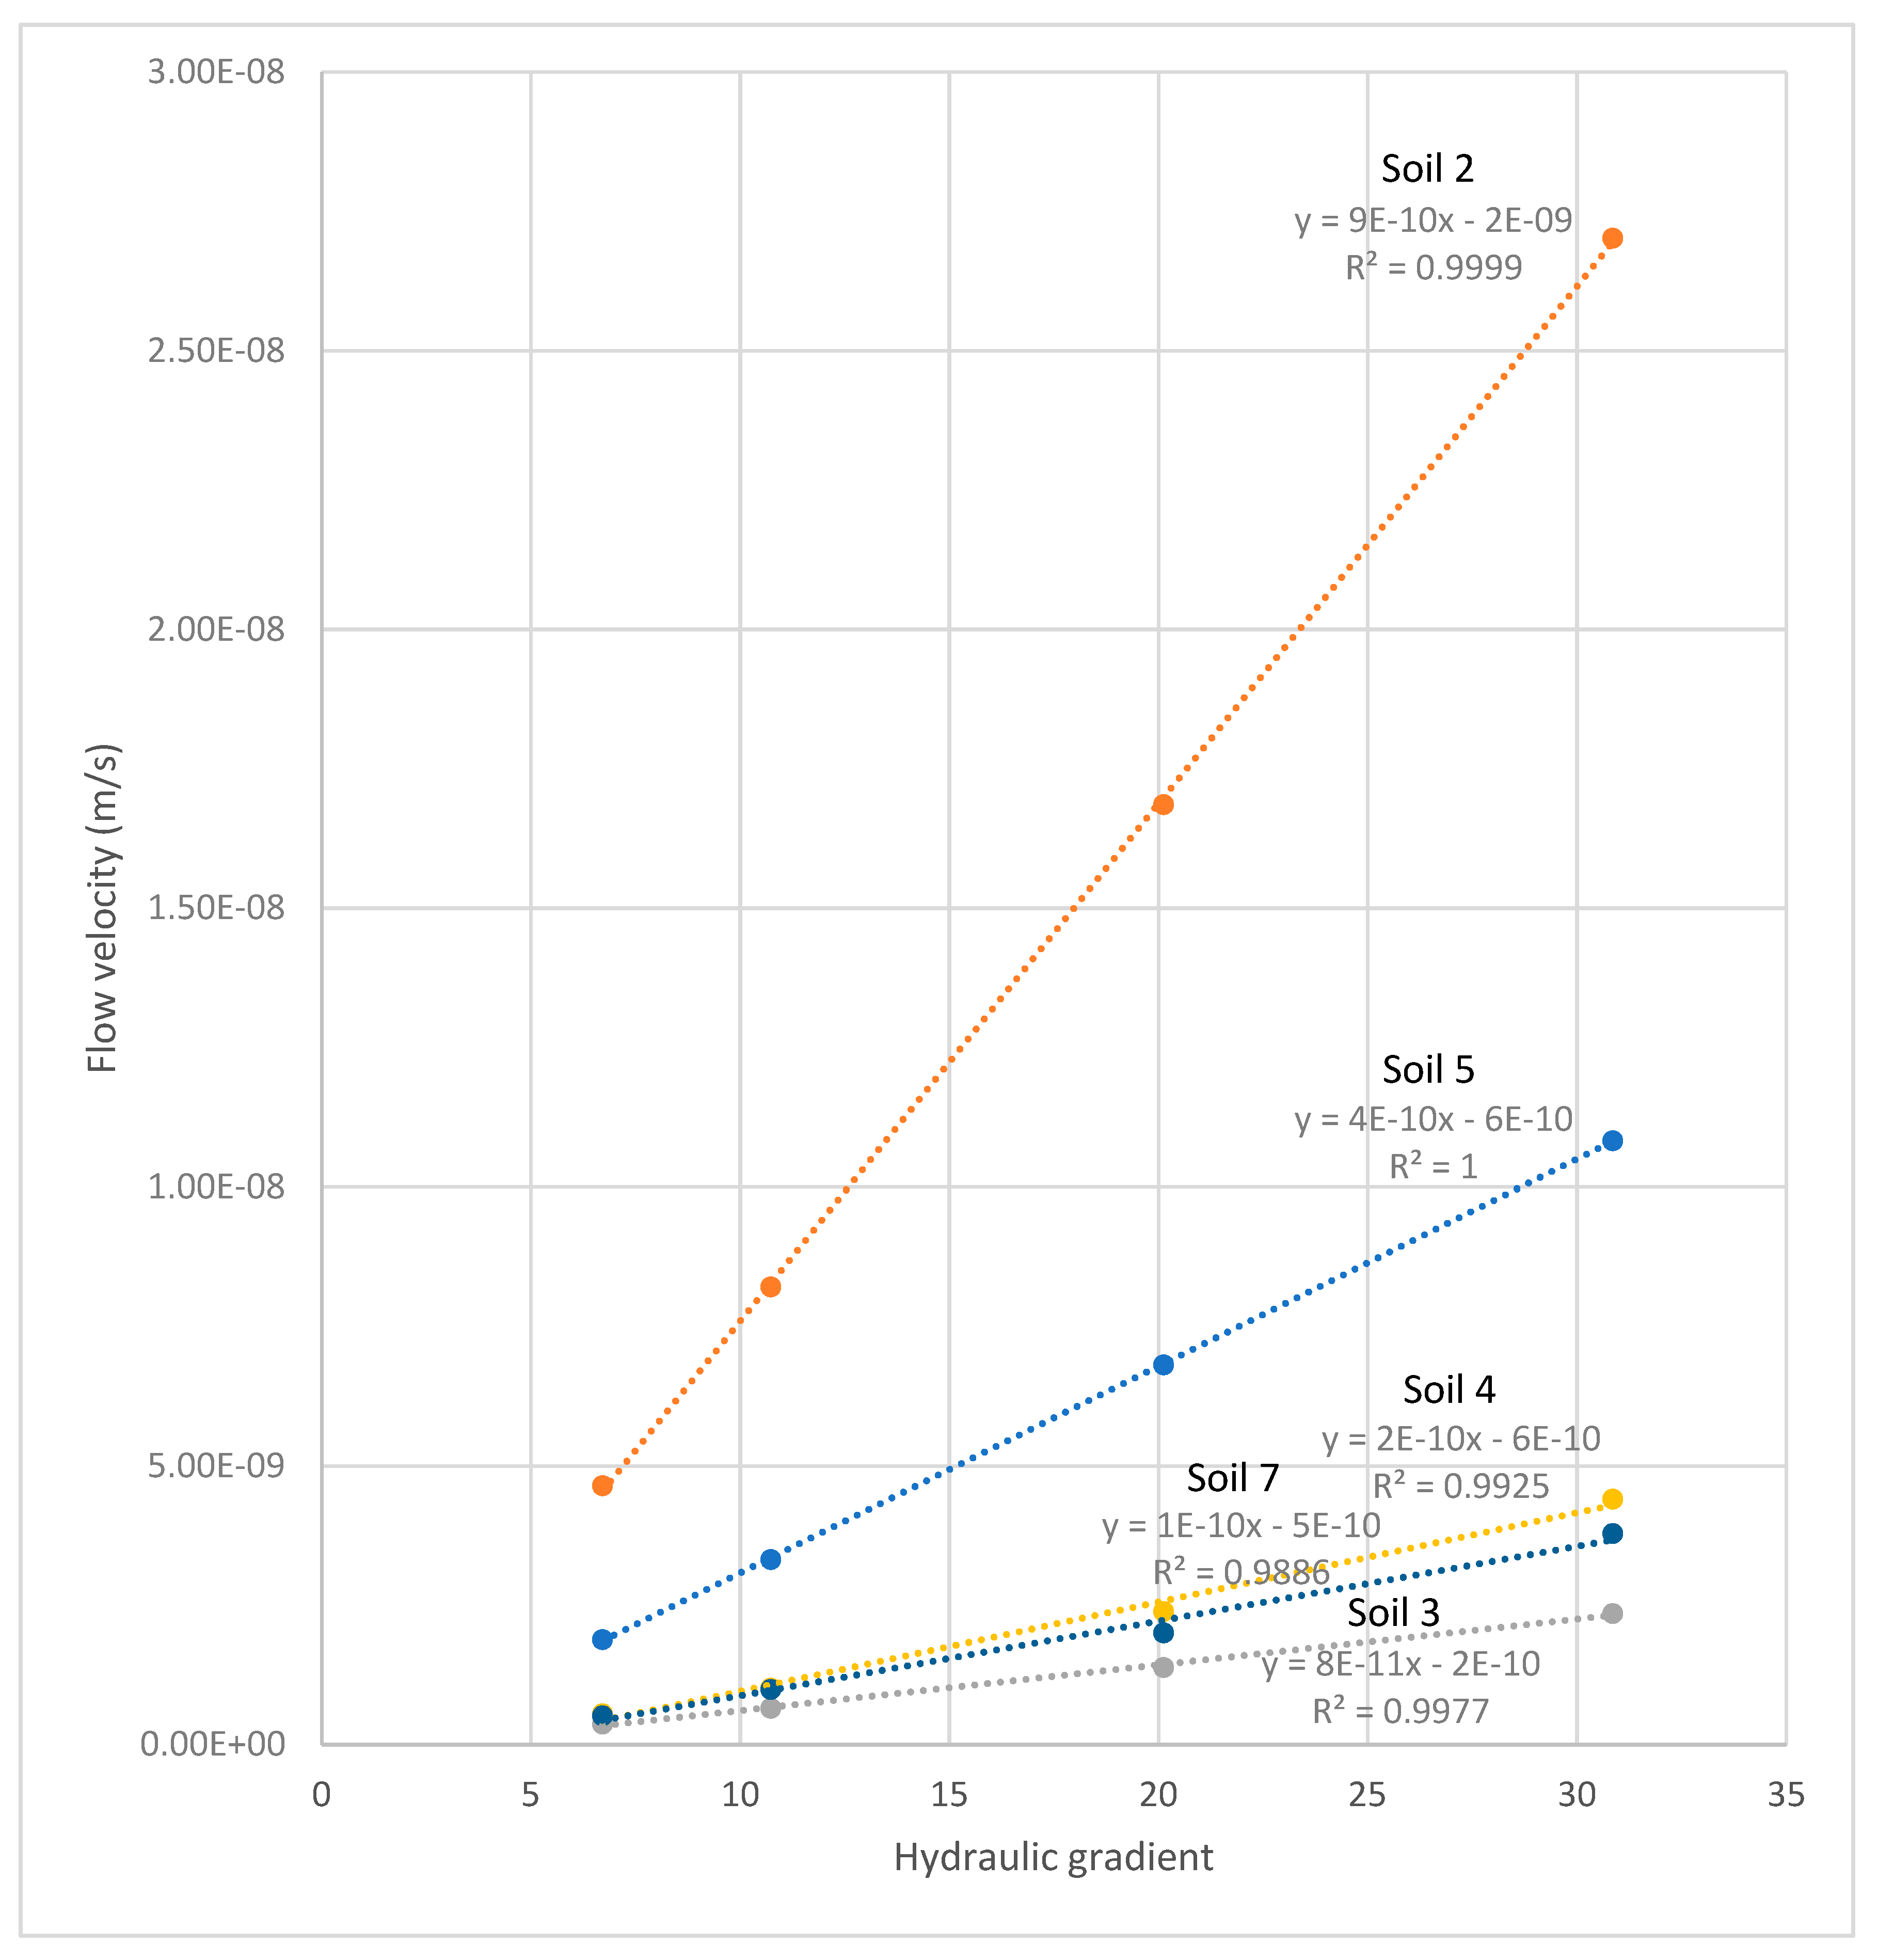
- It has been confirmed that Darcy’s law is not a fully precise description of the flow in poorly permeable soils, yet the linear dependence between flow velocity and hydraulic gradient is a good approximation of actual phenomena (R ≥ 0.99427). Statistical relationships have been found between physical and microstructural parameters and the permeability coefficient of poorly permeable soils.
- No significant correlations of the permeability coefficient with frequently used soil parameters describing relative amount of pores were found.
- The model with plasticity index IP turned out to be best fitted to experimental data.
- The structural parameters most correlated with the permeability coefficient are the average pores diameter DP (determined by the use of mercury intrusion porosimetry MIP) and convexity of silt particles Ψ2-50 (between 2 and 50 μm, determined by the use of dynamic image analysis DIA).
Author Contributions
Funding
Conflicts of Interest
References
- Hamdi, N.; Della, M.; Srasra, E. Experimental study of the permeability of clays from the potential sites for acid effluent storage. Elsevier 2005, 185, 523–534. [Google Scholar] [CrossRef]
- Rowe, R.K. Long-term performance of contaminant barrier systems. Geotechnique 2005, 55, 631–677. [Google Scholar] [CrossRef]
- Le, T.D.; Moyne, C.; Marcio, A.; Murad, M.A. A three-scale model for ionic solute transport in swelling clays incorporating ion–ion correlation effects. Adv. Water Resour. 2015, 75, 31–52. [Google Scholar] [CrossRef]
- Galán, E.; Aparicio, P. Experimental study on the role of clays as sealing materials in the geological storage of carbon dioxide. Appl. Clay Sci. 2014, 87, 22–27. [Google Scholar] [CrossRef]
- Montes, G.; Duplay, J.; Martinem, L.; Mendoza, C. Swelling-shrinkage kinetics of MX80 bentonite. Appl. Clay Sci. 2003, 22, 279–293. [Google Scholar] [CrossRef]
- Wang, C.C.; Juang, L.C.; Lee, C.K.; Hsu, T.C.; Lee, J.F. Effects of exchanged surfactant cations on the pore structure and adsorption characteristics of montmorillonite. J. Colloid Interface Sci. 2004, 280, 27–35. [Google Scholar] [CrossRef]
- Tao, Y.; Wen, X.D.; Li, J.; Yang, L. Theoretical and experimental investigations on the structures of purified clay and acid-activated clay. Appl. Surf. Sci. 2006, 252, 6154–6161. [Google Scholar]
- Bergaya, F.; Lagaly, G. Surface modification of clay minerals. Appl. Clay Sci. 2001, 19, 1–30. [Google Scholar] [CrossRef]
- Allen, A.R. Attenuation landfills—The Future in Landfilling. 2000. Available online: http://ros.edu.pl/images/roczniki/archive/pp_2000_017.pdf (accessed on 15 July 2019).
- Philip, L.-F.L.; Liggett, J.A. Boundary Solutions to Two Problems in Porous Media. J. Hydraul. Div. 1979, 105, 171–183. [Google Scholar]
- Berilgen, S.A.; Berilgen, M.M.; Ozaydin, I.K. Compression and permeability relationships in high water content clays. Appl. Clay Sci. 2006, 31, 249–261. [Google Scholar] [CrossRef]
- Romero, E.; Gens, A.; Lloret, A. Water permeability, water retention and microstructure of unsaturated compacted Boom clay. Eng. Geol. 1999, 54, 117–127. [Google Scholar] [CrossRef]
- Usyarov, O.G. Experimental study of small-scale spatial variation in filtration coefficient using tracer method. Colloid J. 2003, 65, 100–104. [Google Scholar] [CrossRef]
- Tuller, M.; Or, D. Hydraulic functions for swelling soils: Pore scale considerations, Soil Hydrological Properties and Processes and their Variability in Space and Time. J. Hydrol. 2003, 272, 50–71. [Google Scholar] [CrossRef]
- Carrier, W.D. Goodbye, Hazen; Hello, Kozeny-Carman. J. Geotech. Geoenviron. Eng. 2003, 129, 1054–1056. [Google Scholar] [CrossRef]
- Tavenas, F.; Jean, P.; Leblond, P.; Leroueil, S. The permeability of natural clays. Part II: Permeability characteristics. Can. Geotech. J. 1983, 20, 645–660. [Google Scholar] [CrossRef]
- Carrier, W.F.; Beckman, J.F. Correlation between index tests and the properties of remoulded clays. Geotechnique 1984, 34, 211–228. [Google Scholar] [CrossRef]
- Mesri, G.; Feng, T.W.; Ali, S.; Hayat, T.M. Permeability Characteristics of Soft Clays. In Proceedings of the 13th International Conference on Soil Mechanics and Foundation Engineering, New Delhi, India, 5–10 January 1994; pp. 187–192. [Google Scholar]
- Dolinar, B. Predicting the hydraulic conductivity of saturated clays using plasticity-value correlations. Appl. Clay Sci. 2009, 45, 90–94. [Google Scholar] [CrossRef]
- Nisihda, Y.; Nakagawa, S. Water permeability and plastic index of soils. Int. Assoc. Sci. Hydrol. 1970, 89, 573–578. [Google Scholar]
- PN-B-04481:1988. Building Soils. Tests of Soil Samples; ISO: Geneva, Switzerland, 1988.
- PN-EN ISO 14688. Geotechnical Investigation and Testing. Identification and Classification of Soil. Part 1, 2; ISO: Geneva, Switzerland, 2017.
- Wdowska, M.K.; Lipiński, M.J. Evaluation of Permeability of Man Made Soil by Means of Laboratory Tests. In Scientific Review Engineering and Environmental Studies of WAU; Warsaw University of Life Sciences: Warsaw, Poland, 2005; pp. 50–59. [Google Scholar]
- Head, K.H. Manual of Soil Laboratory Testing. Effective Stress Tests, 2nd ed.; John Wiley & Sons Ltd.: West Sussex, UK, 1998; Volume 3, pp. 40–60. [Google Scholar]
- Head, K.H.; Epps, R. Manual of Soil Laboratory Testing. Permeability, Shear Strength and Compressibility Test, 3rd ed.; Whittles Publishing: Caithness, UK, 2011; Volume 2, pp. 24–86. [Google Scholar]
- BS 1377: Part 6: 1990 British Standard Methods of Test for Soils for Civil Engineering Purposes. Part 6. Consolidation and Permeability Tests in Hydraulic Cells and with Pore Pressure Measurement; British Standards Institution: London, UK, 1990.
- BS 1377: Part 8: 1990 British Standard Methods of Test for Soils for Civil Engineering Purposes. Part 8. Shear Strength Tests (Effective Stress); British Standards Institution: London, UK; John Wiley & Sons, Ltd.: Hoboken, NJ, USA, 2001.
- PKN-CEN ISO/TS 17892-9. Geotechnical Investigation and Testing. Laboratory Testing of Soil. Part 9: Consolidated Triaxial Compression Tests on Water-Saturated Soils; ISO: Geneva, Switzerland, 2009.
- PKN-CEN ISO/TS 17892-11. Geotechnical Investigation and Testing. Laboratory Testing of Soil. Part 11: Determination of Permeability by Constant and Falling Head; ISO: Geneva, Switzerland, 2009.
- Carpenter, G.W.; Stephenson, R.W. Permeability testing in the triaxial cell. Geotech. Test. J. 1986, 9, 3–9. [Google Scholar]
- Skempton, A.W. The pore pressure coefficients A and B. Can. Geotech. J. 1954, 4, 143–147. [Google Scholar] [CrossRef]
- Olson, E. Particle Shape Factors and Their Use in Image Analysis–Part 1: Theory. J. GXP Compliance 2011, 15, 85–96. [Google Scholar]
- Rotenberg, B.; Marry, V.; Salanne, M.; Jardat, M.; Turq, P. Multiscale modelling of transport in clays from the molecular to the sample scale. C. R. Geosci. 2014, 346, 298–306. [Google Scholar] [CrossRef]


| Parameter | Method | Soil 1 | Soil 2 | Soil 3 | Soil 4 | Soil 5 | Soil 6 | Soil 7 | Soil 8 |
|---|---|---|---|---|---|---|---|---|---|
| Bulk density ρ, (t/m3) | ring | 2.09 | 2.08 | 1.97 | 2.11 | 1.89 | 2.06 | 2.17 | 2.04 |
| Dry density ρd, (t/m3) | calculations | 1.74 | 1.67 | 1.40 | 1.85 | 1.37 | 1.54 | 1.39 | 1.73 |
| Specific gravity Gs | pycnometer | 2.59 | 2.62 | 2.56 | 2.66 | 2.54 | 2.68 | 2.67 | 2.67 |
| Porosity ncalc, (-) | calculations | 0.33 | 0.36 | 0.45 | 0.31 | 0.46 | 0.43 | 0.48 | 0.35 |
| Void ratio ecalc, (-) | calculations | 0.49 | 0.57 | 0.83 | 0.44 | 0.85 | 0.74 | 0.92 | 0.54 |
| Saturated void ratio esat, (-) | calculations | 1.84 | 3.07 | 4.12 | 2.91 | 4.24 | 3.96 | 3.84 | 1.85 |
| Water content, (%) | dryer-balance | 19.8 | 25.0 | 40.8 | 14.2 | 37.5 | 33.5 | 56.0 | 18.0 |
| Saturated water content wsat, (%) | dryer-balance | 129 | 224 | 294 | 209 | 290 | 280 | 294 | 118 |
| Plastic limit wP, (%) | rolling | 13.50 | 14.04 | 19.78 | 10.27 | 34.80 | 15.27 | 15.50 | 15.39 |
| Liquid limit wL, (%) | Casagrande | 21.87 | 29.30 | 64.21 | 26.37 | 62.55 | 35.82 | 71.34 | 20.22 |
| Plasticity index IP, (%) | calculation | 8.4 | 15.3 | 44.4 | 16.1 | 27.8 | 20.6 | 55.8 | 4.8 |
| Colloidal activity, (-) | calculations | 0.93 | 1.09 | 1.23 | 1.24 | 0.51 | 0.89 | 1.36 | 0.69 |
| Organic matter content, (%) | roasting | 1.39 | 1.99 | 4.45 | 2.31 | 0.00 | 4.29 | 2.74 | 1.7 |
| Content of fraction fi < 2 μm, (%) | hydrometric | 9.00 | 14.00 | 36.00 | 13.00 | 54.00 | 23.00 | 41.00 | 7.00 |
| Content of fraction 2 < fπ < 50 μm, (%) | hydrometric | 27.00 | 28.00 | 48.00 | 46.00 | 46.00 | 52.50 | 48.00 | 66.00 |
| Content of fraction 50 < fp < 2000 μm, (%) | hydrometric | 62.00 | 57.80 | 16.00 | 39.50 | 0.00 | 24.00 | 11.00 | 26.00 |
| Content of fraction fi < 2 μm, (%) | laser diffraction | 6.71 | 6.38 | 15.19 | 10.01 | 25.51 | 17.06 | 26.29 | 5.79 |
| Content of fraction 2 < fπ < 50 μm, (%) | laser diffraction | 24.48 | 33.10 | 57.06 | 37.68 | 74.47 | 46.70 | 55.98 | 70.97 |
| Content of fraction 50 < fp < 2000 μm, (%) | laser diffraction | 67.07 | 60.06 | 27.76 | 50.35 | 0.02 | 35.77 | 17.61 | 23.24 |
| Parameter | Method | Soil 1 | Soil 2 | Soil 3 | Soil 4 | Soil 5 | Soil 6 | Soil 7 | Soil 8 |
|---|---|---|---|---|---|---|---|---|---|
| Void ratio, (-) | MIP | 0.341 | 0.265 | 0.224 | 0.367 | 0.749 | 0.156 | 0.142 | 0.591 |
| Porosity, (-) | MIP | 0.254 | 0.210 | 0.183 | 0.268 | 0.428 | 0.135 | 0.124 | 0.372 |
| Content of pores P < 3 nm, (%) | MIP | 0.00 | 0.00 | 0.00 | 0.00 | 0.00 | 0.00 | 0.00 | 0.00 |
| Content of pores 3 < P < 10 nm, (%) | MIP | 4.66 | 2.13 | 12.08 | 4.71 | 1.11 | 41.75 | 41.04 | 0.38 |
| Content of pores P > 10 nm, (%) | MIP | 95.34 | 97.87 | 87.92 | 95.29 | 98.89 | 58.25 | 58.96 | 99.62 |
| Volume of intrusions V, (mL/g) | MIP | 0.13 | 0.10 | 0.08 | 0.14 | 0.29 | 0.06 | 0.05 | 0.22 |
| Mean pore diameter D, (nm) | MIP | 137 | 125 | 41.4 | 113 | 69.6 | 15 | 14.8 | 404 |
| Sphericity of particles, (-) | DIA | 0.859 | 0.852 | 0.87 | 0.858 | 0.809 | 0.837 | 0.854 | 0.862 |
| Aspect ratio of particles, (-) | DIA | 0.715 | 0.697 | 0.702 | 0.7 | 0.647 | 0.689 | 0.723 | 0.683 |
| Convexity of particles, (-) | DIA | 0.893 | 0.894 | 0.866 | 0.898 | 0.851 | 0.891 | 0.901 | 0.88 |
| Specific surface area for fraction fi < 2 μm, (cm2/cm3) | LD | 0.410 | 0.408 | 1.006 | 0.626 | 1.547 | 1.153 | 1.617 | 0.432 |
| Specific surface area for fraction 2 < fπ < 50 μm, (cm2/cm3) | LD | 0.244 | 0.260 | 0.558 | 0.382 | 0.913 | 0.515 | 0.707 | 0.275 |
| Soil No. | i (-) | V (m/s) | Values k for Individual Tests | Mean k (m/s) | Mean of the Means k (m/s) | ||
|---|---|---|---|---|---|---|---|
| Soil no. 1 | 6.71 | 4.65 × 10⁻⁹ | 2.06 × 10⁻⁹ | 2.17 × 10⁻⁹ | 1.92 × 10⁻⁹ | 2.05 × 10⁻⁹ | 2.27 × 10⁻⁹ |
| 10.73 | 8.22 × 10⁻⁹ | 2.32 × 10⁻⁹ | 2.05 × 10⁻⁹ | 2.27 × 10⁻⁹ | 2.21 × 10⁻⁹ | ||
| 20.12 | 1.69 × 10⁻⁸ | 2.19 × 10⁻⁹ | 2.48 × 10⁻⁹ | 2.43 × 10⁻⁹ | 2.37 × 10⁻⁹ | ||
| 30.85 | 2.70 × 10⁻⁸ | 2.39 × 10⁻⁹ | 2.29 × 10⁻⁹ | 2.72 × 10⁻⁹ | 2.47 × 10⁻⁹ | ||
| Soil no. 2 | 6.71 | 3.77 × 10⁻¹⁰ | 6.48 × 10⁻¹⁰ | 7.40 × 10⁻¹⁰ | 6.90 × 10⁻¹⁰ | 6.93 × 10⁻¹⁰ | 7.93 × 10⁻¹⁰ |
| 10.73 | 6.59 × 10⁻¹⁰ | 7.94 × 10⁻¹⁰ | 6.98 × 10⁻¹⁰ | 8.05 × 10⁻¹⁰ | 7.66 × 10⁻¹⁰ | ||
| 20.12 | 1.39 × 10⁻⁹ | 8.09 × 10⁻¹⁰ | 8.48 × 10⁻¹⁰ | 8.57 × 10⁻¹⁰ | 8.38 × 10⁻¹⁰ | ||
| 30.85 | 2.36 × 10⁻⁹ | 8.19 × 10⁻¹⁰ | 8.96 × 10⁻¹⁰ | 9.12 × 10⁻¹⁰ | 8.76 × 10⁻¹⁰ | ||
| Soil no. 3 | 6.71 | 5.62 × 10⁻¹⁰ | 5.69 × 10⁻¹¹ | 6.08 × 10⁻¹¹ | 5.10 × 10⁻¹¹ | 5.62 × 10⁻¹¹ | 6.58 × 10⁻¹¹ |
| 10.73 | 1.02 × 10⁻⁹ | 6.28 × 10⁻¹¹ | 6.53 × 10⁻¹¹ | 5.62 × 10⁻¹¹ | 6.14 × 10⁻¹¹ | ||
| 20.12 | 2.39 × 10⁻⁹ | 6.21 × 10⁻¹¹ | 7.45 × 10⁻¹¹ | 7.05 × 10⁻¹¹ | 6.90 × 10⁻¹¹ | ||
| 30.85 | 4.41 × 10⁻⁹ | 7.02 × 10⁻¹¹ | 8.41 × 10⁻¹¹ | 7.48 × 10⁻¹¹ | 7.64 × 10⁻¹¹ | ||
| Soil no. 4 | 6.71 | 1.89 × 10⁻⁹ | 7.88 × 10⁻¹¹ | 9.01 × 10⁻¹¹ | 8.25 × 10⁻¹¹ | 8.38 × 10⁻¹¹ | 8.94 × 10⁻¹¹ |
| 10.73 | 3.33 × 10⁻⁹ | 8.68 × 10⁻¹¹ | 1.063 × 10⁻¹⁰ | 9.22 × 10⁻¹¹ | 9.51 × 10⁻¹¹ | ||
| 20.12 | 6.82 × 10⁻⁹ | 1.28 × 10⁻¹⁰ | 1.30 × 10⁻¹⁰ | 9.9 × 10⁻¹¹ | 1.19 × 10⁻¹⁰ | ||
| 30.85 | 1.08 × 10⁻⁸ | 1.35 × 10⁻¹⁰ | 1.63 × 10⁻¹⁰ | 1.31 × 10⁻¹⁰ | 1.43 × 10⁻¹⁰ | ||
| Soil no. 5 | 6.71 | 6.84 × 10⁻⁹ | 2.91 × 10⁻¹⁰ | 2.84 × 10⁻¹⁰ | 2.72 × 10⁻¹⁰ | 2.82 × 10⁻¹⁰ | 3.21 × 10⁻¹⁰ |
| 10.73 | 1.16 × 10⁻⁸ | 3.10 × 10⁻¹⁰ | 3.19 × 10⁻¹⁰ | 3.02 × 10⁻¹⁰ | 3.10 × 10⁻¹⁰ | ||
| 20.12 | 2.33 × 10⁻⁸ | 3.31 × 10⁻¹⁰ | 3.54 × 10⁻¹⁰ | 3.32 × 10⁻¹⁰ | 3.39 × 10⁻¹⁰ | ||
| 30.85 | 3.67 × 10⁻⁸ | 3.59 × 10⁻¹⁰ | 3.54 × 10⁻¹⁰ | 3.40 × 10⁻¹⁰ | 3.51 × 10⁻¹⁰ | ||
| Soil no. 6 | 6.71 | 5.23 × 10⁻¹⁰ | 1.04 × 10⁻⁹ | 1.06 × 10⁻⁹ | 9.6 × 10⁻¹⁰ | 1.02 × 10⁻⁹ | 1.11 × 10⁻⁹ |
| 10.73 | 9.95 × 10⁻¹⁰ | 1.06 × 10⁻⁹ | 1.15 × 10⁻⁹ | 1.03 × 10⁻⁹ | 1.08 × 10⁻⁹ | ||
| 20.12 | 2.01 × 10⁻⁹ | 1.18 × 10⁻⁹ | 1.21 × 10⁻⁹ | 1.09 × 10⁻⁹ | 1.16 × 10⁻⁹ | ||
| 30.85 | 3.79 × 10⁻⁹ | 1.17 × 10⁻⁹ | 1.26 × 10⁻⁹ | 1.14 × 10⁻⁹ | 1.19 × 10⁻⁹ | ||
| Soil no. 7 | 6.71 | 7.18 × 10⁻⁸ | 7.69 × 10⁻¹¹ | 8.18 × 10⁻¹¹ | 7.51 × 10⁻¹¹ | 7.79 × 10⁻¹¹ | 9.84 × 10⁻¹¹ |
| 10.73 | 1.15 × 10⁻⁷ | 9.30 × 10⁻¹¹ | 9.62 × 10⁻¹¹ | 8.89 × 10⁻¹¹ | 9.27 × 10⁻¹¹ | ||
| 20.12 | 2.62 × 10⁻⁷ | 1.02 × 10⁻¹⁰ | 1.06 × 10⁻¹⁰ | 9.3 × 10⁻¹⁰ | 1.00 × 10⁻¹⁰ | ||
| 30.85 | 4.16 × 10⁻⁷ | 1.20 × 10⁻¹⁰ | 1.31 × 10⁻¹⁰ | 1.18 × 10⁻¹⁰ | 1.23 × 10⁻¹⁰ | ||
| Soil no. 8 | 6.71 | 7.18 × 10⁻⁸ | 9.1 × 10⁻⁹ | 1.15 × 10⁻⁸ | 1.06 × 10⁻⁸ | 1.07 × 10⁻⁸ | 1.20 × 10⁻⁸ |
| 10.73 | 1.15 × 10⁻⁷ | 1.04 × 10⁻⁸ | 1.16 × 10⁻⁸ | 1.01 × 10⁻⁸ | 1.07 × 10⁻⁸ | ||
| 20.12 | 2.62 × 10⁻⁷ | 1.26 × 10⁻⁸ | 1.24 × 10⁻⁸ | 1.40 × 10⁻⁸ | 1.30 × 10⁻⁸ | ||
| 30.85 | 4.16 × 10⁻⁷ | 1.29 × 10⁻⁸ | 1.44 × 10⁻⁸ | 1.23 × 10⁻⁸ | 1.35 × 10⁻⁸ | ||
| Classifying Predictor | Degrees of Freedom | F | P | Partial η2 | Observed Power (α = 0.05) |
|---|---|---|---|---|---|
| soil | 7 | 1482.217 | 0.000000 | 0.993869 | 1.000000 |
| hydraulic gradient | 3 | 10.241 | 0.000013 | 0.324347 | 0.997706 |
| soil + hydr. gradient | 21 | 59.02 | 0.000000 | 0.659452 | 1.000000 |
| Soil | Model | Residuals | F Ratio | R | p Value | ||
|---|---|---|---|---|---|---|---|
| SS | MS | SS | MS | ||||
| Sum of Squares | Mean Squares | Sum of Squares | Mean Squares | ||||
| No. 1 | 2.32 × 10⁻¹⁵ | 2.32 × 10⁻¹⁵ | 4.10 × 10⁻¹⁹ | 2.05 × 10⁻¹⁹ | 11,327.9 | 0.99991 | 0.00009 |
| No. 2 | 2.98 × 10⁻¹⁶ | 2.98 × 10⁻¹⁶ | 3.69 × 10⁻²⁰ | 1.84 × 10⁻²⁰ | 16,197.9 | 0.99994 | 0.00006 |
| No. 3 | 2.34 × 10⁻¹⁸ | 2.34 × 10⁻¹⁸ | 5.49 × 10⁻²¹ | 2.74 × 10⁻²¹ | 852.08 | 0.99883 | 0.00117 |
| No. 4 | 8.89 × 10⁻¹⁸ | 8.89 × 10⁻¹⁸ | 6.73 × 10⁻²⁰ | 3.36 × 10⁻²⁰ | 264.35 | 0.99624 | 0.00376 |
| No. 5 | 4.77 × 10⁻¹⁷ | 4.77 × 10⁻¹⁷ | 2.02 × 10⁻²¹ | 1.01 × 10⁻²¹ | 47,252.6 | 0.99998 | 0.00002 |
| No. 6 | 5.34 × 10⁻¹⁶ | 5.34 × 10⁻¹⁶ | 3.15 × 10⁻²⁰ | 1.57 × 10⁻²⁰ | 33,909.4 | 0.99997 | 0.00003 |
| No. 7 | 6.23 × 10⁻¹⁸ | 6.23 × 10⁻¹⁸ | 7.20 × 10⁻²⁰ | 3.60 × 10⁻²⁰ | 172.90 | 0.99427 | 0.00573 |
| No. 8 | 7.32 × 10⁻¹⁴ | 7.32 × 10⁻¹⁴ | 1.24 × 10⁻¹⁶ | 6.18 × 10⁻¹⁷ | 1185.00 | 0.99916 | 0.00084 |
| Parameter Type | Parameter | Correlation Coefficient with k |
|---|---|---|
| physical | plastic limit wP | −0.146703 |
| physical | liquid limit by use of Casagrande’s method wLC | −0.504481 |
| physical | liquid limit by use of cone penetrometer method wLp | −0.501565 |
| physical | plasticity index Ip = wLC − wp | −0.535338 |
| physical | colloidal activity IA | −0.461156 |
| physical | clay fraction by use of hydrometer method CF′ | −0.499554 |
| physical | silt fraction by use of hydrometer method SF′ | 0.568840 |
| physical | reduced clay fraction by use of hydrometer method CF′ | −0.500901 |
| physical | reduced silt fraction by use of hydrometer method SF′ | 0.579682 |
| physical | calculated porosity ncalc | 0.160608 |
| physical | calculated void ratio ecalc | 0.140694 |
| physical | sorption moisture at p/p0 = 0.95 w95 | −0.514057 |
| structural | pore size median by MIP Mp | 0.616287 |
| structural | average pore diameter Dp | 0.941742 |
| structural | porosity by use of MIP nHg | 0.456891 |
| structural | void ratio by use of MIP eHg | 0.430623 |
| structural | minimum pore circumference by use of NIA Omin | 0.604273 |
| structural | particle shape proportionality coefficient for silt fraction ψa2-50 | −0.597394 |
| structural | convexity particles for silt fraction ψc2-50 | 0.630566 |
| structural | convexity of particles for sand fraction ψc50-2000 | −0.735984 |
| Function Type | Correlation Coefficient with Parameter | ||||||||
|---|---|---|---|---|---|---|---|---|---|
| wp | wLC | Ip | A | CF′ | SF′ | ncalc | ecalc | w95 | |
| power | 0.081 | 0.899 | 0.995 | 0.315 | 0.992 | 0.459 | 0.000 | 0.133 | 0.396 |
| logarithmic | 0.105 | 0.580 | 0.763 | 0.416 | 0.648 | 0.449 | 0.179 | 0.171 | 0.638 |
| exponential | 0.125 | 0.987 | 0.992 | 0.381 | 0.992 | 0.974 | 0.124 | 0.107 | 0.989 |
| Function Type | Correlation Coefficient with Parameter | ||||||
|---|---|---|---|---|---|---|---|
| Mp | Dp | nHg | eHg | Omin | ψc2–50 | ψc50–2000 | |
| power | 0.642 | 0.988 | 0.437 | 0.418 | 0.599 | 0.986 | 0.211 |
| logarithmic | 0.475 | 0.659 | 0.451 | 0.452 | 0.599 | 0.621 | 0.739 |
| exponential | 0.475 | 0.475 | 0.394 | 0.345 | 0.599 | 0.364 | 0.130 |
| Parameter Type | Function Type | Estimator | Statistical Significance p | Lower Limit of Confidence Interval | Upper Limit of Confidence Interval | ||
|---|---|---|---|---|---|---|---|
| physical | Ip | P | a1 | 1.48 × 10⁻⁶ | 0.00000 | 1.48 × 10⁻⁶ | 1.48 × 10⁻⁶ |
| a2 | −2.93561 | 0.00000 | −3.63508 | −2.23613 | |||
| CF′ | P | a1 | 0.00217 | 0.57022 | −0.00668 | 0.01103 | |
| a2 | −6.19169 | 0.00033 | −8.26441 | −4.11896 | |||
| w95 | E | a1 | 0.00002 | 0.41886 | −0.00003 | 0.00006 | |
| a2 | −3.83447 | 0.00078 | −5.33666 | −2.33229 | |||
| wLC | E | a1 | 0.07439 | 0.69346 | −0.36561 | 0.51439 | |
| a2 | −0.77539 | 0.00143 | −1.11689 | −0.43389 | |||
| SF′ | E | a1 | 3.69 × 10⁻¹⁴ | 0.00000 | 3.69 × 10⁻¹⁴ | 3.69 × 10⁻¹⁴ | |
| a2 | 0.19324 | 0.00000 | 4.71 × 10⁻² | 0.33935 | |||
| structural | Dp | P | a1 | 2.09 × 10⁻⁹ | 0.00000 | 2.09 × 10⁻¹³ | 2.09 × 10⁻¹³ |
| a2 | 1.85356 | 0.00000 | 1.28509 | 2.42203 | |||
| ψc2−50 | P | a1 | 4.88 × 10⁻¹⁹ | 0.00000 | 4.88 × 10⁻¹⁹ | 4.88 × 10⁻¹⁹ | |
| a2 | −2.04 × 10⁻² | 0.00000 | −2.04 × 10⁻² | −2.04 × 10⁻² | |||
| Model | MAE (m/s) | RMSE (m/s) | MAPE (%) |
|---|---|---|---|
| Equation (9) | 3.17 × 10⁻¹⁰ | 4.35 × 10⁻¹⁰ | 68.56 |
| Equation (10) | 5.66 × 10⁻¹⁰ | 7.03 × 10⁻¹⁰ | 150.41 |
| Equation (11) | 7.64 × 10⁻¹⁰ | 9.77 × 10⁻¹⁰ | 338.32 |
| Equation (12) | 1.64 × 10⁻⁹ | 3.59 × 10⁻⁹ | 51.68 |
| Equation (13) | 4.27 × 10⁻⁹ | 4.88 × 10⁻⁹ | 59.35 |
© 2019 by the authors. Licensee MDPI, Basel, Switzerland. This article is an open access article distributed under the terms and conditions of the Creative Commons Attribution (CC BY) license (http://creativecommons.org/licenses/by/4.0/).
Share and Cite
Kozlowski, T.; Ludynia, A. Permeability Coefficient of Low Permeable Soils as a Single-Variable Function of Soil Parameter. Water 2019, 11, 2500. https://doi.org/10.3390/w11122500
Kozlowski T, Ludynia A. Permeability Coefficient of Low Permeable Soils as a Single-Variable Function of Soil Parameter. Water. 2019; 11(12):2500. https://doi.org/10.3390/w11122500
Chicago/Turabian StyleKozlowski, Tomasz, and Agata Ludynia. 2019. "Permeability Coefficient of Low Permeable Soils as a Single-Variable Function of Soil Parameter" Water 11, no. 12: 2500. https://doi.org/10.3390/w11122500
APA StyleKozlowski, T., & Ludynia, A. (2019). Permeability Coefficient of Low Permeable Soils as a Single-Variable Function of Soil Parameter. Water, 11(12), 2500. https://doi.org/10.3390/w11122500