Abstract
Mongolia is a semi-arid, highly continental region with highly variable precipitation and river discharge. The groundwater aquifer located near Ulaanbaatar, the capital city of Mongolia, is the only one source for city water supply consumption, and it is important to ensure that groundwater is available now and in the future. The main watercourse near the capital city is the Tuul River, fed by precipitation in the Khentii Mountains. The semi-arid and cold environment shows high variability in precipitation and river discharge. However, due to absence of precipitation in winter and spring, the riverbed usually runs dry during these times of the year, and weather observations show that the dry period has been extending in recent years. However, in parallel with urban development, the extended groundwater aquifer has shown a clear decline, and the groundwater levels have dropped significantly. Therefore, a groundwater management system based on managed aquifer recharge is proposed, and a strategy to implement these measures in the Tuul River valley is presented in this paper. This strategy consists of the enhancement of natural recharge rates during the wet summer from the northern drainage canal, an additional increase in groundwater recharge through melting the ice storage in the dry period, as well as the construction of underground dams to accumulate groundwater and a surface water reservoir that releases a constant discharge in the outlet. To increase natural recharge rates of groundwater during the early dry period through the melting ice storage period, the MATLAB icing code, which was written for ice storage for limited and unlimited areas, was considered through finite element subsurface FLOW (FEFLOW) simulation scenarios as a water source in ice form on the surface. A study of the artificial permafrost of underground as an ice dam was processed in FEFLOW simulation scenarios for accumulating groundwater resources. The results of these artificial recharging methods were individually calculated, combined, and compared with the surface reservoir, which releases a constant discharge through the dam. In this paper, new ideas are presented involving managed aquifer recharge—MAR methods, and include application to aufeis, a mass of layered ice for groundwater recharge by melting. Additionally, the accumulation of groundwater using artificial permafrost is used as an underground dam. In addition, was considered recharging scenario only with constant release water amount from water reservoir also with all MAR methods together with reservoir combination.
1. Introduction
The Tuul River, which flows through Mongolia’s capital city Ulaanbaatar (UB), originates from the Khentii Mountains on the front side of the capital city. The water level of the Tuul River fluctuates according to an annual high-flow to low-flow cycle, with its average water flow of 26.6 m3/s [1].
This river also recharges the Ulaanbaatar and upper aquifers that provide the city’s water supply by 218 wells divided into nine groups of intake wells and 21 booster pump stations operated by a water supply agency. Daily domestic consumption fluctuates around 150–200 m3/day and depending on the four seasons; see Figure 1. The water supply agency estimates that another 130 × 103 m3/day of water is pumped from the aquifer in private wells by industries and individuals [2].
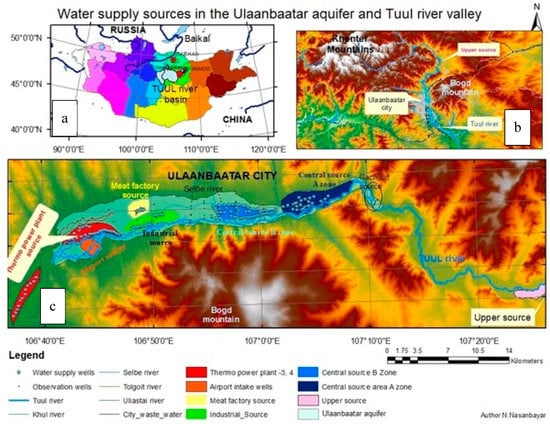
Figure 1.
Groundwater aquifer south side of Ulaanbaatar city. (a). Hydrological drainage basins of Mongolia, (b). origin of Tuul River, (c). Ulaanbaatar aquifer and wells.
The joint meeting of the Mongolian and Russian mineral resources commissions estimated the useful capacity of groundwater resources of Ulaanbaatar aquifer at 264 × 103 m3/day [3], without an upper source in the eastern side of the Ulaanbaatar aquifer (Figure 1), which pump groundwater around from 24 × 103 m3/day to 48 × 103 m3/day from aquifer [4].
As with natural recharge formation of groundwater resources, the main components are water entering in the aquifer as result of surface runoff loss and the capacitive reserves of the upper water-bearing layer. During the period from May to December, the aquifer takes recharge due to surface runoff loss. In this period, replenishment infiltrates from the surface water to capacitive reserves of the stored groundwater in the Ulaanbaatar aquifer [5].
In March and April, the groundwater table of water source aquifers decreases to minimum of 8 to 10 m from the surface, but it reaches maximum level of 2 m under the earth surface in the central area of the source in June, July, and August [6], see Figure 2. This table begins from a hydrological year where the wet season begins with melt water from snow and ice after a long, cold winter.
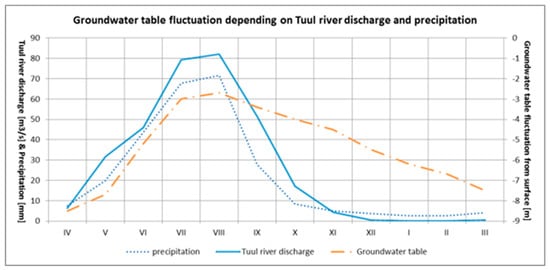
Figure 2.
Table of groundwater fluctuation depending on Tuul River flow.
Water demand increases day by day with the development of industries and increasing population growth, but groundwater resources have decreased due to the climate change and excess water usage. In the last decade, during spring (April and May), the dry period the Tuul River flow continues longer than one month after ice breakup [7].
The following Table 1 shows a calculated balance of the outflow and inflow at the Tuul River valley and Ulaanbaatar aquifer, which is used for the water supply of the city. The Tuul River and tributaries discharge was taken as the inflow rate, precipitation, and evaporation volume averaged over many years. The average discharge amounts over the last ten years of Tuul River was taken as inflow including other inflow sources as surface water from the Selbe, Uliastai, and Khul Rivers they flow to the Tuul River through aquifer for water supply of Ulaanbaatar city.

Table 1.
Ulaanbaatar city water exploration volume balance for water supply.
The balance rate between surface water as inflow including precipitation and city consumption was estimated as following: from total inflow subtracted total pumped groundwater and added reused water from thermopower plants. see Table 1.
Qbalance = Qinflow − Qpumped + Qreused
The above estimated calculation is based on the total water supply of the upper and central sources of Ulaanbaatar aquifers with the annual average flow rate of the Tuul River.
The water consumption of the whole aquifer of Ulaanbaatar, including domestic and thermal power plants, is shown above and is sorted by hydrologic year from April, when balance starts with a positive value [8].
The total amount of water consumption in Ulaanbaatar used for water supply in the dry, non-recharging season from surface water of Tuul River reaches about −20 × 106 m3/year depending on the weather conditions and general precipitation in a given year. This balance between water consumption and recharging inflow from Tuul River was estimated with all pumped groundwater from all nine water sources, including an upper source.
The balance between incoming flow coming from the Tuul River to the aquifer and outcoming flow as an exploration rate by intake wells [9]. This means city consumes −20 × 106 m3/year groundwater from aquifer without recharging from river. The balance estimation between groundwater income and pumped water for domestic water supply from the Ulaanbaatar aquifer source area without thermopower plants water supply consumption is −7.1 × 10⁶ m3/year water.
Therefore, there is an urgent need to solve this problem through the design of hydraulic structures for an underground dam, managed aquifer recharge, and the promotion of ice storage or the building of a surface reservoir dam that releases constant controlled outlet water.
In the next chapter, this problem is considered only for domestic consumption in the central source area of the Ulaanbaatar aquifer. A finite element subsurface FLOW (FEFLOW) simulation was taken in the upper and central source areas of the A zone, where there are only 23 wells for water supply; see Figure 3.
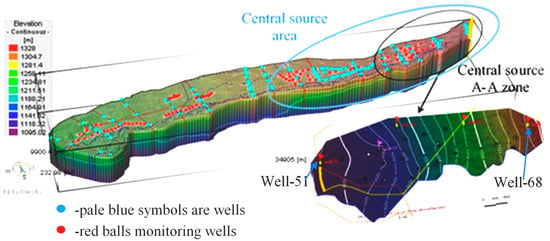
Figure 3.
Ulaanbaatar aquifer, central source area, and the simulated A zone area.
The average date of the first ice formation on rivers is the third week of October. The freezing of the rivers starts from the end of October and lasts until the end of December. The ice cover lasts, on average, for 145 days. During the last 60 years, the annual mean of air temperature in Mongolia has increased by 1.66 °C, the winter temperature has increased by 3.61 °C, the spring–autumn temperature has increased by 1.4–1.5 °C, and the summer temperature has had no clear trend [10]. Temperature has rapidly increased in March, May, September, and November, and the ice regimes of the Mongolian rivers have therefore changed [2,3,4].
Ice phenology has shifted about 3–30 days in terms of freeze-up and break-up dates, and ice cover duration has shortened. Maximum ice thickness also decreased from the 1960s to 2000 [11].
A small river like Tuul is frozen to the bed for 2.5 months [3], and in mid-April, it has no ice cover with some places being dry bed without flow.
2. Materials and Methods
2.1. FEFLOW (Finite Element Subsurface FLOW and Transport System) Transit Model with Ice Scenarios
Nowadays, groundwater simulation and modeling are some of the main tools for groundwater aquifers [12], which visualize the situation and conditions of water in underground porous media for the protection of groundwater, as well as the restoration and development of aquifers. Groundwater level loggers collect more data, but because they cannot be manually controlled, only software modeling and processing provide an option that is both fast and accurate [13].
Every spring over the last decade, during the months of March and April, the Tuul River has dried out or has not flowed [14]. Therefore, we need to address on this problem by building complexes of hydraulic structures, establishing measures for flow control, and building artificial groundwater recharge systems like drainage or flooding areas near drinking water extraction wells. This study attempts to find suitable artificial groundwater recharging methods for the upper part of the central source groundwater aquifer, encompassing the water supply source area of the Tuul River valley inside Ulaanbaatar. The central source of drinking water supply system was established and put into operation in 1959. Drinking water is extracted from 93 deep well pumps with seven booster pumping stations; see Figure 4.
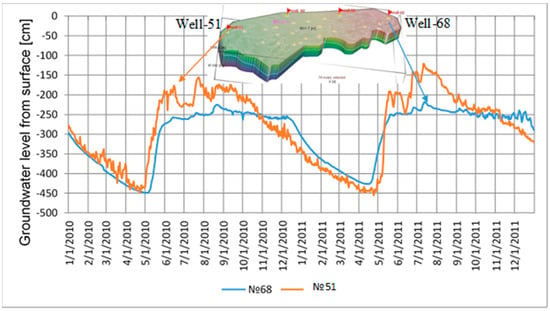
Figure 4.
Table of groundwater fluctuation in Wells 51 and 68 in the simulation area.
The capacity of the source reserve is 114 × 103 m3/day. Nowadays, water extraction is from 70–80 wells, and its volume reaches 87–90 × 103 m3/day for supply to the capital city [4]; see Figure 3.
The central source of the A–A zone was simulated in FEFLOW simulation. The upper part of the central source intake area near Well 68 takes recharge from river surface water until January, when the Tuul River flows under ice cover. After that period, the Tuul River freezes while the riverbed bottom and groundwater continuously decrease until May. However, in the western side of Zone A, the intake wells area near Well 51 recharge comes not only from Tuul River but also from the Uliastai River; therefore, recharge takes place early in May. As shown in graph, the Uliastai River flow freezes early in November as a small river due to a groundwater decrease that begins in October, and the following recharge in May depends on melting water from both rivers; see Figure 5.
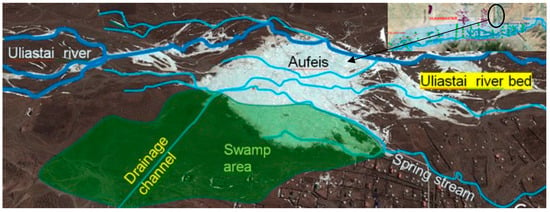
Figure 5.
Icing dynamic process in the Uliastai River valley.
The groundwater recharging process runs as follows:
In the initial phase in which surface runoff is non-existent, maximum groundwater declines are observed from the end of April to early May. If the value of the groundwater table is same and above the elevation of the riverbed, it becomes possible for the river to flow downstream without recharge.
The icing phenomena is one of the most important parameters for semi-arid, highly continental climate conditions and plays significant role in the hydrological cycle and regime of Mongolia. The icing or ice cover of rivers and lakes takes place in the cold season, which occurs over five to six months, when the ice cover thickness reaches to 0.8–3.2 m. However, big mountain rivers with a greater slope and bigger perturbation boulders in riffle sections stay open for the whole year and do not completely freeze along the length.
Generally, for surface ice cover to become firmly established, the mean (depth-averaged) temperature of water must be less than 2 °C, the daily average temperature must be less than −5 °C [15], and the wind speed must be less than 5 m/s [11].
The Uliastai River, one of the tributaries of the Tuul River, originates from the Khentii Mountains, flows from the north east side to the south through Ulaanbaatar, and contributes to the Tuul River through the water supply wells of the central source for Ulaanbaatar.
Icing in the aufeis accumulates during winter along the streams and the river valley in northern Mongolia, which is dominated by semi-arid, highly continental regions. In the Uliastai River, building ice lasts from the middle of October until the end of December, and the melting process starts from the end of March and ends in April.
The icing dynamics depend on the groundwater fluxes and discharges alongside of the main channel. The spring leakes through drainage channel, builds ice sheets over the frozen riverbed, where the main stream flows under ice cover. The ice generating process and icing dynamics are studied from the middle of October to the end of December.
The main stream flows by the main channel under ice cover. The side spring streams over the top of the ice sheets. This phenomenon is called icing or aufeis. Icing or aufeis consist of sheets of stratified ice formed by freezing consecutive water leaks [16].
The water flows over existing ice layers. It forms through the upwelling of groundwater discharge or manmade drainage channels, where groundwater discharge is blocked by ice, perturbing the steady-state condition and causing a small incremental rise in the local water table until discharge occurs along the bank and over the top of the previously formed ice [16].
In the beginning of November, river flow freezes from side benches, with the spring discharge no longer extending energy because it had frozen first. After the riverbed completely freezes and takes ice cover, the spring discharges leak from under the ice or ice hummock while the groundwater head and pressure flows increase over frozen ice sheets to create the next ice sheet.
A groundwater flux from drainage canal flows on surface as spring and creates the next ice sheet, which fills the lower ravines and smoothest horizontal by ice sheet.
The groundwater flux alongside the river drains through drainage canal-built icing phenomena, while springs’ flow beds are blocked by ice and the main stream in the main riverbed flows under the ice cover. In this section, the Uliastai River gains streams of almost one-third of the flow of the discharge abstracts to groundwater, and groundwater comes from springs.
Thus, phenomena create side spring leakage from under frozen soil, leakage which flows over frozen soil and ice-covered streams, fills ravines and lower lands, creates ice sheets on the ice until the river valley gains the same level of ice. After that, the average daily temperature decreases to under −20 °C, and then the groundwater leakage discharge decreases the head and pressure of groundwater flux in underground flows. Additionally, drained groundwater, spring discharge from the surface, and groundwater decreases influence the quantity of groundwater volume. The ice thickness measurements from the 15th to the 30th of December showed that the thickness of the aufeis sheets have not increased; see Figure 4.
In this way, groundwater leakage, like drained water or springs over frozen soil and ice cover, creates stratified ice sheets over other ice sheets. In the Uliastai River, there are spring discharges of 32 L/s—a small amount of water that nonetheless build ice thicknesses in some places up to 1 m thick. Some of the rivers make ice sheets of thicknesses of several meters. The decline of the ice storage depends on the quantity of spring discharge. The end of building aufeis is usually in the last days of December or the first days of January—after the longest December night ends and the colder days of the year start. In a larger river, such as the Tuul, is possible to create an aufeis until February. An aufeis typically starts to melt during summer and finishes by the end of April (or sometimes, the beginning of May), and it will often form in the same place each year [7].
From these icing ideas, a MATLAB code was written and used for the management of aquifer recharge for the central source of the A zone, which accumulates ice storage due to the use of melt water for recharge in the dry season [17].
The aufeis code was written as one mole of water exchanging energy with cold air and ice, extending velocity of in both the x and y directions could widen in an ellipsoidal way due to the Darcy–Weisbach law. The aufeis spreading dynamics of one mole thick water sheet over ice sheets decrease the extension size while decreasing air temperature day by day from −5 to −30 °C [17].
The result shows that length of ice spread is 2329 m, with a width of 458 m and thickness of 1.54 m. The code for ice storage was simplified with the same slope along flat area. The MATLAB code presents the ice extending dynamics of spreading water with pipeline levees, and from leakage point to pipeline levee of 1500 m. The length of ice storage is only 1500 m; see Figure 6. The results show that the length of ice spread is 1500 m, with a width of 400 m and thickness of 2.72 m, thicker than the unlimited area. In the following figure, you can see two ice storages: unlimited and unlimited area with underground pipeline levee, see Figure 7. These ice storages will change recharging boundary condition in FEFLOW model as a one-month early recharge in April by melt water from north side, where the Tuul River flows in May [8].
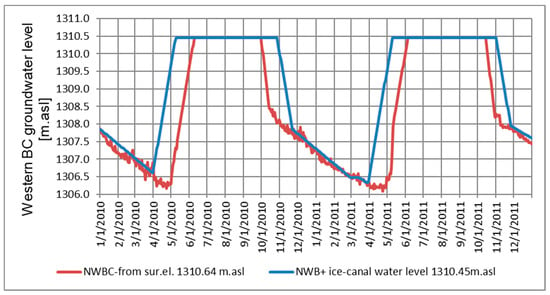
Figure 6.
Recharging time difference on northwest boundary (NWBC) with ice storage (blue), only from drainage canal (red).
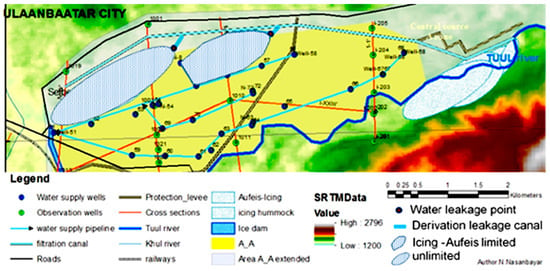
Figure 7.
The water supply pipelines connecting wells.
The relation between the estimated quantity of the MATLAB ice code and the FEFLOW simulation characterizes the boundary condition change in the northwest side of simulated area. The groundwater recharge from the river starts in May, when the Tuul River flows again. However, in the simulation, the aufeis-stored ice was shown to melt earlier in April and to recharge groundwater. The aufeis changes the northwest boundary condition so that the recharge starts from the beginning of April. The drainage canal begins to flow with water from May, when the Tuul River flows again; see Figure 6. The eastern boundary groundwater fluctuation taken from Well 68 was not found to change. However, the downwards flow direction of the northwest boundary condition was found to change with recharge from the ice melt water; see Figure 6, blue line.
One of the artificial recharging groundwater resources is the temporary and spatial redistribution of surface runoff, which in the beginning of winter results in ice formation. The surface runoff flows over the northern side of the central section A zone through filtration channel will release water at the end of canal and, thus, it again creates more ice sheets over frozen ones.
There are three ways of promoting ice creation in cold regions in winter: on the ground surface, in the underground open pit or channel, and on the river bed. Of these, surface and underground ice creation were considered in the FEFLOW simulation scenarios. See Figure 7.
The rate of water release is 1 m3/s at the beginning of November until the middle of December, and creates ice storage when the average temperature decreased under −5 °C.
From the above figures, it is shown that the northern drainage canal allows us to accumulate 1 m3/s flow water for a month, from November to the middle of December, and 3.9 × 10⁶ m3 water can be stored on the surface. However, with losses from evaporation and winter fog over frozen ice sheets during the melting season, evaporation loss allowed only half of this quantity—about 2 × 10⁶ m3—to accumulate for recharging groundwater. Here melted water from ice storage recharges groundwater in the central source A–A zone from the northern side, from the beginning of April until May.
Ice accumulation from November to the end of December also recharges groundwater while water flows through the drainage canal. It is then transferred to the artificial regime with the subsequent supply of water to canals, functioning together until the period of ice formation, provided there is ice accumulation from surface water on the end of the canal.
The underground dam will be built in the first layer until reaching the natural permafrost layer 5–10 m from the surface [18,19], considered as an ice wall on the western boundary line.
2.2. FEFLOW Steady Model with Water Reservoir Scenario
A preliminary analysis, as presented in this study, was to identify low-cost MAR implementation measures adapted to the specific natural conditions of the Northern Mongolia. Thus, the coldness of cold weather can be used to keep water in ice form and as a water resource in the winter season in addition to being used during the dry season, characterized by low flow, by melting ice when the rivers have dried out.
The accumulated ice would recharge the groundwater in the dry season from March to May by melting, and the riverbed would be dry without water or cover ice.
To find the total additional water resource recharged by the northern drainage canal and ice storage, the abstraction rate should be increased until the available maximum rate, when groundwater drawdown decreases under the filter screen at the bottom of wells and soaks up air. For calculation of the potential maximum abstraction quantity in the central source A zone without MAR methods, it should be estimated using FEFLOW simulation until some well groundwater drawdown reaches to the bottom of the well screen, pumping air instead of water. In this way, groundwater fluctuation ranges can be established in FEFLOW.
The groundwater fluctuation graph of monitoring well N8 show that by increasing daily extraction to 60,986 m3/day, it was not possible to pump water while the groundwater drawdown was under the bottom screen. However, in the middle of group of wells, groundwater level is in extreme drawdown, and only 45,121 m3/day is possible. Therefore, the maximum abstraction rate of this area is 45,121 m3/day, which means 16,469,165 m3/year = 16.5 × 10⁶ m3 of water per year.
Nowadays, the exploitation rate is 20,329 m3/day (average of 2009–2011), 7.5 × 10⁶ m3/year corresponding to half of the possible maximum abstraction.
The recharge quantity with MAR method and then the maximum abstraction rate increase until 70,133 m3/day, which corresponds to 25.6 × 10⁶ m3/year.
The difference between the above maximum abstraction simulations shows that it is possible to increase the groundwater resource extraction rate to around 25 × 103 m3/day using MAR methods. That means approximately 912,500 m3/year = 9.125 × 10⁶ m3 additional groundwater during wet season could be kept as reserve in the upper part of this central source area A–A zone.
The percentage for recharge groundwater sources in this area was estimated by the sum of all methods of each MAR method, and is taken as 100% for all together.
The percentage of the increased amount of water reserve by each method, after combination of the MAR methods, from increased groundwater sources is as follows.
- Drainage canal brings 73.5% of artificial recharge in 6.7 × 10⁶ m3 water (1 m3/s discharge water through the drainage canal from May to November 86,400 m3/day × 184 day = 15,897,600 m3 = 15.9 × 10⁶ m3).
- Ice storage keeps water in ice form in 21% or 1.9 × 10⁶ m3 (1 m3/s discharge water for ice storage would be 5.2 × 10⁶ m3, but fog and evaporation during icing and melting bring about huge loss).
- Ice walls delay groundwater flux and maintain stability in the groundwater table, leading to retention of an additional 5.65% of groundwater, which is about 516 × 103 m3 in water amount [17].
All of these FEFLOW simulations were simulated in a transient model, where the river surface water level increases in the wet season over the riverbed, and decreases in the dry season under the dry riverbed. The table of the eastern and western boundary groundwater fluctuates under the surface, depending on the recharge from the river for whole year.
Another alternative simulation scenario is for the water release from the surface water reservoir with a dam, with a constant q rate of 26.6 m3/s and creation of table for constant groundwater water. In this case, the model is taken with the eastern and western boundary using a constant groundwater level and hydraulic head and, also, in the southern boundary as the Tuul River with a constant level value for groundwater recharge. In the FEFLOW simulation, the maximum abstraction rate reached 90,288 m3/day. Following this, the simulation produced an error report indicating that the aquifer has no groundwater; see Figure 8.
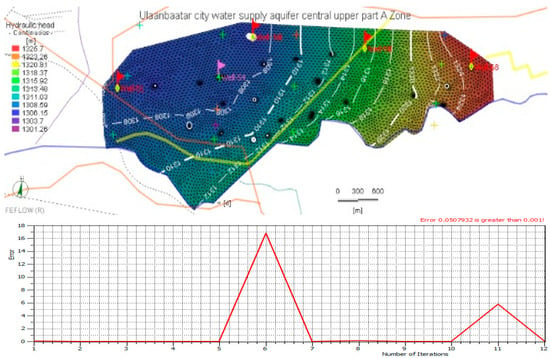
Figure 8.
The groundwater contours and simulation error by pumped 166,700 m3/day water.
This means the flow control by surface reservoir accumulates flood water and, additionally, the recharge groundwater quantity for the central source of A zone is 16.5 × 10⁶ m3/year.
The flow control upper reservoir releases a constant outflow throughout the year, and it means it also recharges the central source of B zone, occupying a larger area twice in size, with 50 intake wells. The constant release rate for the whole central source area that is recharged from the reservoir would be 49.5 × 10⁶ m3/year. An additional 350 × 106 m3 of accumulated water in the reservoir would be reserved for use as a freshwater resource [20].
All these simulated calculations involved recharging water from only reservoir. When we are simulating a combination of artificial recharging groundwater sources and reservoir release for surface water recharge, then the additional recharged groundwater would be 167,700 m3/day; see Figure 9.
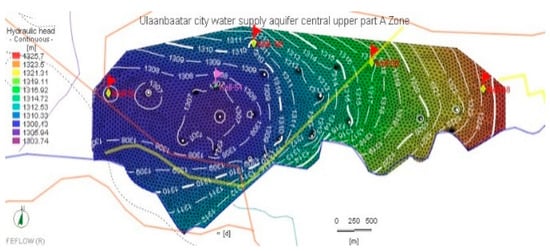
Figure 9.
The groundwater simulated contours by a combination of managed aquifer methods and recharge from Tuul River outflowing from reservoir.
These MAR methods and the reservoir recharge system include the following simulation scenarios.
- The northern drainage canal recharge groundwater resource from the northern side in wet season;
- Ice storage for groundwater recharge by melting ice in the dry season in early April with Tuul River flow starting in May;
- The underground ice dam which accumulates groundwater backside up to the permafrost layer 5–10 m [18,19];
- The surface reservoir with constant release discharge into Tuul River, which recharge this area from the southern side over the whole year.
In this combination of scenarios, the maximum possible abstraction rate is increased up to 167,700 m3/day after simulation. The maximum possible abstraction quantity per year reaches up to 44.7 × 10⁶ m3/year.
The FEFLOW simulation was only run for the central source of A zone. When we take the second B zone with 50 wells, this maximum abstraction rate would be increased, and at least doubled or 89.5 × 10⁶ m3/year due to water recharging because the B zone is twice as large as the A zone. If the Tuul River flows yearly with constant discharge, then river surface water will be recharged for industrial sources, and that leads to increases in the additional groundwater resource. This will increase the flow from groundwater sources to 149 × 106 m3/year and create natural conditions for discontinuous Tuul River flow to assist in avoiding a situation of shortages in the fresh water supply for Ulaanbaatar city.
3. Analyses of FEFLOW Model
Aufeis is an icing method that brings more recharge water in the middle of the study area for its other constituent subsections as well as an ice wall, increasing the backside of the western boundary. The drainage canal filtrates through the northern side and the recharge occupies the whole area from the east to the west boundary.
The combination of all methods includes an ice wall, icing, and drainage canal. The drainage canal filtrates water from east to west along the north side of the study area, and the rest are released from it as water, since early winter creates icing, see Figure 10. Thus, this icing method is performed after drainage canal filtration has ceased altogether.
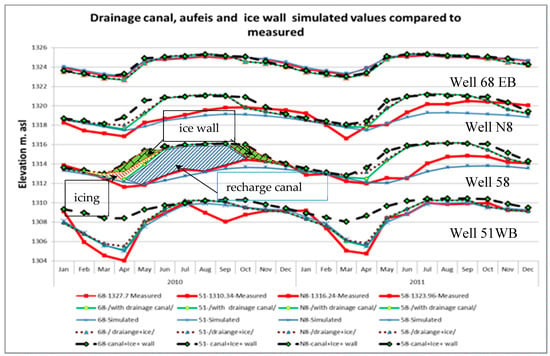
Figure 10.
The combination of all variations in simulated area compared to the measured groundwater level.
As seen in the following figure, recharge from the drainage canal begins in May and ends in November, with icing recharge beginning in the middle of March and lasting until May, and the ice wall holding groundwater undergoing the reverse, from March until November.
In nature, we can reserve more water in ice form as aufeis to help in building some hydraulic structures, such as drainage canals or underground dams. Both of these structures can help us to reserve water stores underground, as well as keep them on the surface in ice form.
From October to December, surface water naturally accumulates and is kept in ice form from river flow in the semi-arid, highly continental region of the study area. During the subsequent dry season, these sources increase and recharge potential water availability by melting water sources.
One possibility is to reserve water resources to regulate groundwater flux control in highly continental cold regions to eliminate dry riverbeds and keep primary source rivers, such as the Tuul River, continuously flowing during low flow periods is by melting ice blocks.
From the following graph, it can be seen that the northern drainage canal will allow accumulation 1 m3/s flow water for a month from the beginning of November to mid-December, creating 3.9 × 10⁶ m3 water for surface storage.
However, due to losses from evaporation and winter fog over frozen ice sheets and, also, evaporation loss during the melting season, only half of this quantity, or about 2 × 10⁶ m3, will actually accumulate and be available for groundwater recharge.
For this FEFLOW simulation, the maximum difference between the simulation in natural conditions and the simulation in each managed aquifer recharge scenario is taken into account. The result of the FEFLOW simulation in each MAR method scenario demonstrates the following results:
- Single ice wall on the western boundary in natural condition without drainage canal increases groundwater resources in 516 × 103 m3/year;
- The drainage canal through the northern side filtrates groundwater at around 1 × 10⁶ m3/year;
- The icing on the end of the drainage canal recharges groundwater resources in the aquifer corresponding to 1.6 × 10⁶ m3 water;
- The aquifer additional recharge groundwater quantity of all combined MAR methods is 2.55 × 10⁶ m3/year [8], see Figure 10.
4. Results and Conclusions
In recent decades, as the city develops and expands, the consumption of the domestic and industrial water supply of the city is increasing intensively, but the availability of the water supply, both now and in the future, has become a pressing issue. Therefore, in this paper, possible variants for recharging the groundwater resource are considered using FEFLOW simulation, and compared with the results for modeling in the upper part of Ulaanbaatar aquifer.
The simulation variants of the recharging methods of managed aquifer are northern drainage canal, which recharges groundwater from the opposite side such as for the Tuul River, icing or aufeis, which keeps water in ice form, brings it from the end of the wet season through winter to the dry season, and increases groundwater sources, by melting. In the end of the upper part of the aquifer in the western side, building an underground dam which accumulates groundwater on the backside. All these variants were used in FEFLOW simulation, and the recharged quantity was calculated separately, and combined ones demonstrated the following results.
- A single ice wall on the western boundary in natural conditions without drainage of canal increases groundwater resources by 516 × 103 m3/year.
- The drainage canal through the northern side filtrates groundwater around 1 × 10³ m3/year;
- The icing on the end of the drainage canal recharges groundwater resources in the aquifer with 1.6 million m3 water;
- The aquifer additional recharge groundwater quantity of all combined MAR methods is 2.55 × 10⁶ m3/year [8].
The additional recharged groundwater difference by increased daily abstraction rate from this aquifer both with and without managed aquifer recharge would be 9.16 × 10⁶ m3/year.
When the FEFLOW simulation scenario has taken into account the surface water reservoir, which releases constant discharge flow, then the calculations involving recharge from only reservoir separately and also the combined simulation with MAR methods demonstrate the following results.
- The recharge quantity from the Tuul River with constant discharge during an entire year is 16.5 × 10⁶ m3/year;
- The combination MAR and surface water from reservoir outflow corresponds to a recharge of 44.7 × 10⁶ m3/year.
These simulation results are from the upper part with only 23 wells of central source area, which has a total of 72 wells. When the simulation is based on all the Ulaanbaatar aquifers and additional recharged groundwater resource from Tuul River flow with constant runoff, the results is at least 3 times more than this small area or 150 × 106 m3/year.
The simulation of both transient (MAR methods) and steady reservoir outflow recharge methods show that artificial recharge methods of groundwater are not enough for additionally recharged quantity compared with surface reservoir outflow recharging. However, a combination of both methods demonstrates that use of artificial recharging groundwater sources in the aquifer is more effective.
Using coldness and icing in a semi-arid, highly continental region such as Mongolia can increase groundwater resources. The nonconventional artificial recharging methods specified in this paper, including ice storage, can assist in groundwater recharge in dry seasons, when there is no flow and dry beds in river systems.
The Tuul River reservoir will be located upstream from the aquifer and can accumulate 350 × 106 m3 in water [20], creating a more humid environment in the region of Ulaanbaatar. A positive side effect of increased evaporation from the open water is that air humidity will be increased, which will lead to artificial precipitation and deposition of atmospheric particles from air pollution and, thus, helps to improve air quality in the city and its surroundings.
Groundwater flux disturbed by the presence of an ice wall comes out on the surface during spring, spreading, evaporating, and losing some of its mass. This creates fog in winter and turbidity in air when a cold high-pressure cyclone dominates Ulaanbaatar city. The turbidity of air corresponds to windy surroundings and clears air pollution.
Following the MAR method, water storage in the form of ice in semi-arid, cold, highly continental regions would also produce coldness during the dry season and increase the inner continental hydrologic cycle through melting and evaporation. In the dry season, melting ice evaporates and increases precipitation. Many forest fires occur every year in Mongolia during the dry season due, at least partially, to the lack of precipitation and the lower air humidity. Therefore, ice-keeping methods would help in keeping the environment green, environmentally close to the natural process and improve human and natural habitats.
The aufeis blocks, involving icing in the river valley, are increasing continental cycles by evaporating melted water and producing coldness [21]. Thus, it helps in growing of vegetation and increasing precipitation in the dry period. During the fall months, from September to October, the soil moisture increases with more rain, and during spring (March and April), there is more humidity in the air and more rain. Meltwater is a common source for rivers and enables their continuous flowing [22] as well as the recharging of groundwater aquifers.
Author Contributions
U.M., First editor and reviewer of my (N.N.) dissertation structure. This article structured by his (U.M.) recommendation which is part of my (N.N.) dissertation in groundwater modelling and management.
Funding
This research received no external funding.
Conflicts of Interest
The authors declare no conflict of interest.
References
- Davaa, G. Surface Water Resources in Mongolia; Interpress LLC: Ulaanbaatar, Mongolia, 2008. [Google Scholar]
- GIM—Geo-Ecology Institute Mongolia. The Research Works Report of Tuul River Water Reserves Decreases Reason; Protection Provision UB; GIM: Ulaanbaatar, Mongolia, 1997. [Google Scholar]
- RIBES-Research Institute on Building Engineering Studies. Technical Report of Engineering Survey TOM-2; RIBES-Research Institute on Building Engineering Studies: Moskow, Russia, 1979. [Google Scholar]
- GIM—Geoecology Institute of Mongolia. The Current Situation, Location, Reserves and Future Concept of Domestic and Industrial Water Supply for Ulaanbaatar City; GIM: Ulaanbaatar, Mongolia, 2000. [Google Scholar]
- Gombo, D.; Magsar, E. Hydrological Changes in the upper Tuul River Basin; Juuljinii St. 5, Ulaanbaatar-46; Institute of Meteorology and Hydrology: Ulaanbaatar, Mongolia, 2004. [Google Scholar]
- GIM—Geoecology Institute of Mongolia. The Ecological Assessment of Tuul River; GIM: Ulaanbaatar, Mongolia, 1999. [Google Scholar]
- IMHM—Institute of Meteorology and Hydrology Mongolia. Weather Parameters Data of Ulaanbaatar, 1986–2006; IMHM: Ulaanbaatar, Mongolia, 2006. [Google Scholar]
- Nasanbayar, N. Icing Mar Method for Semi-Arid, Highly Continental Region (an Example at Ulaanbaatar city, Mongolia). Int. J. Recent Sci. Res. 2019, 10. [Google Scholar] [CrossRef]
- SIWRMM. Strengthening Integrated Water Resources Management in Mongolia; Tuul River Basin Integrated Water Resources Management Assessment Report; SIWRMM: Ulaanbaatar, Mongolia, 2012. [Google Scholar]
- Punsalmaa, B.; Nyamsuren, B.; Buyndalai, B. Trends in River and Lake Ice in Mongolia. AIACC Working Paper No. 4. 2004. Available online: http://www.start.org/Projects/AIACC_Project/working_papers/Working 20Papers/AIACC_WP_No004.pdf (accessed on 30 November 2019).
- Ashton, G.D. Deterioration of Floating Ice Covers. J. Energy Resour. Technol. 1985, 107, 177–182. [Google Scholar] [CrossRef]
- Kresic, N. Hydrogeology and Groundwater Modeling; CRC Press: Boca Raton, FL, USA, 2006; p. 807. [Google Scholar]
- MIKE Powered by DHI. Available online: http://www.feflow.com (accessed on 1 January 2012).
- Tsujimura, M.; Ikeda, K.; Tanaka, T.; Janchivdorj, L.; Erdenchimeg, B.; Unurjargal, D.; Jayakumar, R. Groundwater and Surface Water Interactions in an Alluvial Plain, Tuul River Basin, Ulaanbaatar, Mongolia. Sciences in Cold and Arid Regions. 2013, pp. 126–132. Available online: http://www.scar.ac.cn (accessed on 30 November 2019).
- Ashton, G.D. Thin ice Growth. Water Resour. Res. 1989, 25, 564–566. [Google Scholar] [CrossRef]
- Froehlich, W.; January, S. River Icings and Fluvial Activity in Extreme Continental Climate: Khangai Mountains, Mongolia. 1982. Available online: http://pubs.aina.ucalgary.ca/cpc/CPC4-203.pdf (accessed on 30 November 2019).
- Nasanbayar, N. Icing phenomena for Managed aquifer recharge (MAR) and It’s FEFLOW simulation result. Ulaanbaatar PMAS 2019, 59, 229. [Google Scholar]
- Dashjamts, D. Geotechnical problems of construction on permafrost in Mongolia. Sci. Cold Arid Reg. 2013, 5, 0667–0676. [Google Scholar] [CrossRef]
- Dashjamts, D. Permafrost and geotechnical investigations in Nalaikh Depression of Mongolia. Sci. Cold Arid Reg. 2015, 7, 438–455. [Google Scholar]
- Monhydroconstruction LLC. The Results Report of Feasibility Study Multipurpose Dam Built on the Tuul River; Monhydroconstruction LLC: Ulaanbaatar, Mongolia, 2007. [Google Scholar]
- Grayson, R. Asian Ice Shields and Climate Change. World Placer J. 2010, 10, 21–45. [Google Scholar]
- Emerton, L.; Erdenesaikhan, N.; de Veen, B.; Tsogoo, D.; Janchivdorj, L.; Suvd, P.; Enkhtsetseg, B.; Gandolgor, G.; Dorjsuren, C.; Sainbayar, D.; et al. The Economic Value of the Upper Tuul Ecosystem, Mongolia; World Bank: Washington, DC, USA, 2010. [Google Scholar]
© 2019 by the authors. Licensee MDPI, Basel, Switzerland. This article is an open access article distributed under the terms and conditions of the Creative Commons Attribution (CC BY) license (http://creativecommons.org/licenses/by/4.0/).