Urban Spatial Configuration and Functional Runoff Connectivity: Influence of Drainage Grid Density and Landscape Metrics
Abstract
:1. Introduction
1.1. Context
1.2. Problem Statement
1.3. Research Questions
- Which variables or landscape metrics influence runoff in an urban environment, characterized by different street grid densities?
- To what extent can a landscape, constrained by a certain street grid density and percentage of impervious surface, minimize runoff and maximize infiltration?
2. Material and Methods
2.1. Landscape Creation
2.1.1. Grid Extraction
2.1.2. Digital Elevation Model Creation
2.1.3. Neutral Landscape Model Generation
2.1.4. Landscape Metrics
2.2. Modelling
2.2.1. Downward Modelling Approach
2.2.2. Curve Number Hydrological Model and Functional Runoff Connectivity
2.2.3. Landscape Metric Correlation and Selection
2.2.4. Landscape Metric and Functional Runoff Connectivity Modelling
2.3. Optimization with SHERPA Algorithm
3. Results
3.1. Landscape Metrics Correlations and Models
3.1.1. Landscape Metrics Correlations
3.1.2. Landscape Metrics Models
3.2. Optimization
4. Discussion
4.1. Landscape Metrics Correlations and Modelling
4.2. Optimization
4.3. Real World Implications
4.4. Simplifications
4.5. Future Research
5. Conclusions
Author Contributions
Funding
Acknowledgments
Conflicts of Interest
Appendix A. Landscape Metrics Spearman Correlations with p Values
Appendix A.1. Reference Scenario (n = 400)
| Pervious Fraction | p Values | ||||||||
|---|---|---|---|---|---|---|---|---|---|
| Fc | 0.20 | 0.40 | 0.60 | 0.80 | Fc | 0.20 | 0.40 | 0.60 | 0.80 |
| A | 0.40 | 0.76 | 0.78 | 0.35 | A | 0.0001 | <0.0001 | <0.0001 | 0.0004 |
| NIC | −0.41 | −0.76 | −0.78 | −0.35 | NIC | 0.0001 | <0.0001 | <0.0001 | 0.0004 |
| NPC | −0.74 | −0.63 | −0.45 | −0.12 | NPC | <0.0001 | <0.0001 | <0.0001 | 0.2535 |
| STDIC | 0.40 | 0.80 | 0.81 | 0.34 | STDIC | 0.0002 | <0.0001 | <0.0001 | 0.0005 |
| MIC | 0.66 | 0.50 | 0.36 | 0.30 | MIC | <0.0001 | <0.0001 | 0.0002 | 0.0025 |
| LIC | −0.09 | 0.69 | 0.77 | 0.30 | LIC | 0.4154 | <0.0001 | <0.0001 | 0.0027 |
| EIA | 0.66 | 0.82 | 0.88 | 0.80 | EIA | <0.0001 | <0.0001 | <0.0001 | <0.0001 |
| FPOIP | −0.43 | −0.36 | −0.39 | −0.64 | FPOIP | <0.0001 | 0.0002 | <0.0001 | <0.0001 |
| FPMICO | 0.39 | 0.24 | 0.39 | −0.18 | FPMICO | 0.0002 | 0.0149 | <0.0001 | 0.0677 |
| FPLICO | −0.18 | −0.19 | −0.24 | −0.38 | FPLICO | 0.1058 | 0.0579 | 0.0153 | <0.0001 |
| PXICO | 0.38 | 0.73 | 0.78 | 0.35 | PXICO | 0.0003 | <0.0001 | <0.0001 | 0.0003 |
| PXLICO | 0.59 | 0.72 | 0.88 | 0.53 | PXLICO | <0.0001 | <0.0001 | <0.0001 | <0.0001 |
Appendix A.2. Irvine scenario (n = 400)
| Pervious Fraction | p Values | ||||||||
|---|---|---|---|---|---|---|---|---|---|
| Fc | 0.20 | 0.40 | 0.60 | 0.80 | Fc | 0.20 | 0.40 | 0.60 | 0.80 |
| A | 0.69 | 0.90 | 0.93 | 0.93 | A | <0.0001 | <0.0001 | <0.0001 | <0.0001 |
| NIC | −0.69 | −0.90 | −0.93 | −0.93 | NIC | <0.0001 | <0.0001 | <0.0001 | <0.0001 |
| NPC | −0.78 | −0.60 | −0.38 | −0.15 | NPC | <0.0001 | <0.0001 | <0.0001 | 0.1244 |
| STDIC | 0.68 | 0.93 | 0.96 | 0.96 | STDIC | <0.0001 | <0.0001 | <0.0001 | <0.0001 |
| MIC | −0.01 | −0.08 | 0.05 | 0.21 | MIC | 0.9028 | 0.4062 | 0.6477 | 0.0338 |
| LIC | −0.03 | 0.88 | 0.92 | 0.94 | LIC | 0.7872 | <0.0001 | <0.0001 | <0.0001 |
| EIA | 0.79 | 0.97 | 0.97 | 0.97 | EIA | <0.0001 | <0.0001 | <0.0001 | <0.0001 |
| FPOIP | −0.05 | −0.08 | 0.01 | 0.15 | FPOIP | 0.6187 | 0.4364 | 0.9564 | 0.1467 |
| FPRIP | −0.08 | 0.88 | −0.24 | −0.33 | FPRIP | 0.4306 | <0.0001 | 0.0161 | 0.0009 |
| FPMICO | 0.10 | −0.08 | −0.06 | 0.06 | FPMICO | 0.3194 | 0.4036 | 0.5678 | 0.5223 |
| FPMICR | −0.45 | −0.29 | −0.83 | −0.75 | FPMICR | <0.0001 | 0.0038 | <0.0001 | <0.0001 |
| FPLICO | 0.01 | −0.20 | 0.02 | 0.17 | FPLICO | 0.9468 | 0.0442 | 0.8733 | 0.0841 |
| FPLICR | 0.22 | 0.04 | −0.19 | 0.14 | FPLICR | 0.0288 | 0.705 | 0.062 | 0.1788 |
| PXICO | 0.64 | 0.88 | 0.93 | 0.94 | PXICO | <0.0001 | <0.0001 | <0.0001 | <0.0001 |
| PXICR | 0.70 | 0.89 | 0.93 | 0.93 | PXICR | <0.0001 | <0.0001 | <0.0001 | <0.0001 |
| PXLICO | 0.21 | 0.67 | 0.89 | 0.89 | PXLICO | 0.0385 | <0.0001 | <0.0001 | <0.0001 |
| PXLICR | 0.07 | 0.71 | 0.84 | 0.85 | PXLICR | 0.478 | <0.0001 | <0.0001 | <0.0001 |
Appendix A.3. Concord scenario (n = 300)
| Pervious Fraction | p Values | ||||||||
|---|---|---|---|---|---|---|---|---|---|
| Fc | 0.20 | 0.40 | 0.60 | 0.80 | Fc | 0.20 | 0.40 | 0.60 | 0.80 |
| A | 0.85 | 0.95 | 0.94 | A | <0.0001 | <0.0001 | <0.0001 | ||
| NIC | −0.85 | −0.95 | −0.94 | NIC | <0.0001 | <0.0001 | <0.0001 | ||
| NPC | −0.77 | −0.56 | −0.27 | NPC | <0.0001 | <0.0001 | 0.0064 | ||
| STDIC | 0.85 | 0.96 | 0.93 | STDIC | <0.0001 | <0.0001 | <0.0001 | ||
| MIC | 0.83 | 0.80 | 0.83 | MIC | <0.0001 | <0.0001 | <0.0001 | ||
| LIC | 0.39 | 0.88 | 0.86 | LIC | <0.0001 | <0.0001 | <0.0001 | ||
| EIA | 0.80 | 0.98 | 0.98 | EIA | <0.0001 | <0.0001 | <0.0001 | ||
| FPOIP | −0.11 | −0.07 | 0.06 | FPOIP | 0.2782 | 0.5199 | 0.5329 | ||
| FPRIP | 0.04 | −0.09 | −0.14 | FPRIP | 0.7095 | 0.3545 | 0.1546 | ||
| FPMICO | −0.03 | 0.16 | 0.30 | FPMICO | 0.7619 | 0.1212 | 0.0022 | ||
| FPMICR | 0.40 | −0.69 | −0.88 | FPMICR | <0.0001 | <0.0001 | <0.0001 | ||
| FPLICO | −0.18 | 0.07 | 0.08 | FPLICO | 0.081 | 0.5001 | 0.4386 | ||
| FPLICR | 0.05 | 0.19 | 0.29 | FPLICR | 0.6363 | 0.0599 | 0.0034 | ||
| PXICO | 0.75 | 0.94 | 0.94 | PXICO | <0.0001 | <0.0001 | <0.0001 | ||
| PXICR | 0.85 | 0.94 | 0.93 | PXICR | <0.0001 | <0.0001 | <0.0001 | ||
| PXLICO | 0.27 | 0.67 | 0.79 | PXLICO | 0.0073 | <0.0001 | <0.0001 | ||
| PXLICR | 0.38 | 0.48 | 0.63 | PXLICR | <0.0001 | <0.0001 | <0.0001 | ||
Appendix A.4. Point Breeze scenario (n = 300)
| Pervious Fraction | p Values | ||||||||
|---|---|---|---|---|---|---|---|---|---|
| Fc | 0.20 | 0.40 | 0.60 | 0.80 | Fc | 0.20 | 0.40 | 0.60 | 0.80 |
| A | 0.93 | 0.97 | 0.97 | A | <0.0001 | <0.0001 | <0.0001 | ||
| NIC | −0.93 | −0.97 | −0.97 | NIC | <0.0001 | <0.0001 | <0.0001 | ||
| NPC | −0.77 | −0.50 | −0.13 | NPC | <0.0001 | <0.0001 | 0.1906 | ||
| STDIC | 0.88 | 0.93 | 0.92 | STDIC | <0.0001 | <0.0001 | <0.0001 | ||
| MIC | 0.83 | 0.91 | 0.88 | MIC | <0.0001 | <0.0001 | <0.0001 | ||
| LIC | 0.66 | 0.75 | −0.03 | LIC | <0.0001 | <0.0001 | 0.777 | ||
| EIA | 0.84 | 0.99 | 0.99 | EIA | <0.0001 | <0.0001 | <0.0001 | ||
| FPOIP | 0.04 | 0.01 | 0.07 | FPOIP | 0.6899 | 0.9513 | 0.4646 | ||
| FPRIP | 0.10 | −0.16 | −0.48 | FPRIP | 0.2996 | 0.1203 | <0.0001 | ||
| FPMICO | −0.09 | −0.10 | 0.04 | FPMICO | 0.3504 | 0.3365 | 0.686 | ||
| FPMICR | 0.79 | 0.54 | −0.21 | FPMICR | <0.0001 | <0.0001 | 0.0356 | ||
| FPLICO | −0.15 | 0.08 | 0.06 | FPLICO | 0.1359 | 0.4532 | 0.5624 | ||
| FPLICR | −0.25 | −0.54 | 0.01 | FPLICR | 0.0122 | <0.0001 | 0.932 | ||
| PXICO | 0.89 | 0.96 | 0.97 | PXICO | <0.0001 | <0.0001 | <0.0001 | ||
| PXICR | 0.90 | 0.97 | 0.96 | PXICR | <0.0001 | <0.0001 | <0.0001 | ||
| PXLICO | 0.17 | 0.22 | 0.71 | PXLICO | 0.0958 | 0.0254 | <0.0001 | ||
| PXLICR | 0.67 | 0.59 | 0.72 | PXLICR | <0.0001 | <0.0001 | <0.0001 | ||
Appendix B
| Parameter | Group | Estimate | Std Error | Prob > |t| | Lower 95% | Upper 95% |
|---|---|---|---|---|---|---|
| a1 | Reference | 0.0399599 | 0.017786 | 0.0252 | 0.0049899 | 0.0749298 |
| b1 | Reference | 0.0620165 | 0.003245 | <0.0001 | 0.055637 | 0.068396 |
| a2 | Irvine | 0.4321842 | 0.012495 | <0.0001 | 0.4076191 | 0.4567494 |
| b2 | Irvine | 0.0686067 | 0.002824 | <0.0001 | 0.0630545 | 0.074159 |
| a3 | Concord | 0.7302278 | 0.00613 | <0.0001 | 0.7181638 | 0.7422918 |
| b3 | Concord | 0.0471453 | 0.001641 | <0.0001 | 0.0439159 | 0.0503748 |
| a4 | Point Breeze | 0.9120371 | 0.002328 | <0.0001 | 0.9074561 | 0.916618 |
| b4 | Point Breeze | 0.0178047 | 0.000689 | <0.0001 | 0.0164488 | 0.0191605 |
| Parameter | Group | Estimate | Std Error | Prob > |t| | Lower 95% | Upper 95% |
|---|---|---|---|---|---|---|
| a11 | Reference | 0.1452904 | 0.006163 | <0.0001 | 0.1331733 | 0.1574075 |
| b11 | Reference | 0.853726 | 0.018431 | <0.0001 | 0.8174878 | 0.8899642 |
| a21 | Irvine | 0.1549416 | 0.04437 | 0.0007 | 0.0668905 | 0.2429927 |
| b21 | Irvine | 0.8133143 | 0.056582 | <0.0001 | 0.7010291 | 0.9255995 |
| a22 | Irvine | 0.2409955 | 0.009794 | <0.0001 | 0.2215605 | 0.2604306 |
| b22 | Irvine | 0.7599255 | 0.016019 | <0.0001 | 0.7281361 | 0.7917148 |
| a23 | Irvine | 0.3676387 | 0.006727 | <0.0001 | 0.354289 | 0.3809884 |
| b23 | Irvine | 0.6365934 | 0.013302 | <0.0001 | 0.610197 | 0.6629898 |
| a24 | Irvine | 0.6111595 | 0.005233 | <0.0001 | 0.6007753 | 0.6215436 |
| b24 | Irvine | 0.3750707 | 0.012455 | <0.0001 | 0.3503533 | 0.3997881 |
| a31 | Concord | 0.2178195 | 0.054153 | 0.0001 | 0.1103556 | 0.3252834 |
| b31 | Concord | 0.7662501 | 0.059585 | <0.0001 | 0.6480046 | 0.8844955 |
| a32 | Concord | 0.4683952 | 0.006963 | <0.0001 | 0.4545781 | 0.4822122 |
| b32 | Concord | 0.5280021 | 0.008753 | <0.0001 | 0.5106317 | 0.5453725 |
| a33 | Concord | 0.7032752 | 0.003769 | <0.0001 | 0.6957962 | 0.7107542 |
| b33 | Concord | 0.2892382 | 0.005362 | <0.0001 | 0.2785979 | 0.2998785 |
| a41 | Point Breeze | 0.172284 | 0.051962 | 0.0013 | 0.0691663 | 0.2754018 |
| b41 | Point Breeze | 0.8173187 | 0.05337 | <0.0001 | 0.7114079 | 0.9232295 |
| a42 | Point Breeze | 0.6223457 | 0.003494 | <0.0001 | 0.615411 | 0.6292803 |
| b42 | Point Breeze | 0.3702626 | 0.003788 | <0.0001 | 0.3627463 | 0.3777789 |
| a43 | Point Breeze | 0.8837642 | 0.001389 | <0.0001 | 0.8810072 | 0.8865211 |
| b43 | Point Breeze | 0.1116972 | 0.001614 | <0.0001 | 0.1084947 | 0.1148997 |
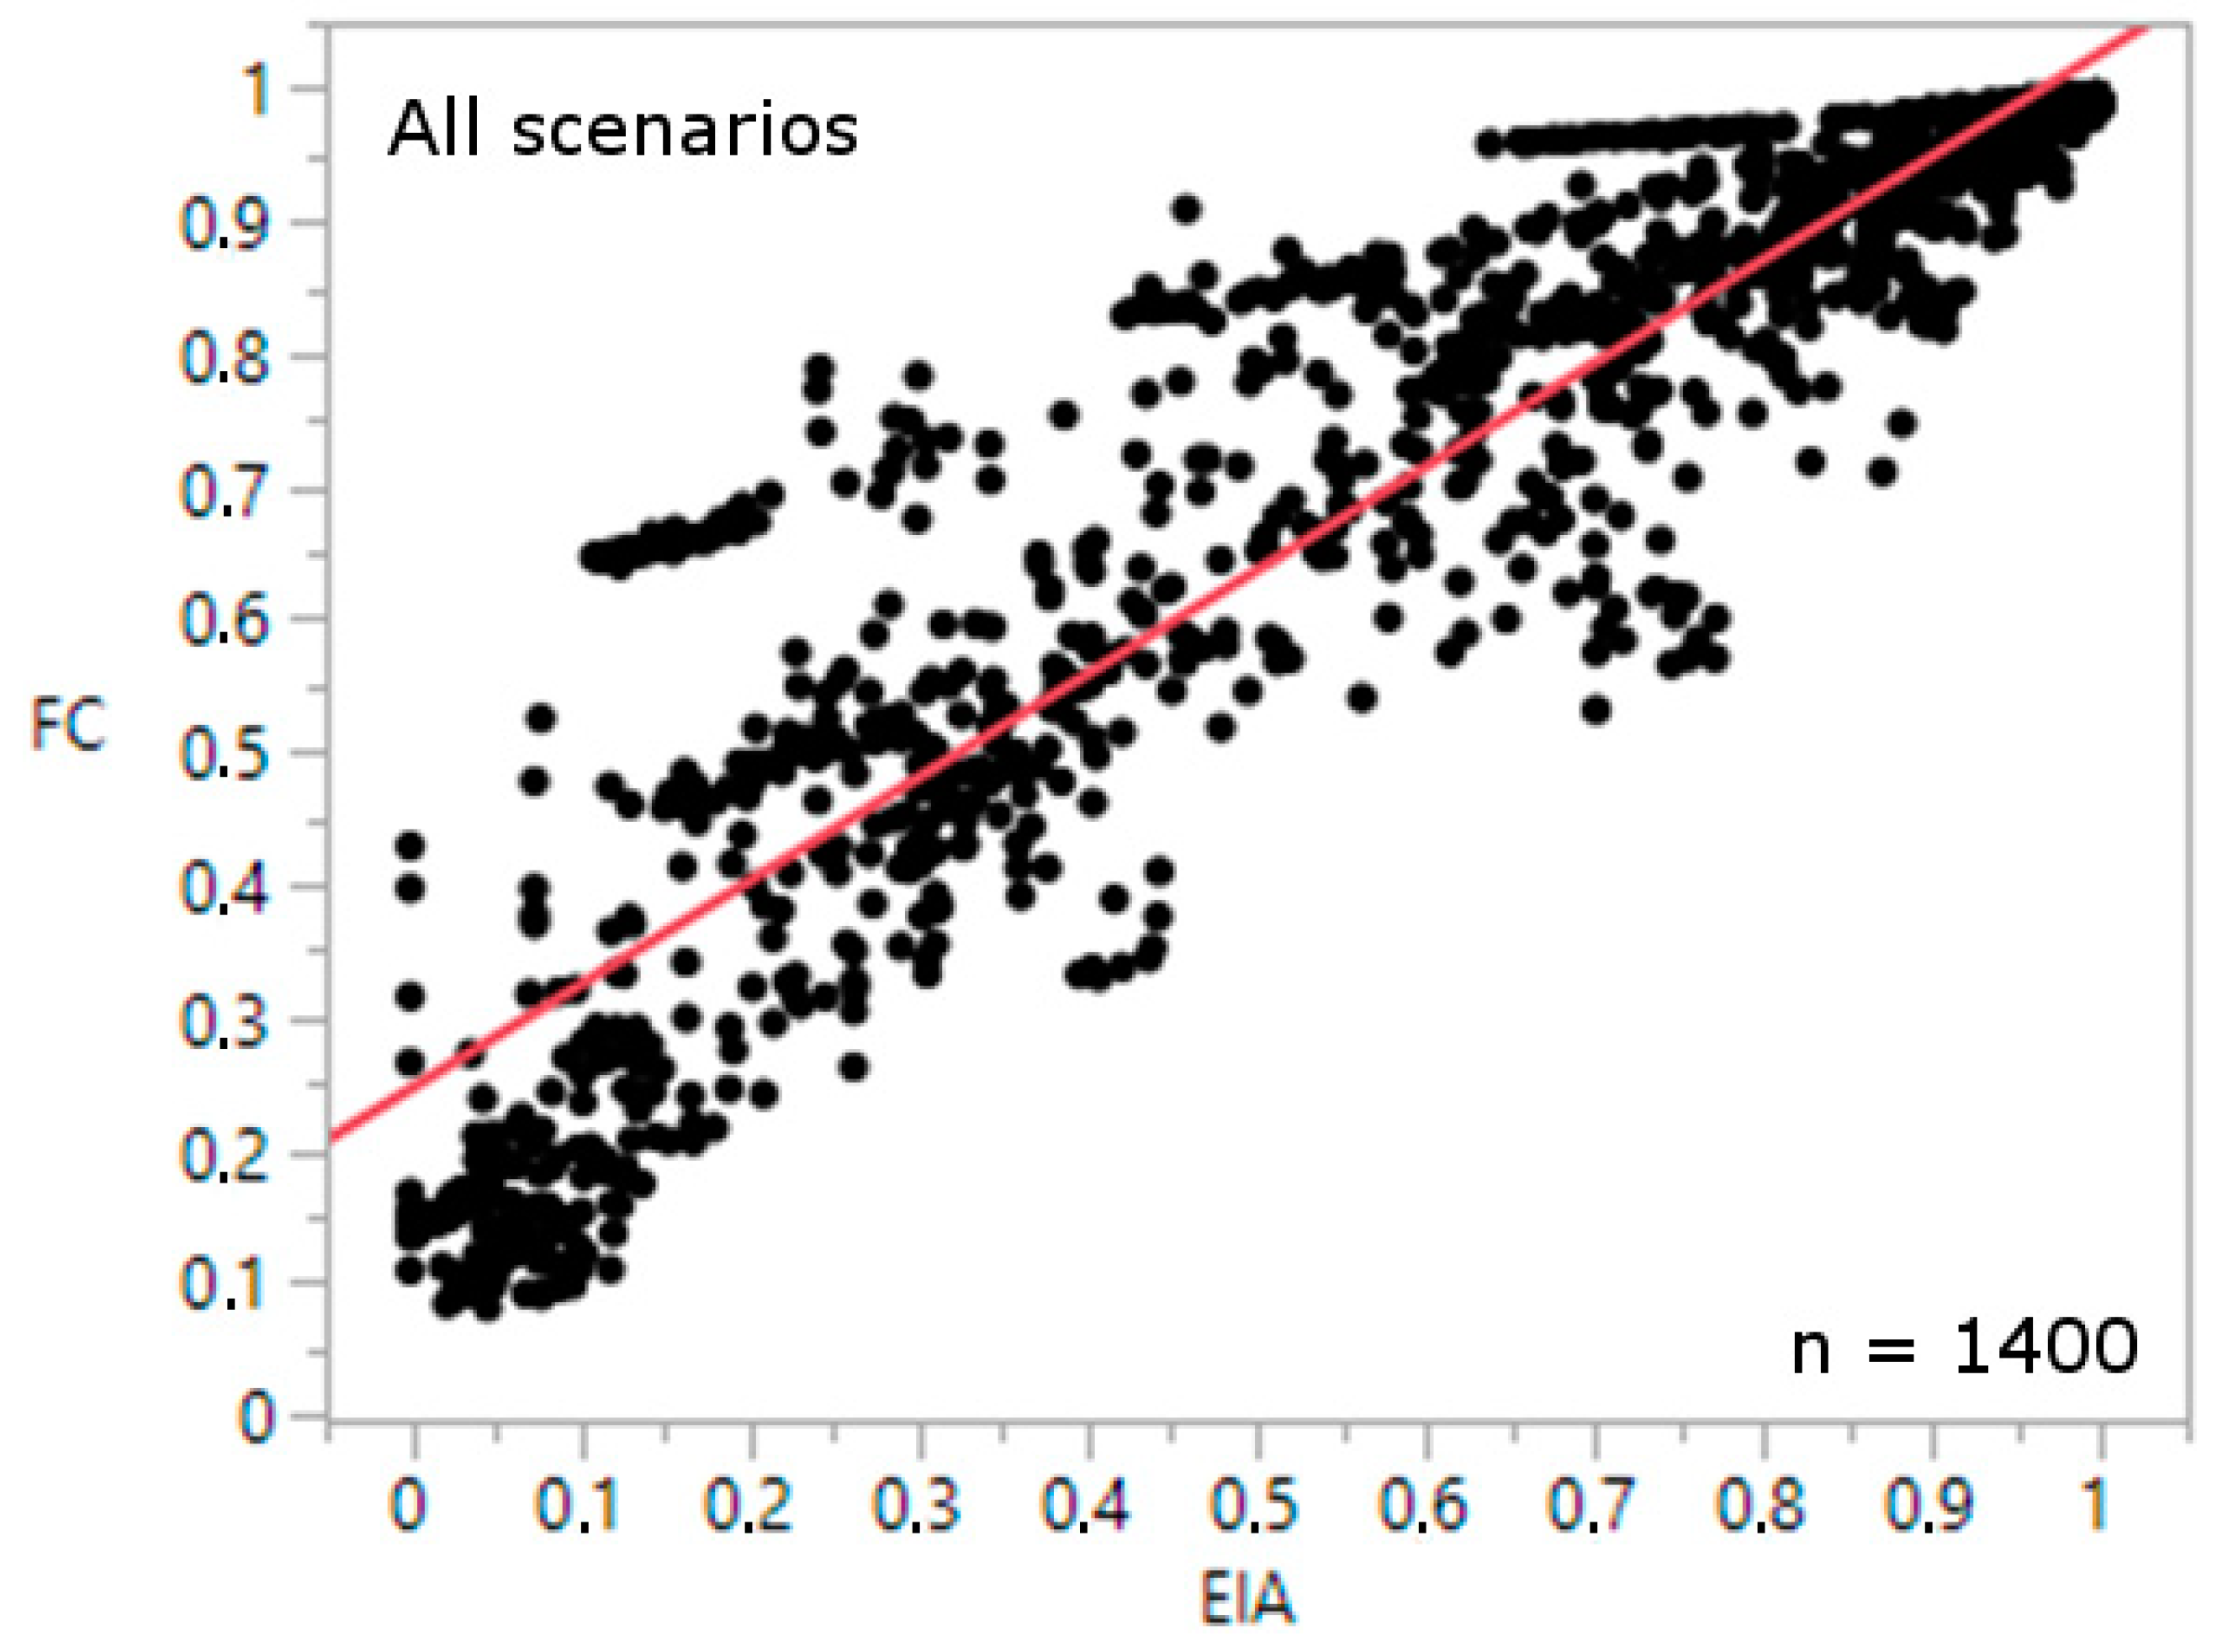
| a5 | All grids | 0.2456423 | 0.006088 | <0.0001 | 0.2336991 | 0.2575855 |
| b5 | All grids | 0.7823386 | 0.008998 | <0.0001 | 0.7646876 | 0.7999895 |
Appendix C
References
- Revi, A.; Aragón-Durand, F.; Corfee-Morlot, J.; Kiunsi, R.B.; Pelling, M.; Roberts, D.C.; Soleck, W. Urban areas. In Climate Change 2014: Impacts, Adaptation, and Vulnerability. Part A: Global and Sectoral Aspects. Contribution of Working Group II to the Fifth Assessment Report of the Intergovernmental Panel on Climate Change; IPCC: Geneva, Switzerland, 2014; pp. 535–612. [Google Scholar]
- Masson-Delmotte, V.; Zhai, P.; Pörtner, H.-O.; Roberts, D.; Skea, J.; Shukla, P.R.; Pirani, A.; Moufouma-Okia, W.; Péan, C.; Pidcock, R.; et al. IPCC, 2018: Global Warming of 1.5 °C. An IPCC Special Report on the Impacts of Global Warming of 1.5°C above Pre-industrial Levels and Related Global Greenhouse Gas Emission Pathways, in the Context of Strenghtening the Global Response to the Threat of cl; IPCC: Geneva, Switzerland, 2018; pp. 1–630. [Google Scholar]
- Jonkman, S.N.; Vrijling, J.K. Loss of life due to floods. J. Flood Risk Manag. 2008, 1, 43–56. [Google Scholar] [CrossRef]
- Kron, W.; Steuer, M.; Löw, P.; Wirtz, A. How to deal properly with a natural catastrophe database—Analysis of flood losses. Nat. Hazards Earth Syst. Sci. 2012, 12, 535–550. [Google Scholar] [CrossRef] [Green Version]
- Alaoui, A.; Rogger, M.; Peth, S.; Blöschl, G. Does soil compaction increase floods? A review. J. Hydrol. 2018, 557, 631–642. [Google Scholar] [CrossRef]
- Verbeiren, B.; Van De Voorde, T.; Canters, F.; Binard, M.; Cornet, Y.; Batelaan, O. Assessing urbanisation effects on rainfall-runoff using a remote sensing supported modelling strategy. Int. J. Appl. Earth Obs. Geoinf. 2013, 21, 92–102. [Google Scholar] [CrossRef]
- Zhang, P.; Ariaratnam, S.T. Meta-Analysis of Storm Water Impacts in Urbanized Cities Including Runoff Control and Mitigation Strategies. J. Sustain. Dev. 2018, 11, 27. [Google Scholar] [CrossRef] [Green Version]
- Pavolová, H.; Bakalár, T.; Kudelas, D.; Puškárová, P. Environmental and economic assessment of rainwater application in households. J. Clean. Prod. 2019, 209, 1119–1125. [Google Scholar] [CrossRef]
- Campisano, A.; Butler, D.; Ward, S.; Burns, M.J.; Friedler, E.; DeBusk, K.; Fisher-Jeffes, L.N.; Ghisi, E.; Rahman, A.; Furumai, H.; et al. Urban rainwater harvesting systems: Research, implementation and future perspectives. Water Res. 2017, 115, 195–209. [Google Scholar] [CrossRef]
- Arivukkarasu, D. Rainwater harvesting and greywater treatment systems for domestic application in India. Pollut. Res. 2014, 33, 597–603. [Google Scholar]
- Smets, V.; Akkermans, W.; Verbeiren, B.; Hermy, M.; Somers, B. Ex-situ estimation of interception storage capacity of small urban plant species. J. Hydrol. 2019, 572, 869–883. [Google Scholar] [CrossRef]
- Gregory, J.H.; Dukes, M.D.; Jones, P.H.; Miller, G.L. Effect of urban soil compaction on infiltration rate. J. Soil Water Conserv. 2006, 61, 117–124. [Google Scholar]
- Jacobson, C.R. Identification and quantification of the hydrological impacts of imperviousness in urban catchments: a review. J. Environ. Manage. 2011, 92, 1438–1448. [Google Scholar] [CrossRef] [PubMed]
- Alberti, M.; Booth, D.; Hill, K.; Coburn, B.; Avolio, C.; Coe, S.; Spirandelli, D. The impact of urban patterns on aquatic ecosystems: An empirical analysis in Puget lowland sub-basins. Landsc. Urban Plan. 2007, 80, 345–361. [Google Scholar] [CrossRef]
- Wong, T.H.F.; Allen, R.; Brown, R.R.; Deletić, A.; Gangadharan, L.; Gernjak, W.; Jakob, C.; Johnstone, P.; Reeder, M.; Tapper, N.; et al. Blueprint2013—Stormwater Management in a Water Sensitive City; Cooperative Research Centre for Water Sensitive Cities: Melbourne, Australia, 2013. [Google Scholar]
- Mayor, Á.G.; Bautista, S.; Small, E.E.; Dixon, M.; Bellot, J. Measurement of the connectivity of runoff source areas as determined by vegetation pattern and topography: A tool for assessing potential water and soil losses in drylands. Water Resour. Res. 2008, 44, 1–13. [Google Scholar] [CrossRef]
- Puigdefábregas, J. The role of vegetation patterns in structuring runoff and sediment fluxes in drylands. Earth Surf. Process. Landforms 2005, 30, 133–147. [Google Scholar] [CrossRef]
- Boer, M.; Puigdefábregas, J. Effects of spatially structured vegetation patterns on hillslope erosion in a semiarid Mediterranean environment: A simulation study. Earth Surf. Process. Landforms 2005, 30, 149–167. [Google Scholar] [CrossRef]
- Shields, C.; Tague, C. Ecohydrology in semiarid urban ecosystems: Modeling the relationship between connected impervious area and ecosystemproductivity. Water Resour. Res. 2015, 51, 302–319. [Google Scholar] [CrossRef]
- Boeing, G. OSMnx: New methods for acquiring, constructing, analyzing, and visualizing complex street networks. Comput. Environ. Urban Syst. 2017, 65, 126–139. [Google Scholar] [CrossRef] [Green Version]
- Boeing, G. A multi-scale analysis of 27,000 urban street networks: Every US city, town, urbanized area, and Zillow neighborhood. Environ. Plan. B Urban Anal. City Sci. 2018. [Google Scholar] [CrossRef] [Green Version]
- Gardner, R.H.; Urban, D.L. Neutral models for testing landscape hypotheses. Landsc. Ecol. 2007, 22, 15–29. [Google Scholar] [CrossRef]
- Kelly, G.; McCabe, H. A survey of procedural techniques for city generation. ITB J. 2006, 7. [Google Scholar]
- Smelik, R.M.; de Kraker, K.J.; Groenewegen, S.A.; Tutenel, T.; Bidarra, R. A survey of procedural methods for terrain modelling. In Proceedings of the CASA 2009 Workshop on 3D Advanced Media In Gaming And Simulation, Amsterdam, The Netherland, 16 June 2009; pp. 25–34. [Google Scholar]
- Cadenasso, M.L.; Pickett, S.T.A.; Schwarz, K. Spatial heterogeneity in urban ecosystems: Reconceptualizing land cover and a framework for classification. Front. Ecol. Environ. 2007, 5, 80–88. [Google Scholar] [CrossRef]
- McGarigal, K.; Marks, B.J. FRAGSTATS: spatial pattern analysis program for quantifying landscape structure. In USDA Forest Service General Technical Report PNW; United States Department of Agriculture: Corvallis, OR, USA, 1994; pp. 1–134. [Google Scholar]
- Evelin, U.; Marc, A.; Juri, R.; Riho, M. Landscape Metrics and Indices: An Overview of Their Use in Landscape Research. Living Rev. Landsc. Res. 2009, 3, 1–28. [Google Scholar]
- Van Nieuwenhuyse, B.H.J.; Antoine, M.; Wyseure, G.; Govers, G. Pattern-process relationships in surface hydrology: Hydrological connectivity expressed in landscape metrics. Hydrol. Process. 2011, 25, 3760–3773. [Google Scholar] [CrossRef]
- Rui, X.F.; Liu, N.N.; LI, Q.L.; Liang, X. Present and future of hydrology. Water Sci. Eng. 2013, 6, 241–249. [Google Scholar]
- Salvadore, E.; Bronders, J.; Batelaan, O. Hydrological modelling of urbanized catchments: A review and future directions. J. Hydrol. 2015, 529, 62–81. [Google Scholar] [CrossRef]
- Beven, K. A manifesto for the equifinality thesis. J. Hydrol. 2006, 320, 18–36. [Google Scholar] [CrossRef] [Green Version]
- Sivapalan, M.; Blöschl, G.; Zhang, L.; Vertessy, R. Downward approach to hydrological prediction. Hydrol. Process. 2003, 17, 2101–2111. [Google Scholar] [CrossRef]
- Mishra, S.K.; Singh, V.P. Soil Conservation Service Curve Number (SCS-CN) Methodology; Springer Science & Business Media: Berlin, Germany, 2003. [Google Scholar]
- Ponce, V.M.; Hawkins, R.H. Runoff Curve Number: Has It Reached Maturity? J. Hydrol. Eng. 1996, 1, 11–19. [Google Scholar] [CrossRef]
- Lim, K.J.; Engel, B.A.; Muthukrishnan, S.; Harbor, J. Effects of initial abstraction and urbanization on estimated runoff using CN technology. J. Am. Water Resour. Assoc. 2006, 42, 629–643. [Google Scholar] [CrossRef]
- USDA Urban Hydrology for Small Watersheds. Soil Conserv. 1986, 55, 164.
- Siemens HEEDS MDO 2019.1. Available online: https://www.plm.automation.siemens.com/global/en/products/simcenter/simcenter-heeds.html (accessed on 5 June 2019).
- Huntington, D.E.; Lyrintzis, C.S. Improvements to and limitations of Latin hypercube sampling. Probabilistic Eng. Mech. 1998, 13, 245–253. [Google Scholar] [CrossRef]
- Croux, C. Catherine Dehon Robustness versus Efficiency for Nonparametric Correlation Measures. Recherche 2008. [Google Scholar]
- Sherpa-An Efficeint and Robust Optimization/Search Algorithm; Red Cedar Technology Sherpa: East Lansing, MI, USA, 2008; p. 3. ISBN 0064471004 (pbk.).
- Fox, J. Applied regression analysis, linear models, and related methods; Sage Publications: Thousand Oaks, CA, USA, 1997. [Google Scholar]
- Li, C.; Peng, C.; Chiang, P.C.; Cai, Y.; Wang, X.; Yang, Z. Mechanisms and applications of green infrastructure practices for stormwater control: A review. J. Hydrol. 2019, 568, 626–637. [Google Scholar] [CrossRef]
- Kuang, W. Mapping global impervious surface area and green space within urban environments. Sci. China Earth Sci. 2019. [Google Scholar] [CrossRef]
- Dunkerley, D. An approach to analysing plot scale infiltration and runoff responses to rainfall of fluctuating intensity. Hydrol. Process. 2017, 31, 191–206. [Google Scholar] [CrossRef]
- Kirchner, J.W. Getting the right answers for the right reasons: Linking measurements, analyses, and models to advance the science of hydrology. Water Resour. Res. 2006, 42, 1–5. [Google Scholar] [CrossRef]
- Wirion, C.; Bauwens, W.; Verbeiren, B. Using Remote Sensing Based Metrics to Quantify the Hydrological Response in a City. Water 2019, 11, 1763. [Google Scholar] [CrossRef] [Green Version]
- Malczewski, J. GIS-based multicriteria decision analysis: A survey of the literature. Int. J. Geogr. Inf. Sci. 2006, 20, 703–726. [Google Scholar] [CrossRef]



| Variable | Unit | Abbr. |
|---|---|---|
| Average area of impervious clusters | m2 | A |
| Number of impervious clusters | no. | NIC |
| Number of pervious clusters | no. | NPC |
| Standard deviation of impervious cluster size | m2 | STDIC |
| Size of the median impervious cluster | m2 | MIC |
| Size of the largest impervious cluster | m2 | LIC |
| Ratio of the effective impervious area to the total impervious area | / | EIA |
| Average flow path to outlet for each impervious pixel | m | FPOIP |
| Average flow path to nearest road for each impervious pixel | m | FPRIP |
| Average flow path from mass center impervious clusters to outlet | m | FPMICO |
| Average flow path from mass center impervious clusters to nearest road | m | FPMICR |
| Flow path largest impervious cluster to outlet | m | FPLICO |
| Flow path largest impervious cluster to nearest road | m | FPLICR |
| Proximity index impervious clusters to outlet | / | PXICO |
| Proximity index impervious clusters to nearest road | / | PXICR |
| Proximity index largest impervious cluster to outlet | / | PXLICO |
| Proximity index largest impervious cluster to nearest road | / | PXLICR |
| Pervious Fraction | ||||
| Reference | 0.20 | 0.40 | 0.60 | 0.80 |
| A | 0.40 | 0.76 | 0.78 | 0.35 |
| NIC | −0.40 | −0.76 | −0.78 | −0.35 |
| NPC | −0.74 | −0.63 | −0.45 | −0.12 |
| STDIC | 0.40 | 0.80 | 0.81 | 0.34 |
| MIC | 0.66 | 0.50 | 0.36 | 0.30 |
| LIC | −0.09 | 0.69 | 0.77 | 0.30 |
| EIA | 0.66 | 0.82 | 0.88 | 0.80 |
| FPOIP | −0.43 | −0.36 | −0.39 | −0.64 |
| FPMICO | 0.39 | 0.24 | 0.39 | −0.18 |
| FPLICO | −0.18 | −0.19 | −0.24 | −0.38 |
| PXICO | 0.38 | 0.73 | 0.78 | 0.35 |
| PXLICO | 0.59 | 0.72 | 0.88 | 0.53 |
| Pervious fraction | ||||
| Irvine | 0.20 | 0.40 | 0.60 | 0.80 |
| A | 0.69 | 0.90 | 0.93 | 0.93 |
| NIC | −0.69 | −0.90 | −0.93 | −0.93 |
| NPC | −0.78 | −0.60 | −0.38 | −0.15 |
| STDIC | 0.68 | 0.93 | 0.96 | 0.96 |
| MIC | −0.01 | −0.08 | 0.05 | 0.21 |
| LIC | −0.03 | 0.88 | 0.92 | 0.94 |
| EIA | 0.79 | 0.97 | 0.97 | 0.97 |
| FPOIP | −0.05 | −0.08 | 0.01 | 0.15 |
| FPRIP | −0.08 | 0.88 | −0.24 | −0.33 |
| FPMICO | 0.10 | −0.08 | −0.06 | 0.06 |
| FPMICR | −0.45 | −0.29 | −0.83 | −0.75 |
| FPLICO | 0.01 | −0.20 | 0.02 | 0.17 |
| FPLICR | 0.22 | 0.04 | −0.19 | 0.14 |
| PXICO | 0.64 | 0.88 | 0.93 | 0.94 |
| PXICR | 0.70 | 0.89 | 0.93 | 0.93 |
| PXLICO | 0.21 | 0.67 | 0.89 | 0.89 |
| PXLICR | 0.07 | 0.71 | 0.84 | 0.85 |
| Pervious Fraction | ||||
| Concord | 0.20 | 0.40 | 0.60 | 0.80 |
| A | 0.85 | 0.95 | 0.94 | - |
| NIC | −0.85 | −0.95 | −0.94 | - |
| NPC | −0.77 | −0.56 | −0.27 | - |
| STDIC | 0.85 | 0.96 | 0.93 | - |
| MIC | 0.83 | 0.80 | 0.83 | - |
| LIC | 0.39 | 0.88 | 0.86 | - |
| EIA | 0.80 | 0.98 | 0.98 | - |
| FPOIP | −0.11 | −0.07 | 0.06 | - |
| FPRIP | 0.04 | −0.09 | −0.14 | - |
| FPMICO | −0.03 | 0.16 | 0.30 | - |
| FPMICR | 0.40 | −0.69 | −0.88 | - |
| FPLICO | −0.18 | 0.07 | 0.08 | - |
| FPLICR | 0.05 | 0.19 | 0.29 | - |
| PXICO | 0.75 | 0.94 | 0.94 | - |
| PXICR | 0.85 | 0.94 | 0.93 | - |
| PXLICO | 0.27 | 0.67 | 0.79 | - |
| PXLICR | 0.38 | 0.48 | 0.63 | - |
| Pervious Fraction | ||||
| Point B. | 0.20 | 0.40 | 0.60 | 0.80 |
| A | 0.93 | 0.97 | 0.97 | - |
| NIC | −0.93 | −0.97 | −0.97 | - |
| NPC | −0.77 | −0.50 | −0.13 | - |
| STDIC | 0.88 | 0.93 | 0.92 | - |
| MIC | 0.83 | 0.91 | 0.88 | - |
| LIC | 0.66 | 0.75 | −0.03 | - |
| EIA | 0.84 | 0.99 | 0.99 | - |
| FPOIP | 0.04 | 0.01 | 0.07 | - |
| FPRIP | 0.10 | −0.16 | −0.48 | - |
| FPMICO | −0.09 | −0.10 | 0.04 | - |
| FPMICR | 0.79 | 0.54 | −0.21 | - |
| FPLICO | −0.15 | 0.08 | 0.06 | - |
| FPLICR | −0.25 | −0.54 | 0.01 | - |
| PXICO | 0.89 | 0.96 | 0.97 | - |
| PXICR | 0.90 | 0.97 | 0.96 | - |
| PXLICO | 0.17 | 0.22 | 0.71 | - |
| PXLICR | 0.67 | 0.59 | 0.72 | - |
| Metric | Model Function | Grid Scenario | Pervious (%) | Parameters | R2 | RMSE | ANOVA |
|---|---|---|---|---|---|---|---|
| A | Logarithmic | Reference | all | a1, b1 | 0.49 | 0.16 | <0.0001 |
| Irvine | all | a2, b2 | 0.60 | 0.10 | <0.0001 | ||
| Concord | all | a3, b3 | 0.73 | 0.03 | <0.0001 | ||
| Point Breeze | all | a4, b4 | 0.69 | 0.01 | <0.0001 | ||
| EIA | Linear | Reference | all | a11, b11 | 0.85 | 0.09 | <0.0001 |
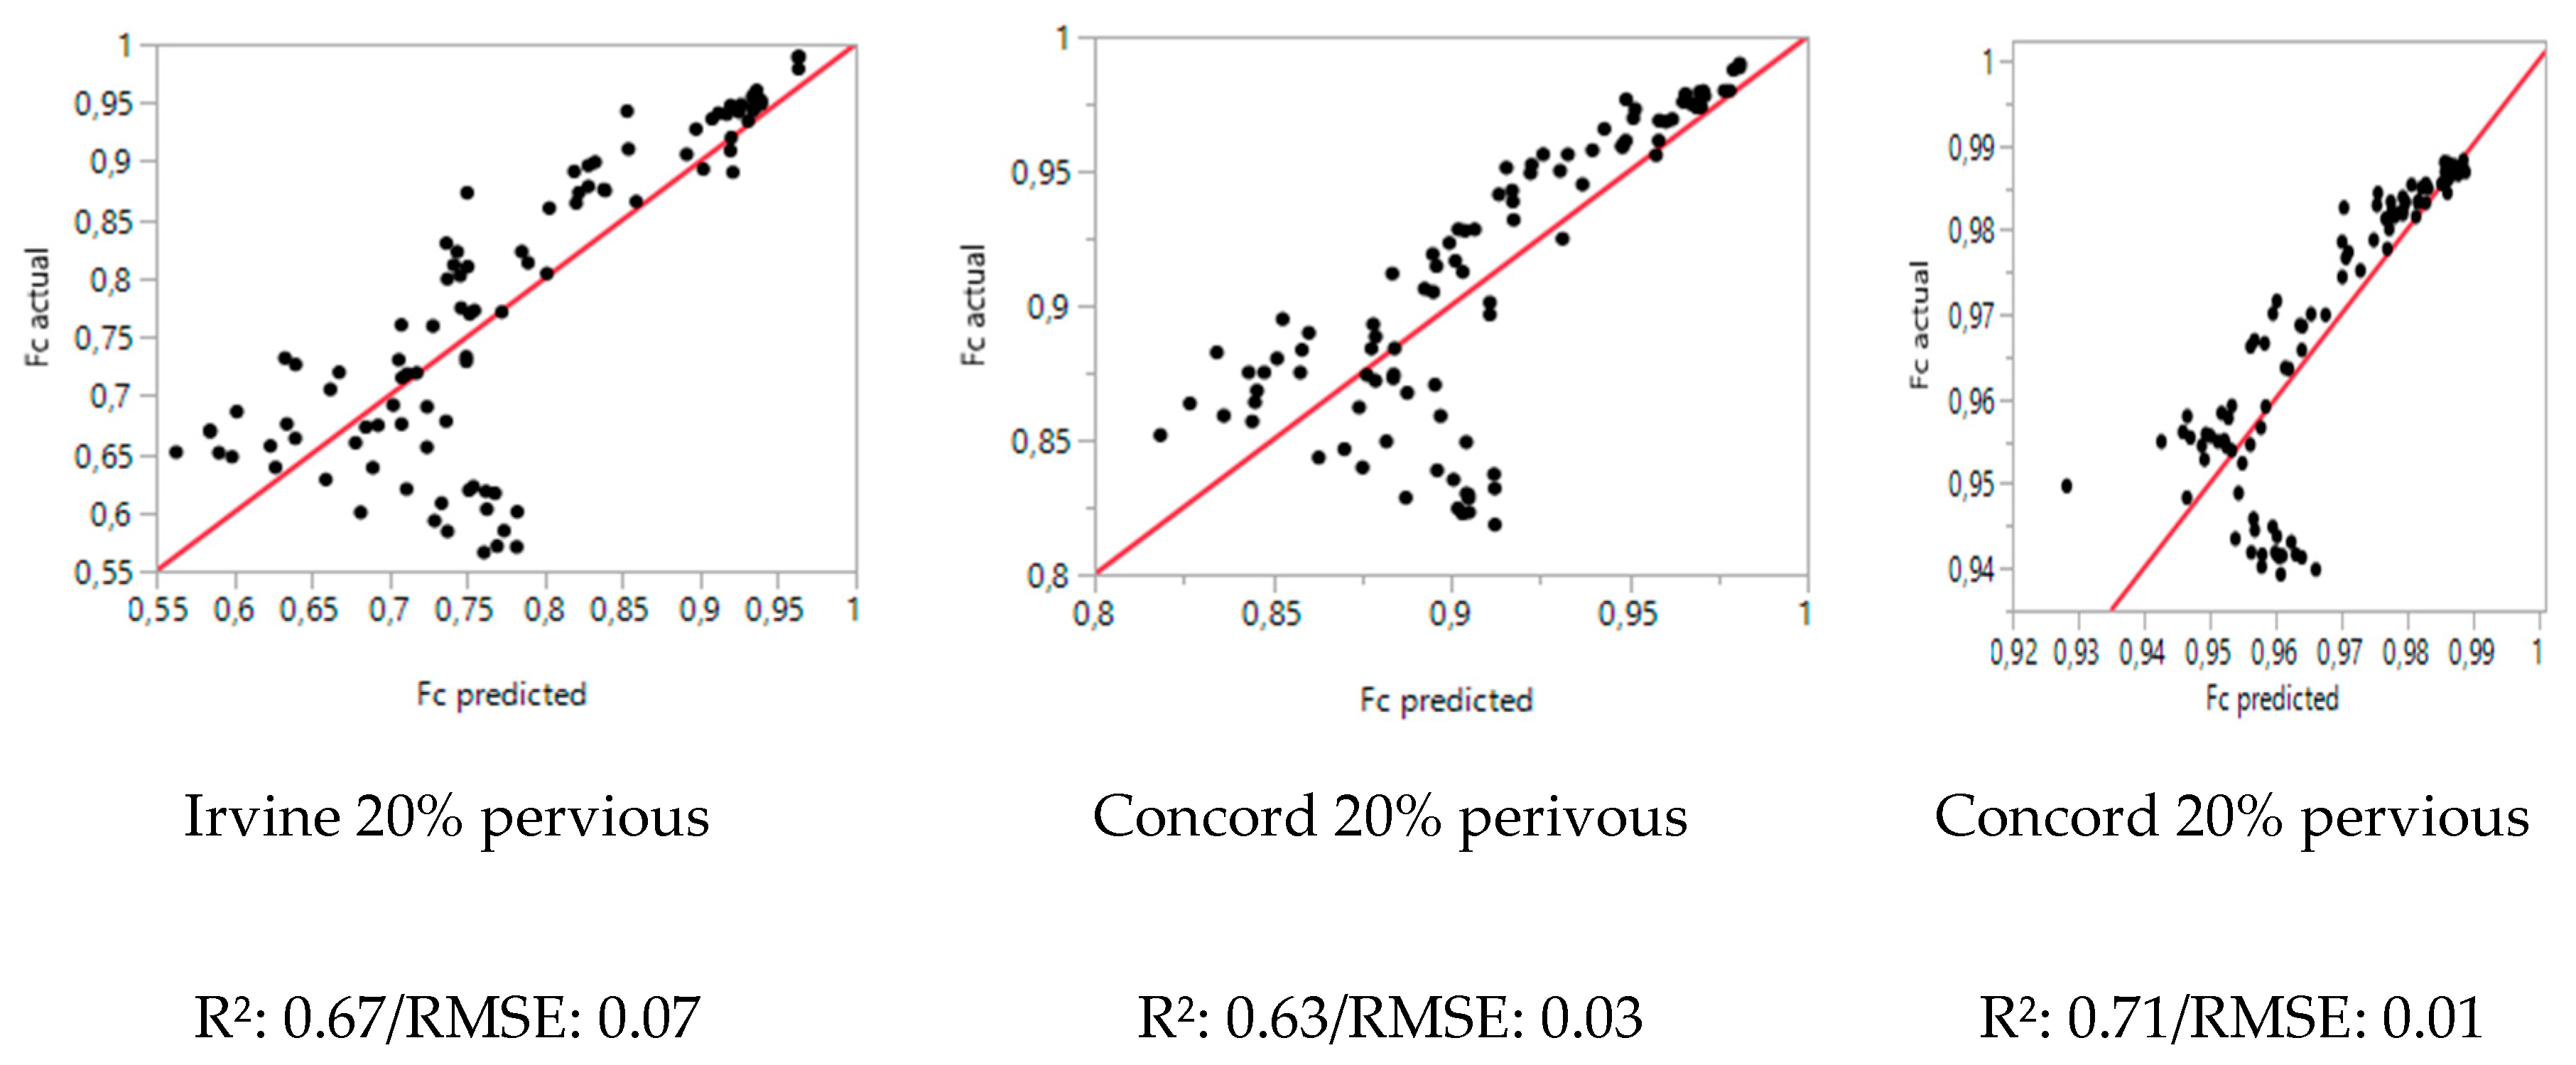
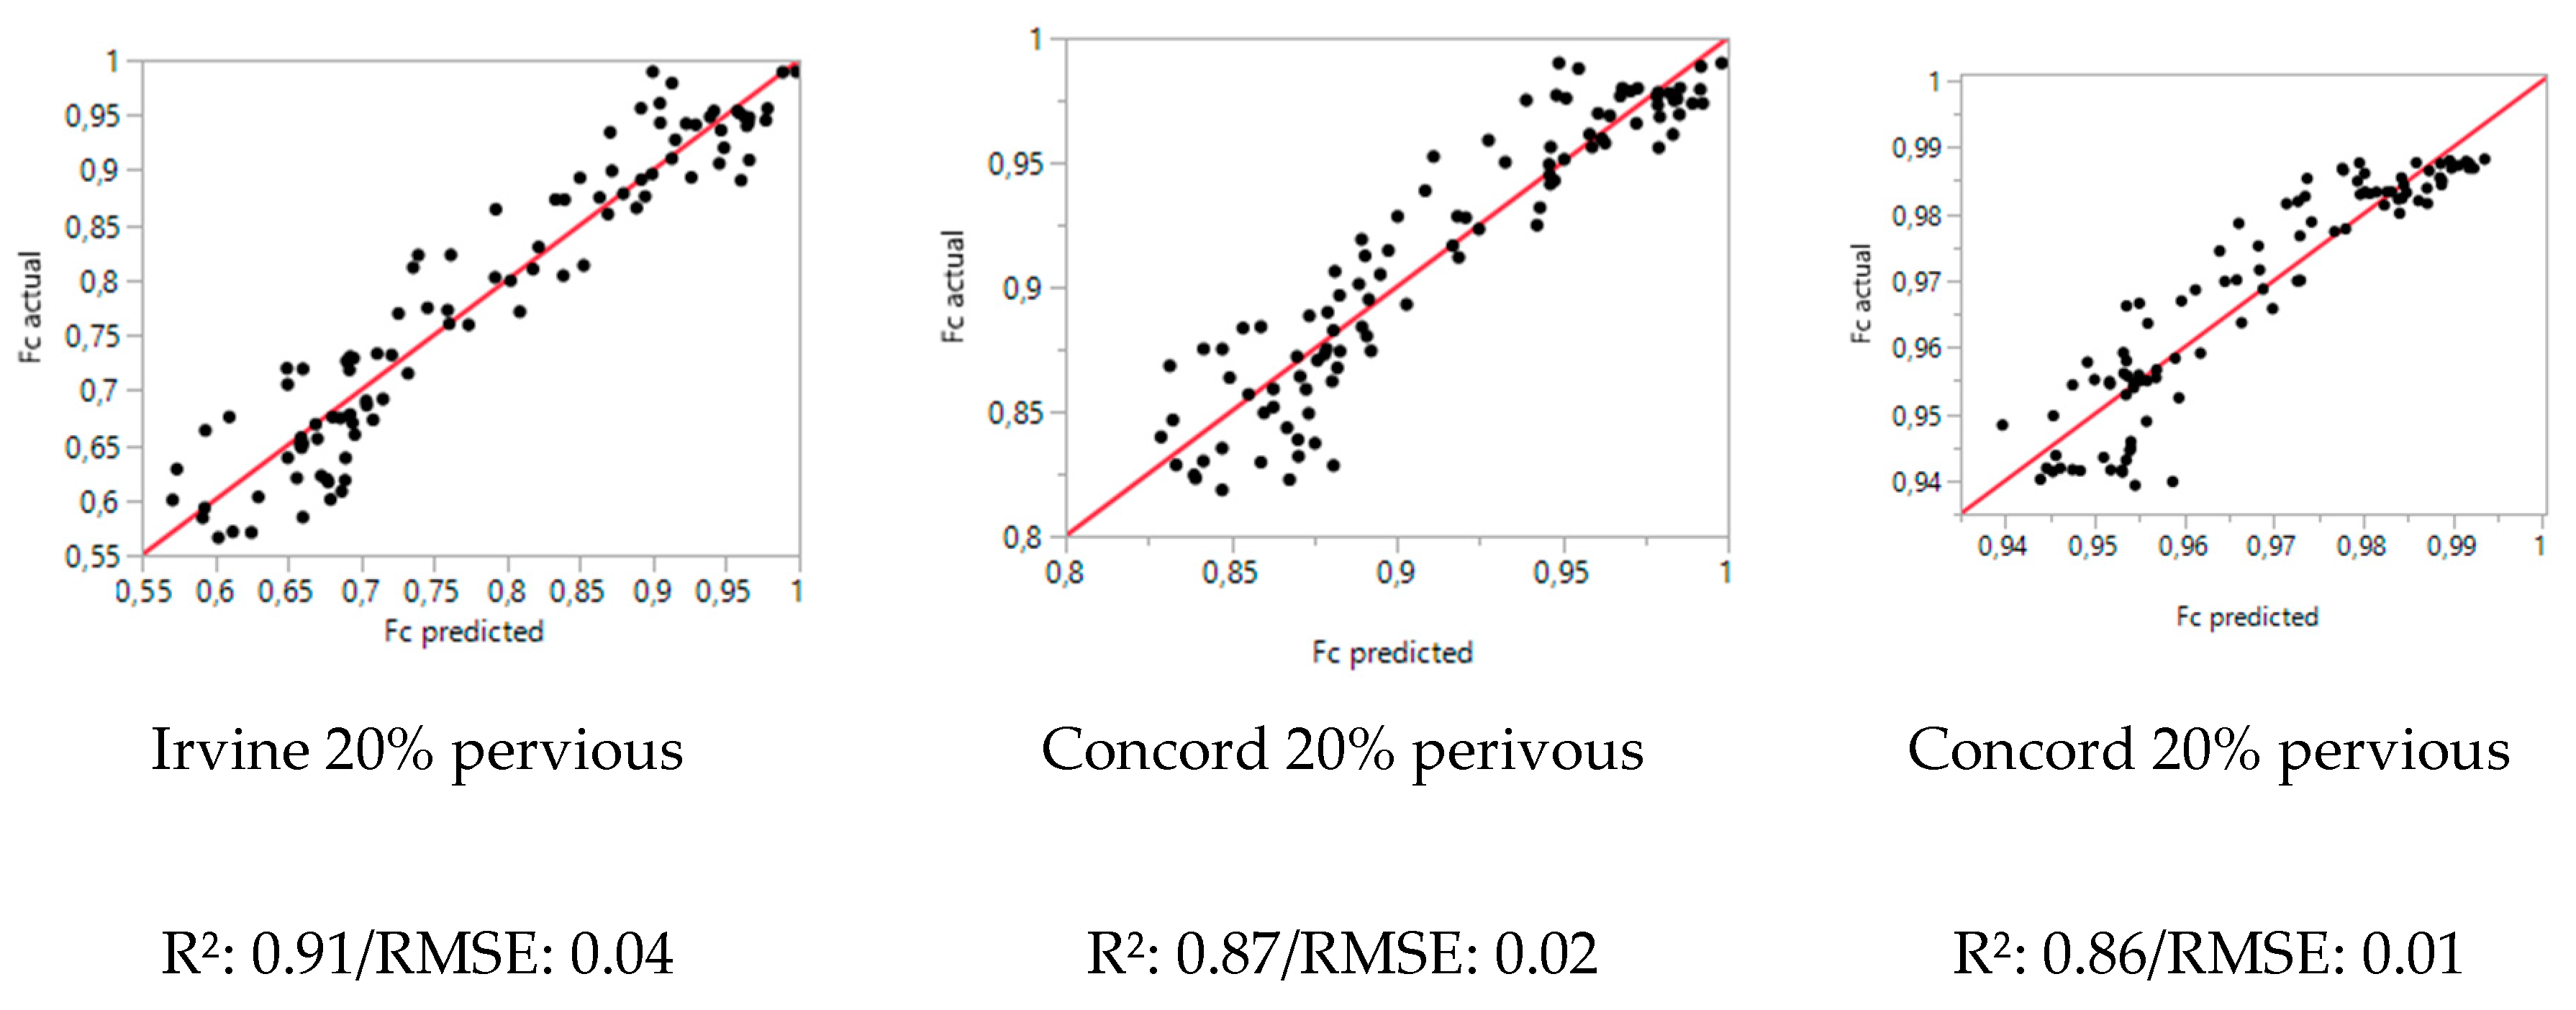
| Irvine | 20 | a21, b21 | 0.68 | 0.07 | <0.0001 | ||
| 40 | a22, b22 | 0.96 | 0.04 | <0.0001 | |||
| 60 | a23, b23 | 0.96 | 0.03 | <0.0001 | |||
| 80 | a24, b24 | 0.90 | 0.03 | <0.0001 | |||
| Concord | 20 | a31, b31 | 0.63 | 0.03 | <0.0001 | ||
| 40 | a32, b32 | 0.97 | 0.01 | <0.0001 | |||
| 60 | a33,b33 | 0.97 | 0.01 | <0.0001 | |||
| Point Breeze | 20 | a41, b41 | 0.71 | 0.01 | <0.0001 | ||
| 40 | a42, b42 | 0.99 | 0.00 | <0.0001 | |||
| 60 | a43, b43 | 0.98 | 0.00 | <0.0001 | |||
| All grids | all | a5, b5 | 0.85 | 0.11 | <0.0001 |
© 2019 by the authors. Licensee MDPI, Basel, Switzerland. This article is an open access article distributed under the terms and conditions of the Creative Commons Attribution (CC BY) license (http://creativecommons.org/licenses/by/4.0/).
Share and Cite
Smets, V.; Verbeiren, B.; Hermy, M.; Somers, B. Urban Spatial Configuration and Functional Runoff Connectivity: Influence of Drainage Grid Density and Landscape Metrics. Water 2019, 11, 2661. https://doi.org/10.3390/w11122661
Smets V, Verbeiren B, Hermy M, Somers B. Urban Spatial Configuration and Functional Runoff Connectivity: Influence of Drainage Grid Density and Landscape Metrics. Water. 2019; 11(12):2661. https://doi.org/10.3390/w11122661
Chicago/Turabian StyleSmets, Vincent, Boud Verbeiren, Martin Hermy, and Ben Somers. 2019. "Urban Spatial Configuration and Functional Runoff Connectivity: Influence of Drainage Grid Density and Landscape Metrics" Water 11, no. 12: 2661. https://doi.org/10.3390/w11122661
APA StyleSmets, V., Verbeiren, B., Hermy, M., & Somers, B. (2019). Urban Spatial Configuration and Functional Runoff Connectivity: Influence of Drainage Grid Density and Landscape Metrics. Water, 11(12), 2661. https://doi.org/10.3390/w11122661


