Performance of A Two-Dimensional Hydraulic Model for the Evaluation of Stranding Areas and Characterization of Rapid Fluctuations in Hydropeaking Rivers
Abstract
:1. Introduction
2. Materials and Methods
2.1. Study Site
Technical Details for Hol 1 Power Station
2.2. Characterization of Rapid Fluctuations
2.3. River Geometry
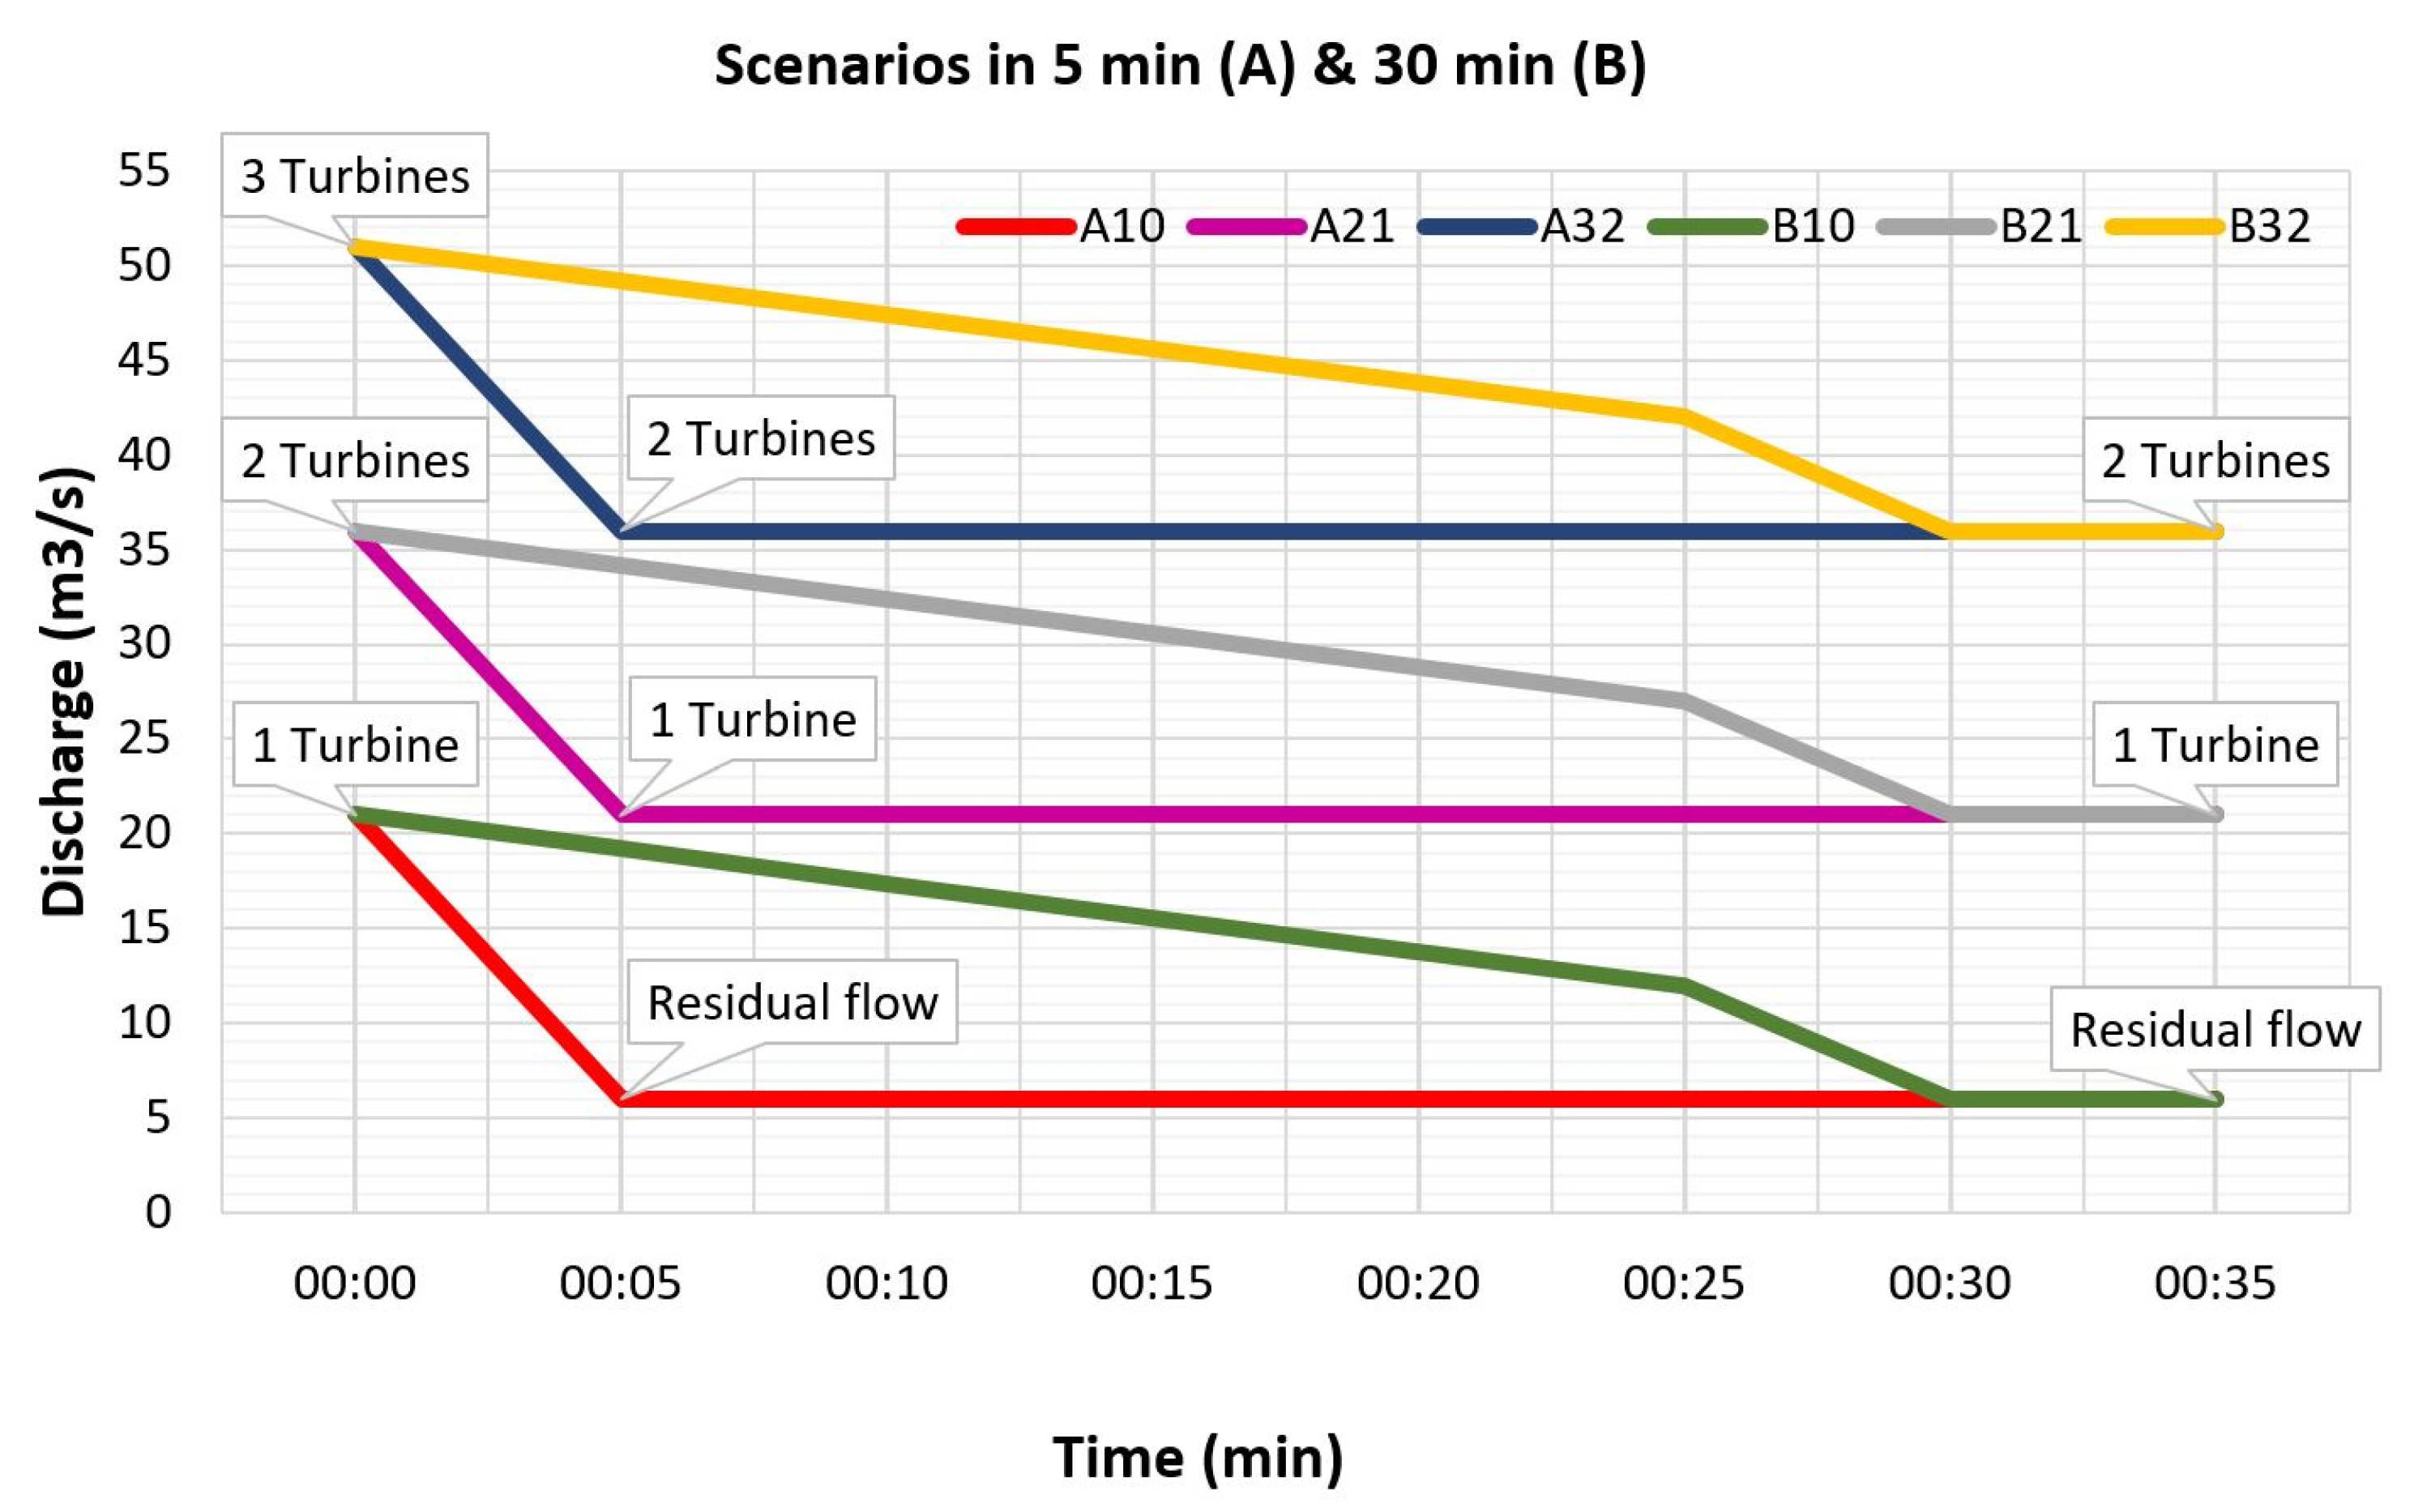
2.4. Scenarios
2.5. Hydraulic Model Set-Up and Calibration
2.5.1. Variation of Wetted Areas
2.5.2. Consideration of Damping Effect in Dewatering Ramping Rate along the Stream
2.5.3. Evaluation of Dewatering Ramping Rate
3. Results
3.1. Characterization of Flow and Rapid Fluctuations
3.1.1. Discharge Value at Start and End of The Fluctuations
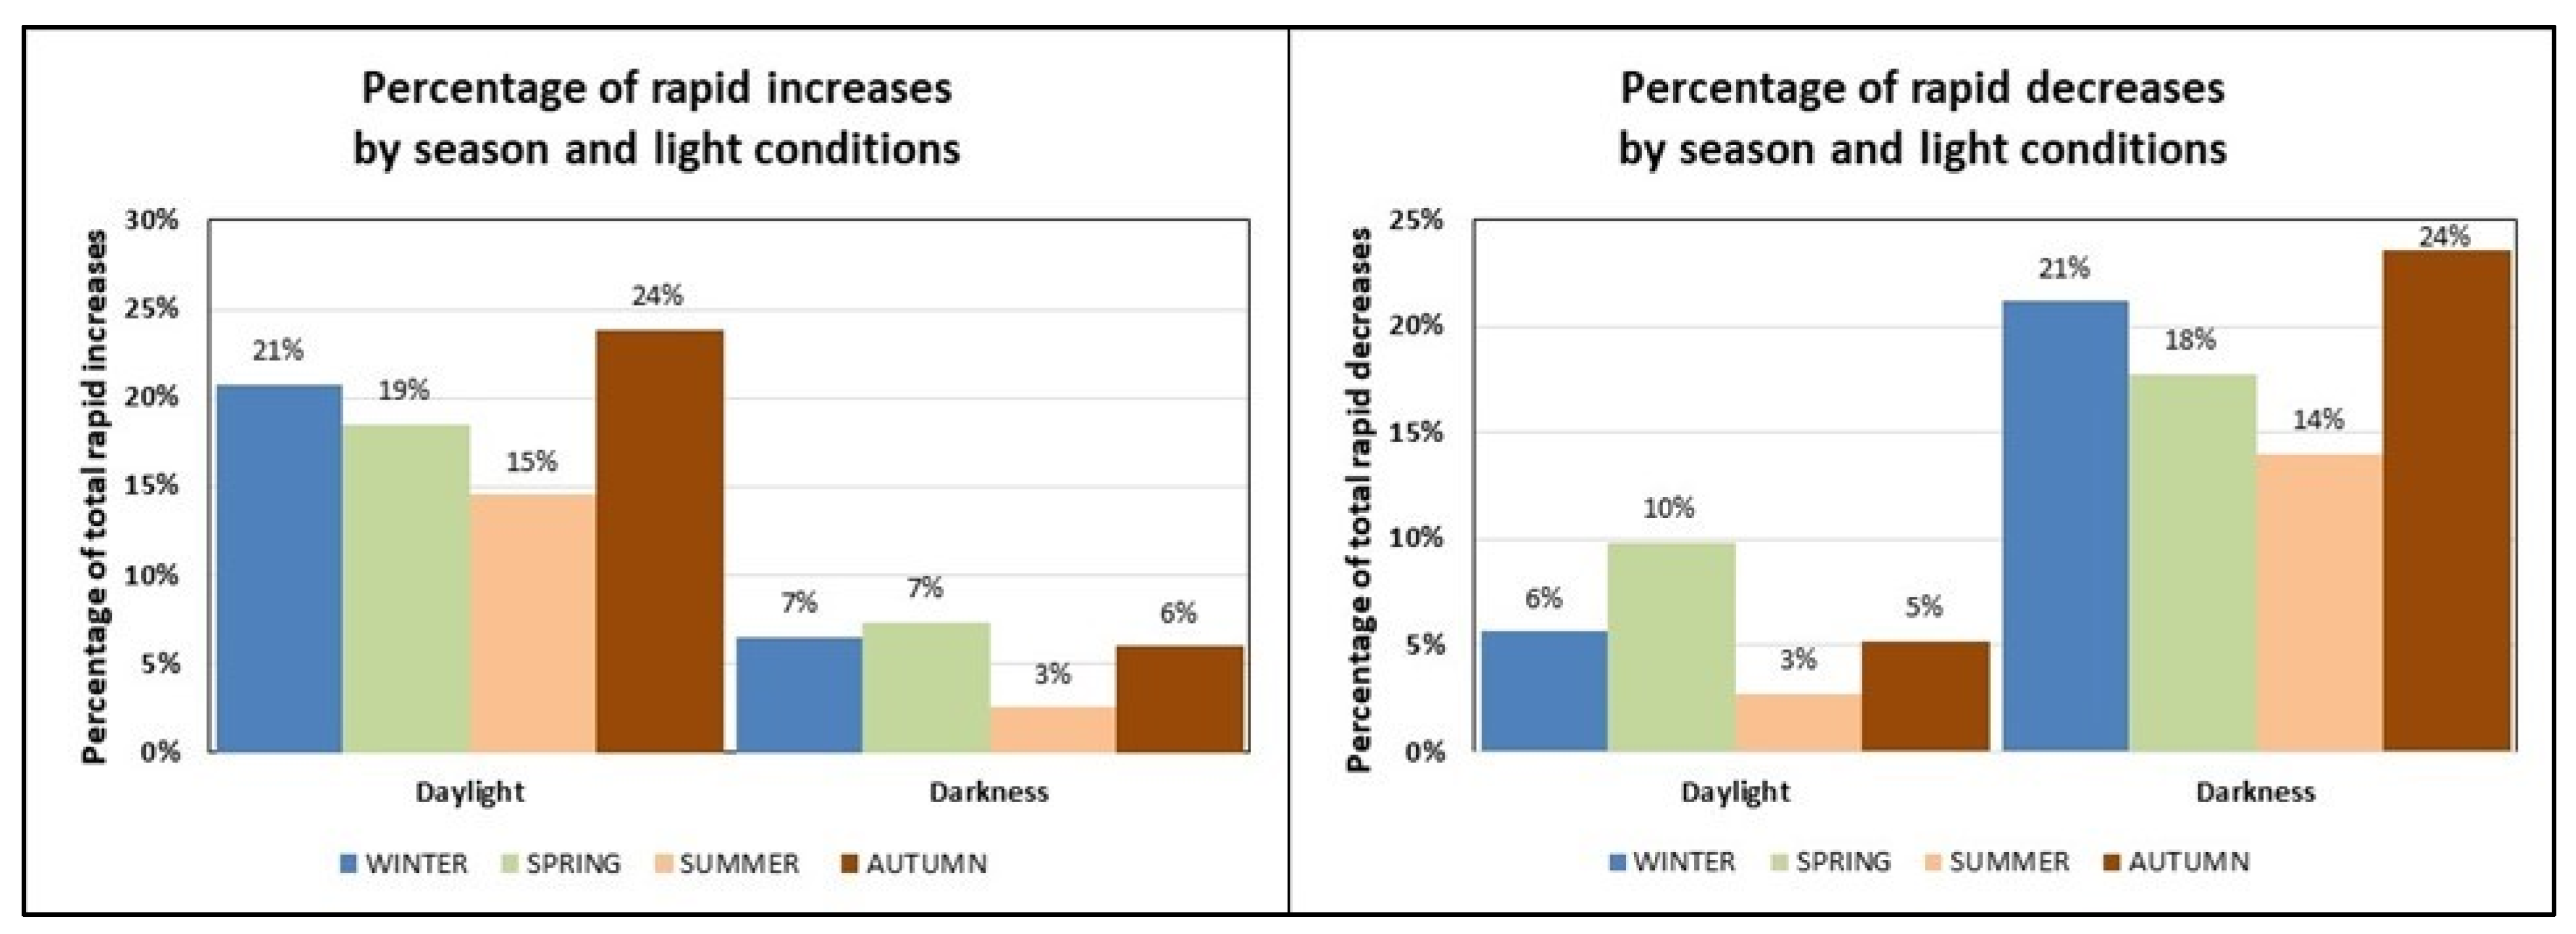
3.1.2. Seasonal Analysis
3.2. Hydraulic Modelling
3.2.1. Variation of Wetted Area
3.2.2. Consideration of Damping Effect in Dewatering Ramping Rate along the Stream
3.2.3. Dewatering Ramping Rate
3.3. Cost of Changing Operation
4. Discussion
4.1. Characterization of Flow
4.2. Performance of 2D Model Based on LiDAR
4.3. Evaluation of Stranding Areas Based on Two Main Hydro-Morphological Features: Wetted Area and the Dewatering Rate
4.4. Alternative Operation Procedure
4.5. Transferability of The Method
4.6. Future Directions
5. Conclusions
Author Contributions
Funding
Acknowledgments
Conflicts of Interest
Appendix A. Dewatering Speed Scenarios

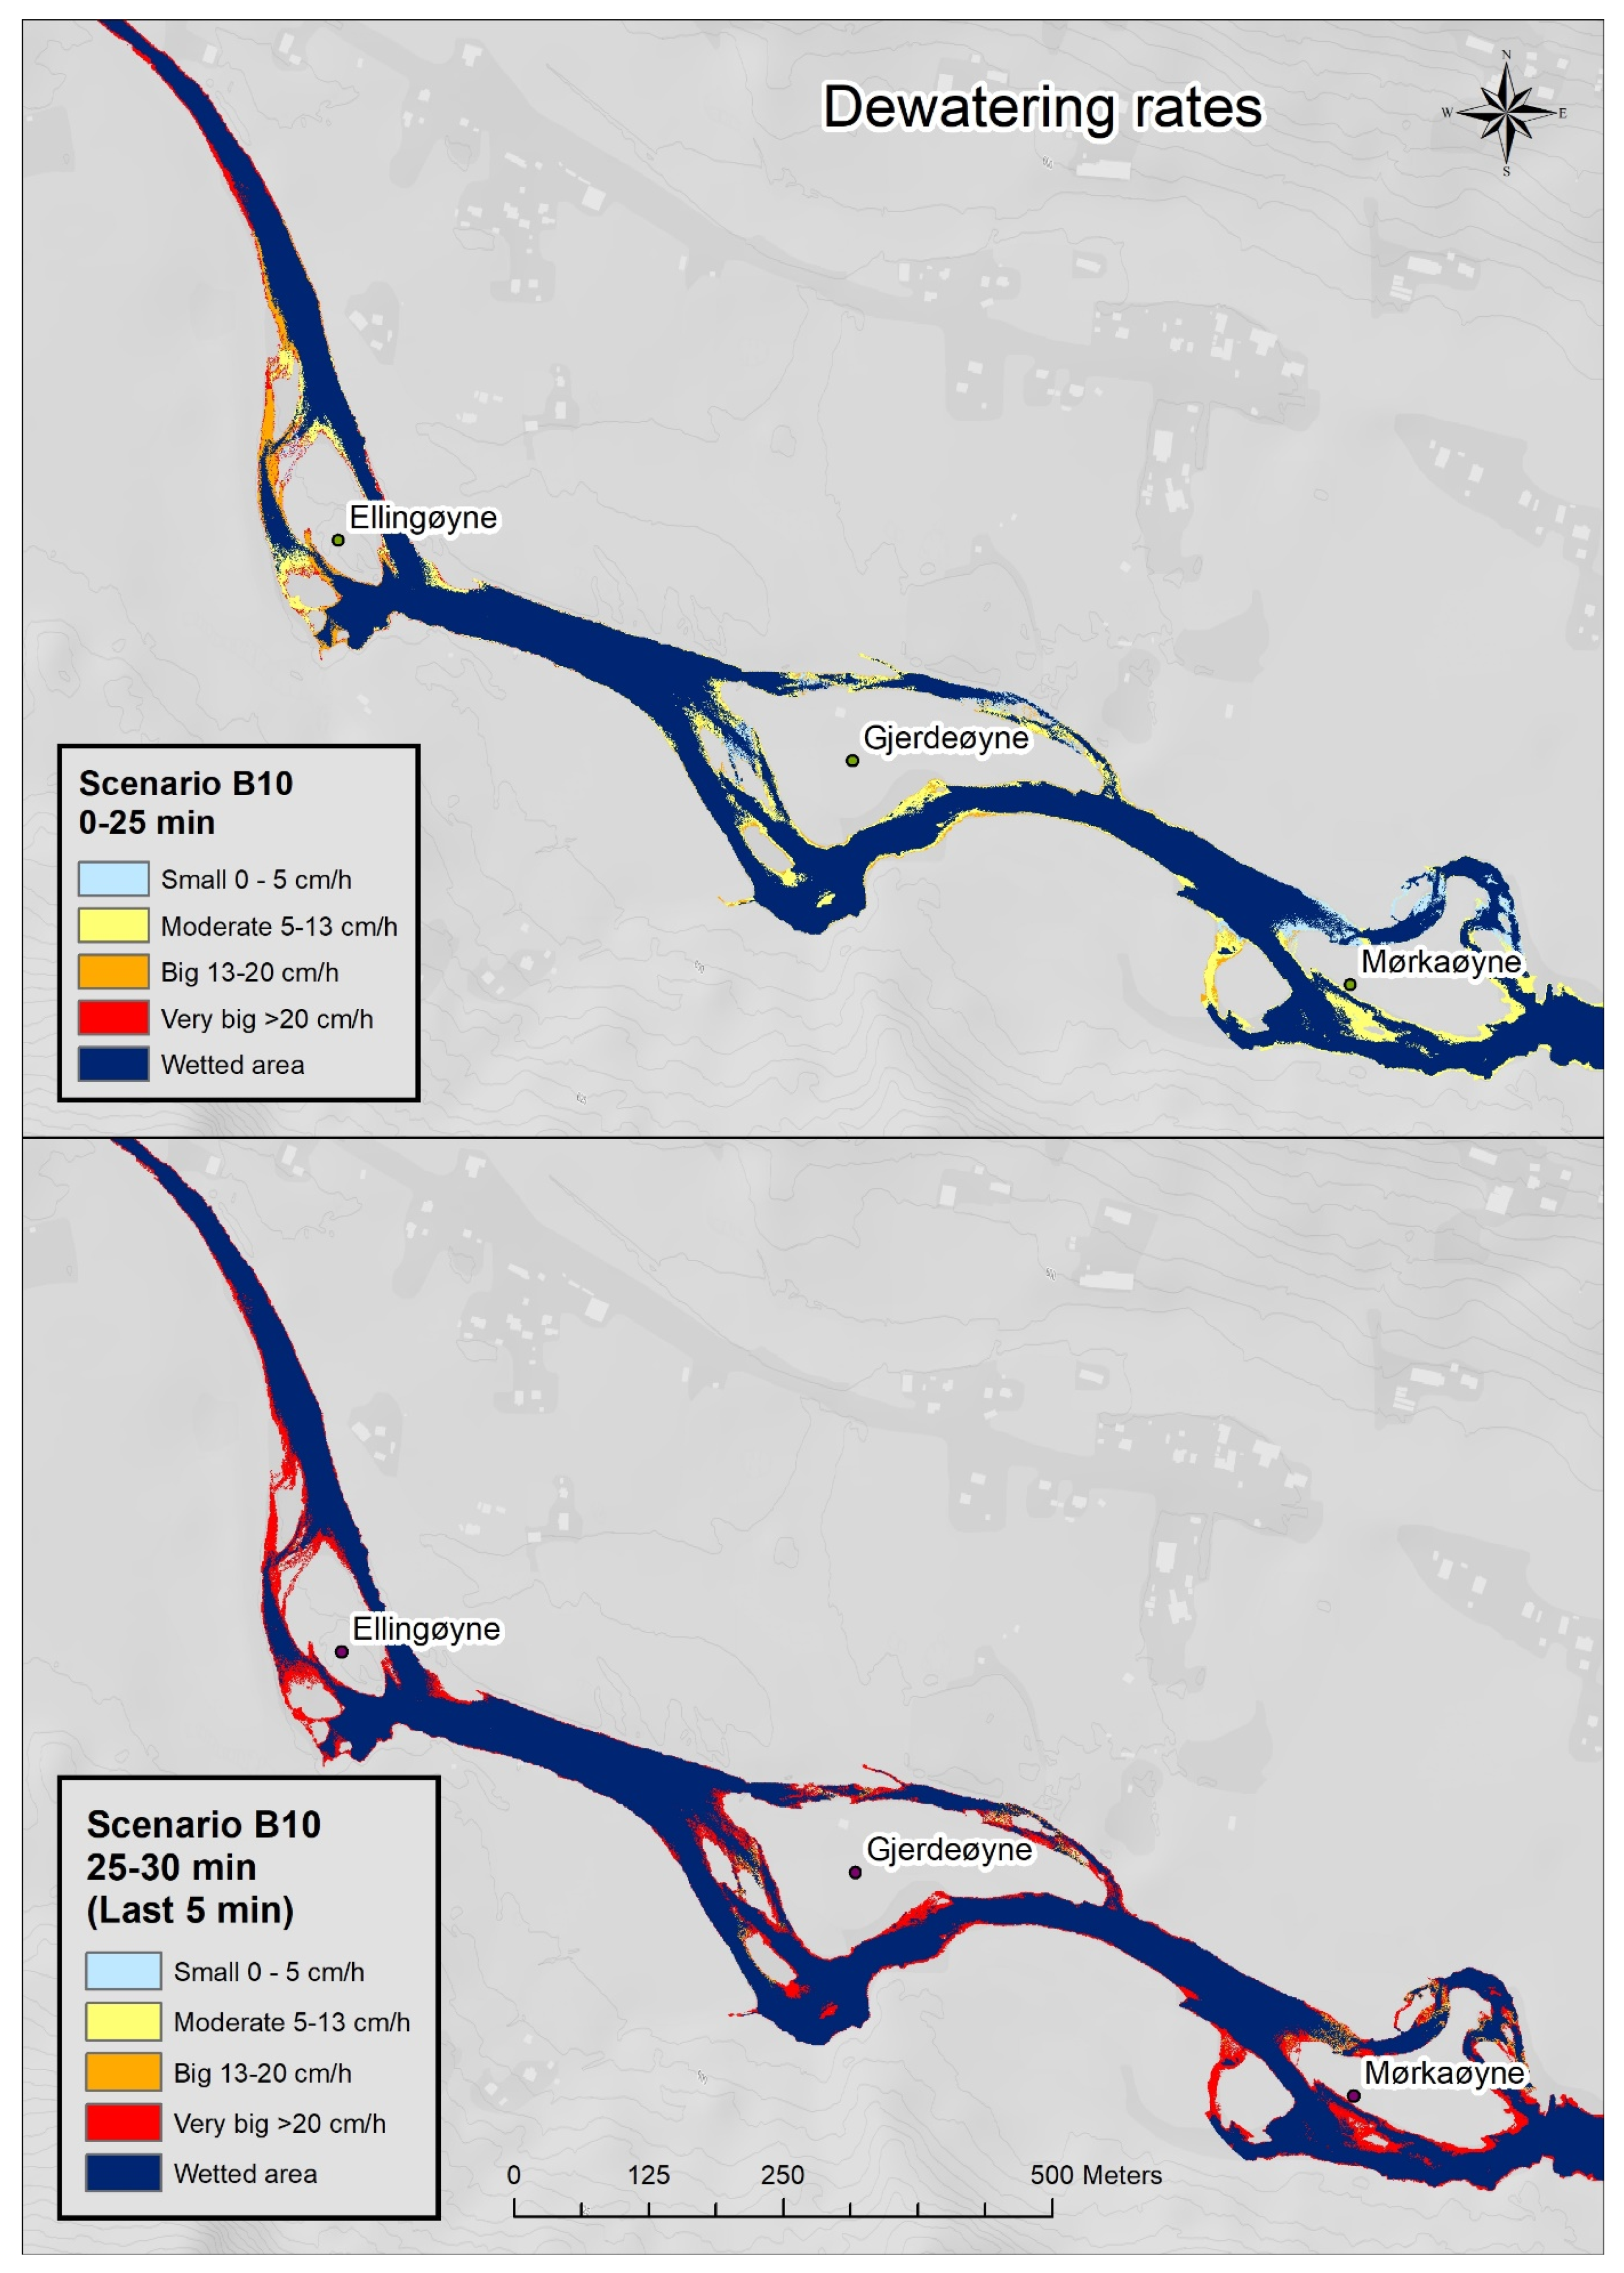
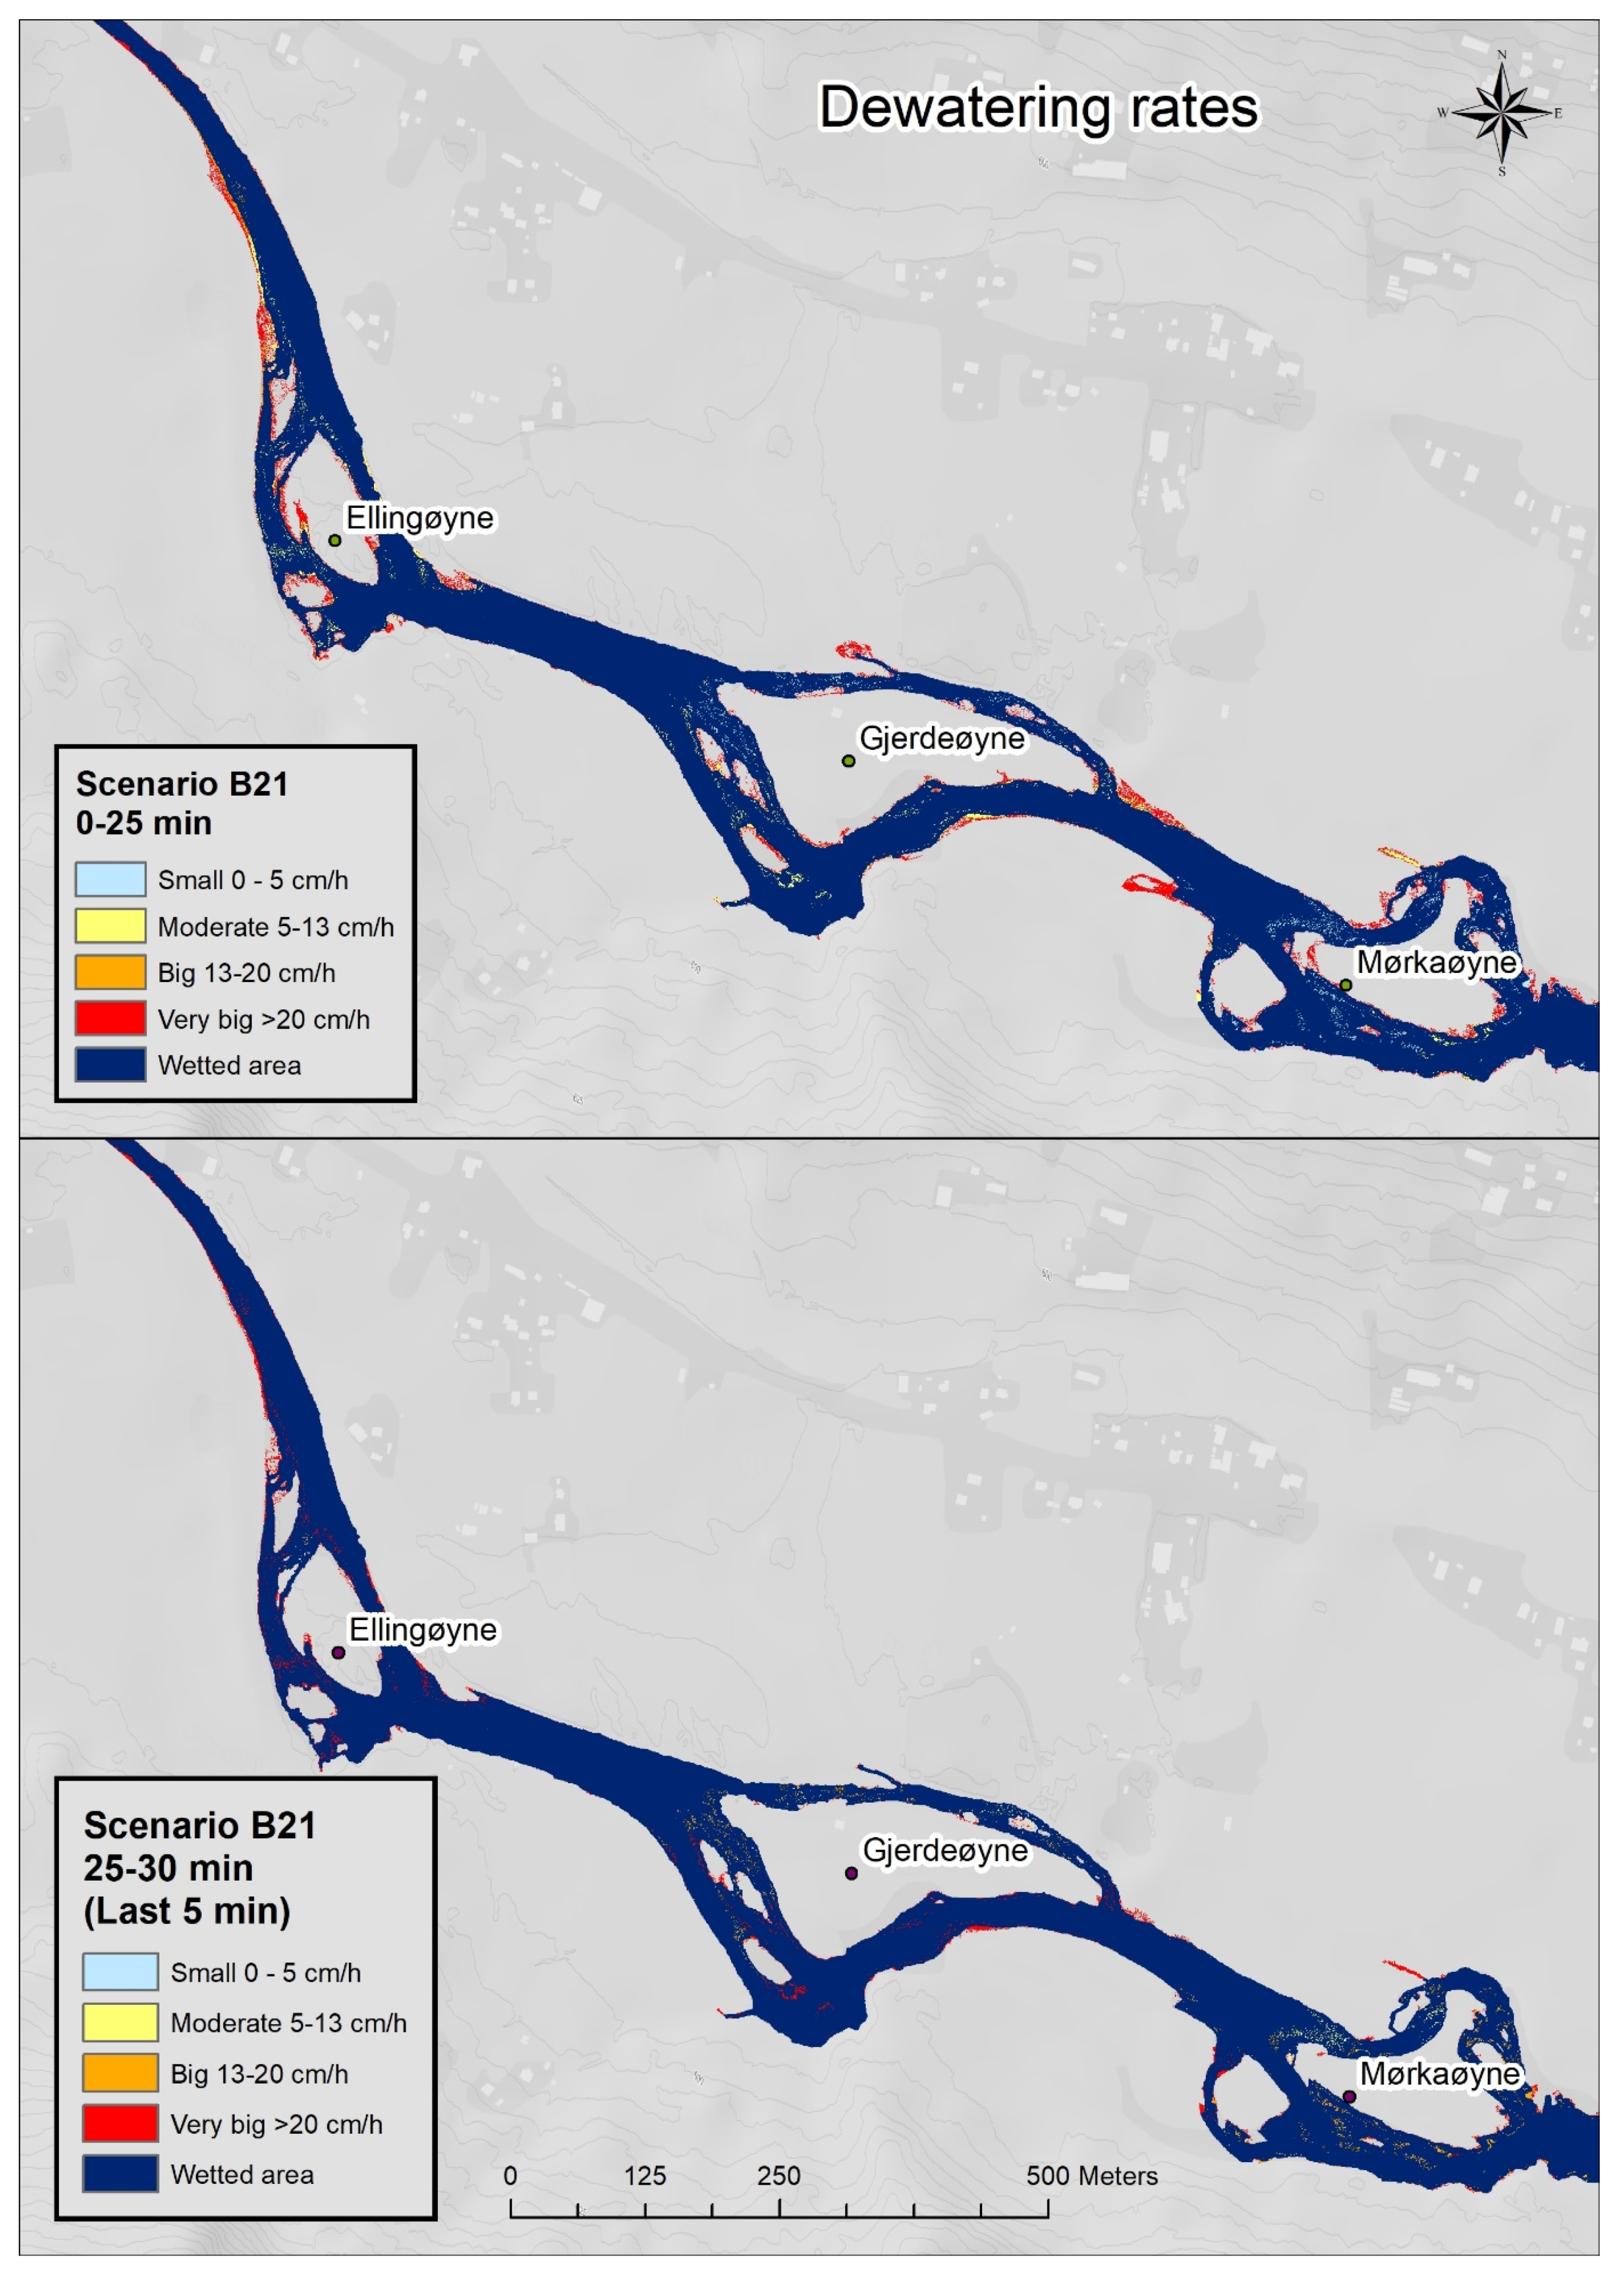

References
- 2050 Long-Term Stratesgy. Available online: https://ec.europa.eu/clima/policies/strategies/2050_en (accessed on 30 November 2018).
- Korpås, M.; Trötscher, T.; Völler, S.; Tande, J.O. Balancing of Wind Power Variations Using Norwegian Hydro Power. Wind Eng. 2013, 37, 79–95. [Google Scholar] [CrossRef]
- Graabak, I.; Jaehnert, S.; Korpås, M.; Mo, B. Norway as a Battery for the Future European Power System—Impacts on the Hydropower System. Energies 2017, 10, 2054. [Google Scholar] [CrossRef]
- Revision of license terms, NVE. The Norwegian Water Resources an Energy Directorate. In Norwegian, Revisjon av konsesjonsvilkår Norges Vassdrags-og Energidirektorat (NVE). Available online: https://www.nve.no/energiforsyning-og-konsesjon/vannkraft/revisjon-av-konsesjonsvilkar/ (accessed on 23 January 2019).
- Bakken, T.H.; Forseth, T.; Harby, A.; Alfredsen, K.; Arnekleiv, J.V.; Berg, O.K.; Casas-Mulet, R.; Charmasson, J.; Greimel, F.; Halley, D.; et al. Environmental Impact of Hydropeaking: Knowledge Status and Advice for Government and Industry; NINA Temahefte: Trondheim, Norway, 2016. [Google Scholar]
- Cushman, R.M. Review of Ecological Effects of Rapidly Varying Flows Downstream from Hydroelectric Facilities. N. Am. J. Fish. Manag. 1985, 5, 330–339. [Google Scholar] [CrossRef] [Green Version]
- Halleraker, J.H.; Saltveit, S.J.; Harby, A.; Arnekleiv, J.V.; Fjeldstad, H.P.; Kohler, B. Factors influencing stranding of wild juvenile brown trout (Salmo trutta) during rapid and frequent flow decreases in an artificial stream. River Res. Appl. 2003, 19, 589–603. [Google Scholar] [CrossRef]
- Harby, A.; Halleraker, J. Ecological impacts of hydro peaking in rivers. Int. J. Hydropower Dams 2001, 8, 132–135. [Google Scholar]
- Lauters, F.; Lavandier, P.; Lim, P.; Sabaton, C.; Belaud, A. Influence of hydropeaking on invertebrates and their relationship with fish feeding habits in a Pyrenean river. Regul. Rivers Res. Manag. 1996, 12, 563–573. [Google Scholar] [CrossRef]
- Bruno, M.C.; Maiolini, B.; Carolli, M.; Silveri, L. Impact of hydropeaking on hyporheic invertebrates in an Alpine stream (Trentino, Italy). Proc. Ann. De Limnol. Int. J. Limnol. 2009, 45, 157–170. [Google Scholar] [CrossRef] [Green Version]
- Bejarano, M.D.; Jansson, R.; Nilsson, C. The effects of hydropeaking on riverine plants: A review. Biol. Rev. 2018, 93, 658–673. [Google Scholar] [CrossRef]
- Saltveit, S.; Halleraker, J.; Arnekleiv, J.; Harby, A. Field experiments on stranding in juvenile Atlantic salmon (Salmo salar) and brown trout (Salmo trutta) during rapid flow decreases caused by hydropeaking. Regul. Rivers Res. Manag. Int. J. Devoted River Res. Manag. 2001, 17, 609–622. [Google Scholar] [CrossRef]
- Nagrodski, A.; Raby, G.D.; Hasler, C.T.; Taylor, M.K.; Cooke, S.J. Fish stranding in freshwater systems: Sources, consequences, and mitigation. J. Environ. Manag. 2012, 103, 133–141. [Google Scholar] [CrossRef]
- Vehanen, T.; Bjerke, P.L.; Heggenes, J.; Huusko, A.; Mäki-Petäys, A. Effect of fluctuating flow and temperature on cover type selection and behaviour by juvenile brown trout in artificial flumes. J. Fish Biol. 2000, 56, 923–937. [Google Scholar] [CrossRef]
- Flodmark, L.; Vøllestad, L.; Forseth, T. Performance of juvenile brown trout exposed to fluctuating water level and temperature. J. Fish Biol. 2004, 65, 460–470. [Google Scholar] [CrossRef]
- Bradford, M.J. An experimental study of stranding of juvenile salmonids on gravel bars and in sidechannels during rapid flow decreases. Regul. Rivers Res. Manag. Int. J. Devoted River Res. Manag. 1997, 13, 395–401. [Google Scholar] [CrossRef]
- Hedger, R.D.; Sauterleute, J.; Sundt-Hansen, L.E.; Forseth, T.; Ugedal, O.; Diserud, O.H.; Bakken, T.H. Modelling the effect of hydropeaking-induced stranding mortality on Atlantic salmon population abundance. Ecohydrology 2018, e1960. [Google Scholar] [CrossRef]
- Casas-Mulet, R.; Alfredsen, K.; Boissy, T.; Sundt, H.; Rüther, N. Performance of a one-dimensional hydraulic model for the calculation of stranding areas in hydropeaking rivers. River Res. Appl. 2015, 31, 143–155. [Google Scholar] [CrossRef]
- Tuhtan, J.A.; Noack, M.; Wieprecht, S. Estimating stranding risk due to hydropeaking for juvenile European grayling considering river morphology. KSCE J. Civ. Eng. 2012, 16, 197–206. [Google Scholar] [CrossRef]
- Vanzo, D.; Tancon, M.; Zolezzi, G.; Alfredsen, K.; Siviglia, A. A modeling approach for the quantification of fish stranding risk: The case of Lundesokna River (Norway). In Proceedings of the 11th International Symposium on Ecohydraulics (ISE), Melbourne, Australia, 7–12 February 2016. [Google Scholar]
- Mandlburger, G.; Hauer, C.; Wieser, M.; Pfeifer, N. Topo-bathymetric LiDAR for monitoring river morphodynamics and instream habitats—A case study at the Pielach River. Remote Sens. 2015, 7, 6160–6195. [Google Scholar] [CrossRef]
- Yin, X.A.; Yang, Z.F.; Petts, G.E. Optimizing environmental flows below dams. River Res. Appl. 2012, 28, 703–716. [Google Scholar] [CrossRef]
- Gostner, W.; Lucarelli, C.; Theiner, D.; Kager, A.; Premstaller, G.; Schleiss, A. A Holistic Approach to Reduce Negative Impacts of Hydropeaking. In Dams and Reservoirs under Changing Challenges; Taylor and Francis Group: London, UK, 2011; pp. 857–865. [Google Scholar]
- Bustos, A.A.; Hedger, R.D.; Fjeldstad, H.P.; Alfredsen, K.; Sundt, H.; Barton, D.N. Modeling the effects of alternative mitigation measures on Atlantic salmon production in a regulated river. Water Resour. Econ. 2017, 17, 32–41. [Google Scholar] [CrossRef]
- Saltveit, S.; Brabrand, Å. Tetthet av ørret i Storåne i September 2016; E-CO Energi AS: Oslo, Norway, 2016. [Google Scholar]
- Statnett. System Operations and Market Development Plan 2017–2021; Stattnett SF: Oslo, Norway, 2017. [Google Scholar]
- Sauterleute, J.F.; Charmasson, J. A computational tool for the characterisation of rapid fluctuations in flow and stage in rivers caused by hydropeaking. Environ. Model. Softw. 2014, 55, 266–278. [Google Scholar] [CrossRef]
- Alne, I.S. Topo-Bathymetric Lidar for Hydraulic Modeling-Evaluation of Lidar Data from Two Rivers. Master’s Thesis, Norwegian University of Science and Technology, Trondheim, Norway, June 2016. [Google Scholar]
- The U.S Army Corps of Engineers Hydrologic Engineering Center. HEC-RAS. Available online: http://www.hec.usace.army.mil/software/hec-ras/ (accessed on 23 February 2019).
- Brunner, G.W. HEC-RAS River Analysis System User’s Manual Version 5.0; US Army Corps of Engineers Institute for Water Resources Hydrologic Engineering Center: Davis, CA, USA, 2016.
- Barnes, H.H. Roughness Characteristics of Natural Channels; US Government Printing Office: Washington, DC, USA, 1967.
- Ghamry, H.; Katopodis, C. Computational optimization in simulating velocities and water-surface elevations for habitat–flow functions in low-slope rivers. J. Ecohydraul. 2017, 2, 99–121. [Google Scholar] [CrossRef]
- Hauer, C.; Holzapfel, P.; Leitner, P.; Graf, W. Longitudinal assessment of hydropeaking impacts on various scales for an improved process understanding and the design of mitigation measures. Sci. Total Environ. 2017, 575, 1503–1514. [Google Scholar] [CrossRef] [PubMed]
- Hunter, M.A. Hydropower Flow Fluctuations and Salmonids: A Review of the Biological Effects, Mechanical Causes and Options for Mitigation; Department of Fish and Wildlife: Washington, DC, USA, 1992.
- Person, E. Impact of Hydropeaking on Fish and Their Habitat. Ph.D. Thesis, École polytechnique fédérale de Lausanne EPFL, Lausanne, Switzerland, July 2013. [Google Scholar]
- Sauterleute, J.F.; Hedger, R.D.; Hauer, C.; Pulg, U.; Skoglund, H.; Sundt-Hansen, L.E.; Bakken, T.H.; Ugedal, O. Modelling the effects of stranding on the Atlantic salmon population in the Dale River, Norway. Sci. Total Environ. 2016, 573, 574–584. [Google Scholar] [CrossRef] [PubMed]
- Scruton, D.A.; Pennell, C.; Ollerhead, L.M.; Alfredsen, K.; Stickler, M.; Harby, A.; Robertson, M.; Clarke, K.D.; LeDrew, L.J. A synopsis of ‘hydropeaking’studies on the response of juvenile Atlantic salmon to experimental flow alteration. Hydrobiologia 2008, 609, 263. [Google Scholar] [CrossRef]
- Casas-Mulet, R.; Alfredsen, K.; Killingtveit, Å. Modelling of environmental flow options for optimal Atlantic salmon, Salmo salar, embryo survival during hydropeaking. Fisheries Manag. Ecol. 2014, 21, 480–490. [Google Scholar] [CrossRef]
- Vozinaki, A.-E.K.; Morianou, G.G.; Alexakis, D.D.; Tsanis, I.K. Comparing 1D and combined 1D/2D hydraulic simulations using high-resolution topographic data: A case study of the Koiliaris basin, Greece. Hydrol. Sci. J. 2017, 62, 642–656. [Google Scholar] [CrossRef]
- Casas-Mulet, R.; Saltveit, S.J.; Alfredsen, K. The survival of Atlantic salmon (Salmo salar) eggs during dewatering in a river subjected to hydropeaking. River Res. Appl. 2015, 31, 433–446. [Google Scholar] [CrossRef]
- Puffer, M.; Berg, O.K.; Huusko, A.; Vehanen, T.; Forseth, T.; Einum, S. Seasonal Effects of Hydropeaking on Growth, Energetics and Movement of Juvenile Atlantic Salmon (Salmo Salar). River Res. Appl. 2015, 31, 1101–1108. [Google Scholar] [CrossRef]
- Bakken, T.H. Centre for Environmental Design of Renewable Energy (CEDREN). Available online: https://www.cedren.no/english/Projects/EnviPEAK (accessed on 15 January 2018).
- Heggenes, J. Effects of short–term flow fluctuations on displacement of, and habitat use by, brown trout in a small stream. Trans. Am. Fish. Soc. 1988, 117, 336–344. [Google Scholar] [CrossRef]
- Heggenes, J.; Bagliniere, J.L.; Cunjak, R.A. Spatial niche variability for young Atlantic salmon and brown trout in heterogeneous streams. Ecol. Freshw. Fish 1999, 8, 1–21. [Google Scholar] [CrossRef]
- Bendixby, L.; Sandem, K. Hol 1 Stolsvatn Power Plant, Graft Report—Fish and Freshwater Organisms; 2012; E-CO Energi: Oslo, Norway; p. 5121810. (In Norwegian) [Google Scholar]




| Impact | Dewatering Velocity (cm/h) |
|---|---|
| Very big | >20 |
| Big | 13–20 |
| Moderate | 5–13 |
| Small | <5 |
| Parameter | Min Flow | 5-Percentile | 10-Percentile | Mean Flow | 90-Percentile | 95-Percentile | Max Flow |
|---|---|---|---|---|---|---|---|
| Discharge (m3/s) | 2.38 | 6.16 | 8.67 | 35.91 | 61.10 | 64.18 | 150.8 |
| Descriptive Statistics | Start | End |
|---|---|---|
| 2010–2017 | Increases | Decreases |
| Units | m3/s | m3/s |
| Minimum | 2.38 | 2.95 |
| 10th-Percentile | 7.77 | 7.21 |
| 25th-Percentil | 15.82 | 15.14 |
| Mean | 31.10 | 29.72 |
| Median | 32.03 | 31.30 |
| 75th-Percentil | 44.54 | 42.69 |
| 90th-Percentile | 53.37 | 50.68 |
| Maximum | 74.78 | 65.81 |
| Standard dev | 16.71 | 15.79 |
| Turbine | Discharge (m3/s) | Reduced Discharge (m3/s) | Wetted Area (m2) | Dried-Out Area (m²) | Dried-Out Area (%) | Dried-Out Area (m²)/ Reduced Discharge (m3/s) |
|---|---|---|---|---|---|---|
| 4 | 66 | 0 | 140,937 | 0 | 0% | 0 |
| 3 | 51 | 15 | 133,429 | 7508 | 5% | 501 |
| 2,4 | 42 | 9 | 126,411 | 14,526 | 10% | 780 |
| 2 | 36 | 6 | 120,317 | 20,621 | 15% | 1016 |
| 1,4 | 27 | 9 | 112,504 | 28,433 | 20% | 868 |
| 1 | 21 | 6 | 109,316 | 31,621 | 22% | 531 |
| 0,4 | 12 | 9 | 105,173 | 35,765 | 25% | 460 |
| 0 | 6 | 6 | 93,280 | 47,657 | 34% | 1982 |
| Option | 1 | 2 | Units |
|---|---|---|---|
| Estimated price difference | 0.1 | 0.1 | NOK/kWh |
| Spilled water | 14,400 | 14,400 | m3/day |
| Number of decreases | 290 | 87 | year |
| Spilled water | 4,608,000 | 1,382,400 | m3/year |
| Group | Hol 1 Urunda | Hol 1 Votna | Units |
|---|---|---|---|
| Energy factor | 0.897 | 1.0017 | kWh/m3 |
| Cost Option 1 | 374,587.20 | 418,309.92 | NOK/year |
| 43,826.70 | 48,942.26 | US$/year | |
| Cost Option 2 | 112,376.16 | 125,492.98 | NOK/year |
| 13,148.20 | 14,682.68 | US$/year |
© 2019 by the authors. Licensee MDPI, Basel, Switzerland. This article is an open access article distributed under the terms and conditions of the Creative Commons Attribution (CC BY) license (http://creativecommons.org/licenses/by/4.0/).
Share and Cite
Juárez, A.; Adeva-Bustos, A.; Alfredsen, K.; Dønnum, B.O. Performance of A Two-Dimensional Hydraulic Model for the Evaluation of Stranding Areas and Characterization of Rapid Fluctuations in Hydropeaking Rivers. Water 2019, 11, 201. https://doi.org/10.3390/w11020201
Juárez A, Adeva-Bustos A, Alfredsen K, Dønnum BO. Performance of A Two-Dimensional Hydraulic Model for the Evaluation of Stranding Areas and Characterization of Rapid Fluctuations in Hydropeaking Rivers. Water. 2019; 11(2):201. https://doi.org/10.3390/w11020201
Chicago/Turabian StyleJuárez, Ana, Ana Adeva-Bustos, Knut Alfredsen, and Bjørn Otto Dønnum. 2019. "Performance of A Two-Dimensional Hydraulic Model for the Evaluation of Stranding Areas and Characterization of Rapid Fluctuations in Hydropeaking Rivers" Water 11, no. 2: 201. https://doi.org/10.3390/w11020201
APA StyleJuárez, A., Adeva-Bustos, A., Alfredsen, K., & Dønnum, B. O. (2019). Performance of A Two-Dimensional Hydraulic Model for the Evaluation of Stranding Areas and Characterization of Rapid Fluctuations in Hydropeaking Rivers. Water, 11(2), 201. https://doi.org/10.3390/w11020201


