Abstract
To develop beach engineering, the submerged structure’s primary physical functions have to be understood. This study focuses on submerged structures in order to understand the strategy of reduced wave energy, stabilizing the shoreline and not generating erosion or adversely modifying coastal processes. Important developments have been made since the 1990s, taking into account the functions of recreational amenity. However, non-dimensional models cannot explain the physical mechanisms that generate accretion or erosion morphological features in the lee of the submerged structure. The present study aims to collaborate with the understanding of the mechanism of beach response to a submerged structure. For this, 26 surveys were made using topographic, Lagrangian, and Eulerian hydrodynamic measures during one seasonal cycle of a beach system from Rio de Janeiro (Brazil) with a natural submerged reef or rocky bank V-shape in the plan. This beach system is energetic and intermediate when referring to wave energy conditions and beach states, respectively. The wave breaking vector system on the rocky bank’s geometry was examined in the intermediate and dissipative beach morphodynamic organization. The variability of the wave breaking vector system determines the establishment, deformation, and erosion features in the lee of the structure. During high-energy waves, the submerged structure’s hydrodynamic and morphodynamic processes are transparent. When the submerged structure combines with the dissipative beach state, the surfing wave conditions are improved. These results provide the dimensional and positional references for an engineering proposal for a beach system.
1. Introduction
Observing natural processes is one of the best ways to develop engineering. The large amount of temporal and spatial coastal diversity around the world makes coasts potential natural laboratories for beach dynamic studies [1,2,3,4,5,6,7,8], helping to improve the knowledge of shoreline adjustment for different coastal features [9,10,11]. Climate change makes it increasingly urgent to find coastal engineering solutions that could help control the coastal dynamics, thereby solving or reducing erosion problems [12]. New strategies must also be developed, especially in coastal urban centers where the highest population density on the planet is found [13,14], requiring social amenities and safety. Conventional beach protection structures such as groins, shore-parallel rubble mounds, seawalls, and emergent breakwaters are becoming increasingly unpopular, mostly due to their adverse impact on beach amenities and aesthetic considerations of modern civil conceits [7,10,12]).
Interest in submerged coastal engineering has increased over the last decade due to multi-purposing [9], such as coastal protection and public amenities [13,14,15,16,17,18]. Submerged structures are able to control wave energy and maintain the dynamic equilibrium of the shoreline in their lee [10,13,18,19]. To optimize the benefits of a submerged structure in the coastal zone, a world-class natural reef design can be reproduced to develop a qualitatively good surf-breaking wave [16,20], similar to any other beach use, the development of which could support the local economy [21]. This type of engineering is a relatively new proposal in traditional coastal engineering [22], and the mechanisms that govern submerged structures over the shoreline response need to be clarified [15,17,22,23,24].
Through field, laboratory, and numerical modeling, studies of submerged structures have established relationships between the response of the coast with the submerged structure’s dimensions and its environmental parameters [10,17,18,19]. These models do not explain the mechanisms causing erosion or accretion at the lee of a submerged structure. The criteria/formulae are still not satisfactory [24], as observed in several failed cases in nature [13,24]. However, no factor is more important for the engineer than past experience for improving shortcomings and developing suitable design guidelines. Submerged structures must be understood, combined with the morphodynamic variability of the beach and its surf zone [13,24].
The beach morphodynamic is complex, and has fostered much research in the last half century. The presence of infragravity waves in the surf zone can imprint the morphology and explain the development of periodic patterns on beaches [1,2,3,4,25]. However, this explanation was challenged by self-organization theories over decades [26,27].
The infragravity wave signature on the morphology can be found in the specific form of sandy beach features. The two-dimensional longshore bar formation [28] and the three-dimensional rhythmic topography states [2] are signatures produced by infragravity waves, and both are caused, in turn, by leaky and edge waves, respectively [4,25].
Morphological coupling can also be seen as self-organization [29,30,31]. Self-organization can be defined as the spontaneous process where the beach form or patterns of its overall order arise from local interactions of an initially disordered morphology, not needing control by any external agent (such as waves). Self-organization does not require the presence of organized structures in either the flow or the underlying geology, and the emergence of rhythmic patterns is usually determined by feedback loops whose initiation only requires the presence of local perturbations to break the uniformity in the topography [27].
The present study aims to determine the mechanism of beach response to a multifunctional coastal submerged structure through data collection at a highly dynamic beach system with a natural submerged rocky bank V-shape in plan.
2. Study Area
An intermediary beach—the type found most commonly around the world [4]—exposed to high-energy waves from the South Atlantic Ocean meteorological system was chosen for this study. Reserva Beach is located at 23°1′ S and 43°23′ W in Rio de Janeiro, Brazil (Figure 1A). The region is a microtidal beach with a mean spring tide range of 1.2 m. Reserva Beach’s profile can be characterized by a 1:13 slope and 0.400-mm (d50) sediment grain size in the surf zone.
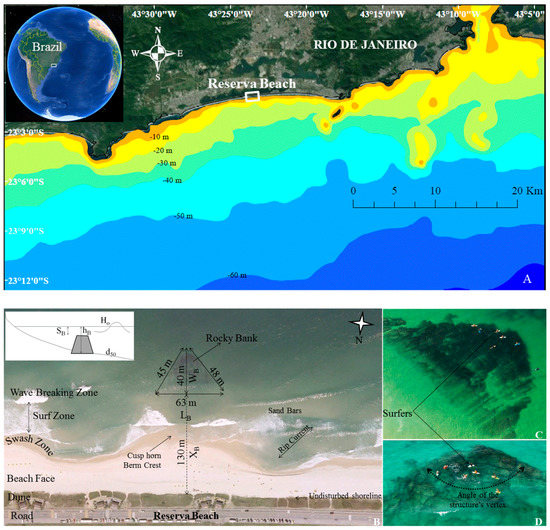
Figure 1.
(A) Study area. (B) The environmental parameters (d50, sediment grain size; Ho, incident wave height) and structural dimensions of the submerged structure in the beach system (WB, crest width; , depth at structure; SB, depth to structure crest; , structure base length; , distance between shoreline reference and structure), used in non-dimensional models. (C) and (D) Reserva Beach rocky bank aerial images.
The coast is E–W oriented, and the wave corridor is 120° opened. The beach is exposed directly to the southerly storm waves (associated with the frequent passage of cold fronts) and the southerly swell, which are generated by South Atlantic higher latitude storms dissociated from local wind systems [32]. Extreme cases for the Rio de Janeiro coast, during southerly swell, show periods of 10 to 16 s and significant heights of up to four meters. This beach system includes a natural rocky bank V-shaped in its plan (Figure 1B–D), which is formed through a geological process [32]. Its geometric shape is similar to that found in previous studies about multifunctional submerged coastal engineering projects [15,18,19,20,23,33]. Figure 1B shows the submerged structure’s dimension (63-m base; 40-m width crest) and distance from the shoreline reference (130 m). The angle of the structure’s vertex furthest offshore is approximately 80° (Figure 1D). The mean depth of the structure’s crest (SB) is 1.96 m (from data collected). The mean depth at the rocky bank (hB) is 3.27 m.
3. Methods
3.1. Beach Morphology Monitoring
The authors decided to use the high-density beach profile to record the morphodynamic variability features of the Reserva Beach system with the presence of a rocky bank. This was made after a wave field passed from important meteorological phenomena of the South Atlantic ([34]: an extratropical cyclone (below −30° S), a subtropical cyclone (upper −30° S), and a postfrontal anticyclone. Figure 2 shows the topographic points cloud used for the bathymetry. The beach profiles were spaced 12 m alongshore in the lee of the rocky bank at approximately 65,000 m2, 500 m alongshore and 130 m cross-shore. An optical level, grade rods, and a portable receiver global positioning satellite (GPS) system (Garmin Etrex10) were used for monitoring. Uncertainty of the x–y positioning was defined by GPS, staying for each field campaign under ±4 m. Altitude or z uncertainty, being ±7 cm, was calculated considering the maximum inclination of the grade rod and the irregularities due to footprints. The local referential vertical level is 6.37 m above the mean water level. The limit of the distal sand bar was recorded with GPS tracking by surfboard paddling around the feature. The data were interpolated in geographic information system software to generate a three-dimensional (3D) morphologic feature configuration.
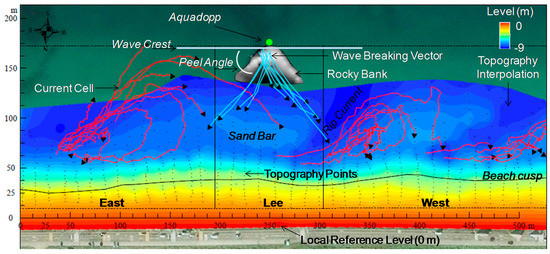
Figure 2.
Map of surveyed data at Reserva Beach with: the presence of a rocky bank in the system; topographic points cloud used for the bathymetry; the zones of the morphological feature monitoring (east, lee, and west) as well as the position of the Aquadopp. Additionally, the figure shows examples of wave characteristics on the rocky bank (crest and peel angle) and the main morphological (the beach cusp and the sand bar at the lee of the submerged structure) and hydrodynamics features (currents cell tracked with red lines and wave breaking vector tracked with light blue lines).
3.2. Tidal Level, Wave Parameters, and Cell Circulation Monitoring
The Aquadopp (Nortek, 1 MHz) was anchored waveward of the rocky bank during surveys. The tide and wave parameters were recorded using a pressure sensor 0.9 m above the bottom, with a deployment profile interval of 2048 s and with 2048 samples taken of the wave’s measurements. The current data were recorded at 2 Hz in profile intervals of 1024 s, with an average interval of 900 s.
The wave breaking over a multifunctional submerged structure can be observed using a vector system [35] originating through the wave ray separation. Two wave-breaking vectors are generated over the structure’s edge due to the depth gradient between the structure’s crest and the sea floor [16,20,35]. The angle between the trail of the broken whitewater and the crest of the unbroken wave as it propagates shoreward is called the peel angle [35]. Multifunctional coastal submerged structures are designed to control the wave’s peel angle by a breaking wave vector system to offer surfing waves [16,20,33,36] and lead wave energy to adjacent areas in their lee. If a peel angle is greater than 45°, surfers have a good chance of riding the wave. For this reason, the V-shape submerged engineering structure has been the most frequently studied design for multifunctional proposes [18,20,24,33].
Wave-breaking vectors were tracked using a portable GPS carried by a highly experienced surfer riding in the peel, which is represented with blue lines in Figure 2. This methodology was called GPS_Surf. The take-off to end-of-ride data were recorded in the most frequently used way (one second) and stored in the GPS data logger. The free software GPS TrackMaker 13.9 was used to process data and identify the vector orientation, extension, and velocity. The wave’s crest direction was tracked by the surfer paddling parallel to the wave train incident on the breaking zone. This process was repeated along 10 different wave series during the survey.
The longshore mean water level gradients generate currents that govern the nearshore circulation patterns. Ranashinghe et al. explained that the currents can be used as an indication of the shoreline response to submerged structures [23]. Thus, the journey of the cell’s circulation, with red lines in Figure 2, was recorded by a human drifter carrying a portable GPS [37]. After a visual identification, the swimmer entered the rip current’s feeder, floating and tracking the circulation pattern. In some cases, the human drifter returned to the starting point, completing the circulation cells, and in other cases, he exited the surf zone.
Figure 3 shows a wave rose obtained using the wave generator model WAVEWATCHIII® at 60-m depth. Deep-water wave angle distributions become narrower as the beach is approached and as refraction aligns the waves to the bottom contours. The wave direction obtained using the GPS_Surf were related to the wave direction measured by the Aquadopp (Figure 3), thus validating this methodology. In this validation process, available GPS data was used when the surfer passed near the Aquadopp position. Although only 11 measurements along the data from the 26 surveys were used, the angle range that was tested considered all of the measured wave directions.
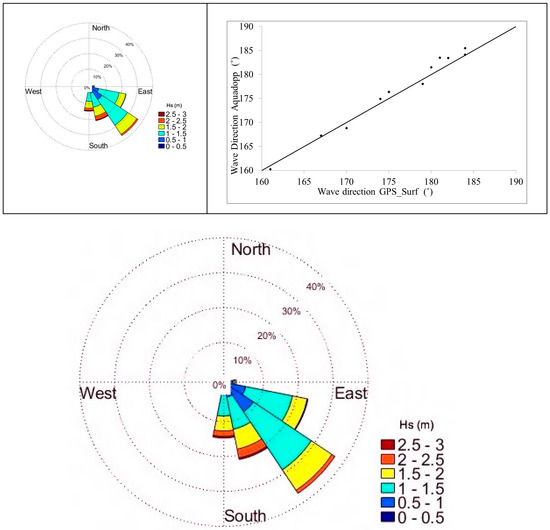
Figure 3.
Wave rose (60-m depth) and relation between the wave direction measured by the Aquadopp and the GPS_Surf near the coast. The R-squared value is 0.98.
3.3. Shoreline Non-Dimensional Models
Figure 1B presents the environmental parameters and structural dimensions used in the non-dimensional model of the shoreline response to a submerged structure. Two non-dimensional beach response models, Pilarczyk [17] and Ranasinghe et al. [22], were applied for data measured in the Reserva Beach system. These models show a regression relation between the geometric and wave parameters and the beach response (accretion and erosion). Black and Andrews [10] and Ranasinghe and Turner [18] investigated salient formations created by natural reefs and produced non-dimensional ratios, enabling the prediction salient of limiting parameters , where and are the submerged structure base length and the distance between shoreline reference and structure base, respectively.
In the existing rules of salient formation in the lee of submerged structures, Pilarczyk [17] proposed including the effect of submergence by adding the factor (Equation (1)):
where is a transmission coefficient, which is defined as the ratio of the height directly shoreward of the breakwater to the height directly seaward of the structure. Pilarczyk [17] introduced the structural parameters and the wave breaking type on the structure by the original formula of D’Angremond et al. [38] (Equation (2)):
where SB is the depth to structure crest, H0 is the wave incident, WB is the structure crest width, and is the surf similarity [39], which is defined by the ratio between the beach gradient and the wave steepness (Equation (3)):
where L0 is wavelength. Then, the rules for low-crested breakwaters can be modified to observe salience, when .
Later, Ranasinghe et al. [22,23] presented the tendency to form a salient at the lee of a submerged breakwater through a non-dimensional equation using the ratio between the onshore flow over the structure and the alongshore flow in the lee of the structure. The results depend on the relative magnitudes of the two non-dimensional parameters and , where and are the depth to sea floor at the structure and the Dean shape parameter, respectively. Parallel depth contours, linear wave theory, shore normal waves, and no wave–current interaction assumptions limit the theoretical derivation.
4. Results
This section discusses the coupling between a natural V-shaped rocky bank with the hydrodynamic process and the morphodynamic variability of the Reserva Beach system. The temporal evolution of volume change in the lee of the structure is compared to the adjacent zones (west and east) in Section 4.1.
The beach response for the 26 cases that were measured was organized in three groups with similar configurations. The deposition (Section 4.1.1) and erosion (Section 4.1.2) in the lee of the submerged structure is the response of the beach that is most commonly described in the literature [10,15,18,22,23,40]. The third case (Section 4.1.3), which is not described in the literature, is the coupling of the longshore bar, the through state, and the submerged structure. Thus, this case was called “dissipative” due to the high energy coming from natural processes that control the morphological beach features and that do not feel the submerged structure present in the system. In Section 4.2, the non-dimensional beach response models to a submerged structure with those measured in the Reserva Beach system are discussed.
4.1. Beach Mobility
The results of the volume changes are presented in Figure 4. For each survey, a digital elevation model (DEM) was created using the interpolation tool of the geographic information system software. Then, the volume change was the difference of the consecutive survey data. Data from the WAVEWATCHIII® were also used to characterize the wave climate between 1 January 2015 and 26 January 2016. The boundary condition that was used in the model was the South Atlantic Ocean, and the input wind data were from a reanalysis of NCEP/NCAR (National Centers for Environmental Prediction/National Center for Atmospheric Research). The output data wave was approximately eight kilometers south of Reserva Beach at a depth of 60 m. The sediment volume dynamic represents a typical intermediate beach system. As shown in Figure 4, the beach is highly dynamic at short-term periods (maximum of ±150 m3), with the presence of deposition (positive values) and erosion (negative values) processes.
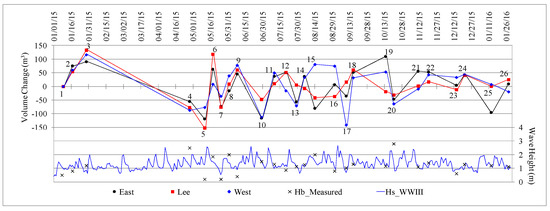
Figure 4.
Beach mobility in sediment volume changes at the east, west, and lee of the Reserva rocky bank. The numbers represent each case presented in the deposition, erosion, and dissipative groups. Significant wave breaking height (Hb_Measured) data were measured at Reserva Beach. The continuous series of significant wave height (Hs_WWIII) was obtained using the wave generator model WAVEWATCHIII®.
At the annual cycle scale, the beach showed a stable trend with the presence of seasonal field waves, which is characteristic of Rio de Janeiro’s beaches. The initial results (from surveys one to three) are the end process of deposition, during summer conditions (less energetic waves). The South Atlantic cyclogenesis storm began in May [34] (winter season), starting the beach’s period of mobility (from surveys four to 20) and the presence of more energetic waves. At the end of the year, from surveys 21 to 26, the volumes stabilized as summer returned with smaller wave heights.
The difference in sediment volume between consecutive surveys was calculated in the east, lee, and west regions of the structure. The thresholds of these regions were based in the literature [10,15,18,22,23,40]; thus, the deposition and erosion at the lee of the submerged structure were coupled in deposition mechanism (Section 4.1.1) and erosion mechanism (Section 4.1.2), respectively. The cases in which the sediments mobilized in all of the sectors of the beach were almost equal, the beach state longshore bar–trough dominates, and these cases were named as dissipative (Section 4.1.3). This name was used because the beach changes to a dissipative state [2].
4.1.1. Deposition Mechanism
This group is called “deposition” because of the establishment of a crescentic sand bar and positive sediment volumes (Figure 4) at the lee of the submerged structure. This process was identified in 10 cases (one, two, three, nine, 12, 13, 14, 17, 18, 26; see Figure 5), corresponding to 38% of the total surveys. The presence of crescentic sand bars resulted in a natural systematic longshore variation in the beach’s morphodynamics over a distance of 130 m. Due to this, the alongshore depth gradient at the rocky bank could be considered as a value of the beach profile variability with the average from 1.46 m and with maximal observed exposition from 2.2 m. This gradient is in the same scale as the scour process, as related by various studies [11,19,41,42] at the base of and around the submerged breakwaters.
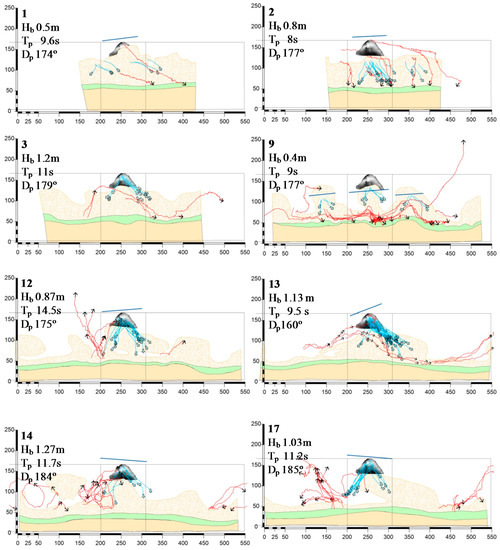
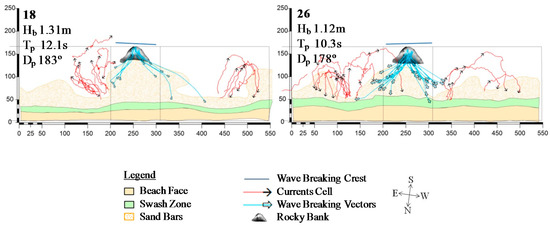
Figure 5.
Bidimensional response of the morphological (beach face, swash zone, and sand bars) and hydrodynamic features (currents cell-tracked and wave breaking vector tracked) in the Reserva Beach system. The configuration of these 10 cases was grouped due to the depositional morphological feature in the lee of the rocky bank. The onshore sand bars depth is −1.5 m, relative to the mean sea level for each day. The wave data parameters (Hb, Tp and Dp) during each case are also indicated.
The results of cases three, nine, 12, 14, 17, 18, and 26 (Figure 5) show wave rays at the rocky bank restricted in ±5° normal to the beach and defining the wave breaking vector (light blue lines) west and east above the edge arms. The dispersion of these vectors reached 163 m, boarding the morphological features of the surf zone. The peel angle spread of the mean of 52° was less than ±13° in each case. As a result, on the rocky bank, refraction and wave breaking occurs; therefore, there is energy dissipation. On the other hand, the dissipation in the channels is minimum. The lower convergence energy waves in the lee of the submerged structure allowed deposition and initiated the growth of the cusps. The surface current cells (red lines) showed high flow rates adjacent to the rocky bank. Normal and oblique rip currents were tracked in combination with longshore currents.
Cases 1 and 2 form an accretion sequence that represented the end of summer, when the morphological beach features migrated to the beach face [1,2,3,4,9]. In these cases, the wave breaking vectors (light blue lines) were fixed between the beach and rocky bank, probably because the waves do not break along the bank crest. Case 13 is unusual, presenting a wave breaking direction over 10°; therefore, the wave breaking vector system (light blue lines) was reoriented, showing more vectors at the west side. The dispersion of the east vector displacement was limited in the lee crescentic bar, while the distance performed by the west wave dispersion vector reached more than 140 m, boarding the bar feature.
4.1.2. Erosion Mechanism
This group is called “erosion” because of the establishment of the channel feature and the presence of erosion (Figure 4) in the lee of the submerged structure. The natural wave parameters forcing at the beach system conducted high mobility to rhythmic and transverse sand bars and the beach over a distance of 130 m. The mechanism that established a morphological erosive feature was investigated in eight of the cases measured for the Reserva Beach with a rocky bank in the system (five, 10, 11, 16, 19, 21, 22 and 23, Figure 6), corresponding to 31% of the surveys.
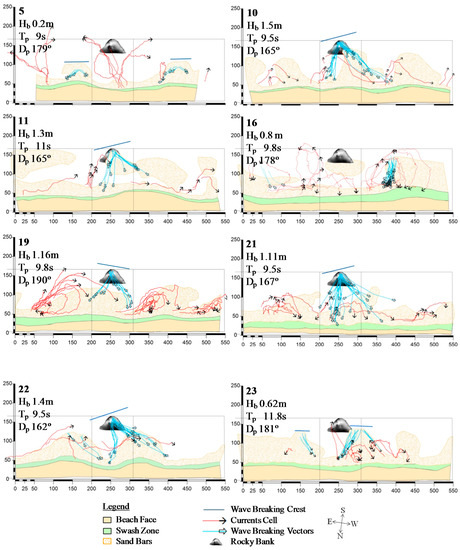
Figure 6.
Bidimensional response of morphological (beach face, swash zone, and sand bars) and hydrodynamic features (currents cell tracked and wave breaking vector tracked) in the Reserva Beach system. The configurations of these nine cases were grouped due the erosion morphological feature in the lee of the rocky bank. The onshore sand bars depth is −1.5 m, which is relative to the mean sea level for each day. The wave data parameters ( and ) during each case are also indicated.
The results for cases 10, 11, 19, 21, 22, and 23 (Figure 6) show changes in the wave breaking vector system when compared to the depositional group. The oblique wave rays (angle higher than 11°) rotated the vector system (light blue lines) on the rocky bank geometry and modified the mean wave peel angle to 62° and 53° at the west and the east, respectively. The relationship between the obliquity of the wave rays and the angle of peel shows the orientation of the wave vectors in relation to the shoreline. The east vectors reached the beach face directly in the lee of the rocky bank (10, 11, 21, 22, and 23). The shore’s normal returns flow became a rip current (red lines), and a narrow channel was established in the lee of the rocky bank, forming the erosive features in this zone.
Case 19 undergoes the same process as the above cases, and in this one, the west vector (light blue lines) started to reach the lee field from the rocky bank.
In cases 16 and 23, the predominant wave breaking vectors (light blue lines) were located on the adjacent sand bars. This effect began to destroy the salient form in the lee of the structure. As a consequence, two cell circulations (red lines) were formed: clockwise on the west, and counterclockwise on the east.
4.1.3. Dissipative Case
This case presented the same deposition or erosion trend in the three analyzed regions: east, lee, and west (Figure 4). This group was termed “dissipative”, because high-energy incident waves controlled the hydrodynamic and morphodynamic processes. The morphological system was organized without taking into account the presence of the submerged structure in the Reserva Beach system. A longshore sand bar–trough formed, and was the predominant feature in this group, as it was shown in eight of the cases measured (Figure 7), corresponding to 31% of surveys.
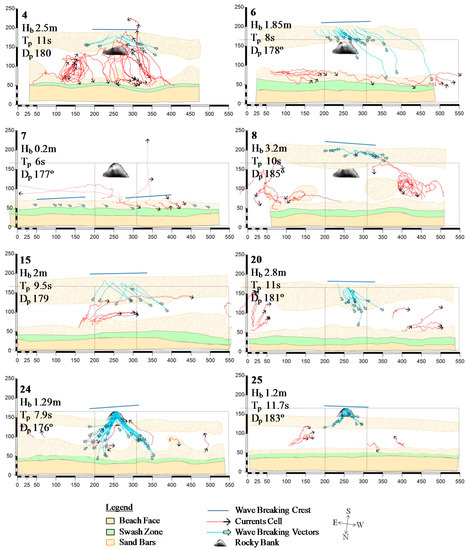
Figure 7.
Bidimensional response of the morphological (beach face, swash zone, and sand bars) and hydrodynamic (currents cell tracked and wave breaking vector tracked) features of the Reserva Beach system. The configuration of these eight cases were grouped, taking into account the dissipative morphological feature at the beach. The onshore sand bars depth is −1.5 m, and the offshore sand bars depth is −2 m, relative to the mean sea level for each day. The wave data parameters ( and ) during each case are also indicated.
The distal sand bar buried the rocky bank in cases four, six, eight, 15, 20, 24, and 25 (Figure 7). The wave-breaking mechanism was controlled by this morphological feature, and generally, the dispersion of the breaking vectors (light blue lines) was stopped in the trough. The presence of currents or cell circulations (red lines) was restricted in the trough. When the wave energy increased, the linearity of the beach was observed (sequence 24–25) (Figure 4).
4.2. Non-Dimensional Models
Figure 8 and Figure 9 show the shoreline response for 11 selected cases measured at the Reserva beach system (Table 1) according to the Pilarczyk [17] and Ranasinghe et al. [22] non-dimensional models, respectively. A mean beach profile, considering eight profiles in the lee of the rocky bank, was used for each case. Wave data for these 11 cases were measured with an Aquadopp. For the rest of the cases, the waves were visually estimated, and for this reason, they were not included in this analysis.
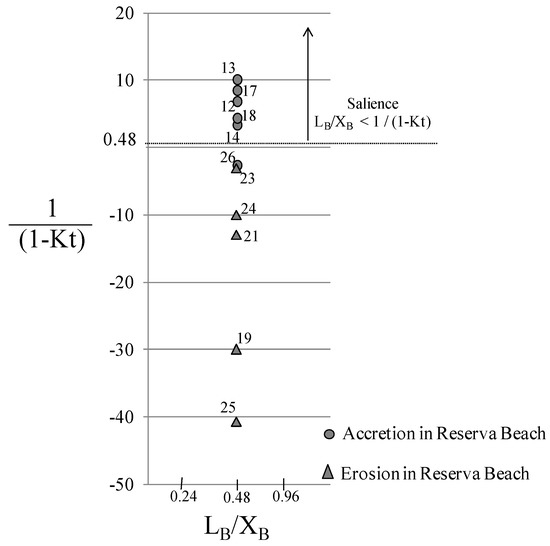
Figure 8.
Results of the beach response model to a submerged coastal engineering model proposed by Pilarczyk [17].
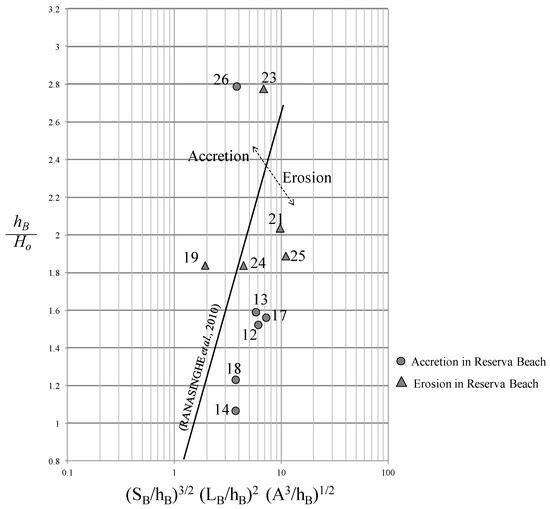
Figure 9.
Results of the beach response model to a submerged coastal engineering model proposed by Ranashinghe et al. [22].

Table 1.
Wave data parameters used in the non-dimensional beach response models to a submerged coastal engineering model: period (), wave breaking height during event (), and wave breaking height pre-event (_before), depth of the rocky bank base (), and crest ().
The Reserva Beach rocky bank geometry provides the formation of the salience in the lee of the structure by the relation . The relation equal to 0.48 is important for surfing conditions: lower values ride to non-breaking waves, and higher values characterize emerged banks. In the Pilarczyk [17] model, the relationship aligns with the Reserva measured data, except the accretive case, number 26. In this way, the use of the transmission coefficient in this model was proven to be a good method for predicting the shoreline response. The Pilarczyk [17] model explains how the wave feels the submerged structure and the wave-breaking type.
The predicted shoreline response model of Ranasinghe et al. [22] applied to the Reserva data showed compatible results for only cases 21, 24, 25 (erosion), and 26 (deposition). The results in this study differed from the reference model of Ranasinghe et al. [22] for two reasons. First, the model assumes that the wave attack is frontal, and does not consider the wave vectors, which are fundamental in hydrodynamics and morphology, as shown in the analysis of Reserva Beach mobility. Second, the model was verified for bathymetry with parallel depth contours, without the presence of bathymetry irregularities and bars. The influence of bathymetry is evident in the results of Reserva Beach and in the association of the processes (sedimentation/erosion) with the value of hB/Ho (>1.6 or <1.6). In this model, the variation in the horizontal and vertical axes is the result of the beach profile changes (), and would have caused the same effect as the change in the position of the submerged structure relative to the shoreline reference. Then, as in the model, the value of () is considered constant, and the results do not adjust.
These results demonstrate the importance of including the beach mobility in order to develop efficient designs of submerged structures. Additionally, a knowledge of how the waves will reach the beach face by the vector system is necessary due to the wave breaking on the bank. Also, the pre-event (average of three previous days) wave heights were included in Table 1. For the dissipative group, the pre-event wave heights were smaller than the measured ones, and high-energy incident waves controlled the hydrodynamic and morphodynamic processes. For accretion and erosion cases, with moderate and low-energy waves, a non-pattern between measured and pre-events wave heights was found, which was probably due to incoming waves being modified by pre-existing morphology. This time-aspect relation between waves and morphology is not considered by the non-dimensional models.
5. Discussion
5.1. Shoreline Response to V-Shape Submerged Structure
The morphological surf zone beach shape is produced by the dynamics associated with incident waves. Wave-generated currents and different reflected and resonated oscillation frequencies reorganize the beach gradient and sediment from the pre-existing morphologies. Figure 10 shows the hydrodynamic processes (wave vectors and cell circulation) and the shoreline response generated by the breaking wave vector system on the rocky bank geometry. Figure 10a,b represents the accretion and erosion groups, respectively, as the responses to moderate and low wave energy. For cases with moderate and low-energy waves, the natural V-shaped rocky bank in the Reserva Beach system is always a pre-existing morphology, and defines the alongshore gradient depth for incoming gravity waves. In these cases, the time scales of the bars and the movement of the volume of sand respond to larger temporal scales. Figure 10c represents the dissipative group governed by high wave energy. In those cases, the beach morphology depends on the waves acting at the moment, and it is organized without taking into account the presence of the rocky bank, and high-energy incident waves controlled the hydrodynamic and morphodynamic processes.
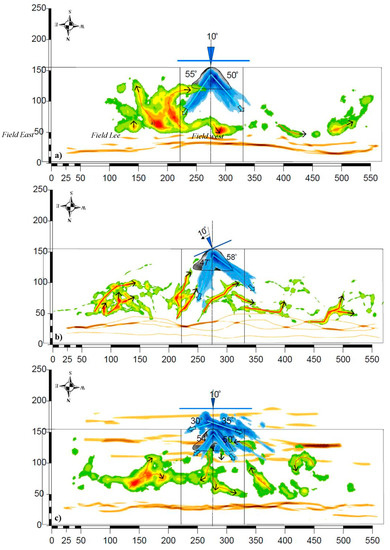
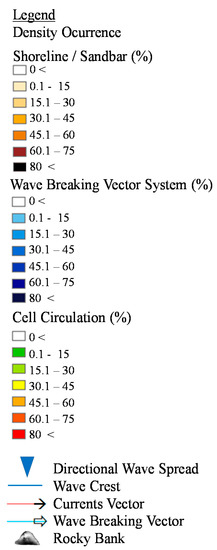
Figure 10.
The wave breaking vector system on the Reserva rocky bank geometry combined with the hydrodynamic (cell circulation) and shoreline responses. Results (a) and (b) represent the depositional and erosive groups, which are governed by moderate and low-energy waves, respectively. Result (c) represents the dissipative group governed by high-energy waves. Shoreline changes, wave breaking vectors, and cell currents are represented by percentage of density occurrence (considering the cases in Figure 5, Figure 6 and Figure 7).
The way that breaking waves sending energy to the beach is the main mechanism that explains the beach’s morphological response configuration accomplished by the normal and rotation of the density vector system due to the wave breaking on the rocky bank (Figure 10a,b). When referring to wave-breaking quality for nautical sports, the surf conditions created by the wave-breaking vectors in Figure 10a,b [16,20,35,36] are the best, regardless of whether erosion or deposition processes are dominating. Due to the longshore wave energy gradients, the bars are developed in the lee of the submerged structure, and the troughs are formed in the adjacent fields, where the vectors reach the shoreline. If the wave rays are normal (Figure 10a) or oblique (Figure 10b), the wave-breaking vector system could change the dispersion vector mode until it reaches the beach face, inducing depositional or erosive features, respectively. Thus, there exists a feedback between the vector system mode over the submerged rocky bank and the beach morphodynamic response, and this happens in the same scale as the natural process [1,2,3,4]. This feedback can be observed in Figure 11 by the position of the contour of the shoreline (the accretion or high-density occurrence is shown in Figure 11a, and the erosion or low-density occurrence is shown in Figure 11b).
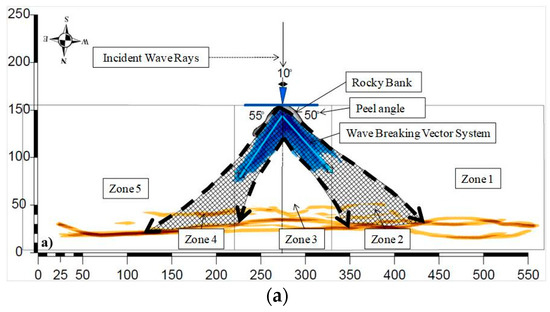
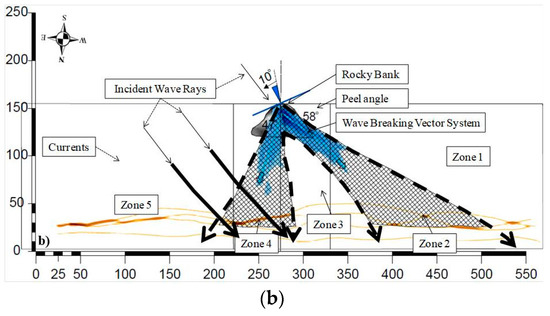
Figure 11.
Wave-breaking vector system (blue lines) and the shoreline dynamic in the lee of the submerged structure (density occurrence as referred in Figure 10) for depositional (a) and erosive groups (b). Reference hydrodynamic zones observed around a rectangular submerged breakwater [40].
Black and Andrews [15] and Ranasinghe and Sato [40] noted that the oblique incidence of the wave rays is a potential mechanism for generating erosion. The results obtained in the present study explain how that procedure occurs with the geometry of a V-shape submerged structure, which has a diffraction point on the focus of the structure. Also, Figure 11 references hydrodynamic zones with respect to the wave field observed around a rectangular submerged breakwater according to Ranasinghe and Sato [40]. In Figure 11, zones one and five are similar to the nearshore wave fields without any structure. Zone Three was a rapidly refracted wave zone (bounded by dotted lines), and this particular phenomenon resulted in the formation of zones two and four. From the diffraction point on the rock and the angular opening of the submerged structure, a shadow field (Zone Three) was generated in the structure’s downdrift (5500 m2). Zones two and four (bounded by dashed lines) were generated by the wave convergence from zones one and five. This convergence was stronger at the structure and behaved similar to a point source for waves, and the superposed waves propagated at one vector almost perpendicular to the shoreline and oblique at the other one. Zone Four is a high hydrodynamic area with reflective processes, as observed by the arrival of the wave-breaking vectors and the output vectors of rip currents, as shown in Figure 10a,b.
Figure 10c presents the organization of the distal longshore bar position (high-density occurrence), the dominant hydrodynamic processes, and the linearity from the shoreline. These characteristics allow the identification of the position and size controlling the breaking-wave vector system over the submerged structure. The rocky bank was transparent in 75% of the dissipative cases (group c), and the wave breaking occurred on the linear sand bar with poor surfing wave conditions. The success of the dissipative group results was to observe that in 25% of the cases, the linearity of the longitudinal sandbar was broken, owing to the depth gradient between the rocky bank and the seabed, thereby defining the breaking wave vector system over the submerged structure.
Due to this phenomenon, the position of a submerged structure determines their efficiency, which is a referential bidimensional plan where the longshore sand bar dynamic did not interfere with the wave breaking vector system. From the figure, it can also be observed that in dissipative conditions, the longshore limited the dispersion of the wave-breaking vectors (east, west) from the submerged structure. In this case, the geometric structure design (angular aperture) can be focused on only the quality of surfing breaking waves, since the erosive and depositional processes will not happen.
The importance of the reference of the natural beach hydrodynamic oscillation to the position and dimension of the submerged structure can now be understood.
5.2. Multifunctional Submerged Coastal Structure
To explain the responses obtained with non-dimensional models for submerged structures, the physical principles governing the wave-breaking vector system must be understood. The models were not able to explain by themselves the mechanism that induced the shoreline response. The studies in submerged coastal engineering designs have been optimized for only surfing purposes, taking into account the currents driven by waves breaking over the reef [16,20,33], and neglecting the natural variability of surf zones and beaches. For example, the artificial surfing reef of Narrowneck (Gold Coast, Queensland) suffered a high number of design changes during and after its installation [43] due to unexpected physical changes in the seabed (changes in ). The example of the rocky bank in Reserva Beach demonstrated the high morphological variability of the beach profile on the breaking zone, with changes in hB higher than 2 m. The effect of the scour could be strong around the structures [41]. In this case, it is recommended to use mobile instead fixed submerged structures.
Also, the key variables are the directional spreading of the incident waves and the morphodynamic variability of the beach and the surf zone. Thus, the breaking wave vector system on the geometry and design of the submerged engineering organizes a deposition or erosion feature in the lee. If the breaking-wave vector system rotates, the engineering project has to change with intelligent strategies to interrupt the vector dispersion. Nature shows this interrupting vector dispersion from the rocky bank by a resistant morphological feature and with a longshore bar through cases 13 and 25, respectively. The mechanism of sandbar migrations offshore or onshore [44] are essential for an efficient engineering “building with nature” [24].
6. Conclusions
The wave-breaking vector system on the geometry of the submerged structure determines the efficiency for beach protections, hazards, and surfing conditions. Depositional features in the lee of the submerged structure occur with homogeneous wave breaking vectors over the submerged structure’s arms left to reach the beach at the adjacent zones of the structure. Erosion features are established when the wave rays income oblique onto the submerged structure, and rotates the wave-breaking vector system until one of the vectors reaches the lee of the structure. The strategies to control the erosion features were presented by nature, whose reference is to limit wave-breaking dispersion.
For moderate and low-energy waves, the natural bank is defined as a pre-existing morphology that controls incoming gravity waves. In these cases, beach morphology responds to larger temporal scales (few days). On the other hand, during high wave energy (dissipative group), the beach morphology depends on the waves acting at the moment, which are transparent for the rocky bank.
The references for the high-energy waves conditions were also identified in the present study. Longshore bar and trough combined with the submerged structure can transform the wave breaking continuously along the bar to the wave breaking vector system on the geometry from the submerged structure. The surfing waves are thus improved; therefore, the natural hydrodynamic phenomenon organizes the morphological feature in the beach system.
The existent non-dimensional models for shoreline response need to take into account beach mobility, morphodynamic variability, wave directional spectrum, functional component combinations, and the wave-breaking vectors system for the design engineering project. Therefore, these are the basic principles to understand the mechanism that leads a submerged structure to generate the erosion or deposition response, and even remain transparent to the natural processes of the beach system.
Author Contributions
Conceptualization, D.D.N.; Methodology, D.D.N. and F.F.C.-S.; Software, D.D.N.; Validation, D.D.N., F.F.C.-S. and M.N.G.; Formal Analysis, D.D.N. and F.F.C.-S.; Investigation, D.D.N. and F.F.C.-S.; Resources, M.N.G.; Data Curation, D.D.N. and F.F.C.-S.; Writing–Original Draft Preparation, D.D.N.; Writing–Review & Editing, D.D.N., F.F.C.-S. and M.N.G.; Visualization, D.D.N. and F.F.C.-S.; Supervision, M.N.G.; Project Administration, D.D.N.; Funding Acquisition, CAPES Foundation (Ministry of Education) and the FAPERJ Foundation (Rio de Janeiro State).
Funding
This research was funded by CAPES Foundation (Ministry of Education) and the FAPERJ Foundation (Rio de Janeiro State).
Acknowledgments
Especial thanks to the many volunteers who helped with the fieldwork (Cohesive Sediment Dynamic Laboratory LDSC/COPPE/UFRJ), special thanks to M.Sc. Henrique P. P. Pereira and D.Sc. Ricardo Campos.
Conflicts of Interest
The authors declare no conflict of interest. The funders had no role in the design of the study; in the collection, analyses, or interpretation of data; in the writing of the manuscript, and in the decision to publish the results.
References
- Guza, R.T.; Inman, D.L. Edge waves and beach cusps. J. Geophys. Res. 1975, 80, 2997–3012. [Google Scholar] [CrossRef]
- Short, A.D. Three dimensional beach-stage model. J. Geol. 1979, 87, 553–571. [Google Scholar] [CrossRef]
- Holman, R.A.; Bowen, A.J. Bars, Bumps, and Holes’ Models for the Generation of Complex Beach Topography. J. Geophys. Res. 1982, 87, 457–468. [Google Scholar] [CrossRef]
- Wright, L.D.; Short, A.D. Morphodynamic Variability of Surf Zones and Beaches. Mar. Geol. 1984, 56, 93–118. [Google Scholar] [CrossRef]
- Masselink, G.; Short, A.D. The effect of tide range on beach morphodynamics and morphology: A conceptual beach model. J. Coast. Res. 1993, 9, 785–800. [Google Scholar]
- Short, A.D.; Klein, A.H.F. Brazilian Beach Systems: Introduction. In Brazilian Beach System; Short, A.D., Klein, A.H.F., Eds.; Coastal Research Library: Boca Raton, FL, USA, 2016. [Google Scholar]
- Price, T.D.; Ruessink, B.G.; Castelle, B. Morphological coupling in multiple sandbar systems—A review. Earth Surf. Dyn. 2014, 2, 309–321. [Google Scholar] [CrossRef]
- Aleman, N.; Robin, N.; Certain, R.; Anthony, E.J.; Barusseau, J.P. Longshore variability of beach states and bar types in a microtidal storm-influenced, low-energy environment. Geomorphology 2015, 241, 175–191. [Google Scholar] [CrossRef]
- Dean, R. Equilibrium beach profiles: Principles and applications. J. Coast. Res. 1991, 7, 53–84. [Google Scholar]
- Black, K.P.; Andrews, C.J. Sandy shoreline response to offshore obstacles, Part 1: Salient and tombolo geometry and shape. J. Coast. Res. 2001, 29, 82–93. [Google Scholar] [CrossRef]
- Gallop, S.L.; Bosserelle, C.; Pattiaratchi, C.B. The influence of coastal reefs on spatial variability in seasonal sand fluxes. Mar. Geol. 2013, 344, 132–143. [Google Scholar] [CrossRef]
- Allison, H.E.; Bassett, R.H. Climate change in the ocean: Human impacts and responses. Science 2015, 350, 778–782. [Google Scholar] [CrossRef] [PubMed]
- Population Reference Bureau. World Population Data Sheet, With A Special Focus on Human Needs and Sustainable Resources; Thecnical Report; Population Reference Bureau: Washington, DC, USA, 2016. [Google Scholar]
- United Nations. World Statistics Pocketbook; Thecnical Report; United Nations: New York, NY, USA, 2016. [Google Scholar]
- Black, K.P.; Andrews, C.J. Sandy shoreline response to offshore obstacles, Part 2: Discussion of formative mechanisms. J. Coast. Res. 2001, 29, 95–101. [Google Scholar]
- Black, K.; Mead, S. Design of the Gold Coast Reef for Surfing, Public Amenity and Coastal Protection: Surfing Aspect. J. Coast. Res. 2001, 29, 115–130. [Google Scholar]
- Pilarczyk, K.W. Design of Low-Crested (Submerged) Structures—An Overview. In Proceedings of the 6th International Conference on Coastal and Port Engineering in Developing Countries, Colombo, Sri Lanka, 14–19 September 2003; p. 19. [Google Scholar]
- Ranasinghe, R.; Turner, I.L. Shoreline response to submerged structures: A review. Coast. Eng. 2006, 53, 65–79. [Google Scholar] [CrossRef]
- Neves, L.; Moreira, A.; Taveira-Pinto, F.; Lopes, M.L.; Veloso-Gomes, F. Performance of submerged nearshore sand-filled geosystems for coastal protection. Coast. Eng. 2015, 95, 147–159. [Google Scholar] [CrossRef]
- Mead, S.; Black, K.P. Functional Component Combinations Controlling Surfing Wave Quality at World-Class Surfing Breaks. J. Coast. Res. 2001, 29, 21–32. [Google Scholar]
- Slotkin, M.H.; Chambliss, K.; Vamosi, A.R.; Lindo, C. Feasibility Study of Multi-Purpose Artificial Surf Reefs for Brevard County, Florida (Economic Segment); Report; PRAECIPIO EFS Inc., Economical Finance Statistics: Palm Bay, FL, USA, 2008; p. 81. [Google Scholar]
- Ranasinghe, R.; Larson, M.; Savioli, J. Shoreline response to a single shore-parallel submerged breakwater. Coast. Eng. 2010, 57, 1006–1017. [Google Scholar] [CrossRef]
- Ranasinghe, R.; Turner, I.L.; Symonds, G. Shoreline response to multi-functional artificial surfing reefs: A numerical and physical modelling study. Coast. Eng. 2006, 53, 589–611. [Google Scholar] [CrossRef]
- Pilkey, O.H.; Cooper, J.A.G. “Alternative” Shoreline Erosion Control Devices: A Review. In Pitfalls of Shoreline Stabilization: Selected Case Studies; Cooper, J.A.G., Pilkey, O.H., Eds.; Coastal Research Library: Boca Raton, FL, USA, 2012; pp. 187–214. [Google Scholar]
- Aagaard, T.; Greenwood, B. Infragravity wave contribution to surf zone sediment transport: The role of advection. Mar. Geol. 2008, 251, 1–14. [Google Scholar] [CrossRef]
- Falqueś, A.; Coco, G.; Huntley, D. A mechanism for the generation of wave-driven rhythmic patterns in the surf zone. J. Geophys. Res. 2000, 105, 24071–24088. [Google Scholar] [CrossRef]
- Coco, G.; Murray, A.B. Patterns in the sand: From forcing tem-plates to self-organization. Geomorphology 2008, 91, 271–290. [Google Scholar] [CrossRef]
- Wright, L.D.; Guza, R.T.; Short, A.D. Dynamics of a High-Energy Dissipative Surf Zone. Mar. Geol. 1982, 45, 41–62. [Google Scholar] [CrossRef]
- Werner, B.T.; Fink, T.M. Beach cusps as self-organised patterns. Science 1993, 260, 968–971. [Google Scholar] [CrossRef] [PubMed]
- Castelle, B.; Ruessink, B.G.; Bonneton, P.; Marieu, V.; Bruneau, N.; Price, T.D. Coupling mechanisms in double sandbar systems. Part 1: Patterns and physical explanation. Earth Surf. Process. Landforms 2010, 35, 476–486. [Google Scholar] [CrossRef]
- Caballeria, M.; Coco, G.; Falqués, C.A.; Huntley, D.A. Self-organization mechanisms for the formation of nearshore crescentic sand bars. J. Fluid Mech. 2002, 465, 379–410. [Google Scholar] [CrossRef]
- Muehe, D.; Lins-de-Barros, F.M. The Beachesof Rio de Janeiro. In Brazilian Beach Systems; Short, A.D., Klein, A.H.F., Eds.; Coastal Research Library: Boca Raton, FL, USA, 2016; pp. 363–396. [Google Scholar]
- Ng, K.; Thomas, T.; Michael, R.P.; Helena, C.; Borges, P.; Veloso-Gomes, F. Multifunctional artificial reefs for small islands: An evaluation of amenity and opportunity for São Miguel Island, the Azores. Prog. Phys. Geogr. 2015, 39, 220–257. [Google Scholar] [CrossRef]
- Reboita, M.S.; Rocha, R.P.; Ambrizzi, T.; Sugahara, S. South Atlantic Ocean cyclogenesis climatology simulated by regional climate model (RegCM3). Clim. Dyn. 2010, 35, 1331–1347. [Google Scholar] [CrossRef]
- Walker, J.R.; Palmer, R.Q.; Kukea, J.K. Recreational surfing on Hawaiian reefs. In Proceedings of the 13th Coastal Engineering Conference, Vancouver, BC, Canada, 10–14 July 1972; 20p. [Google Scholar]
- Black, K.; Mead, S. Design of Surfing Reefs. Reef J. 2009, 1, 177–191. [Google Scholar]
- MacMahan, J.; Brown, J.; Brown, J.; Thornton, E.; Reniers, A.; Stanton, T.; Henriquez, M.; Gallagher, E.; Morrison, J.; Austin, M.J.; et al. Mean Lagrangian flow behaviour on an open coast rip-channeled beach: A new perspective. Mar. Geol. 2010, 268, 1–15. [Google Scholar]
- Angremond, K.; Van der Meer, J.W.; Jong, R.J. Wave transmission at low-crested structures. In Proceedings of the 25th International Conference on Coastal Engineering, Orlando, FL, USA, 2–6 September 1996; pp. 1930–1935. [Google Scholar]
- Battjes, J.A. Surf similarity. In Proceedings of the 14th International Conference on Coastal Engineering, Copenhagen, Denmark, 24–28 June 1974; pp. 466–480. [Google Scholar]
- Ranasinghe, R.; Sato, S. Beach Morphology Behind Single Impermeable Submerged Breakwater Under Obliquely Incident Waves. Coast. Eng. J. 2007, 49, 1–24. [Google Scholar] [CrossRef]
- Sumer, B.M.; Whitehouse, R.J.S.; Tørum, A. Scour around coastal structures: A summary of recent research. Coast. Eng. 2001, 44, 153–190. [Google Scholar] [CrossRef]
- Staublet, D.K.; Tabart, J.R. The Use of Submerged Narrow-Crested Breakwaters for Shoreline Erosion Control. J. Coast. Res. 2003, 19, 684–722. [Google Scholar]
- Jackson, L.A.; Corbett, B.B.; McGrath, J.; Tomlinson, R.; Stuart, G. Narrowneck reef: Review of seven years of monitoring. Shore Beach 2007, 75, 1–13. [Google Scholar]
- Hoefel, F.; Elgar, S. Wave-Induced Sediment Transport and Sandbar Migration. Science 2003, 299, 1885–1887. [Google Scholar] [CrossRef] [PubMed]


© 2019 by the authors. Licensee MDPI, Basel, Switzerland. This article is an open access article distributed under the terms and conditions of the Creative Commons Attribution (CC BY) license (http://creativecommons.org/licenses/by/4.0/).