The experiment was divided into two parts: a phosphorus release experiment with sediment suspension and a phosphorus release experiment without sediment suspension. The difference between them was the diameter of sediment, which, depending on its size, would either suspend or not under a hydrodynamic condition.
2.1.2. Experimental Sediment
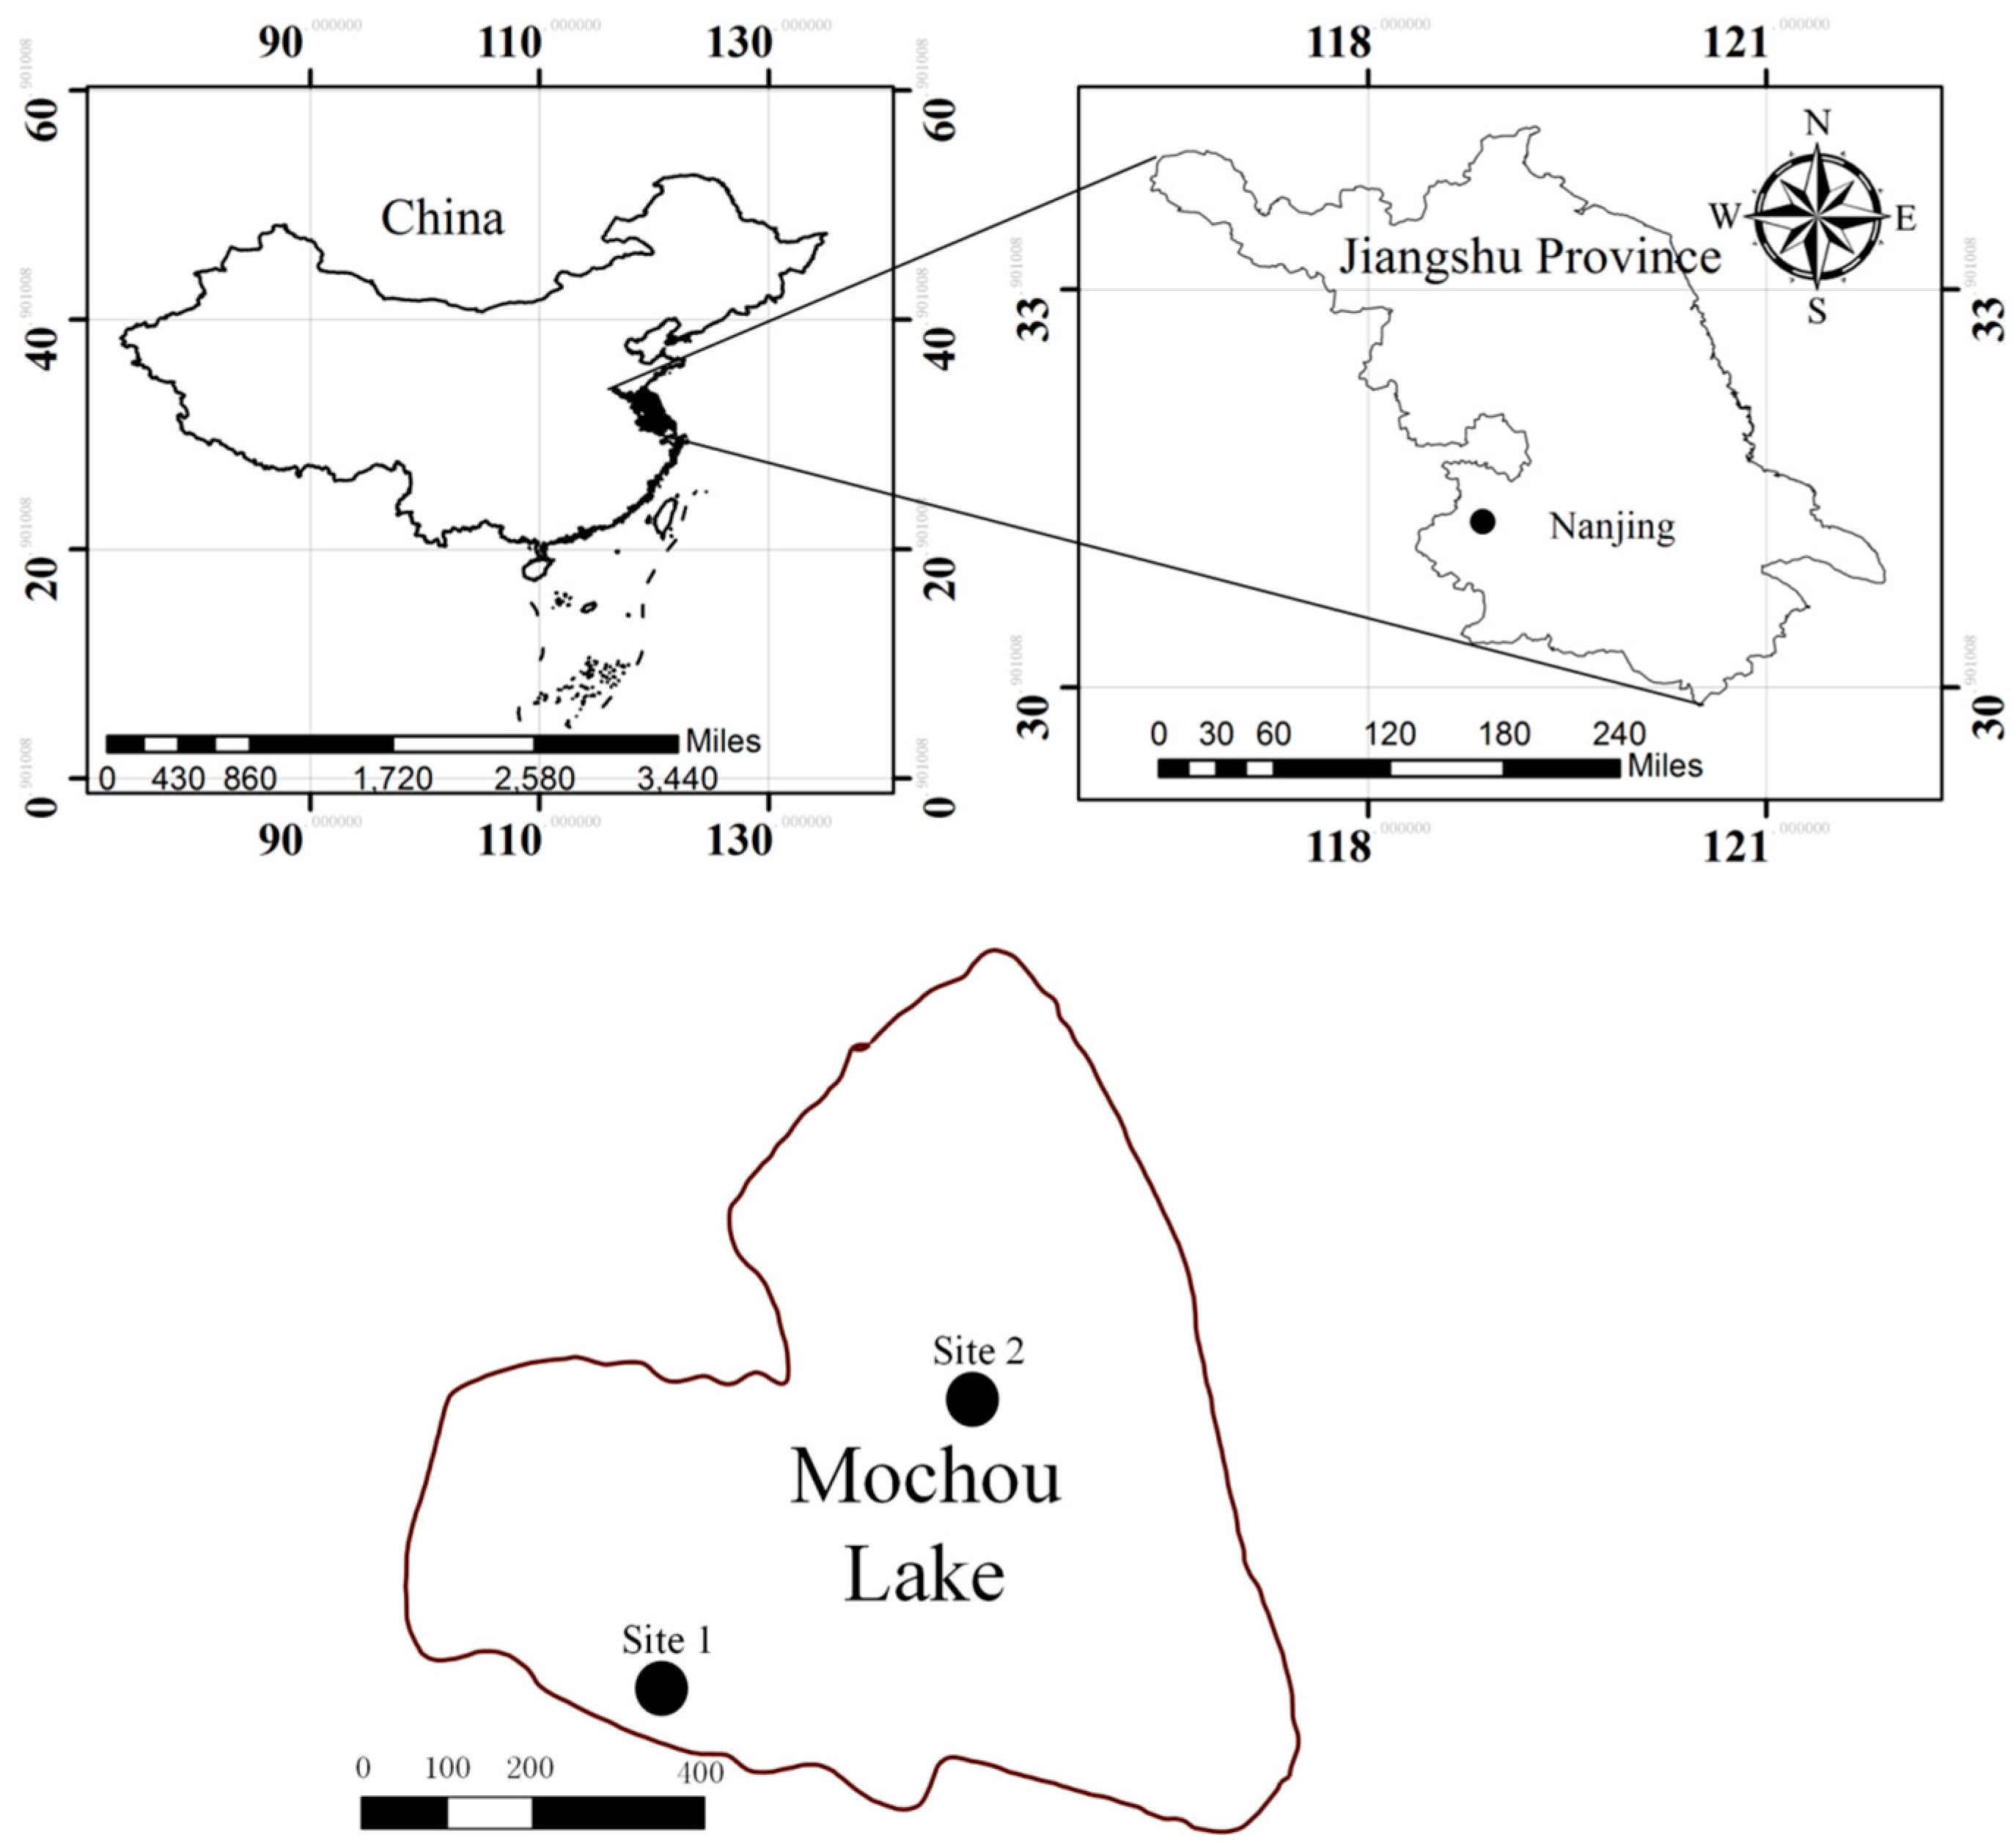
The sediment was collected from Site 1 and Site 2 (
Figure 2), respectively. Due to the previous lake slope protection project, a large amount of large diameter sediment was filled in the shore of Mochou Lake in 2015, the sediment diameter of Site 1 along the shore of Mochou Lake is larger than that of Site 2. The diameter of the sediment at Site 2 (D2) ranged from 0.15 cm to 0.23 cm, with a median diameter of 0.18 cm. The sediment was too coarse to suspend, even at the highest propeller speed (300 rad/min). The sediment diameter (D1) of Site 1 is given in
Table 1. The diameter of sediment in Site 1 is small enough to have it suspend in a hydrodynamic condition.
Mochou Lake has a history of 1500 years, with an average water depth of 2.5 m, a lake surface area of 0.3 km
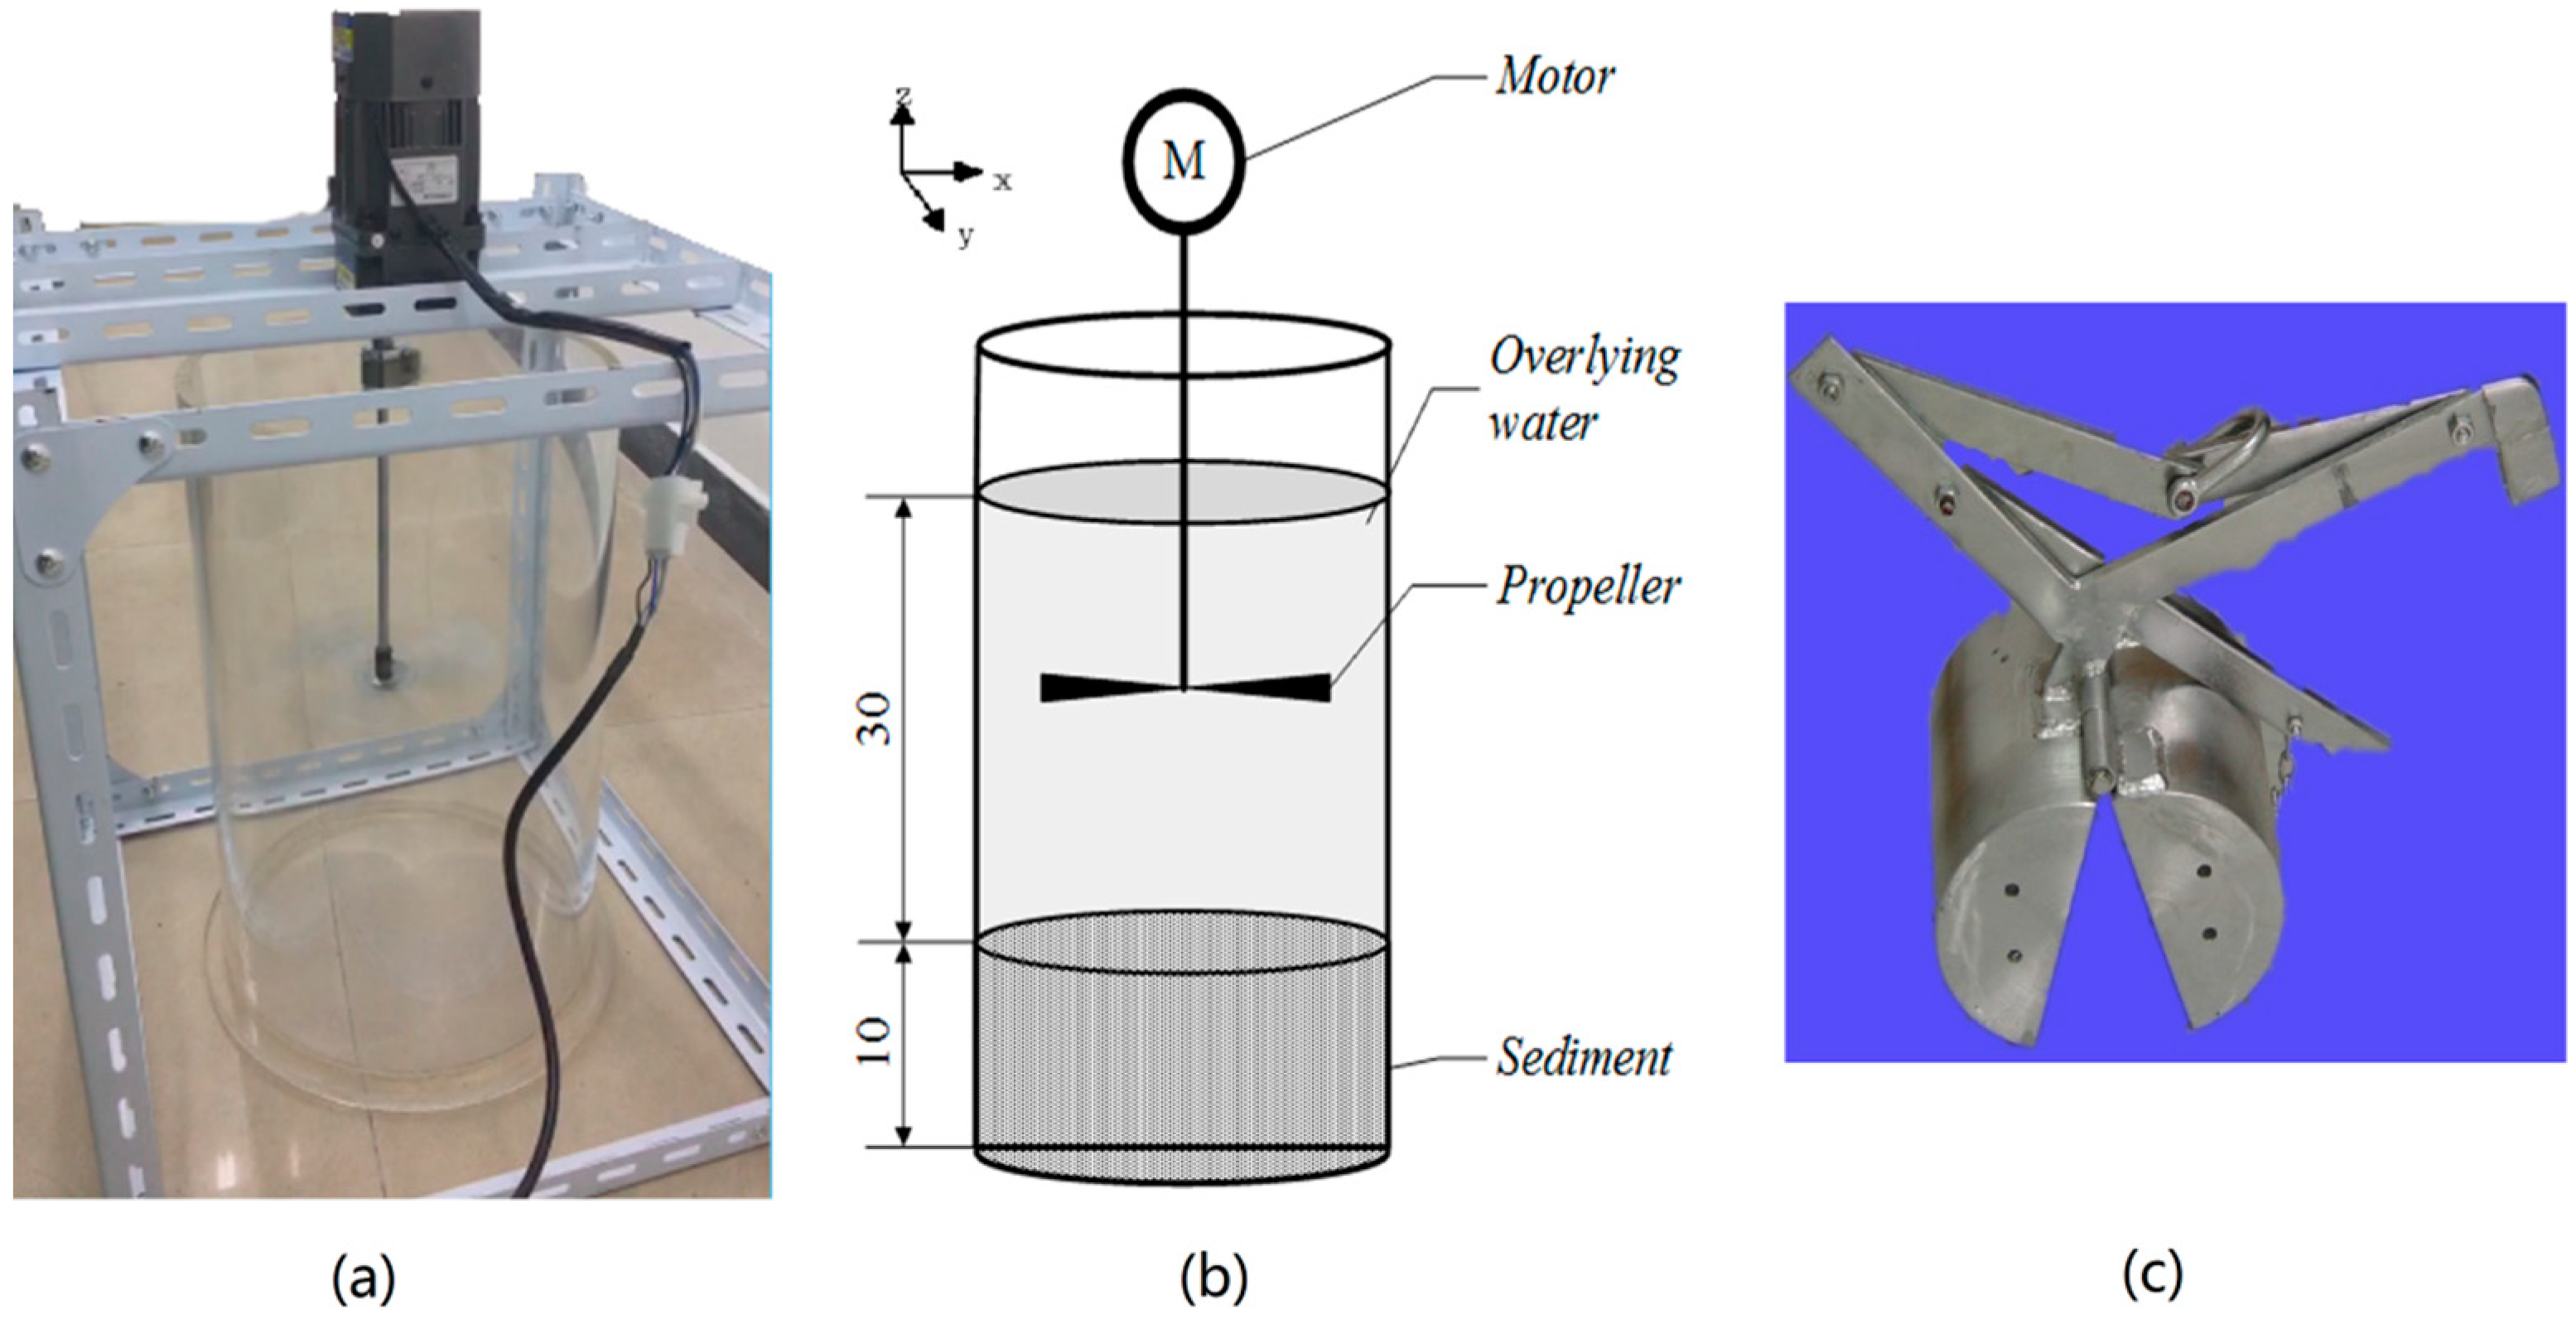
2, and a maximum water depth of 4 m. On 21 July 2018, we used a Petersen grab to dig a surface sediment at a depth of 0 cm to 10 cm in Mochou Lake. This lake is frequently influenced by winds, with wind-induced currents transporting dissolved matters (e.g., nutrients). There are two main parts of the sampling device: a sampling grab and a pulling rope. The sampling grab is made of a high-quality alloy material, as shown in
Figure 1c. The one-time sampling sediment volume was 1–5 L, and the diameter of the sampling grab was 18 cm.
2.1.3. The Experimental Method
Before the experiment, the sediment samples were fully stirred, and the thickness was controlled at 10 cm. A total of 20 L of deionized water was slowly added to the Plexiglas container, and the container was placed for 24 h prior to the experiment. The speed of the propeller for the various steps was set to 100 rad/min, 200 rad/min, and 300 rad/min, respectively. The experimental parameters are shown in
Table 2.
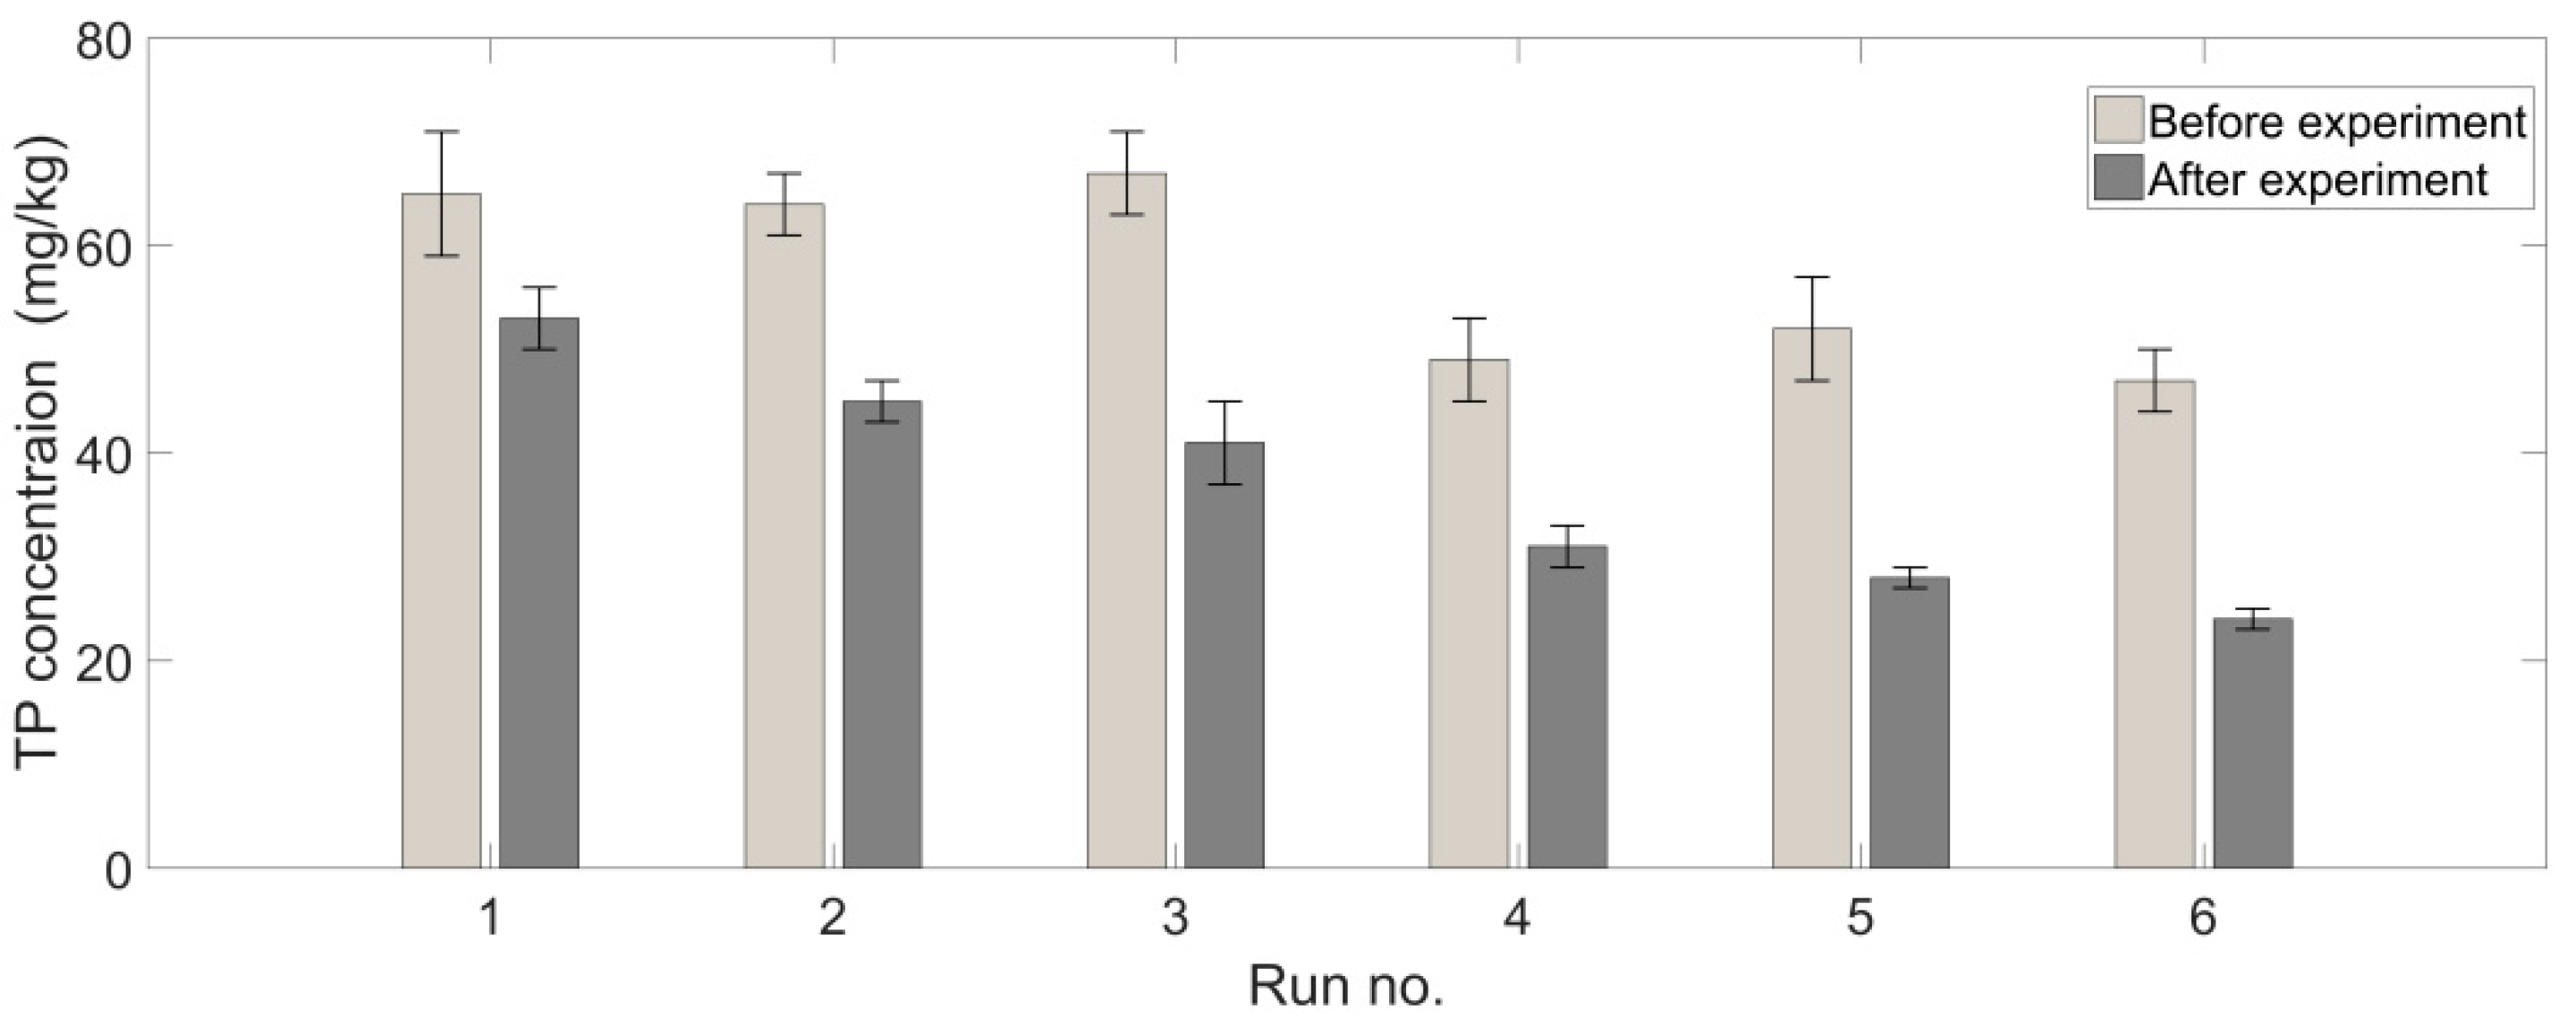
Three 100 g sediment samples were taken from the sediment bed before and after each experiment run. The TP concentration of the sediment was determined by Chinese environmental standard HJ632-2011: Soil Determination of Total Phosphorus by alkali fusion-Mo-Sb anti-spectrophotometry method.
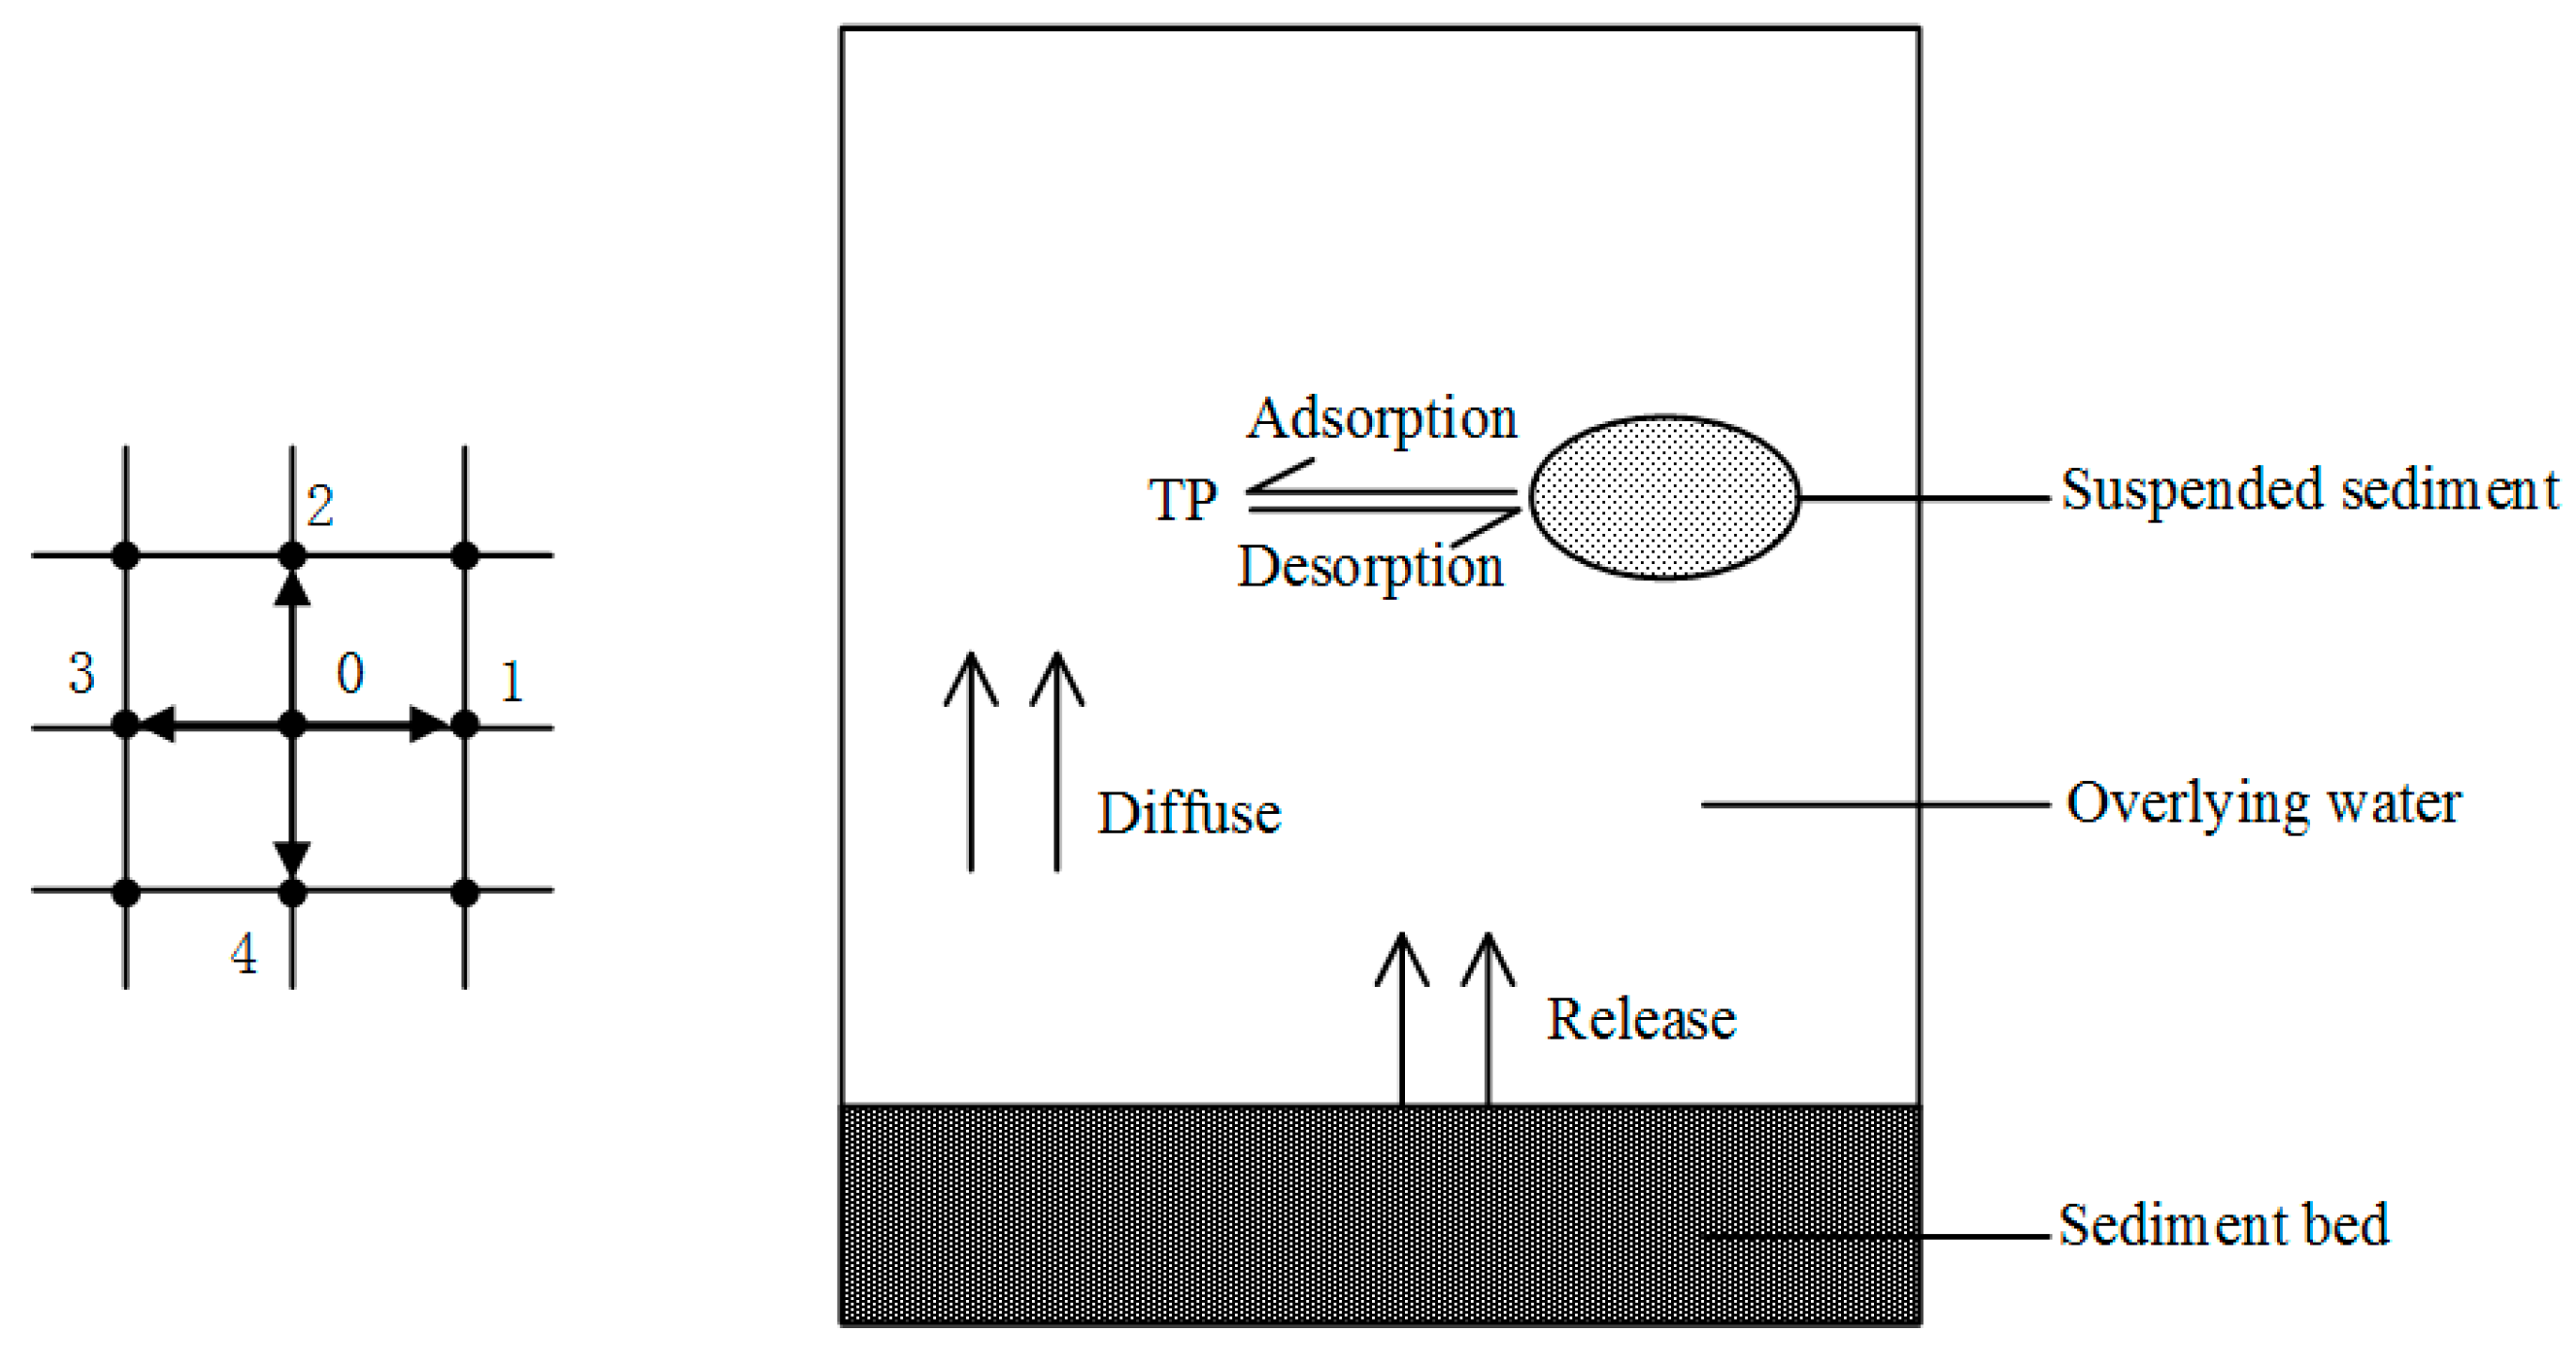
For each experiment run, three 30 mL water samples were extracted from each experimental run for each hour of total experimental time. The DP and TP in the water was determined using the Mo-Sb anti-spectrophotometry method of Yuan [
17], the samples for TP determination needed to be digested in advance, and the samples for DP determination needed to be filtered without being digested. In addition, the particulate phosphorus (PP) was estimated as the difference between the TP and the DP (i.e., PP = TP − DP). The TSS concentration was calculated using a drying method. The beaker with 20 mL sampling water was placed in an oven at 115 °C till all the water evaporated. The calculated equation was as follows:
where
is the weight after drying,
is the weight of the beaker, and
is the volume of sampling water.
2.1.4. Selection of Propeller Speeds Based on Field Data
At Site 1, the flow velocity (
), positioned in the water 0.5 m above the bed, was measured using a LS1206B intelligent portable velocimeter which was made by Nanjing Shunlaida Measurement and Control Equipment Co., Ltd. (Nanjing, China). The velocity measurement error was less than 1.5%, and each sampling time was 5 min. The wind speed (
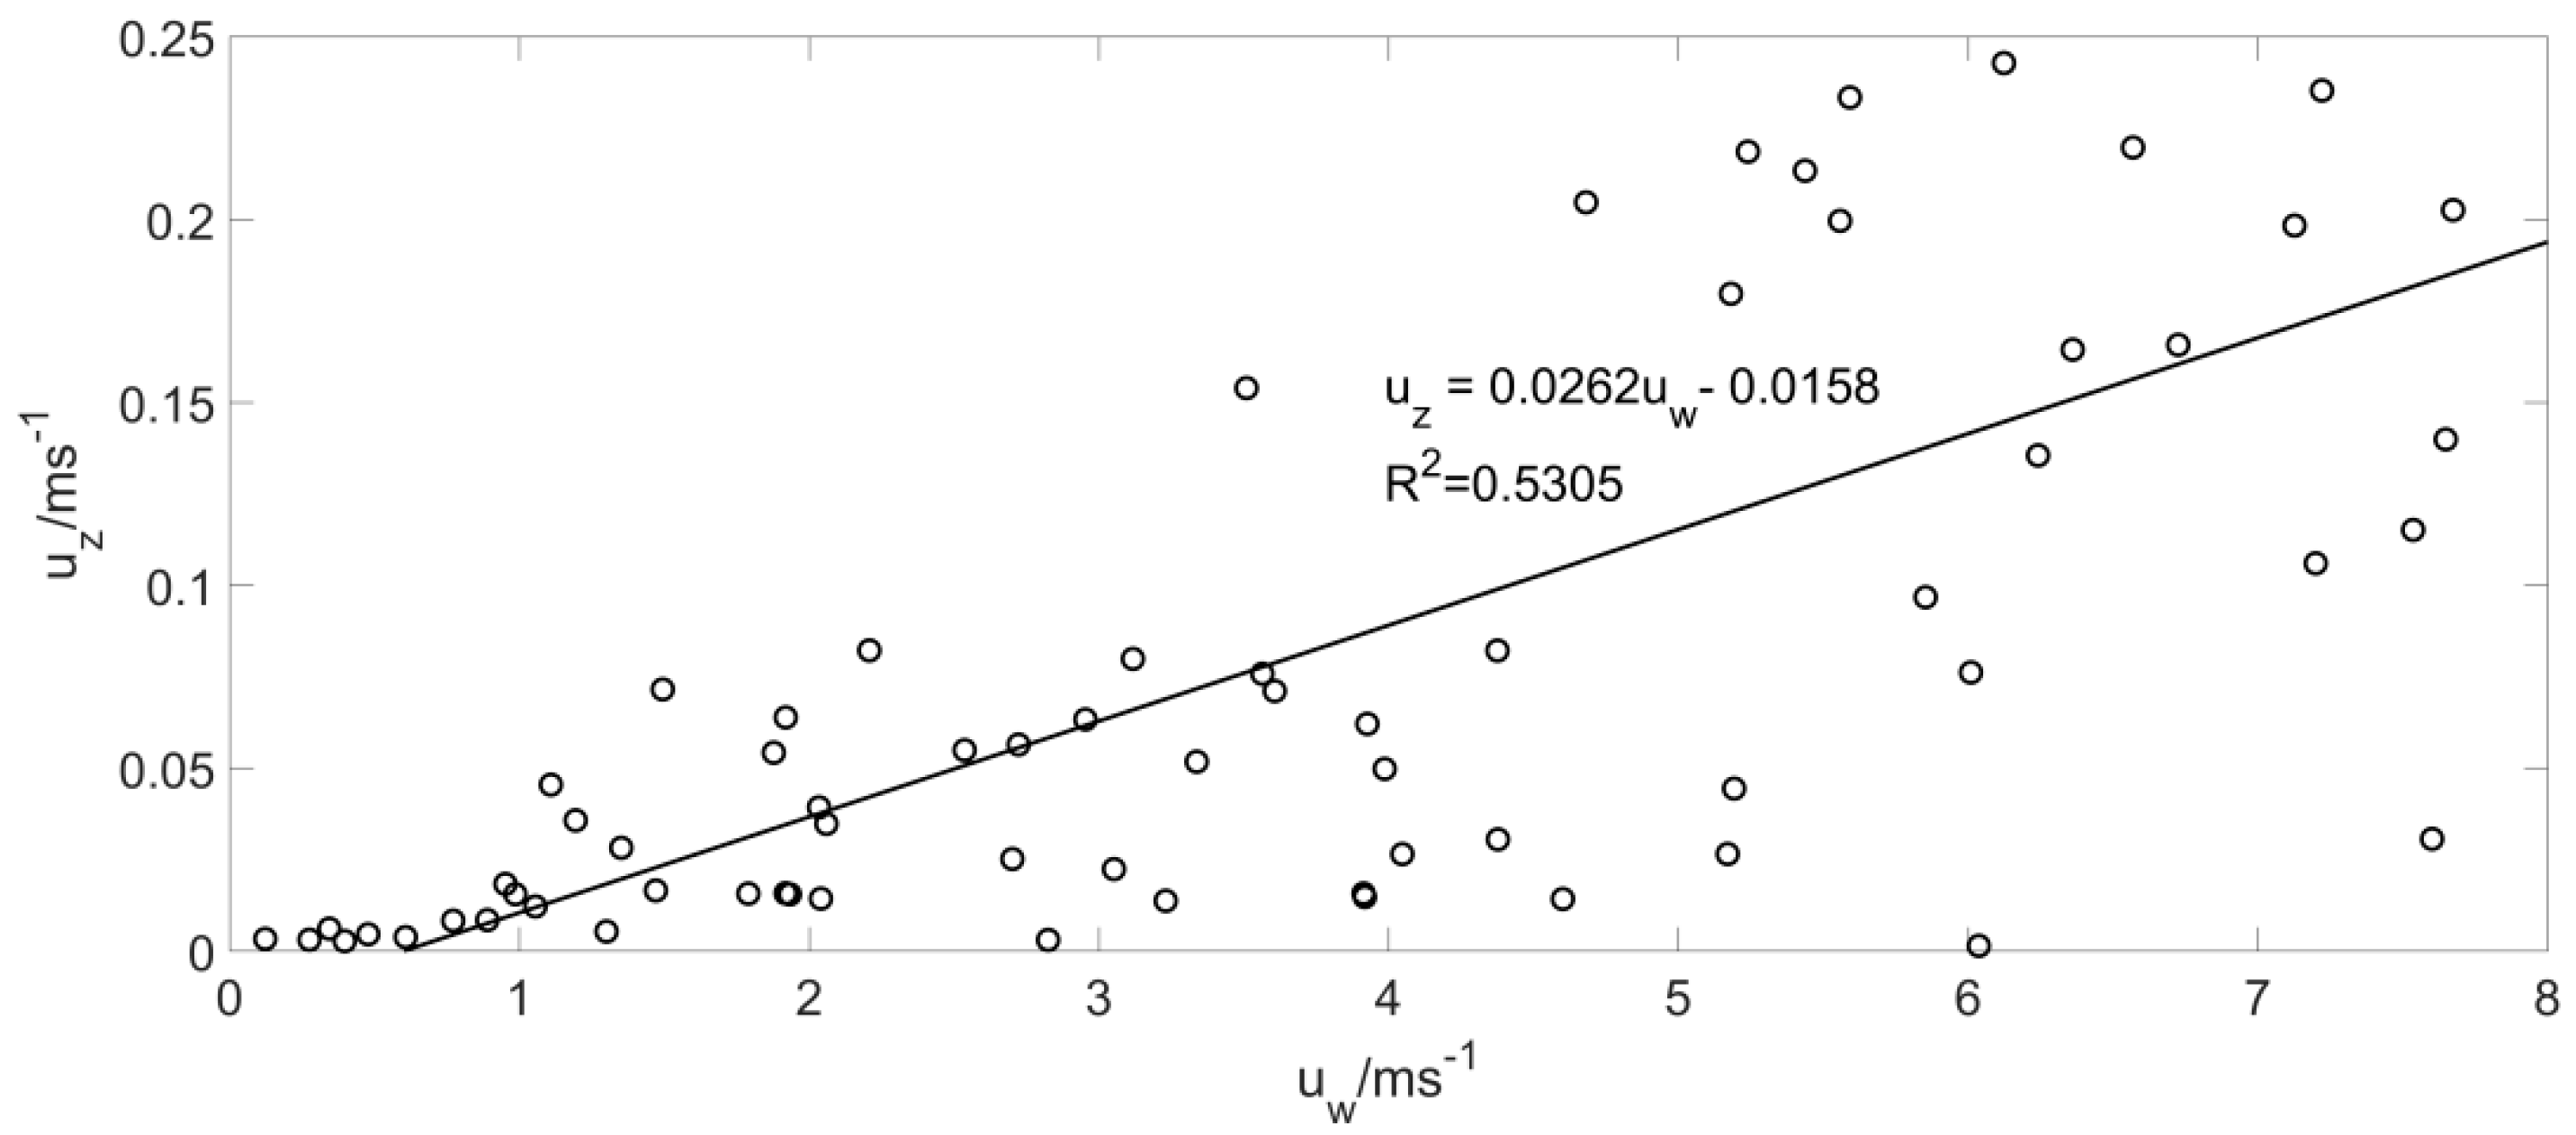
), positioned 0.2 m above the water surface, was measured using an AR866 handheld thermosensitive anemometer made by Suzhou R.B.T Measurement and Control Technology Co., Ltd. (Suzhou, China). The wind speed measurement error was less than 1%, the measurement range was from 0.3 m/s to 30 m/s, and each sampling time was 5 min. The data was measured at 10:00–12:00 am, 2:00–4:00 pm on 22, 24 and 27 July 2018, respectively. Three groups of corresponding velocity and wind speed per hour were measured at Site 1. A statistical analysis of the field data (
Figure 3) indicates that the occurrences of the
were less than 0.25 m/s and that the
was less than 8 m/s.
Based on the similarity principle, the rotational speeds are selected so that the Froude number in the laboratory condition (
) is equal to that in field conditions (
) [
18].
Under laboratory conditions,
where
is the tangential speed in the laboratory experiment,
is the height above the sediment surface in the laboratory experiment (herein,
= 0.25 m), and
is the gravitational acceleration.
Under the field condition
where
is the height above the sediment surface in the field (herein,
= 0.5 m) under laboratory conditions.
From the general relation between the tangential and angular speeds, the laboratory experimental rotational speed is
where
is the propeller speed, and
is the radius of the stirring rod (herein,
= 0.045 m).
This study examined the relationship between
and
that corresponds to the dynamic condition caused by the propeller speed to the wind speed. When measuring, the maximum wind speed can be less than 8 m/s, but sometimes the maximum wind speed in Nanjing can be larger than 8 m/s. The field wind speed varied from 4.65 m/s to 12.74 m/s, and
varied from 0.075 to 0.225 (
Table 3). As a result, the propeller speeds were set to 100, 200, and 300 rad/min in the laboratory experiment to simulate the prevailing wind speed of 4.65 m/s to 12.74 m/s in the lake. Huang et al. [
18] examined the shear stress caused by lake currents, because they are considered to have similar dynamic effects to the stirring rod on the sediment resuspension, and because the dynamic simulator can produce shear stresses of water currents in the laboratory. The propeller speeds were selected to simulate the prevailing bottom flow velocities of 0 m/s to 0.08 m/s (calculated by Equation (6)), as in Taihu Lake. As a result, the blade stirrer operated at propeller speeds of 0, 100 rad/min, 200 rad/min, 300 rad/min, and 400 rad/min in the laboratory experiment. We used the same method to examine which propeller speeds to select to simulate the prevailing bottom flow velocities of 0 m/s to 0.04 m/s in the lake. As a result, the blade stirrer operated at the propeller speeds of 0, 100 rad/min, 200 rad/min, and 300 rad/min in this laboratory experiment.
The bottom boundary velocity is computed as
where
is the von Kármán’s constant, and
is the bottom boundary roughness, (we assume this based on existing literature [
1,
8]
).


