1. Introduction
For centuries, many rivers have been regulated to limit flooding and enable a variety of uses, including hydroelectricity, leisure, irrigation, and drinking water supply. In the northern third of the planet, 77% of rivers now have a dam or river diversion in place [
1]. Environmental impacts of dams have been described by many authors [
2,
3,
4,
5]. These impacts include effects of water-storage dams on the full range of the flow regime. In absence of floods, (high) sediment supply from tributaries downstream of dams can lead to aggradation of the bypassed reach (reach immediately downstream of the dam receiving only minimum flows) [
2]. In particular, sedimentation of fine sediments may significantly disrupt biological functions by bed clogging or sand deposits [
2].
In the light of potential ecological alterations of dams on river systems, researchers have recommended restoring a more natural flow regime [
6,
7,
8]. The natural river regime is variable and this variability is key to maintaining indigenous species and biodiversity in general. The hydrological regime of regulated rivers can, therefore, be managed through the five components that characterize the variability of natural flow regime: flow magnitude, frequency, and duration, as well as variations in water levels at daily or seasonal scales [
8].
High flow releases (or “flushing flows”) are a tool for discharge management that aims to act on the morphology of the channel downstream of dams to meet environmental objectives [
8]. The scientific literature largely agrees on the need to perform such releases [
8,
9,
10,
11,
12,
13] in the interest of imitating the effects of natural floods as much as possible [
14,
15,
16,
17]. By revitalizing fluvial processes along the river, high flow releases can potentially improve physical habitats more efficiently than hydromorphological restoration work [
18], but their widespread use is relatively recent [
10]. Experiments have been conducted in a number of countries in recent years [
19], and some have been presented in dedicated scientific publications in Spain [
20], Switzerland [
21], and the USA [
22,
23]. These flushing flows have varied and sometimes multiple objectives, including reducing clogging in spawning areas [
24,
25,
26], improving general habitat conditions [
17], controlling algae proliferation in the river channel [
20,
27,
28], and riparian forest maintenance [
17,
29].
According to the scientific literature, displacing sediments delivered by tributaries is rarely the primary objective of flushing flows, with the exception of the Colorado River [
22,
30]. Although the study of sand transport is often an integral part of research on improving clogging conditions in spawning areas, releases most often target silts and not sand. Therefore, sand is generally not monitored in this type of operation, and there are only a few studies describing the influence of flushing flows on the sand fraction, such as those conducted on the Colorado River [
31,
32] and the Bill Williams River [
23].
In most cases, flushing flows aim to imitate a period of natural high flows [
8], and the selection of key parameters, such as magnitude and duration, raise a number of issues. In particular, these parameters need to be determined to account for the energy loss of releases as they travel downstream (i.e., the attenuation of peak depth magnitude), thereby resulting in reduced effectiveness along a river continuum (reduced transport capacity) [
33]. The choice of the flow discharge depends on the velocities and bed shear stresses required to induce the desired morphological process [
27,
29]. The required duration of a release is difficult to determine a priori as it depends on a number of parameters, such as the project reach length, slope, and morphology (particularly mesohabitat units) [
34]. The duration of the release also depends on the particle size targeted by the operation. Some authors have shown that the peak of the silt pulse travels slightly more slowly [
35], at the same speed [
24] or slightly more quickly [
36] than the peak water pulse. The duration, therefore, needs to be calculated so that the release can simultaneously impact the entire reach with a discharge that falls relatively slowly. Sand travels more slowly than silt [
12]; furthermore, the duration required to export sand corresponds to the length of transit desired and is more difficult to calculate than for the duration to export silt [
37,
38]. In the end, the intensity and the duration of a flow release is a compromise between the required sediment transport for an effective flushing operation and the water volume available according to the reservoir dam capacity and allocations for other water uses associated with the dam or the river [
39]. These elements highlight the fact that a priori determination of flushing flow characteristics is complex and support recommendations for using adaptive management [
10,
40,
41,
42] and closely-monitored experiments [
24,
36,
43].
This study aims to summarize findings and recommendations from an adaptive management plan of flushing flows on the Selves River. The plan concerns a large reservoir dam whose bypass reach is subject to significant sand and silt deposits, which are suspected of impairing reproductive habitat conditions for trout. Four experimental flushing flows were carried out in 2016 and 2017 to evaluate the required intensity and duration of flow releases. A set of hydraulic, geomorphological, and biological parameters were monitored to observe the effects of the flushing flows on sediment grain size distribution and physical habitats in the bypassed reach. The results illustrate the effects of different discharges under very similar time and weather conditions in 2016. The results also provide operational information on silt and sand transport using an original approach potentially applicable to small rivers. Furthermore, this study represents an important contribution to the relatively sparse existing body of literature regarding the effects of water releases on streambed sediment conditions [
44].
2. Site Description
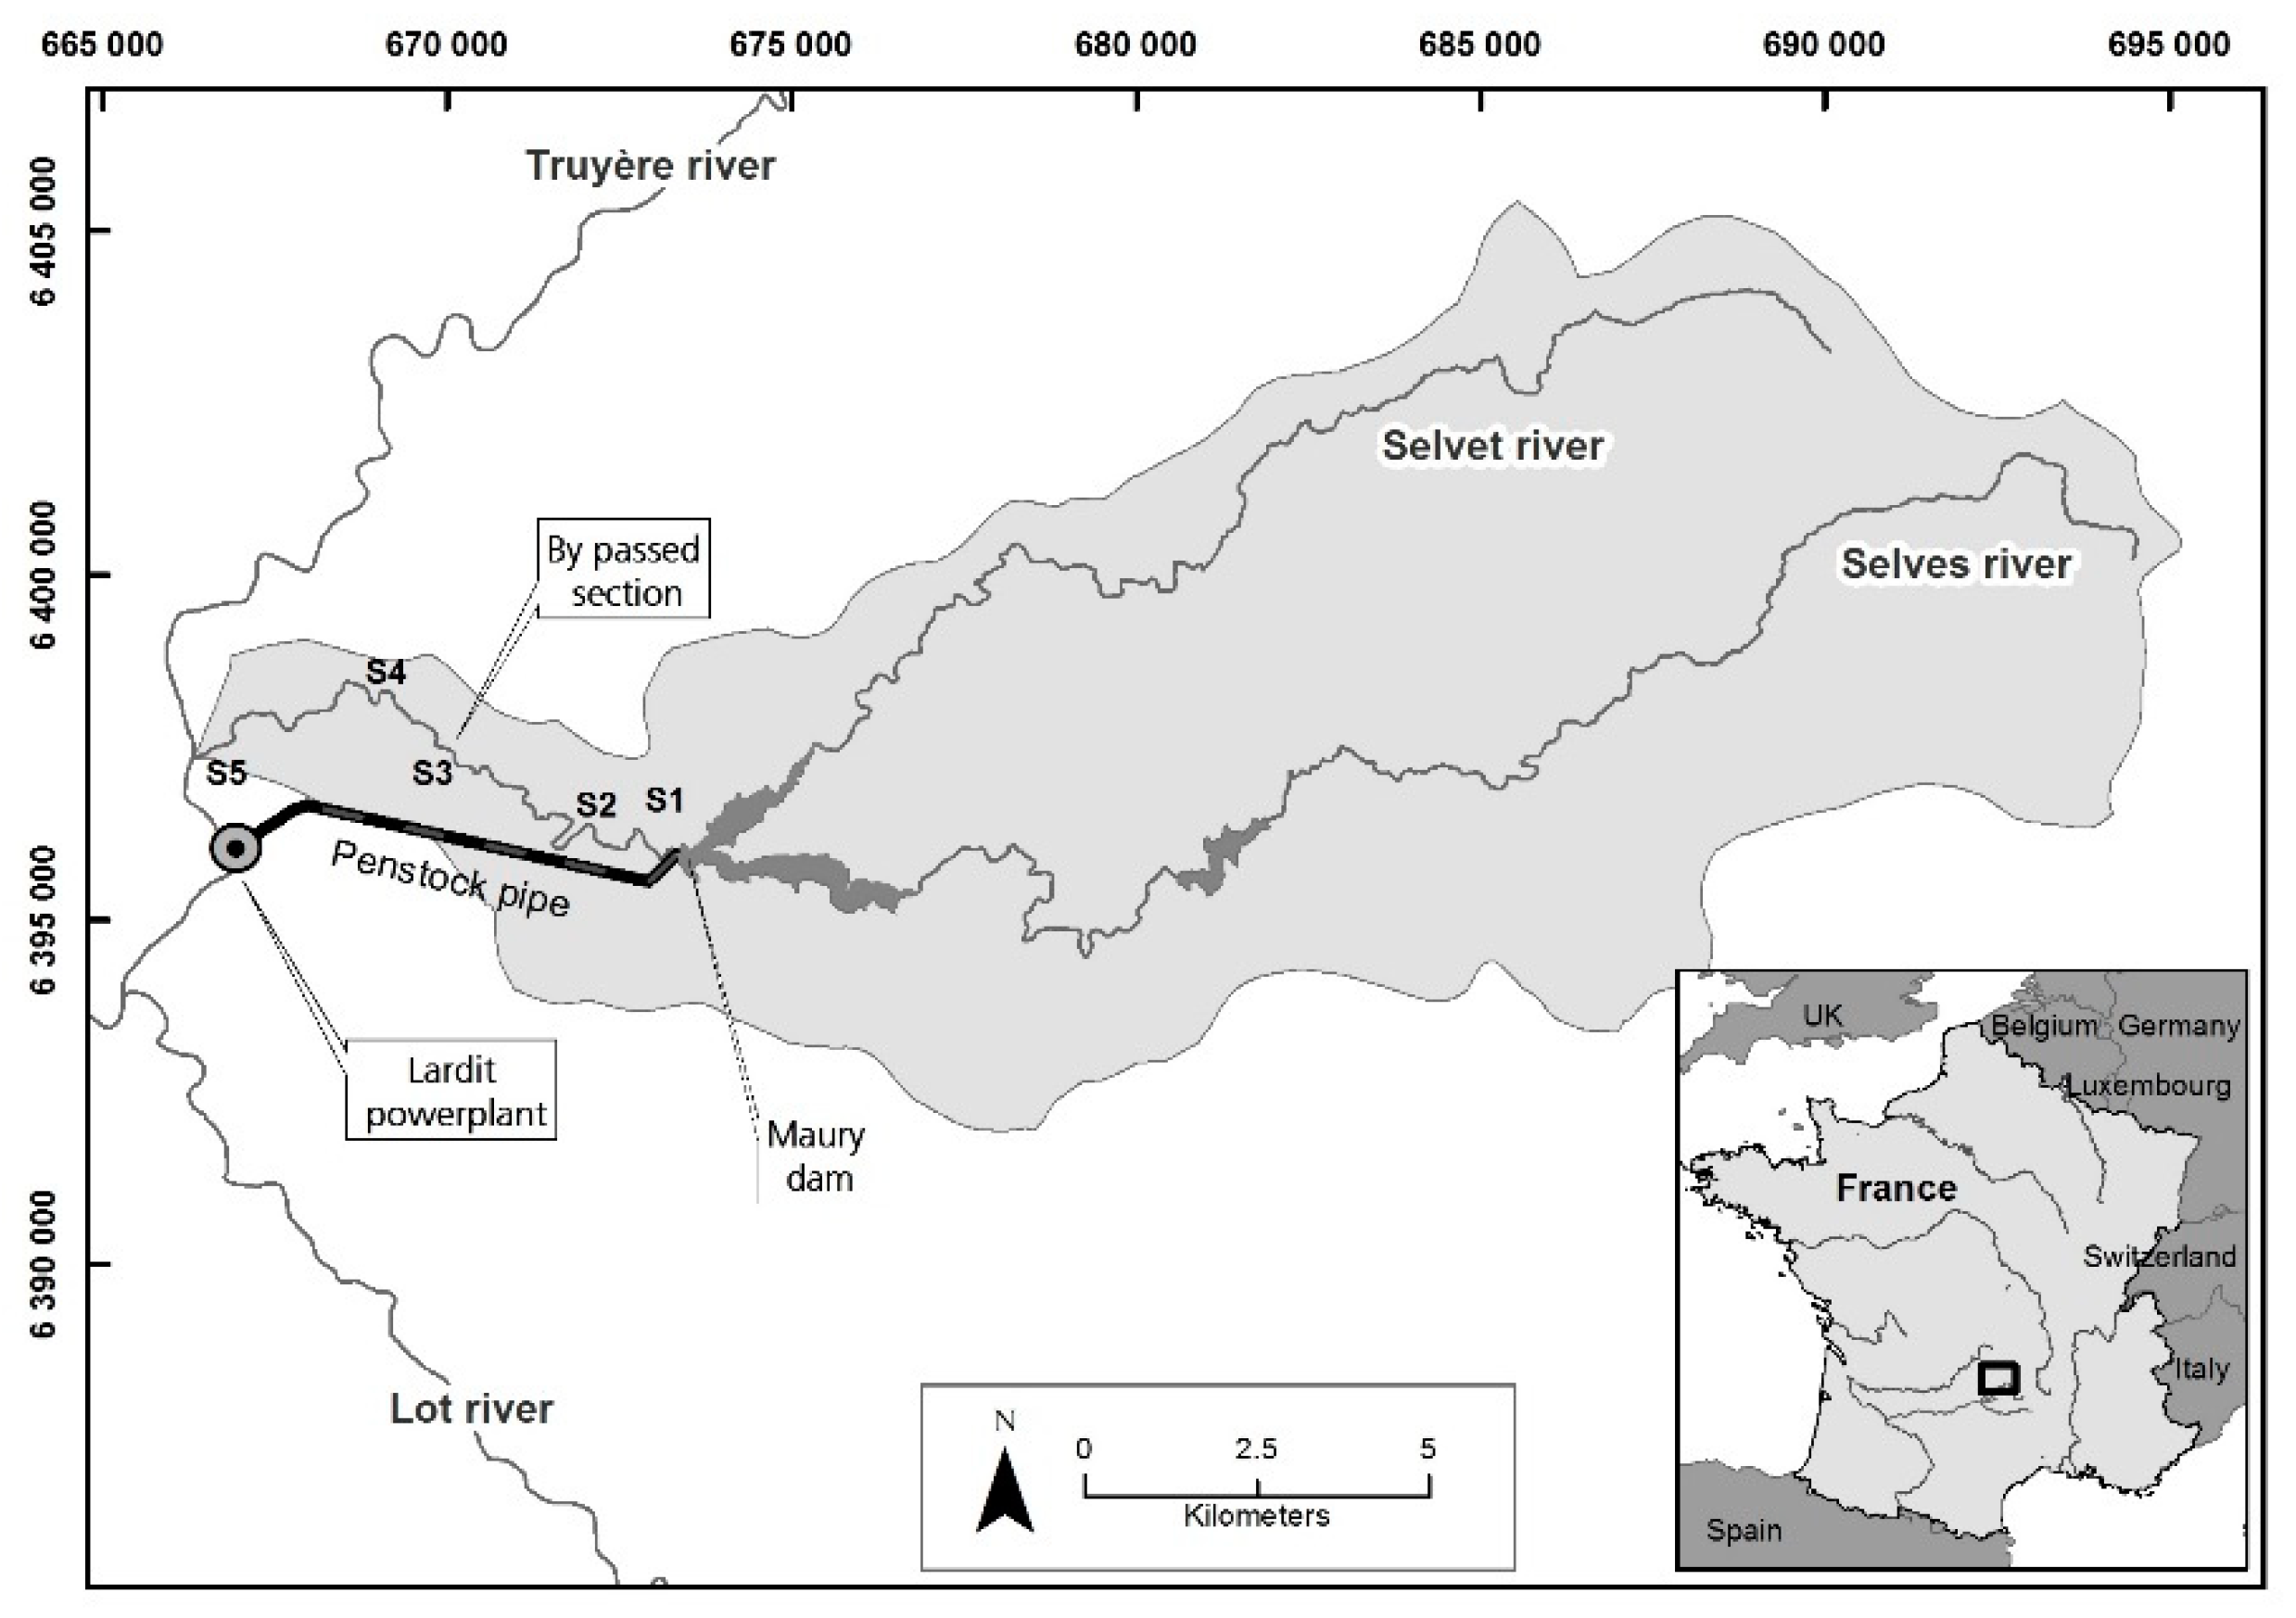
The Selves River is a tributary of the Truyère River (Garonne Basin, France) that flows from east to west for a distance of 44.5 km through the Massif Central mountain range (
Figure 1). Its source is at 1300 m altitude, and it drains a catchment area of 189 km
2. It crosses the Aubrac plateau up to the Maury dam, then flows into gorges over the last 10 km. The river catchment area primarily consists of little fractured and highly impermeable volcanic rock. It delivers large quantities of sand, which are found in the bed of the Selves and its tributaries. The region has a montane climate with an average annual precipitation of up to 1200 mm in lower-lying areas and up to 1800 mm in the higher-altitude catchment area. The catchment area is mainly occupied by meadows and woodlands.
The Maury dam was commissioned in 1947 by Electricity of France (EDF) to produce electricity and is also used for tourism purposes (swimming, fishing, etc.). It is 65 m high and has a catchment area of 164 km² to create a reservoir of 166 ha with a normal storage capacity of 35 hm3. The reservoir water is diverted to the Lardit powerplant located downstream of the Selves catchment area, bypassing the last 11.3 km of the Selves River.
The natural characteristic instantaneous discharges at the Maury dam are 4.8 m3/s for the average flow, 61 m3/s for 2-year return flow, and 110 m3/s for 10-year return flow. The Maury dam has greatly modified the hydrology of the downstream river course as it was designed to store a large volume of water. Since 1947, a number of major floods have been observed upstream of the dam (1965: 120 m3/s, 1981: 94 m3/s, 2003: 110 m3/s), but only one led to downstream overflows as the rain event had not been anticipated (1994: 74 m3/s). The flows observed for over 70 years in the bypassed reach are, thus, almost exclusively at the minimum flow (240 L/s), in addition to the small inflows from small tributaries in the gorges. The many tributaries of the bypassed reach measure just a few hundred meters in length and have a catchment area representing 13% of that of the Selves downstream the Maury dam.
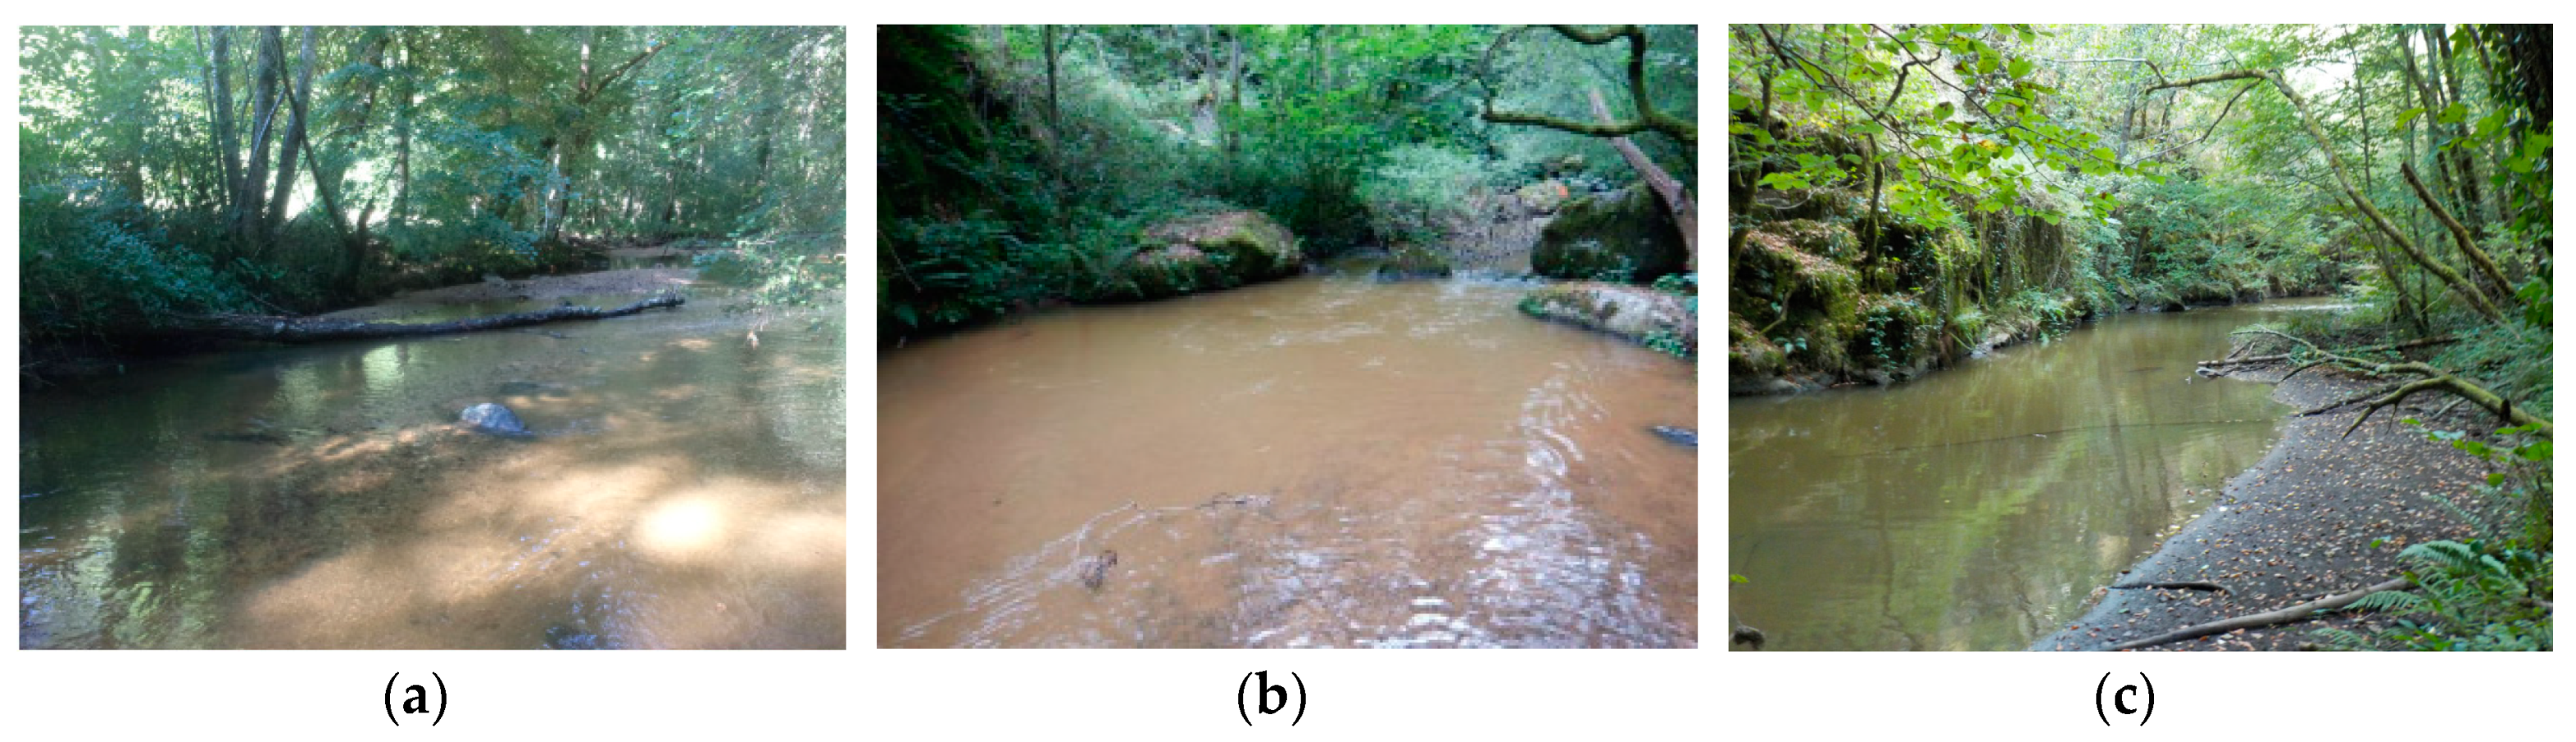
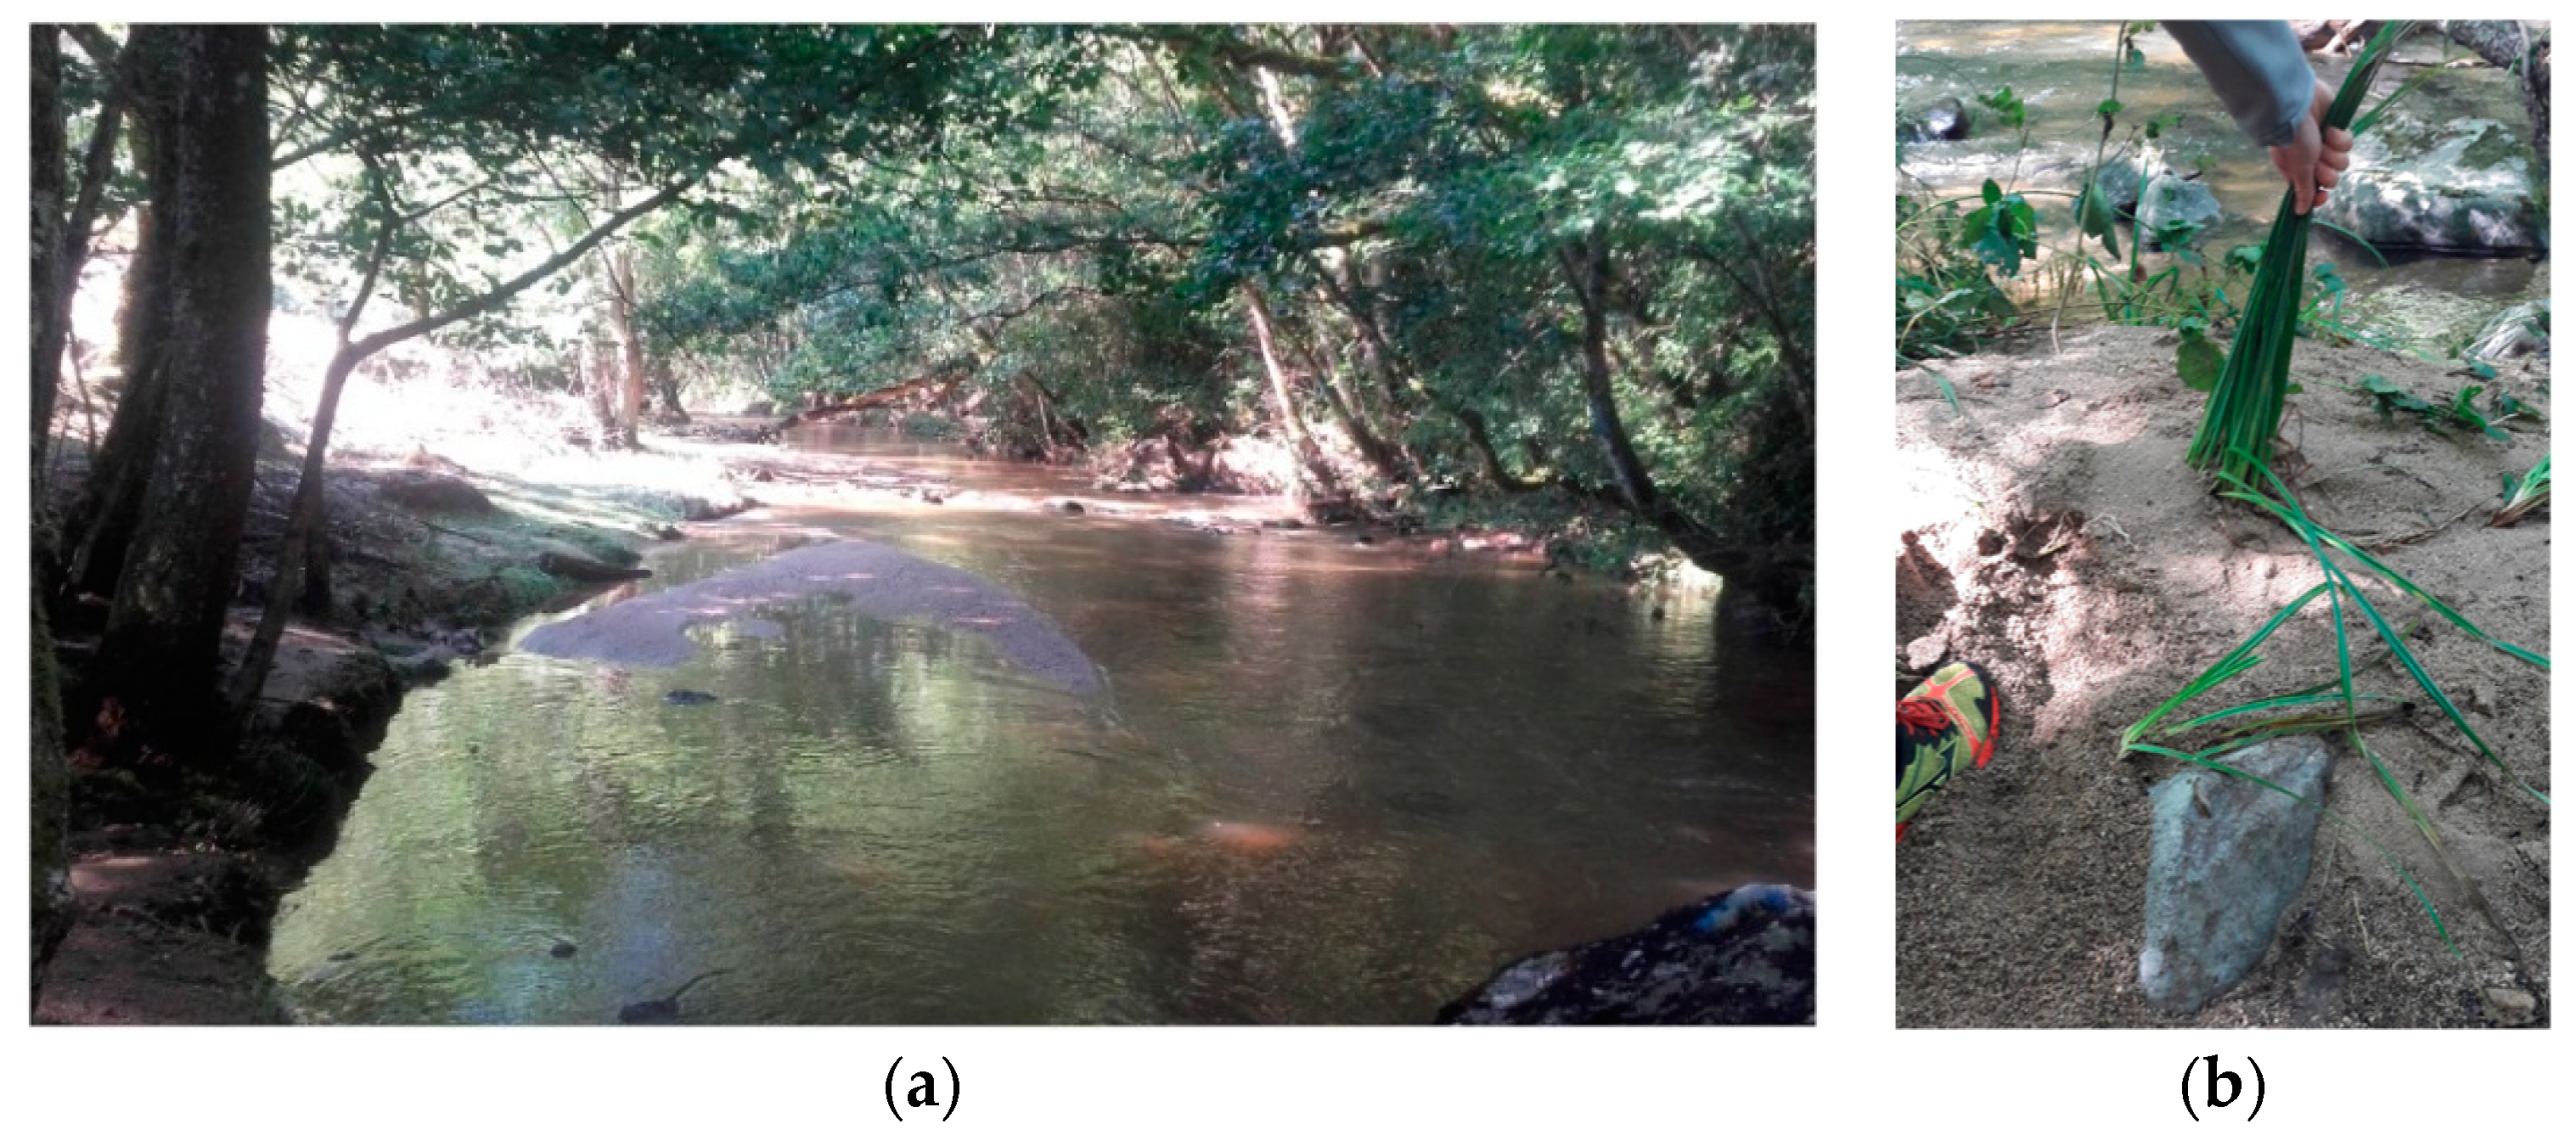
The transport capacity downstream of the dam has consequently been considerably reduced as has the sediment supply because the reservoir traps all of the incoming sediments. In the bypass reach, the current sediment supply comes from the aforementioned tributaries, mainly arriving during storms and is dominated by sand. It is not transported further once in the bypassed reach because the minimum flow has a low transport capacity, resulting in fairly widespread sand deposits (
Figure 2). Some of these deposits also contain silt due to soil erosion, decaying organic materials (mainly leaves), and dam maintenance operations (bottom gate opening and drainage).
The bypassed reach is located in a series of gorges of varying widths and depths with an average slope of 0.027 m/m. Rocky outcrops control the bed and its lateral mobility. The bed material grain size distribution is bimodal, with a coarse fraction of boulders and cobbles (>64 mm) and a fine fraction composed of silts, sand, and very fine gravel (<4 mm). In the slower portions of the river, widespread sand deposits can be observed on the bed near the main tributary mouths.
Although the aquatic invertebrate population is of high quality on the Selves River [
45], sand aggradation and bed clogging have led to a reduction in fish populations compared to the natural capacity [
46]. Electrofishing historically has demonstrated that there are larger trout populations at uninfluenced stations upstream of the dam than in the bypassed reach. A reduction in the frequency of small floods facilitates clogging of coarse alluvial substrates by fine sediments [
24], which can significantly disrupt biological function, and reduce fish populations [
47,
48,
49]. Clogging and sand deposits reduce the number and size of spawning areas as well as the amount of refuge and nursery habitat, which is especially problematic on the Selves [
46]. Salmonid fish species (brown trout,
Salmo trutta fario) inhabiting the Selves River require an unclogged substrate for reproduction. Managers from the local fish agency and EDF have observed silt and sand aggradation for many years. A joint decision was, therefore, taken to implement sand-removal releases downstream of the dam to improve conditions for the local trout population.
3. Materials and Methods
3.1. Designing Experimental Flow Releases
Two main morphological objectives were defined to improve biological functions:
Remove a maximum of silt, sand, and organic material (leaves and small woody debris) from the bypassed reach channel,
Avoid coarse sediment transport to prevent substrate disruption that would impact aquatic fauna (as there are no natural inputs of coarse sediments).
This approach requires determining the most effective flow magnitude and duration for unclogging and removing silt and sand deposits from the river, without affecting coarser sediments. Furthermore, the releases needed to be long enough to avoid fine sediment redeposition.
Following the recommendations of [
34,
37,
50], a range of potential discharges to be tested were determined empirically from flow statistics and calculation of at-a-station sediment transport thresholds (flow velocity comparisons with Hjulström diagram, [
51]). Hydraulic modelling was not used as there are too many uncertainties regarding sand transport in rivers with large boulders and steep slopes.
An adaptive approach [
7,
18] was, therefore, used to determine the most effective flow magnitude, with three different discharges being tested in 2016 (10, 15, and 20 m
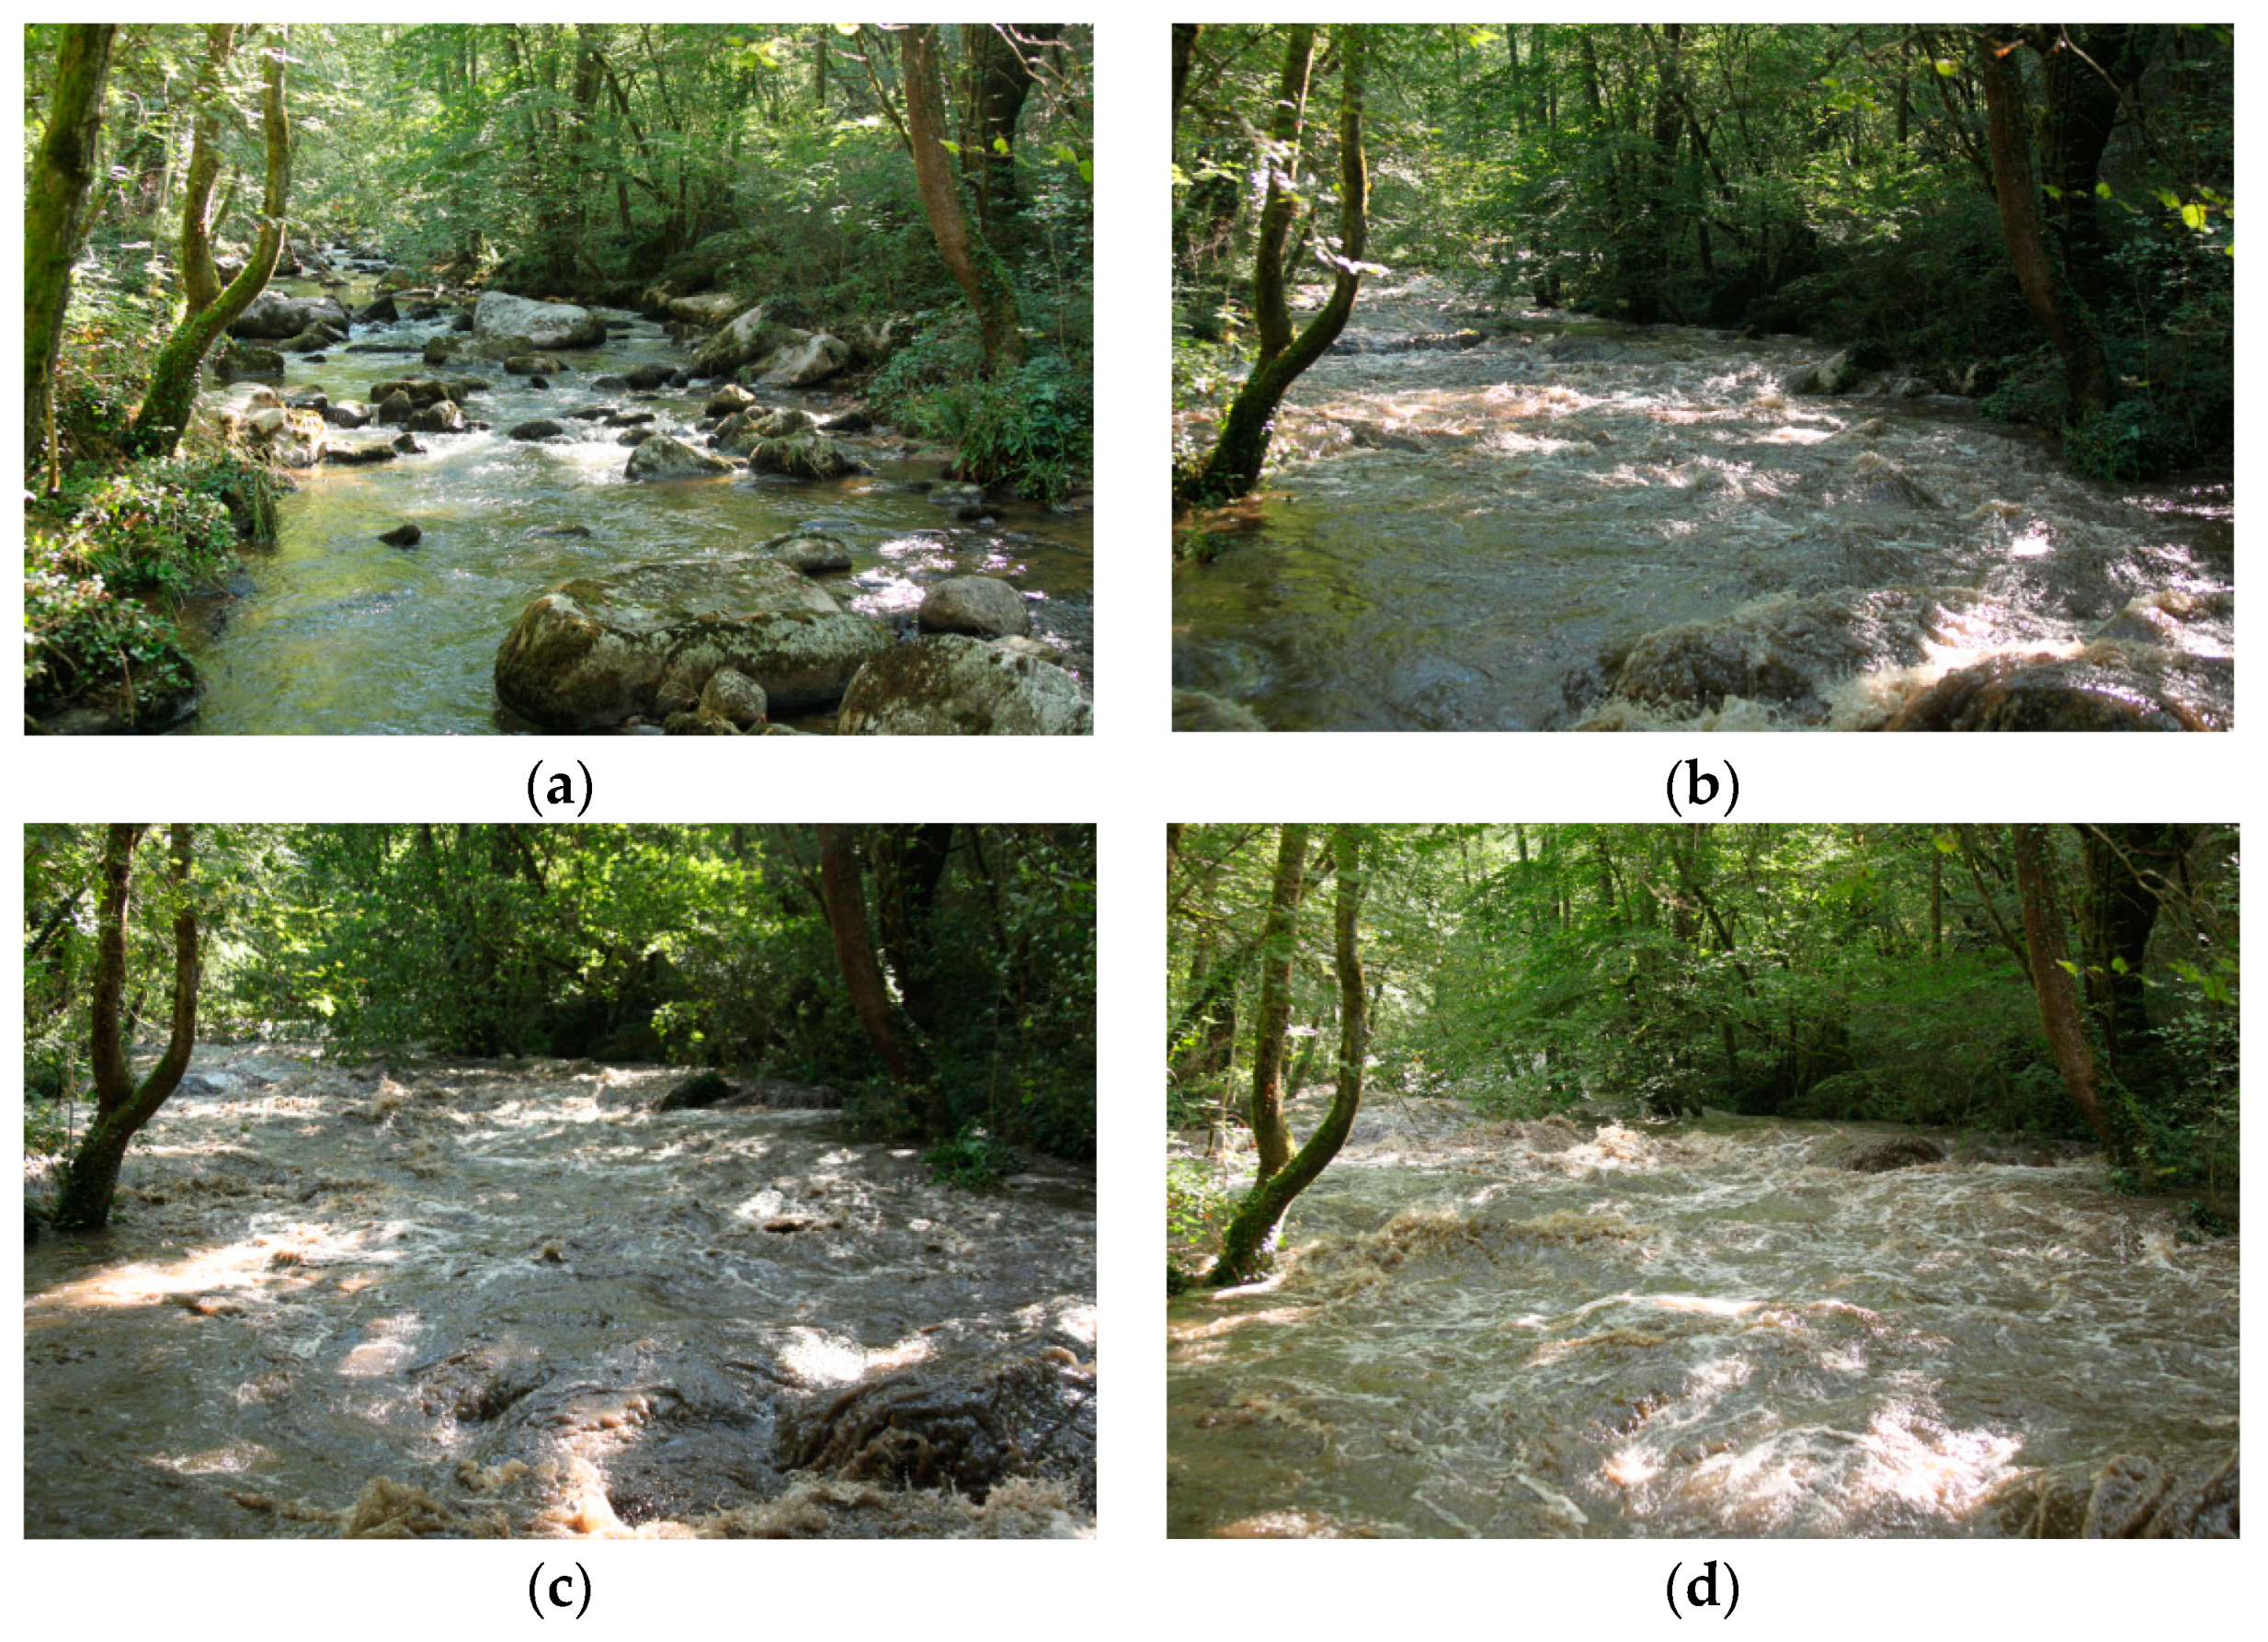
3/s) before implementing a more ambitious approach. The peak flow duration, between 4 and 5 h, was chosen based on our operational experience (transfer time observed when opening the bottom gate) (
Figure 3). A gradual increase in discharge, from minimum baseflow up to 10 m
3/s, was implemented to limit fish drift, followed by a one-hour stable flow at this discharge, which corresponds to the alert wave required for the safety of third parties. The hydraulic transit time for these releases was estimated at approximately 2 h 30 min. However, we chose to maintain the target discharges for, at least, 4 h to ensure that the operation was successful, to enable comparison between the releases, and to identify the impact of each release on the sand transport distance. The releases were generated by the bottom gate to retain a temperature similar to the minimum flow.
Following these initial experiments, a fourth flow release was carried out from 19 to 20 September 2017, with a maximum discharge of 15 m3/s. The ascending and descending phases of the hydrograph were managed in the same way as previous releases, but the duration at maximum discharge was extended to 34 h to test the effects of duration.
The releases were carried out on 6, 13, and 20 September 2016, to avoid conflicting with other uses or temporal constraints: (i) In the summer, the reservoir needs to be kept at a high level to satisfy tourism requirements, and safety risks are at their highest because of extensive fishing in the bypass reach; (ii) heavy rain is likely in autumn and could disrupt the experiment; (iii) salmonid spawning, incubation and growth phases take place from November to June. Various authors [
22,
40,
52,
53] have outlined the biological risks of this kind of operation on spawning, incubation or survival rate of juveniles.
3.2. Continuous Monitoring of the Experiment
Suspended sediment concentration (SSC) and water level were monitored at two stations. The first is located at the foot of the dam and the second is located 800 m upstream of the confluence with the Truyère River (Station 5 of the geomorphological monitoring). SSC was monitored at 30-s time steps using a GGUN FL30/Albillia turbidimeter (Albillia, Neuchâtel, Switzerland) and a Tetraedre TRMC 5 autonomous data logger (Tetraedre, Auvernier, Switzerland). Twenty-four water samples were collected at Stations 1 and 5 to correlate SSC and turbidity and then total suspended sediment load transported during each release (SSL) by flux calculation (TSS concentration from turbidity measurement × water discharge). Water levels were measured using a probe and recorded every minute. Flow measurements were taken at Station 5 to verify the flow released by the dam with an ADCP RiverPro Teledyne RDI (Teledyne Marine, Stowe Drive Poway, CA, USA).
3.3. Geomorphological Monitoring
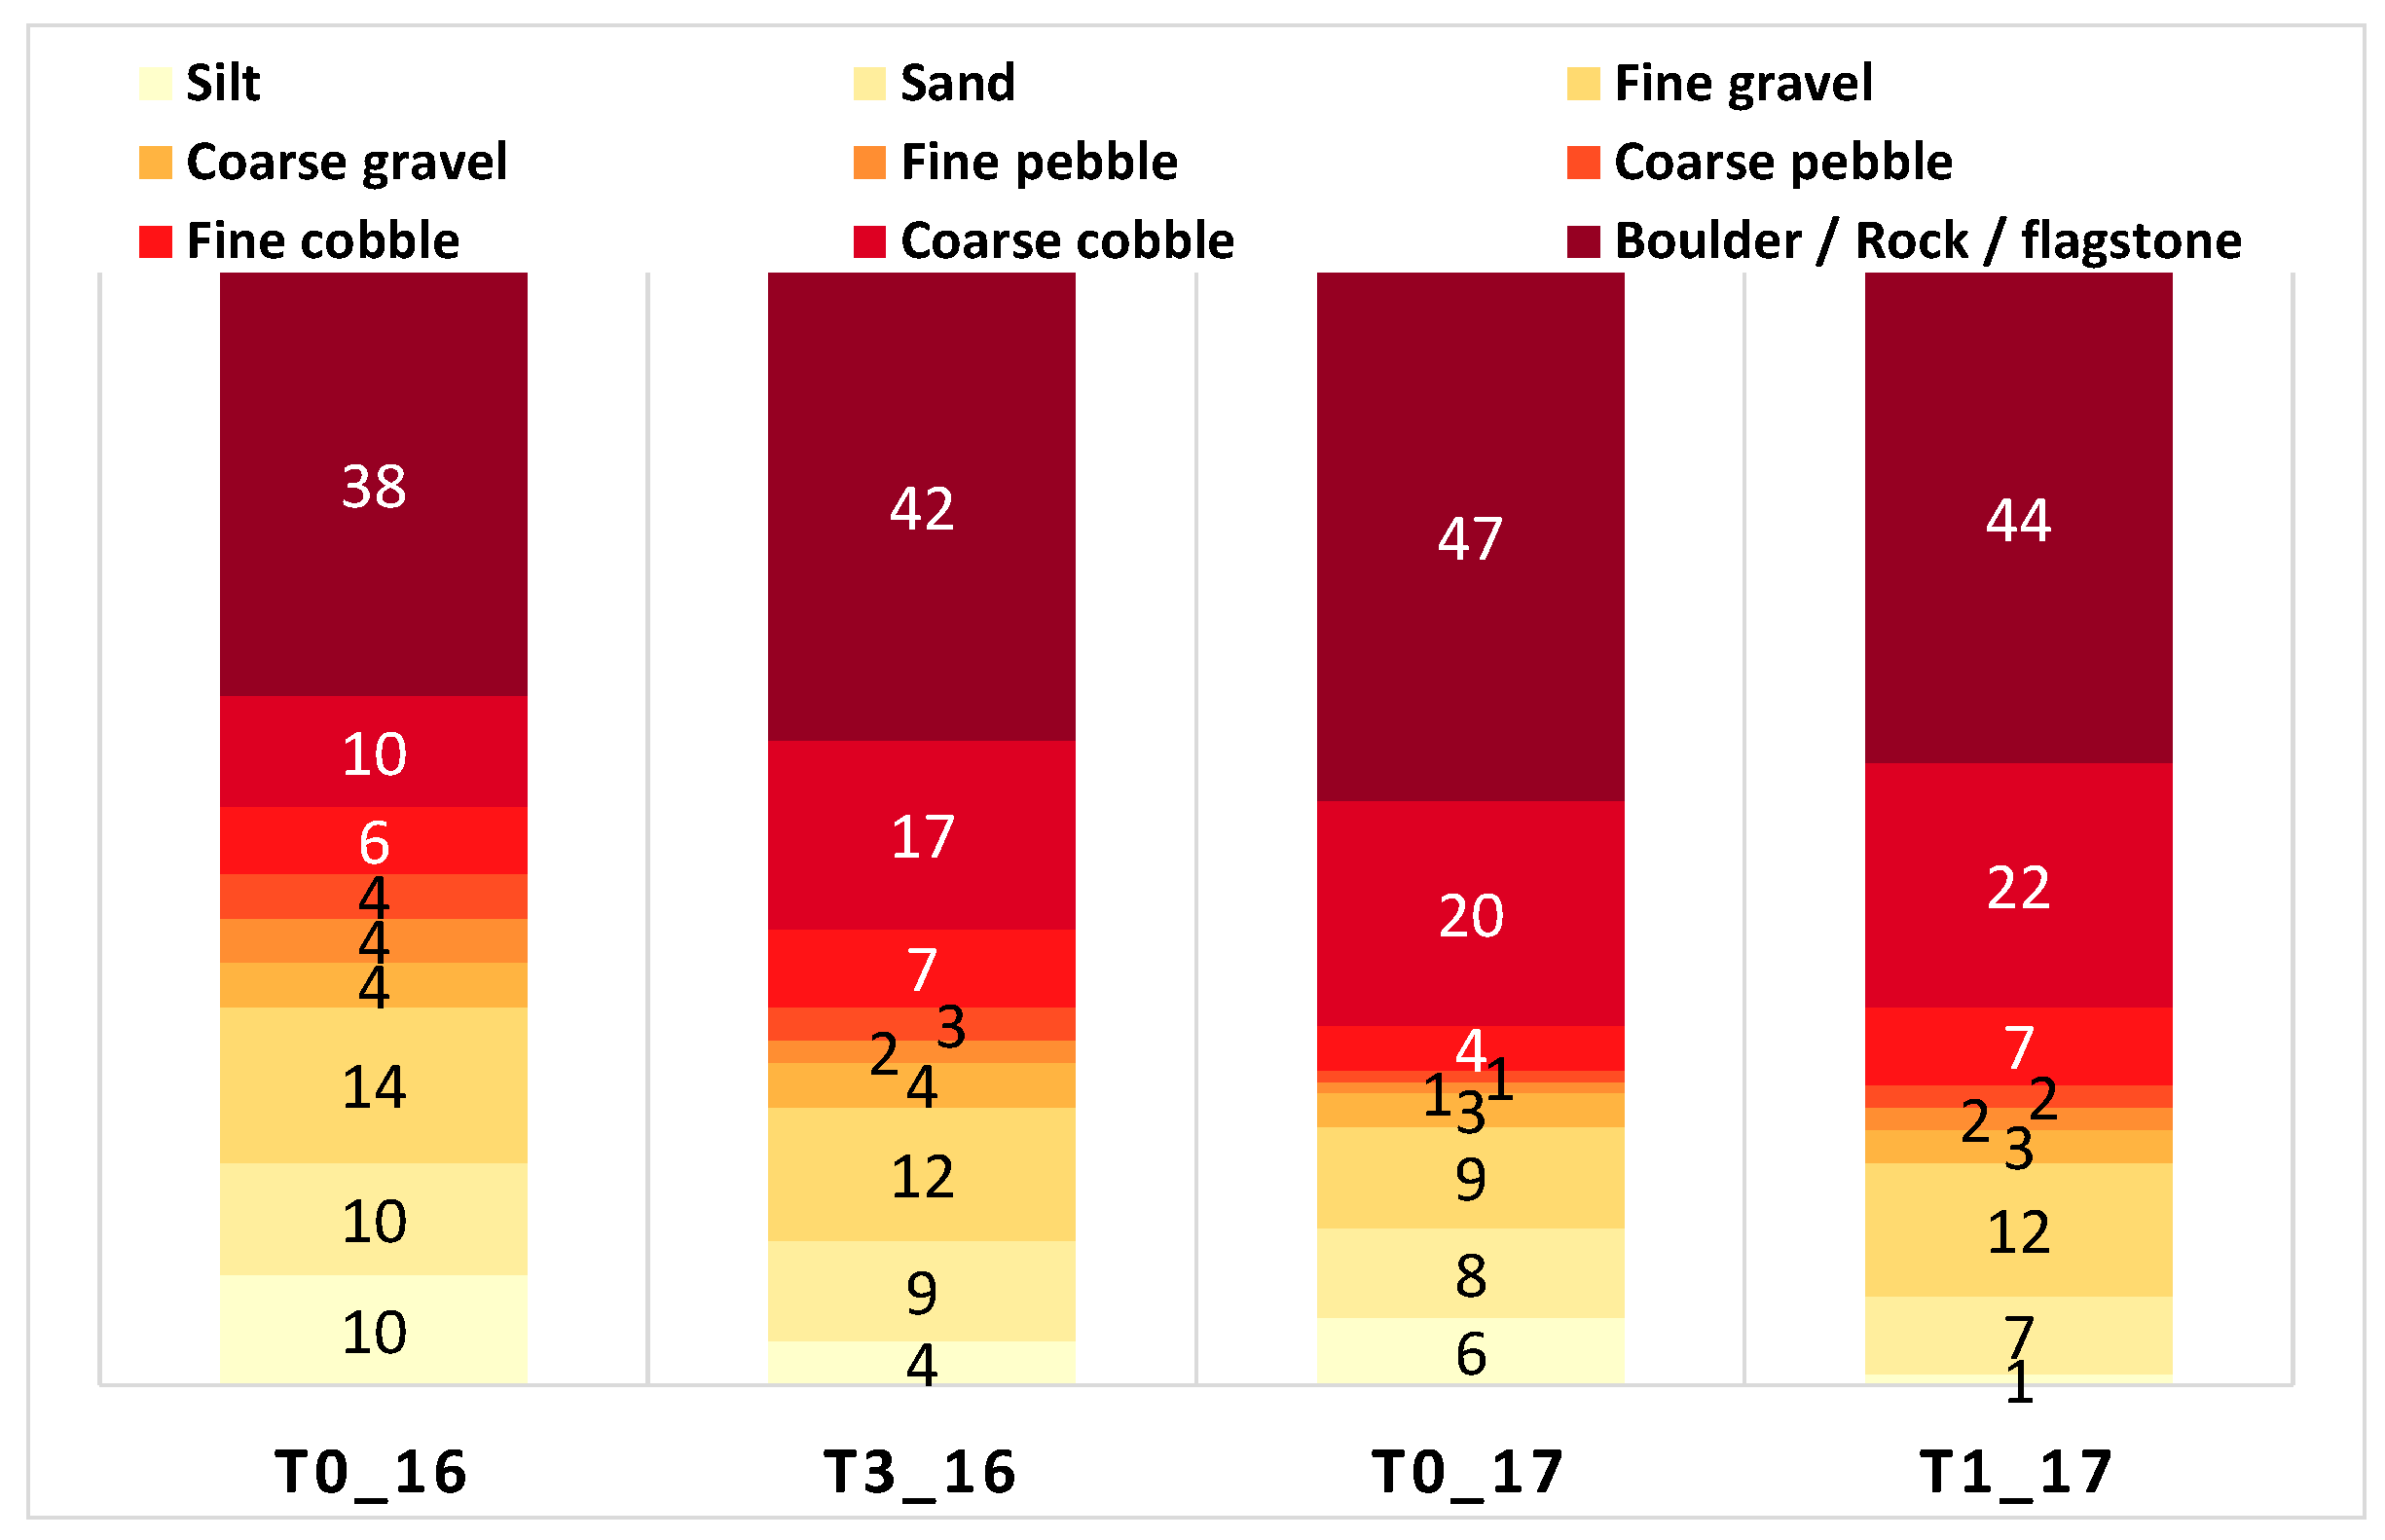
Geomorphological monitoring at reach scale, i.e., from the Maury dam to the confluence with the Truyère River, was based on 116 equidistant 100-m transects. Each transect is a cross-section within the wetted perimeter. Data collection was performed on these transects at 4 periods: (i) during the summer preceding all releases (T
0_16); (ii) in the autumn following the first three releases (T
3_16); (iii) one week before the fourth release (T
0_17); (iv) one week after the fourth release (T
1_17). Measurements of the following parameters were conducted every meter within each transect: water depth at the minimum flow, dominant sediment coverage within a 50 cm radius from the point of measurement using Wentworth’s particle size classification [
54], mesohabitats and thickness of fine sediments (silt, sand, and fine gravel).
Similar geomorphological monitoring was undertaken at 5 stations (250 m average length), corresponding to dominant sandy bed-surface sub-reaches, and located at increasing distance downstream of the dam: 950 m (S1), 1800 m (S2), 4200 m (S3), 5200 m (S4), and 10,400 m (S5). They generally had much greater sand patches than other sub-reaches because of a lower bed slope or tributary proximity, with the exception of Station 5, which was selected for its location (downstream of the bypassed reach) and easier access. Each station was described by approximately thirty transects, and the distance between two transects corresponded to its average active channel width. The parameters measured on each transect were the same as for the reach scale monitoring. In addition, cobble and pebble sediment patches were painted on the riverbed at each of the stations (from 2 to 8 patches depending on the campaign). This station scale monitoring was carried out only in 2016 to be able to assess the effect of each of the trial discharges (10, 15, and 20 m
3/s;
Table 1): before the first release (T
0_16), after the first release (T
1_16), after the second release (T
2_16), and after the third release (T
3_16).
Station 1 is immediately downstream of the upper tributary. This station was strategic as there was no sand supply during the releases upstream of this tributary: the upstream reach contained no sand, and the tributaries were at low flows.
To monitor sand transport distance, 400 kg of fluorescent tracers (with sorted sand, 2–4 mm diameter) were injected into the river bed (
Figure 4) before the releases at Stations 3 (3 trials in 2016 and the 2017 trial), 2 (2017 trial only), and 5 (2017 trial only). Different colored tracers were used for each release. After each release, bulk samples (17 to 31) of approximately 5 kg of sediments were collected in sandy areas downstream from the injection points, continuing downstream until the colored sand had disappeared from the samples. Discoloration was considered to be a negligible effect (colored tracers were found 2 years after injection). Tracer concentration of the samples was determined by image analysis (automatic counting of colored sand) to report their longitudinal dispersion and define the median distance of transport. This tracing technique is frequently used in coastal environments [
55,
56], but few studies have used it in rivers [
57,
58]. The total sand transport volume was evaluated by multiplying the active layer measured with scours chains [
59] on the riverbed at each of the stations with the median distance of transport: (width) × (scour depth) × (median distance).
5. Discussion and Recommendations
5.1. Design of the Flow Release and Impacts on SSC
The attenuation of peak depth magnitude sometimes observed in the flow diffusion downstream of dams [
33,
35] did not occur on the Selves at maximum flow, even during the short 2016 releases: The nominal flow rate was the same from the Maury dam to the output of the bypassed reach. However, attenuation of peak magnitude was observed for the lowest discharges, corresponding to the alert wave (for safety and fish protection). In the absence of flow measurements in the middle part of the bypassed reach, it is impossible to define where the energy loss occurred in 2016. Thanks to the installation of a water level monitoring station in 2017 at S2, it seems that this loss occurred between Stations 2 and 3. We attribute a large portion of this loss to the pronounced step-pool morphology of the bed channel between Stations 2 and 3 where the slope of the valley bottom is higher. Longitudinal variations in channel morphology must, therefore, be taken into account to ensure that the alert wave (for fish protection and safety) are effective along the entire reach.
SSC was closely monitored to meet regulatory requirements and to evaluate the success of the releases with respect to the export of fine sediments. The SSC peaks coincided with the flood waves and their peak values decreased for each successive release, despite their increasing intensity. Similar decreases in SSC have already been observed in other rivers following successive releases which have the same peak discharge value [
36,
62,
63].
The increase in volumes between the first and second releases can be attributed to higher specific stream powers and water levels: Besides the obvious influence of flow intensity on transport rate, the higher water level of the second release has remobilized more overbank fine materials. The lower SSL of the third release, despite an even greater discharge, shows that the environments were already well-leached after the second one. The example of the Selves in 2016 illustrates that the volume of fine sediment transported may increase if the flow discharge of a following release is higher than the first, even when it is undertaken relatively soon (i.e., 1 week) after the previous one. It is difficult to compare the 2017 release with the previous releases because it took place in a reach that was already well-declogged, demonstrating flow release success is highly contingent on initial conditions. However, the volume of sediment transported in 2017 shows that the environment tends to gradually reclog, requiring frequent flow releases. Thus, even if the SSC level achieved can be an indicator of release success in itself, the volumes transported should also be calculated in such cases to evaluate and compare the effects of successive releases.
The percentage of silt in the channel bed was reduced from 10% to 4% after the first release. This first result shows that regular flow releases of 10 m3/s during 5 h is efficient to entrain silt in the bypassed reach of the Selves River. This flow is approximately twice the pre-dam average annual flow. Tests could also be performed at slightly lower discharges to observe their efficacy.
5.2. Meso-Habitat Improvement
Unlike for silt, the four flow releases were not long enough to export all of the sand from the bypassed reach, however, they did result in a significant decrease in the amount of sand stored in the bed channel. This decrease can be explained by a partial export to the Truyère River and by sand accumulation along the river edges (
Figure 14), as also observed on the Colorado River [
31]. The latter phenomenon, which has also been documented for larger rivers [
23,
29,
32], ultimately results in improved channel mesohabitat conditions without requiring complete sand transport over the entire bypassed reach, which would require a much longer release. Lateral sand export allows for achieving habitat objectives while also minimizing gravel transport and economizing water volumes used during the releases. However, the lateral accumulation of sand could result in raising and progressively disconnects the adjacent floodplain.
The 10 m
3/s discharge is likely to promote sedimentation on reaches sensitive to sand aggradation. The critical shear stress is undoubtedly not reached for this discharge in such areas. The 15 m
3/s release seems the most effective as it generates a clear reduction in the percentage of silt and sand for all stations, with no exceptions, and without significant coarse sediment transport. The last 20 m
3/s release had contrasting effects on sand deposits at the station scale. As the discharge was theoretically more effective than for the second release, this observation is only due to the irregularity of inflowing sediments. Diverging results between stations have already been reported by other investigators during water releases, despite those stations having a similar gradient [
23]. This diverse behavior shows the importance of monitoring sediment transfer at the reach scale to learn from experiments and choosing the most effective discharge. In addition, the release resulted in greater mobility of coarse sediments. However, as there is no natural replacement of this sediment due to upstream trapping by the dam, mobilizing the coarse sediment could work contrary to the objectives, in that these sediments are one of the major components of desired fish habitat [
37,
39].
The average thickness of silt and sand was reduced by a factor of 1.8 in the bypassed reach channel after the four releases, which is largely due to the export of silt. The reduction in fine sediments below the dam had positive effects on substrates, and more generally on physical habitats, by increasing the water depth at low flow. This last effect, which is not obvious at the bypassed reach scale, is clearly positive for the monitoring stations most sensitive to fine sediment deposits. Other authors have previously reported an increase in water depth following water releases [
12], creating new habitats for fish, however, for the Selves River, this is a localized effect (only very clogged stations were affected) and does not apply to the whole reach.
5.3. Sand Export
The fluorescent tracing of sediment particles was motivated by the need to evaluate the release duration necessary to evacuate sand from the bypassed reach. According to the results from the 2016 experiment on a single station, the transport distance is linearly related to discharge magnitude with a proportionality ratio greater than one (see
Table 3). The 2017 experimental results from three stations demonstrate that transport distances differ strongly from one site to another, even when these sites did not initially appear to have substantial morphological differences. At Station 3, this result could be explained by heterogeneous hydraulic conditions within the reach, probably less favorable for transport in its downstream part. In the same way, the results obtained downstream from the two other stations are significantly different because of specific hydraulic conditions including bed slope, bankfull width, and hydraulic roughness. These results confirm the need to equip several sites because responses are site-specific [
18]. Three hypotheses explain these differences among sites. The first hypothesis is that there is an attenuation of the peak depth magnitude further downstream [
33,
35]. However, this hypothesis is highly unlikely since the range of water depths at the most downstream station were the same as those further upstream. The second hypothesis is related to site-specific morphological and hydraulic conditions. Previous investigators have shown that the results obtained from water releases cannot necessarily be applied from one site to another [
18]. Local flow conditions are likely to be key in determining morphodynamic responses [
64], which create different responses for each site. The main difference between the sites is that downstream of Station 1, the released water is already completely saturated with sand, thereby reducing its capacity for erosion. Finally, the last hypothesis corresponds to a measurement bias with the fluorescent tracers. For example, at Station 2, some of the tracer material settled on the river banks and was not taken into account in the analyses, which leads to overestimation of the distances travelled. Given all of these uncertainties, for a 15 m
3/s release, we adopted a median transport velocity of around 15 m/hour in areas conducive to sand transport and slightly less in more lentic reaches. Based on these assumptions, it would take at least 30 days and up to 45 days to fully export sand from the entire bypassed reach at a constant discharge of 15 m
3/s.
For all of the 2016 water releases, which are quite similar in terms of duration, the transported volume increased with increasing discharge. An increase in discharge from 10 to 15 m
3/s resulted in a transported volume around 2.8 times higher. Likewise, an increase in discharge from 15 to 20 m
3/s transported a volume around 3.9 times greater. These results are similar to those made by Collier et al. [
22], where the volumes of sand transported also increased significantly with discharge. However, the rate of increase given by Collier et al. [
22] specifically an 8-fold increase in transported volume when discharge was doubled, was not observed in our case. This difference can be attributed to the difference in size and morphology of the rivers studied.
Finally, these results show that even relatively low peak discharges can influence the physical habitat of the flow channel in rivers with a high sand load [
23]. In our case, a flow equal to three times the pre-dam mean annual flow is effective.
5.4. Perspectives
Our study demonstrates that it is possible to successfully undertake water releases in small rivers with an adaptive management approach. Specifically, we have shown that hydraulic modelling is not always necessary for this type of operation and that simple geomorphological monitoring is able to provide the necessary information to evaluate the effectiveness.
Although the movement of materials larger than those targeted is inevitable, it should be limited as far as possible in the absence of coarse sediment supply downstream from the dam. It is, therefore, strongly recommended to continue to use an iterative approach to determine this critical discharge in terms of magnitude, duration, and frequency, starting with low discharges for a short duration.
For the Selves River, two discharge levels are now recommended: 10 m3/s for silts and 15 m3/s for sands. To export most silt out of the bypassed reach, the release time required is only 5 h. For sands, the duration is not yet defined because it should be adapted to the quantity of tributary inputs. These contributions are not yet known but could be quantified at stations to be established immediately downstream of the tributaries, using the same measurement protocol presented in this study.
Initial results show that silt aggradation can be observed between two releases one year apart. This annual silt deposit is not necessarily problematic for the environment, but a target threshold should be defined beyond which a water release should be carried out. We suggest continuing the full geomorphological monitoring of the reach and to carry out new water releases when the silts reach more than 7% of the overall grain size distribution corresponding to a “good” situation for the stakeholder and also equivalent to conditions observed at T0_2017. This value should be reassessed with the forthcoming biological monitoring results. For sand, monitoring events (storms) likely to transfer sediments into the Selves River from tributaries would provide useful information to quantify the effects of major storms on the volume of sediment stored into the Selves. It would then be possible to conduct a release to ensure a well-balanced sediment budget.
To evaluate the biological effects of these releases (and ultimately their ecological efficacy), biological monitoring (fish, spawning areas, macroinvertebrates) should be continued for at least five more years to ensure that the conditions defined by these thresholds are adequate. There is also a need to compare monitoring results (both sediment and biological responses) with reference conditions on a nearby river to objectively evaluate release success.
It is difficult to use data from other publications without at least some basic information and meta-analysis of such experiments are needed to improve release design and determine a priori potential channel responses. Therefore, to make these types of studies comparable, we strongly recommend that experimenters systematically state at least the following information in their publications: catchment area, historical data on flood and average discharges, average bed slope and particle size distribution of the channel and of the sediment load.
6. Conclusions
Conducting iterative water releases on the Selves River paid off with a reduction of surficial clogging, effective sand export, and water depth increases while avoiding mobility of coarser sediments, all while requiring only limited human and financial resources. Although the discharges were chosen empirically, they ultimately were in the necessary range for the management objectives and allowed us to identify the optimum discharge for future operations. We now know that a discharge slightly below or equal to 10 m3/s enables significant transport of SSCs but not of the sand, whereas a discharge of 15 m3/s provides much greater movement of sand sediments. Higher discharges are not cost-effective because of the risk of entrainment of coarse particles and because the gain in distance traveled relative to the increased discharge is smaller.
The measurements performed at station scale and at the overall bypassed reach scale provided complementary information. For example, we saw that water levels increased significantly in clogged areas but did not vary at the reach scale. The station-scale monitoring allowed us to precisely describe the effects of each release and, thus, to validate each step according to an adaptive management process.
The status of the watercourse and the state of its streambed sediment has been improved by transporting silt and sand out of the bypassed reach, through over bank deposition, and by increasing the water depth in sandy sectors, thereby meeting stakeholder expectations. Managers and users are now convinced of the value of this kind of operation because of visual habitat improvement with no evidence of potential ecological damage during the experiment. Water releases are, therefore, a management option that is now locally accepted.


