Each sector will be analysed according to the GIS integration of the spatial data collected from old maps and modern aerial images, followed by the analysis of the archaeological sites patterns and dynamics along the Volga River; then, the changes of Volga River will be analysed in the context of how many cultural heritage sites are directly affected by the reservoir construction. The four working scenarios will be analysed in order to evaluate the endangered sites towards increasing/decreasing water level of the reservoir. Finally, the monitoring results of the only left Palaeolithic site—Beganchik will be presented; this site has been specifically chosen because of its high erosion rates and being the only remaining Palaeolithic site around Kuibyshev reservoir.
5.1. Volga River Dynamics
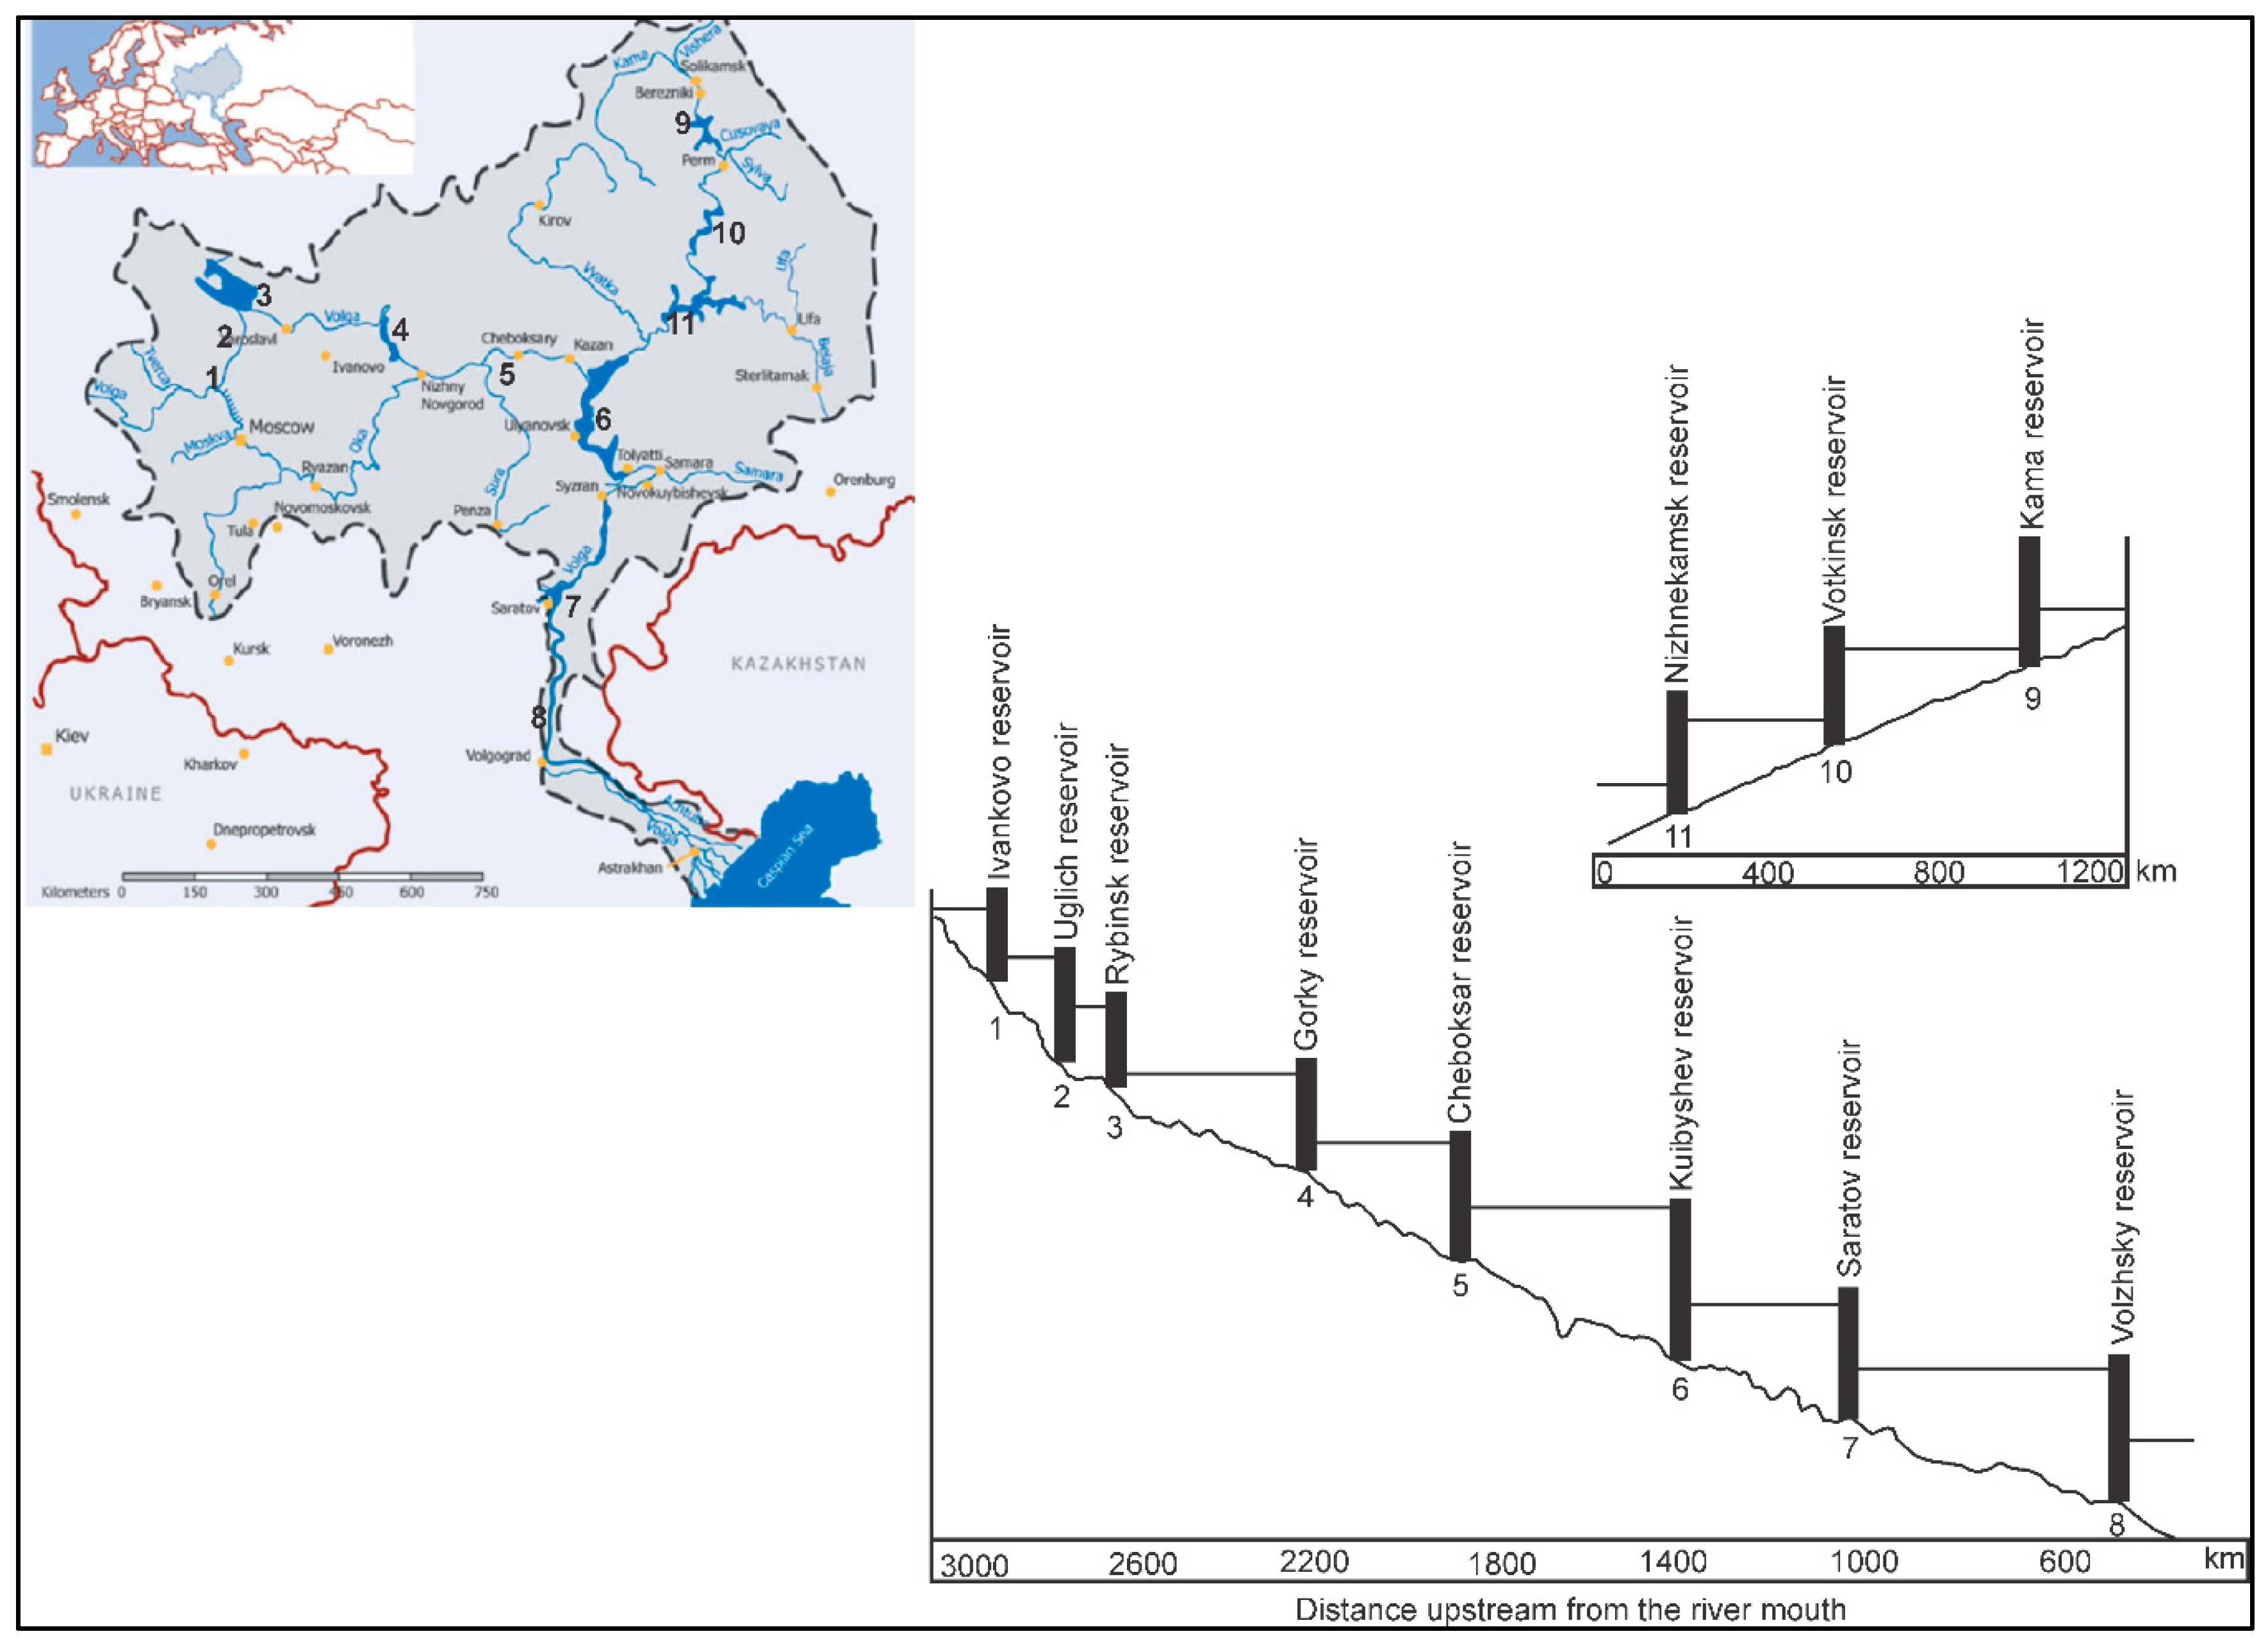
From the town of Tver to Volgograd, Volga River flow velocity is affected by the 8 reservoirs. The reservoirs were built to control seasonal changes in flow; however, there are no significant changes when it comes to river discharge and the total annual discharge. In the middle Volga, the mean annual flow from 1876 to 1940 was 2876 m
3/s; after the construction of reservoirs, from 1942–1955, the mean annual flow was 2780 m
3/s [
51].
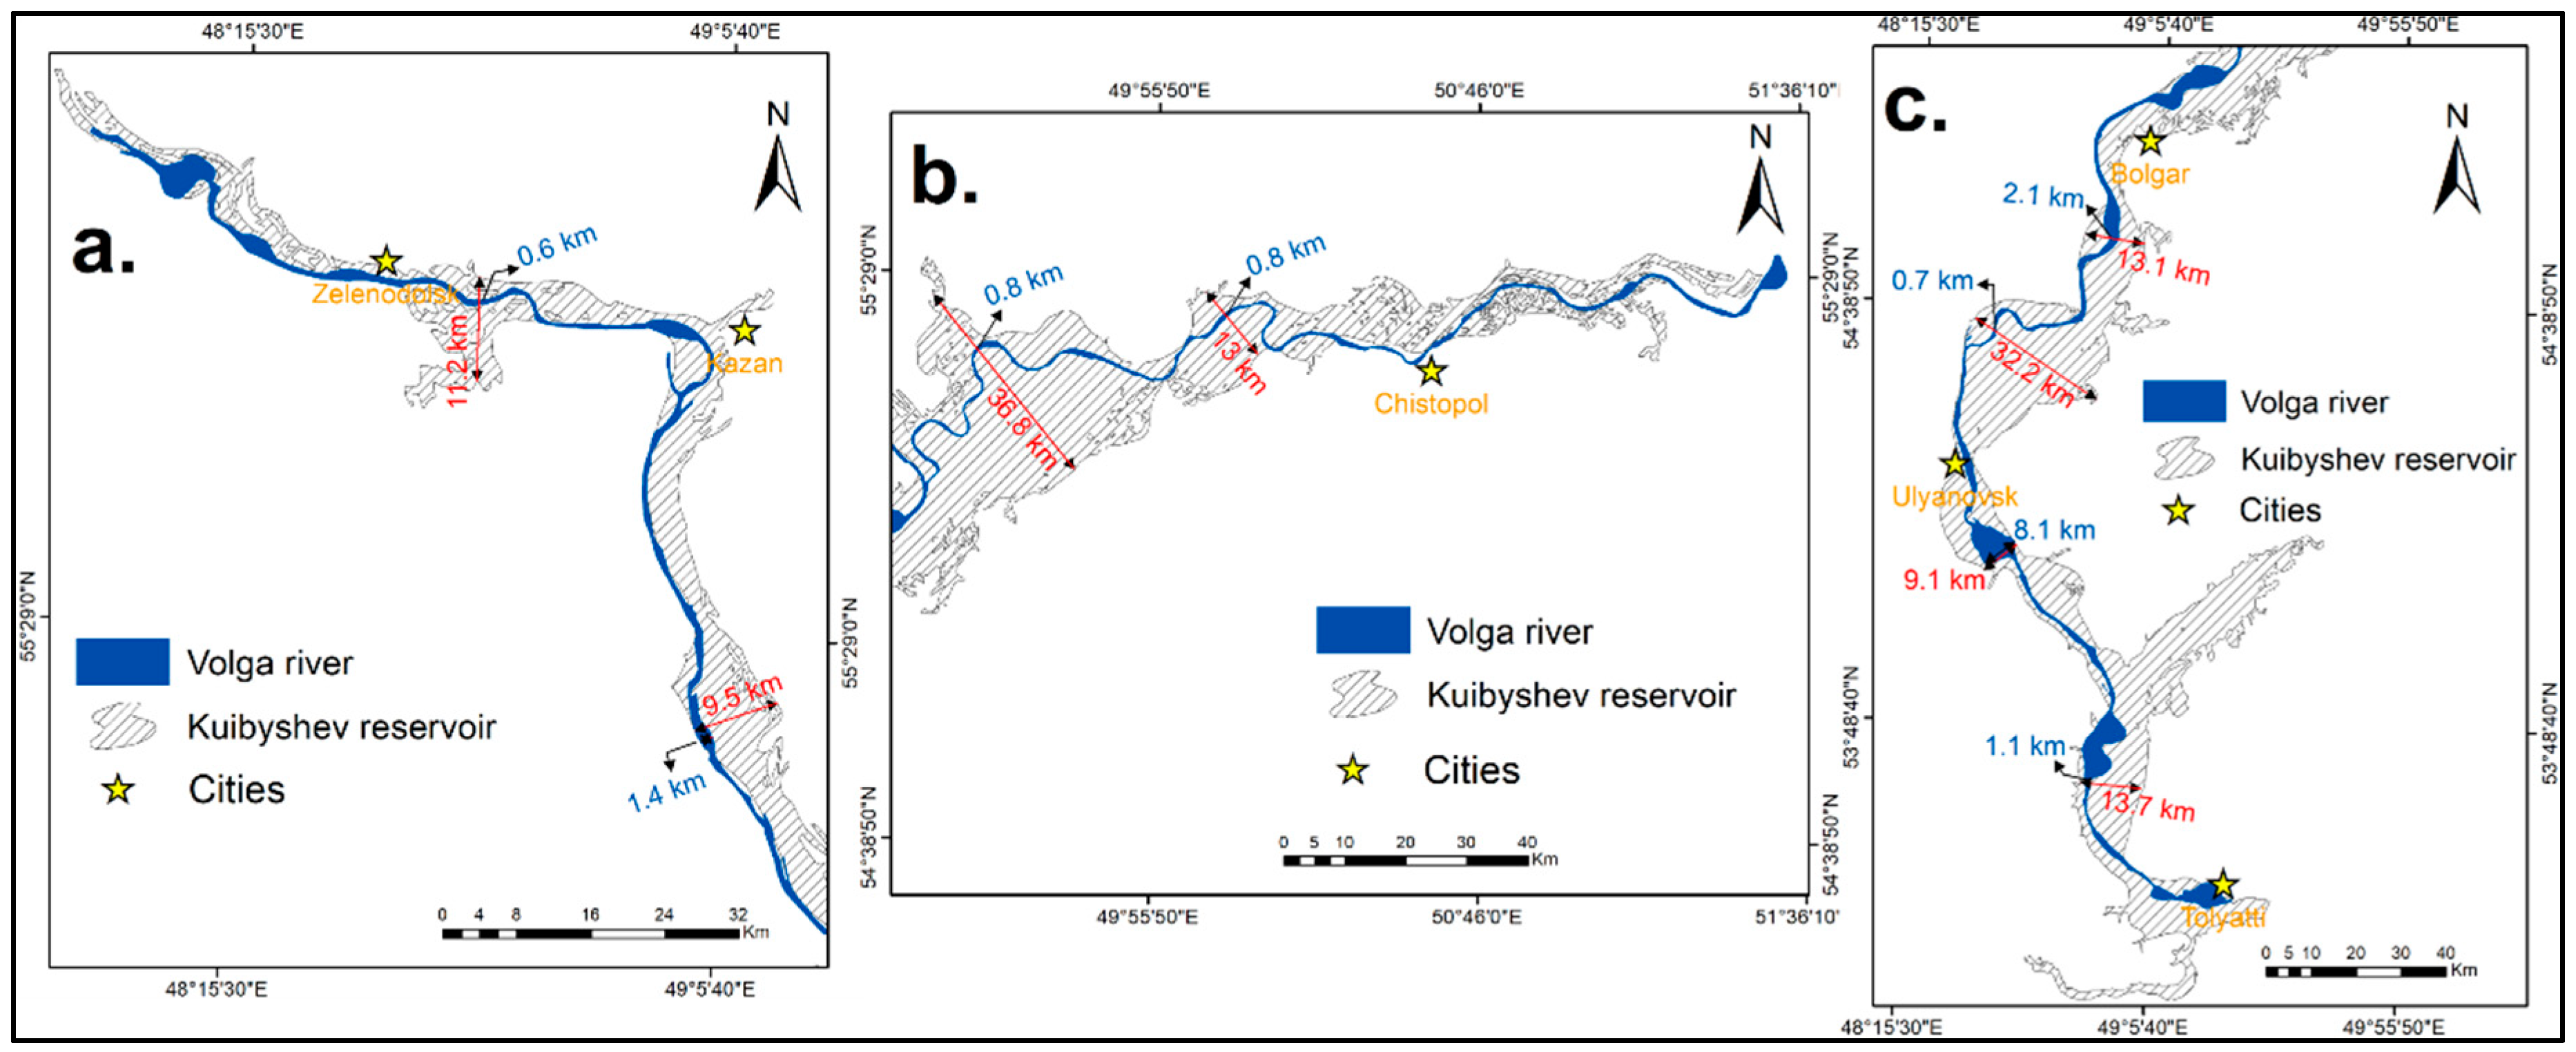
Sector 1 (
Figure 5a) stretches approximately in the north-western part, next to the Zvenigovo city till south-east, at the junction between Volga and Kama rivers; it has a length of approximately 145 km. The most important cities within Sector 1 are Kazan (with a population of about 1,2 mil. people) and Zelenodolsk (with a population of about 98,000 people). Out of the three sectors, Sector 1 has the fewest changes, compared with the others; the most significant changes are located about 43 km downstream from Kazan city. Initially, Volga had a width of 1.4 km, while after the building of the Kuibyshev reservoir the width of Volga reached 9.5 km. Another significant change is located between Zelenodolsk and Kazan, at the junction of Sviyaga River in the Volga; from a width of 0.6 km, Volga reached a width of 11.2 km; except this, the reservoir water has mainly covered the left side of the river. This is due to the geomorphological characteristics of the area; the right side represents the Volga uplands, while on the left side are the terraced plains of the lowland Volga River region [
52].
Sector 2 (
Figure 5b) stretches from east to west on a distance of approximately 150 km and represents the lower Kama River junction to Volga River; before the Kuibyshev reservoir, the area located around the junction had a significant number of villages (which were completely destroyed). Moreover, important landscape changes occurred, along with an acceleration of coastal erosion with a direct effect on cultural heritage [
25]. The most important city in this sector is Chistopol (with a population of approximately 60,000 people). Along its approximately 150 km length, after the building of Kuibyshev reservoir, Sector 2 had more or less a balanced development of the right and left bank; this is because both of the sides are located within the terraced plains of the lowland Volga River region. From an average width of 0.8–1 km, the Kama River reached widths of 13–36.8 km. From these numbers, we can realise the real proportions of the consequences of the Kuibyshev reservoir being built.
Sector 3 (
Figure 5c), with a length of approximately 263 km, stretches from Kama and Volga junction until the dam of the Zhiguli Hydroelectric Station, located between the cities of Zhigulyovsk and Tolyatti. The most important cities in this sector are Tolyatti (with a population of approximately 720,000 people), Ulyanovsk (with a population of approximately 614,000 people) and Bolgar (with a population of approximately 9000 people). Bolgar is well known for the Bolgar Historical and Archaeological Complex World Heritage site. Similar in development with Sector 1, the left side of the river being more developed than the right one; again, this is to the lower altitudes of the terraced plains of the lowland Volga River region [
52]. Within this sector, the width of the Volga River before Kuibyshev reservoir was ranging from 0.7–2.1 km, and from 9.1–32.2 km after the building of Kuibyshev reservoir. Having this enormous width, it is sometimes called the Kuibyshev Sea.
5.2. Archaeological Site Analysis
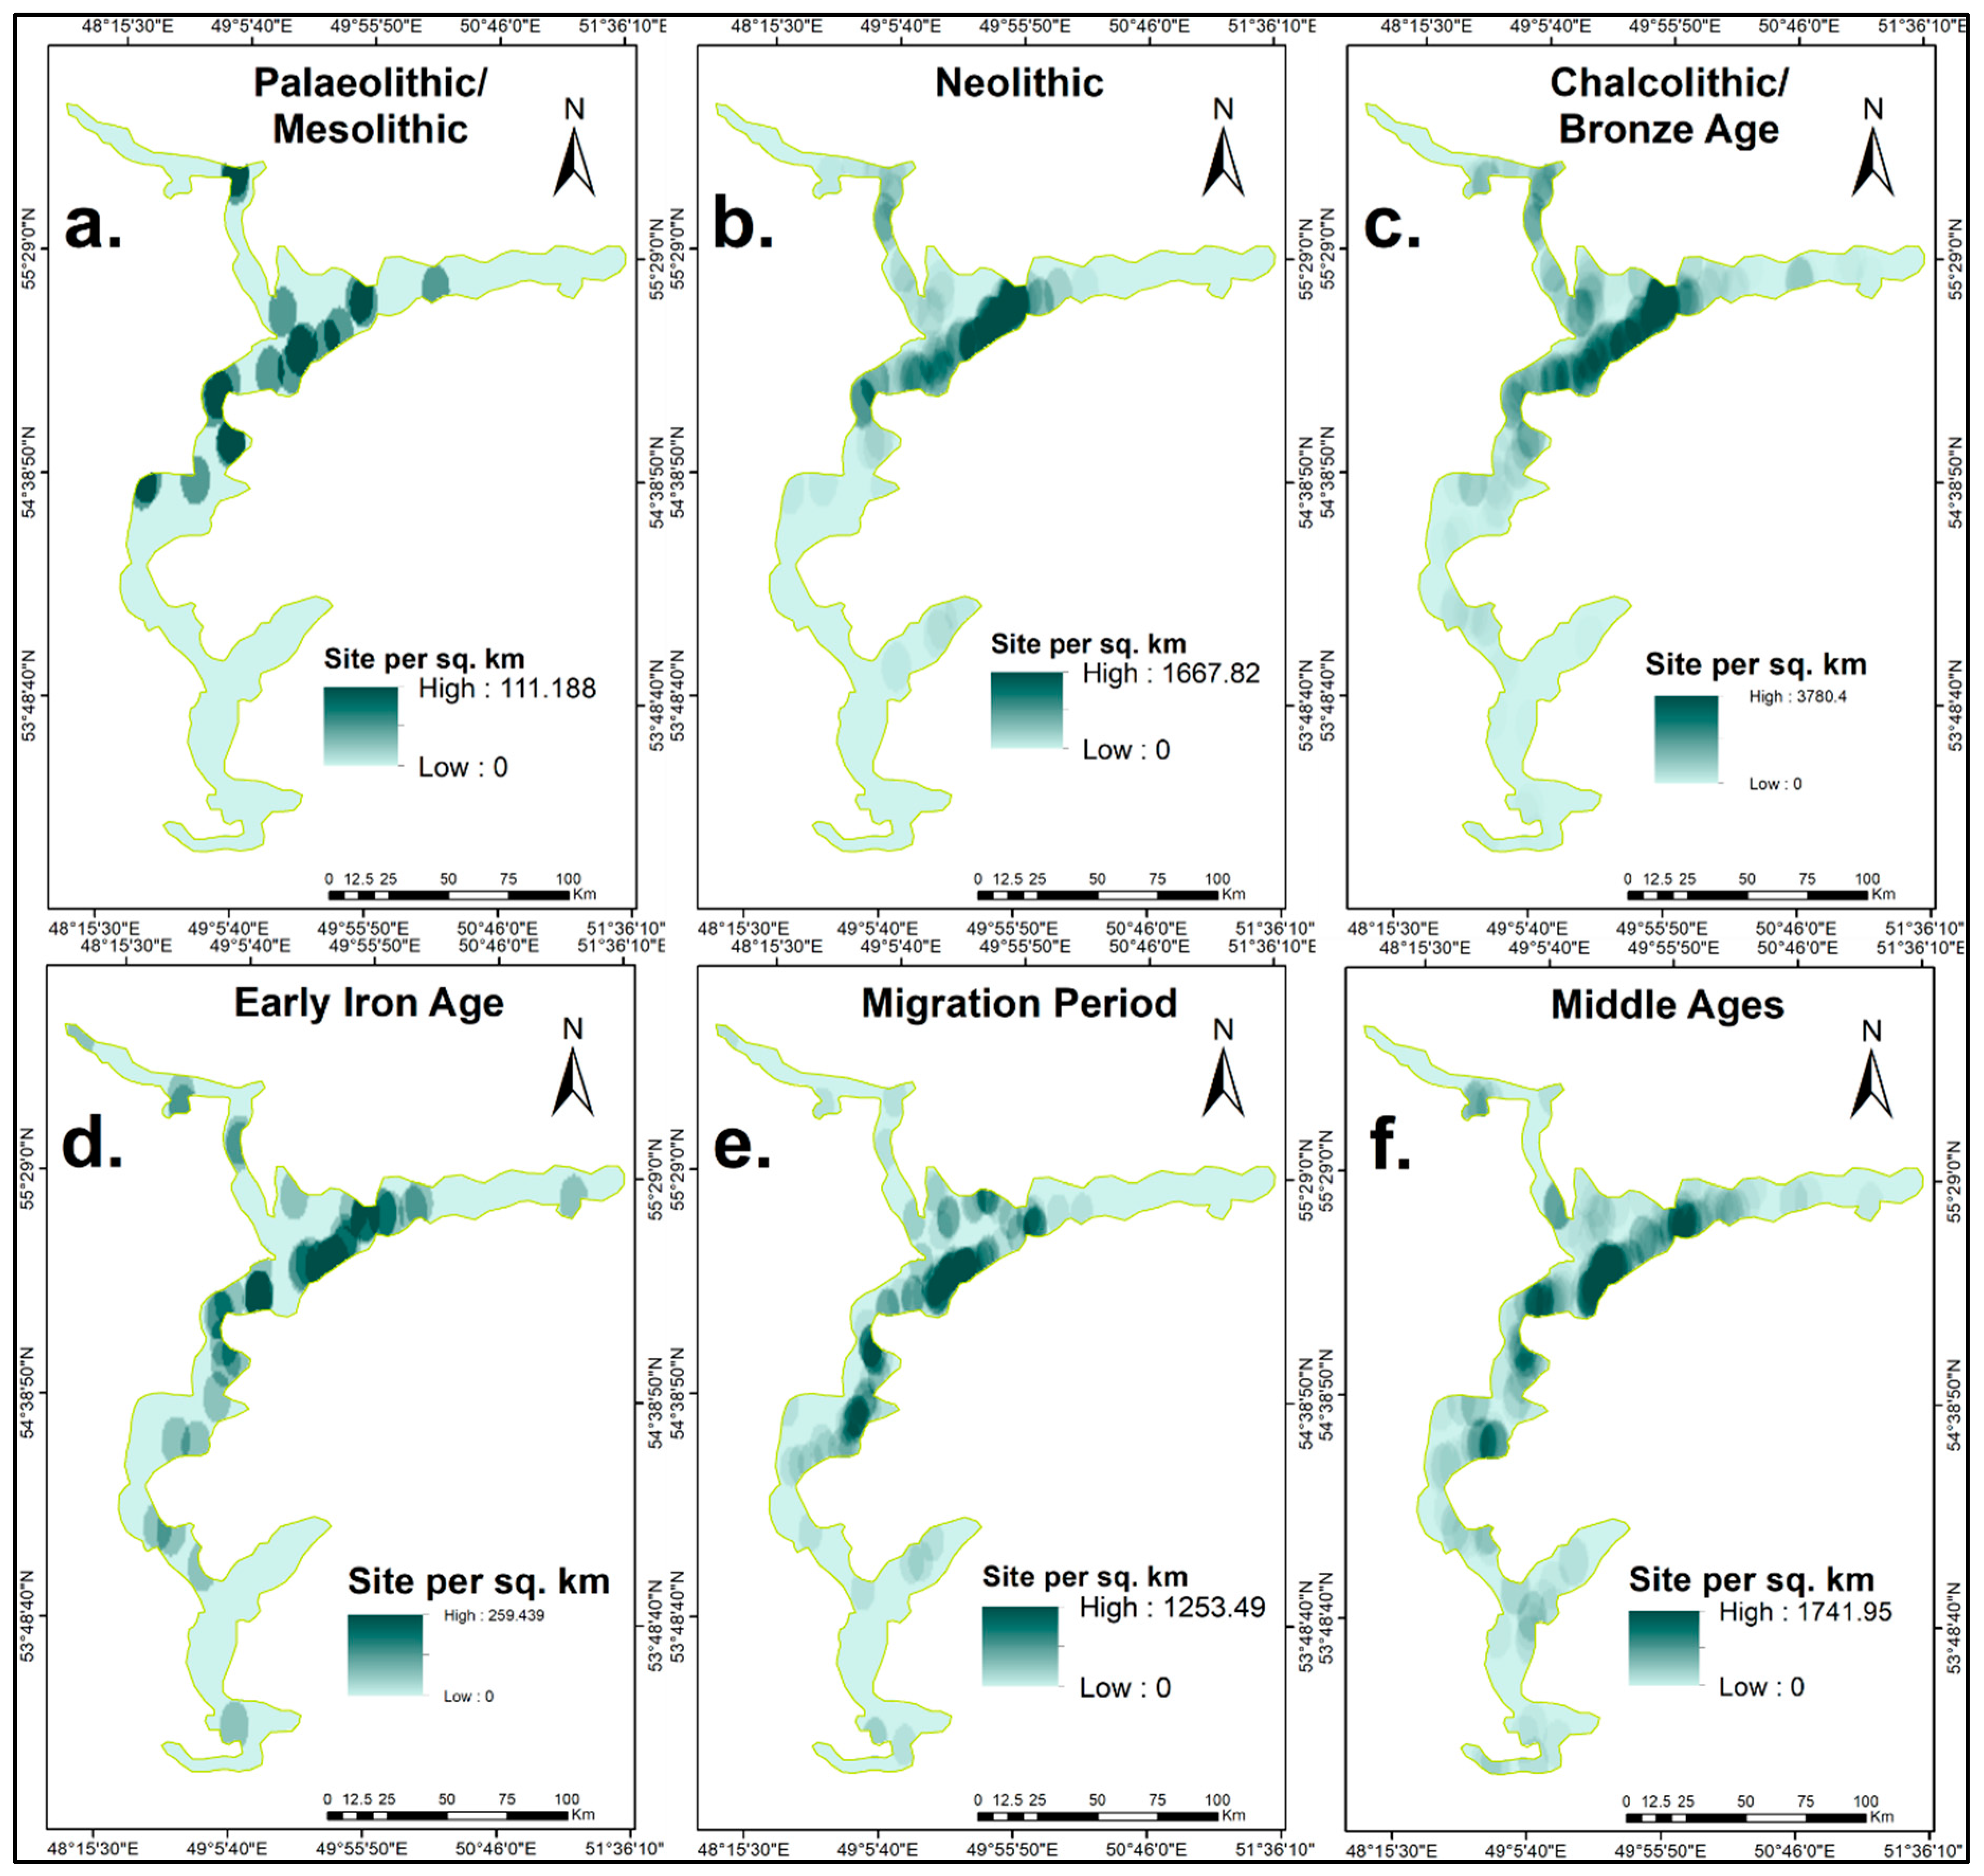
Following the analysis of the archaeological database provided by the Institute of Archaeology of Tatarstan Academy of Sciences, the following periods were identified: Palaeolithic/Mesolithic, Neolithic, Chalcolithic/Bronze Age, Early Iron Age, Migration Period, and Middle Ages. Large river systems, e.g., the Volga, act as a magnet when it comes to taking a decision to place a prehistoric settlement. That is why, in the close proximity of the Volga River and its tributaries, there is a high density of archaeological sites. Water represents the main resource in establishing the placement of a settlement; this is documented and well-known across the archaeologists and geo-archaeologists [
53].
On the basis of the existing database, the areas with the highest concentration of archaeological settlements attributed to a certain period will be identified and highlighted accordingly. Usually, the dynamics of the settlements are influenced by different factors, like climate change [
54], natural hazards [
55] and threats from other populations. Having knowledge of the spatiotemporal distribution patterns of archaeological sites is a powerful tool to understand past human-environment interactions and to evaluate landscape vulnerability to natural [
56] and anthropogenic changes [
49].
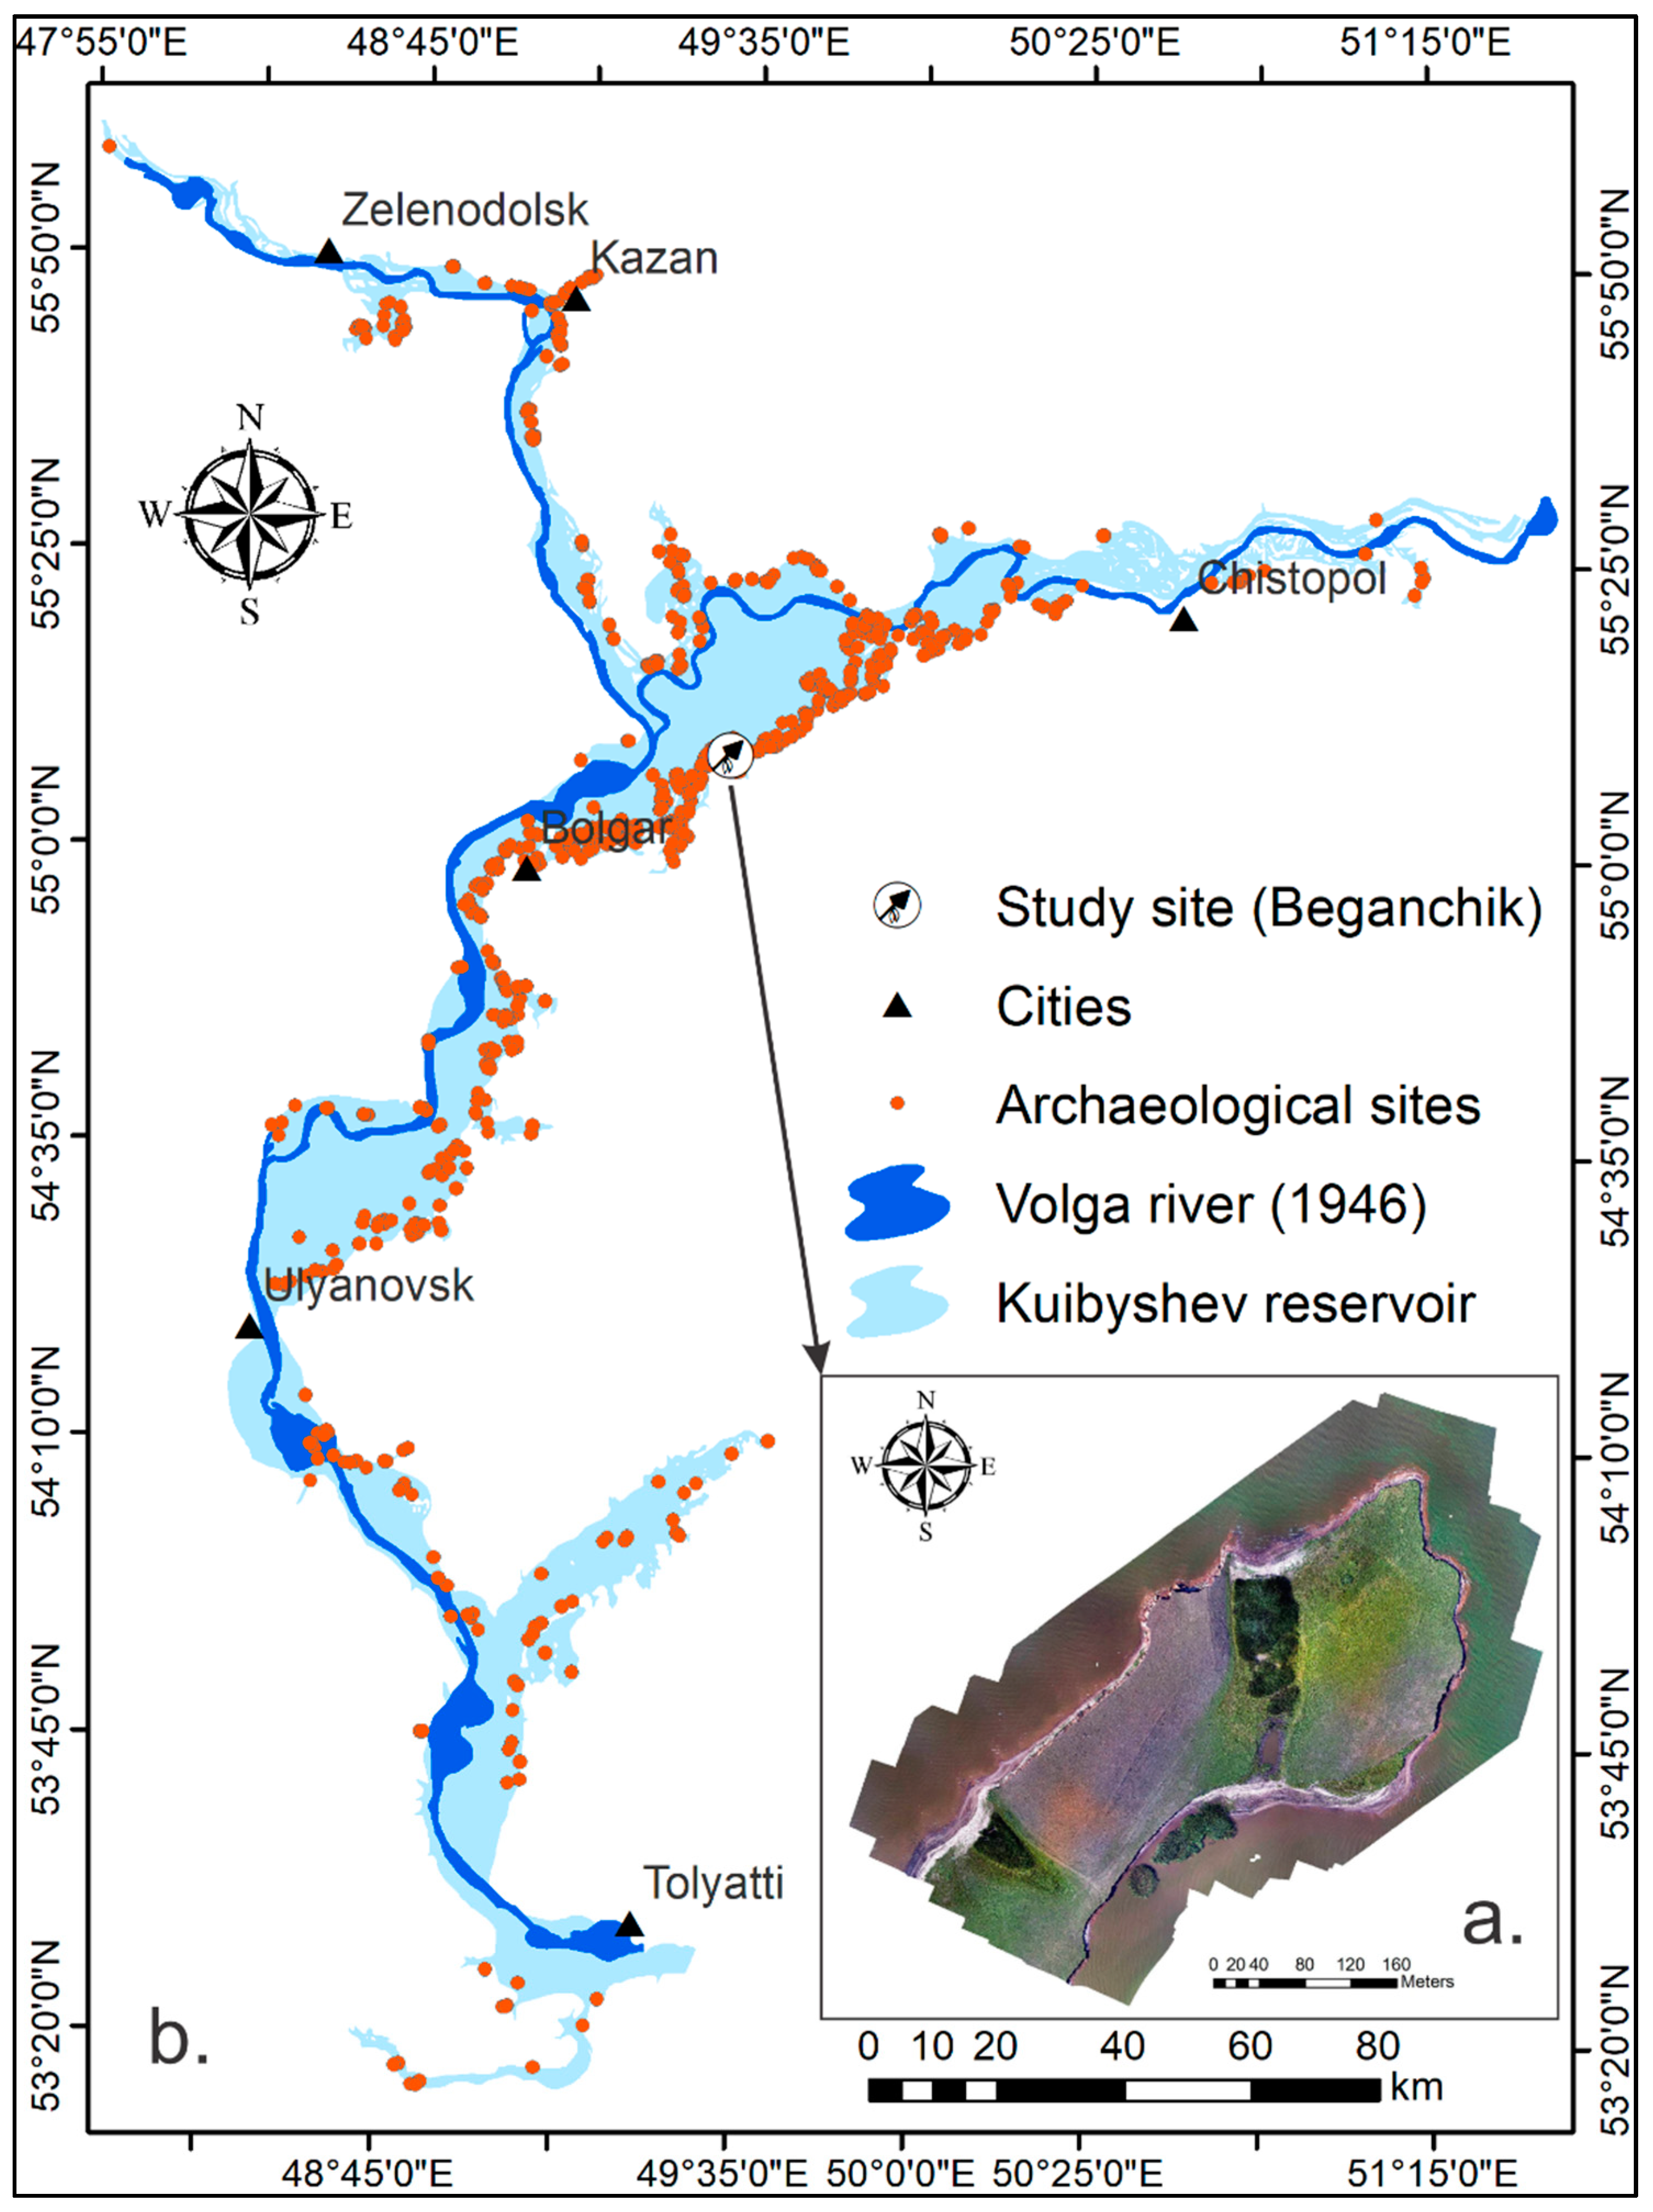
As can be seen in
Figure 6, the highest concentration of settlements for all the periods is located at the junction of the Kama and Volga Rivers, this is representing an important communication route. During the Palaeolithic/Mesolithic period (
Figure 6a), the hunters-fishers-gatherers population was well adapted to the living around water bodies and forests; the highest concentration was at the junction of Kama and Volga rivers, followed by the adjacent areas of upstream and downstream of the junction. A good concentration can be observed on the Volga River, around the area where presently the city of Kazan is located; the thrive of settlements was due to the optimum climatic conditions for the Preboreal period [
37,
39], along with the highest levels of rivers and lakes, which was typical for the Mesolithic epoch [
57]. The settlements were not very homogenous during this period. However, this can be observed during the Neolithic period (
Figure 6b), when more settlements appear in the area between the today Kazan city and Kama-Volga junction. The Neolithic period is characterised by the emergence of pottery, new types of stone tools and the transition to sedentism with the help of active fishing and hunting. The majority of Neolithic sites are located on the remnants of the floodplain of the small rivers of the Kama River tributaries or on the first terrace of the Kama River [
40].
Following Chalcolithic/Bronze Age period (
Figure 6c), it can be observed even a higher degree of homogeneity among the settlements; this is due to the fact that the lowest levels of water were recorded in the Bronze Age. As a consequence of this, even the lowest altitudes were chosen to place the settlements, which is why the analysis shows a larger continuous surface
Figure 6d illustrates the density of the Early Iron Age settlements, which started to be more fragmented. The highest concentration is at the confluence of Kama-Volga Rivers and on the territory of today Bolgar, followed by scattered low-density areas the upstream Volga, at the mouth of Sviyaga River, and the downstream Volga. The settlements appear scattered because of their higher altitudinal position (higher position throughout the Holocene), due to the associated high flood levels [
57]. As can be seen in
Figure 6e, the Migration period is characterised by spreading of population downstream Volga River, until today Ulyanovsk city. However, the highest concentration is still located at the Kama-Volga junction; the fact that during this period the area is very poorly populated is also indicated by [
58]. Finally, the Middle Ages (
Figure 6f) show the highest fragmentation of the settlements. The highest concentration remains the same (Kama-Volga junction), while the settlements are scattered downstream and the upstream Volga until today Tolyatti and Zelenodolsk, respectively. During this period, the settlements are so scattered, due to the fact that the climatic conditions were suitable for the long-term occupation of river and lake floodplains. This is the turning point when people start to settle and make semi-permanent settlements and start off using the floodplain in order to practice agriculture on a higher level [
57,
59].
5.3. Cultural Heritage under Erosion Threat
Since the formation of the reservoir in the middle of the 1950s, the confluence of the Kama and Volga Rivers and the left bank tributaries was flooded. As a result, many lower terraces, that were hosting archaeological sites of different periods [
60], were completely flooded. The main typology of the sites is presented in
Table 2; therefore, out of the total of 1289 sites, 1091 are underwater or totally impacted following the building of the Kuibyshev reservoir. According to their chronology, shown in
Table 3, the only Palaeolithic/Mesolithic site that still exists, but is under high threat from coastal erosion, will be further analysed, based on the old Soviet Maps and modern surveys.
Based on the working scenarios regarding the water level increasing and decreasing to 0.5 m and 1 m, respectively it has been observed that increasing the water level, whether, with 0.5 or 1 m, a number of two extra sites will be affected (out of 1091 already underwater or impacted). If we decrease the water level by 0.5 m or 1 m respectively, the same number of sites will remain affected—1091. Having such a large surface, water level oscillations do not affect the cultural heritage sites, unless there are variations greater than ±1 m.
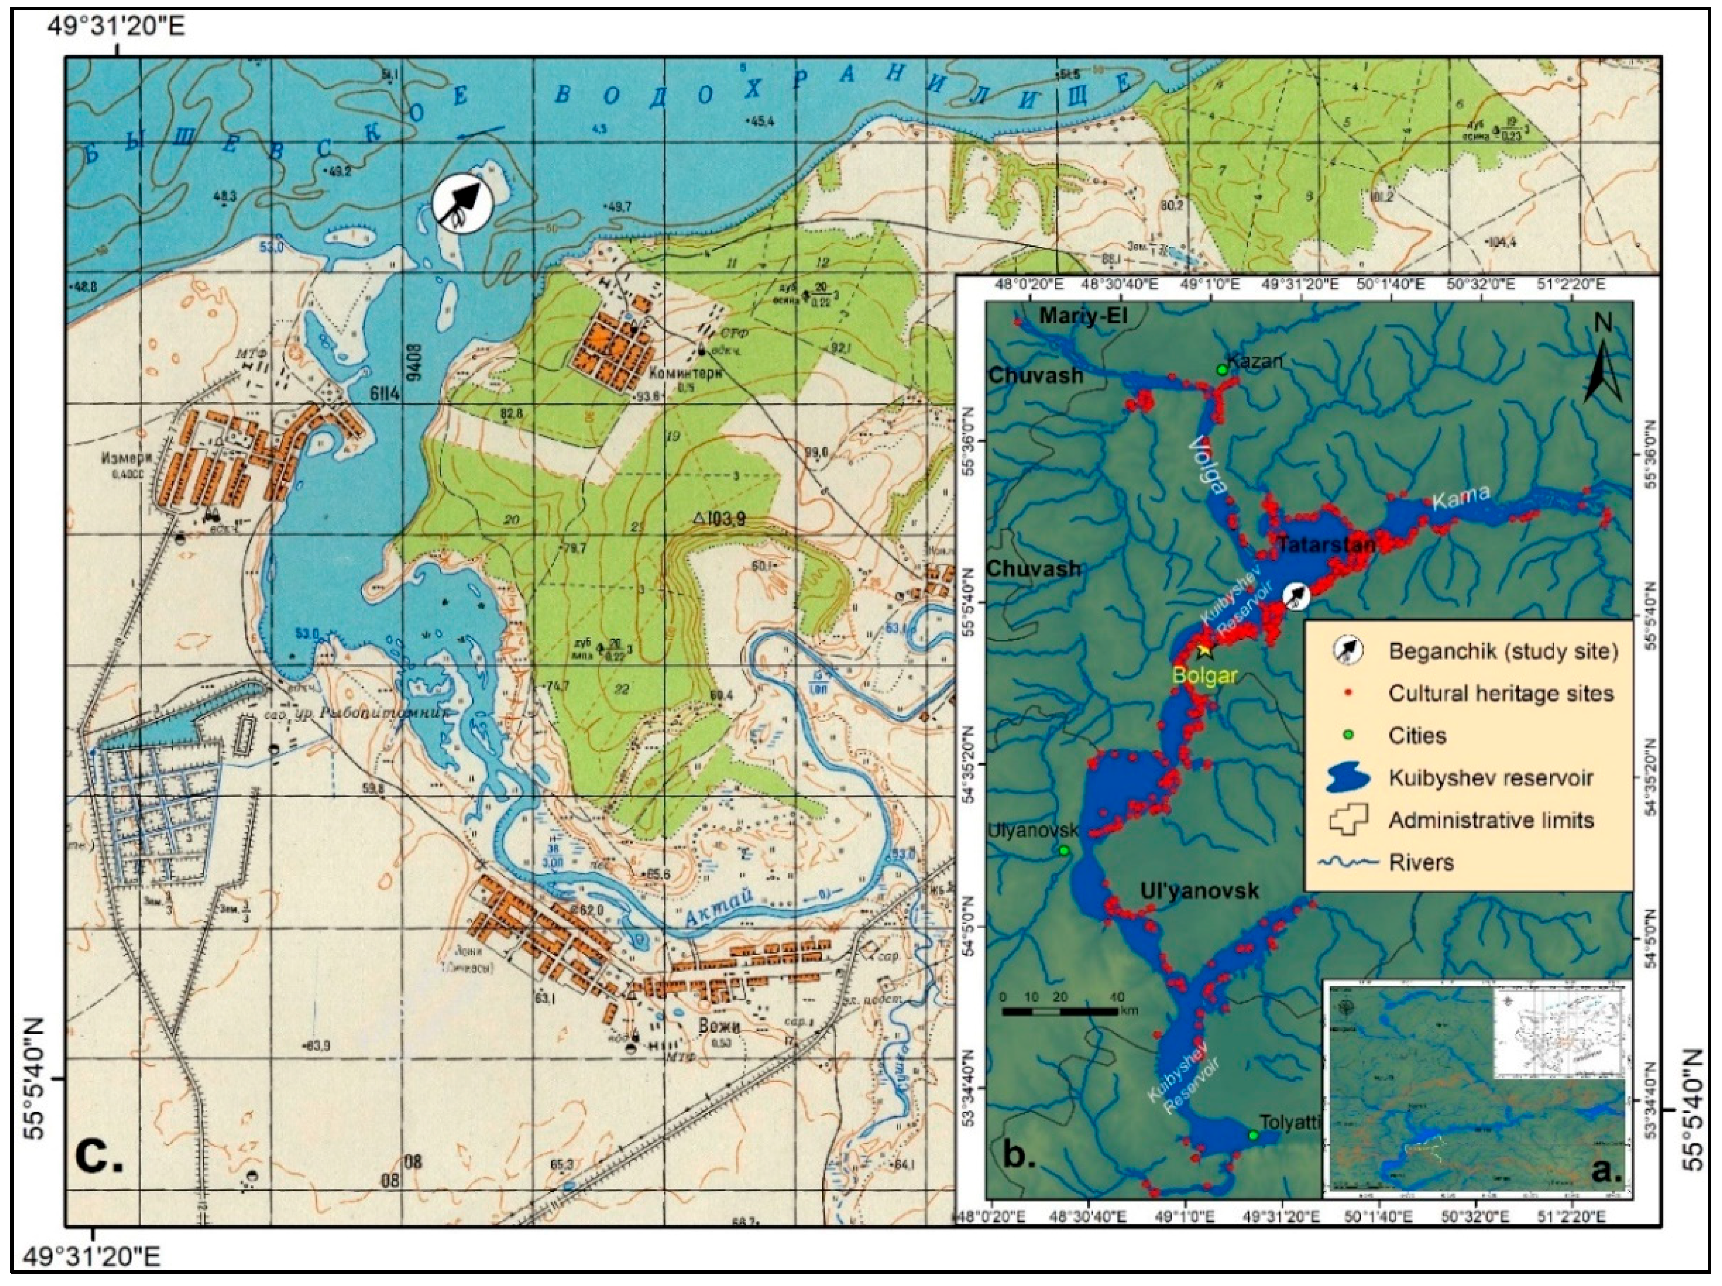
5.4. Beganchik Site
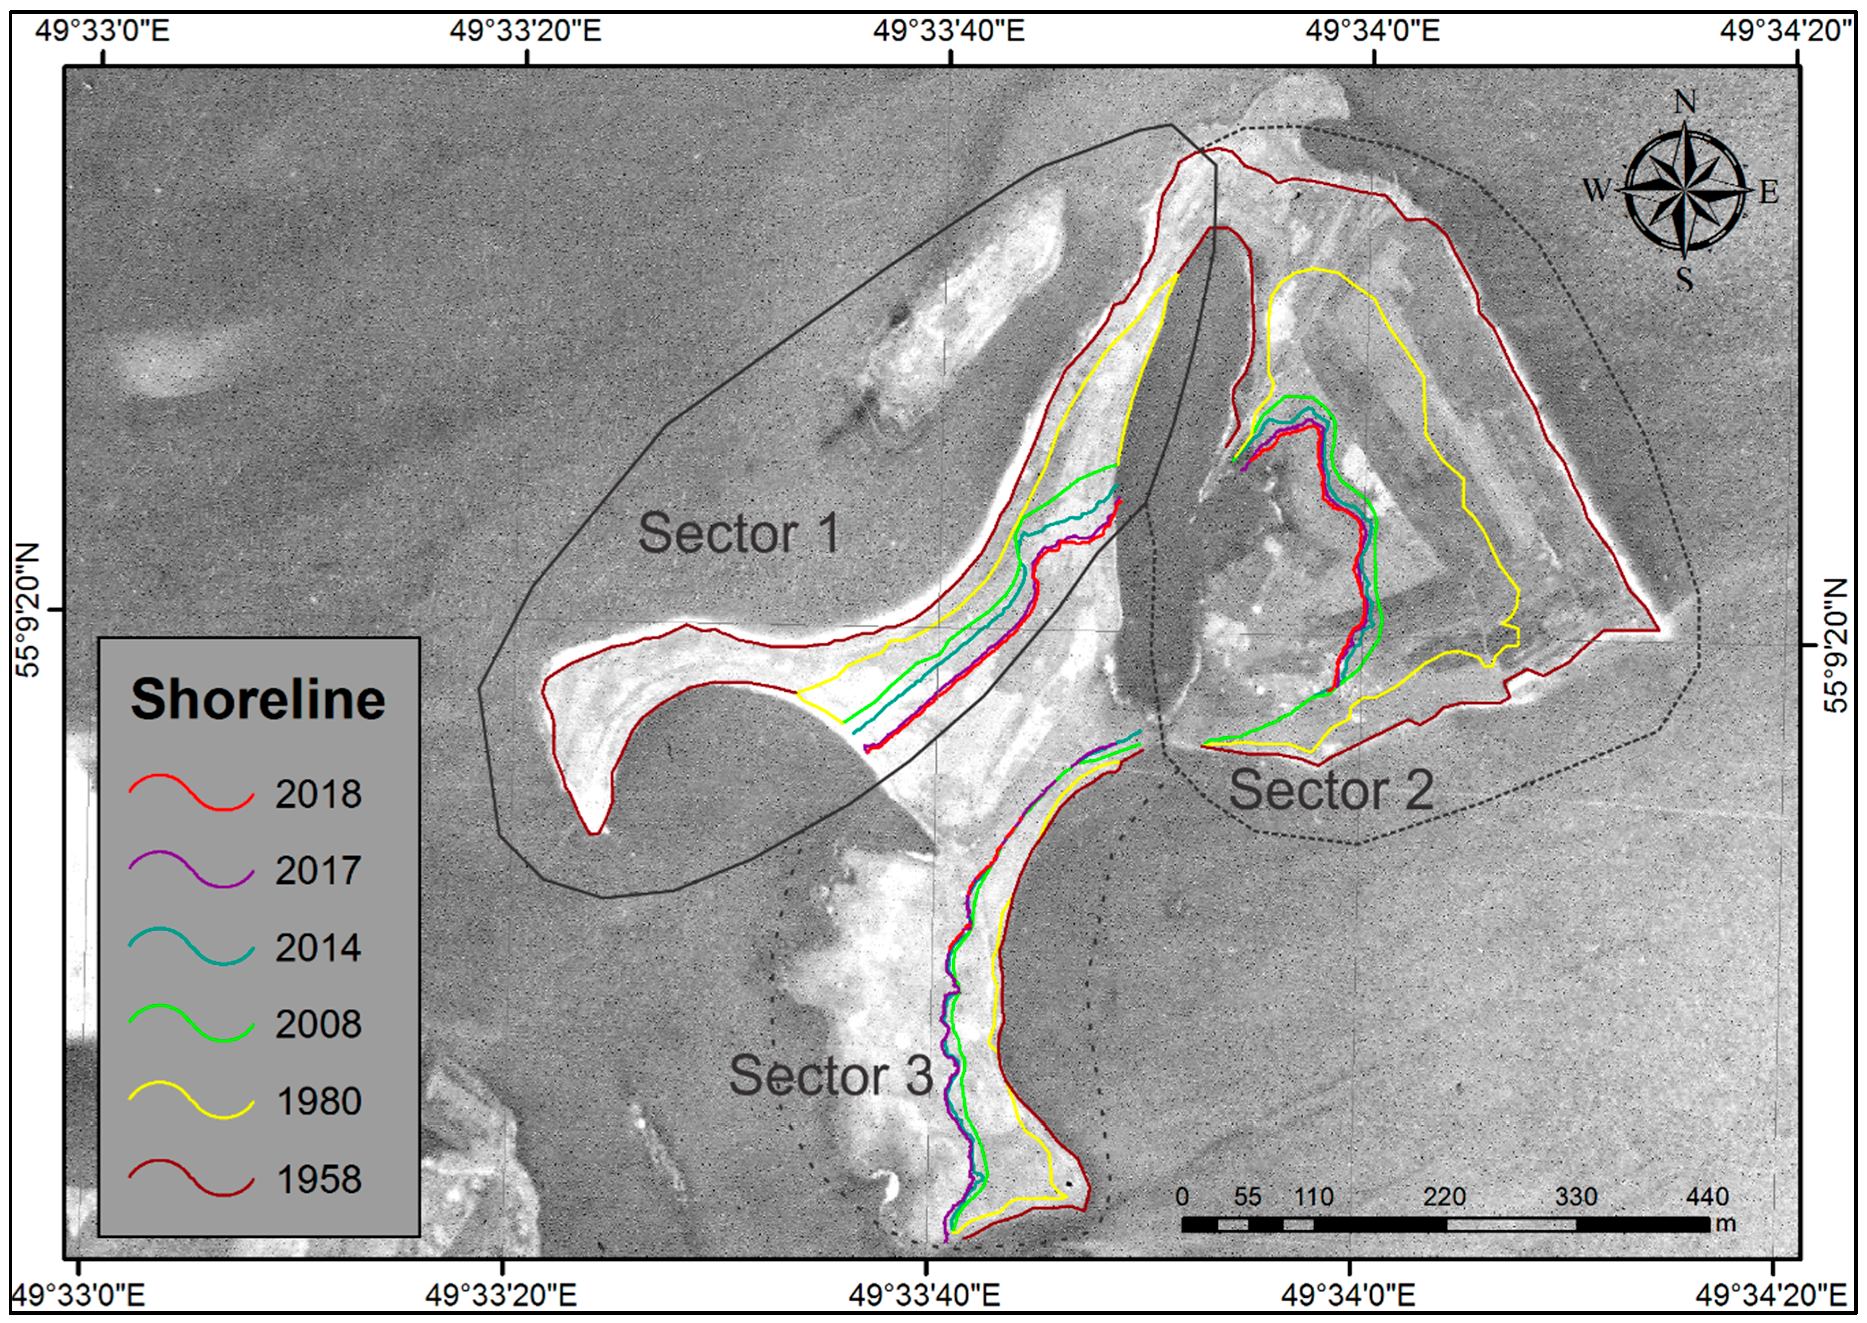
In order to analyse the coastal dynamics of Beganchik site, all the surveys were overlapped, and the site was divided into three sectors (
Figure 7), which will be further analysed separately. Beganchik site is located at the mouth of Aktai River, on the second terrace (the first terrace being flooded by Kuibyshev reservoir) of the floodplain which formed before the Holocene [
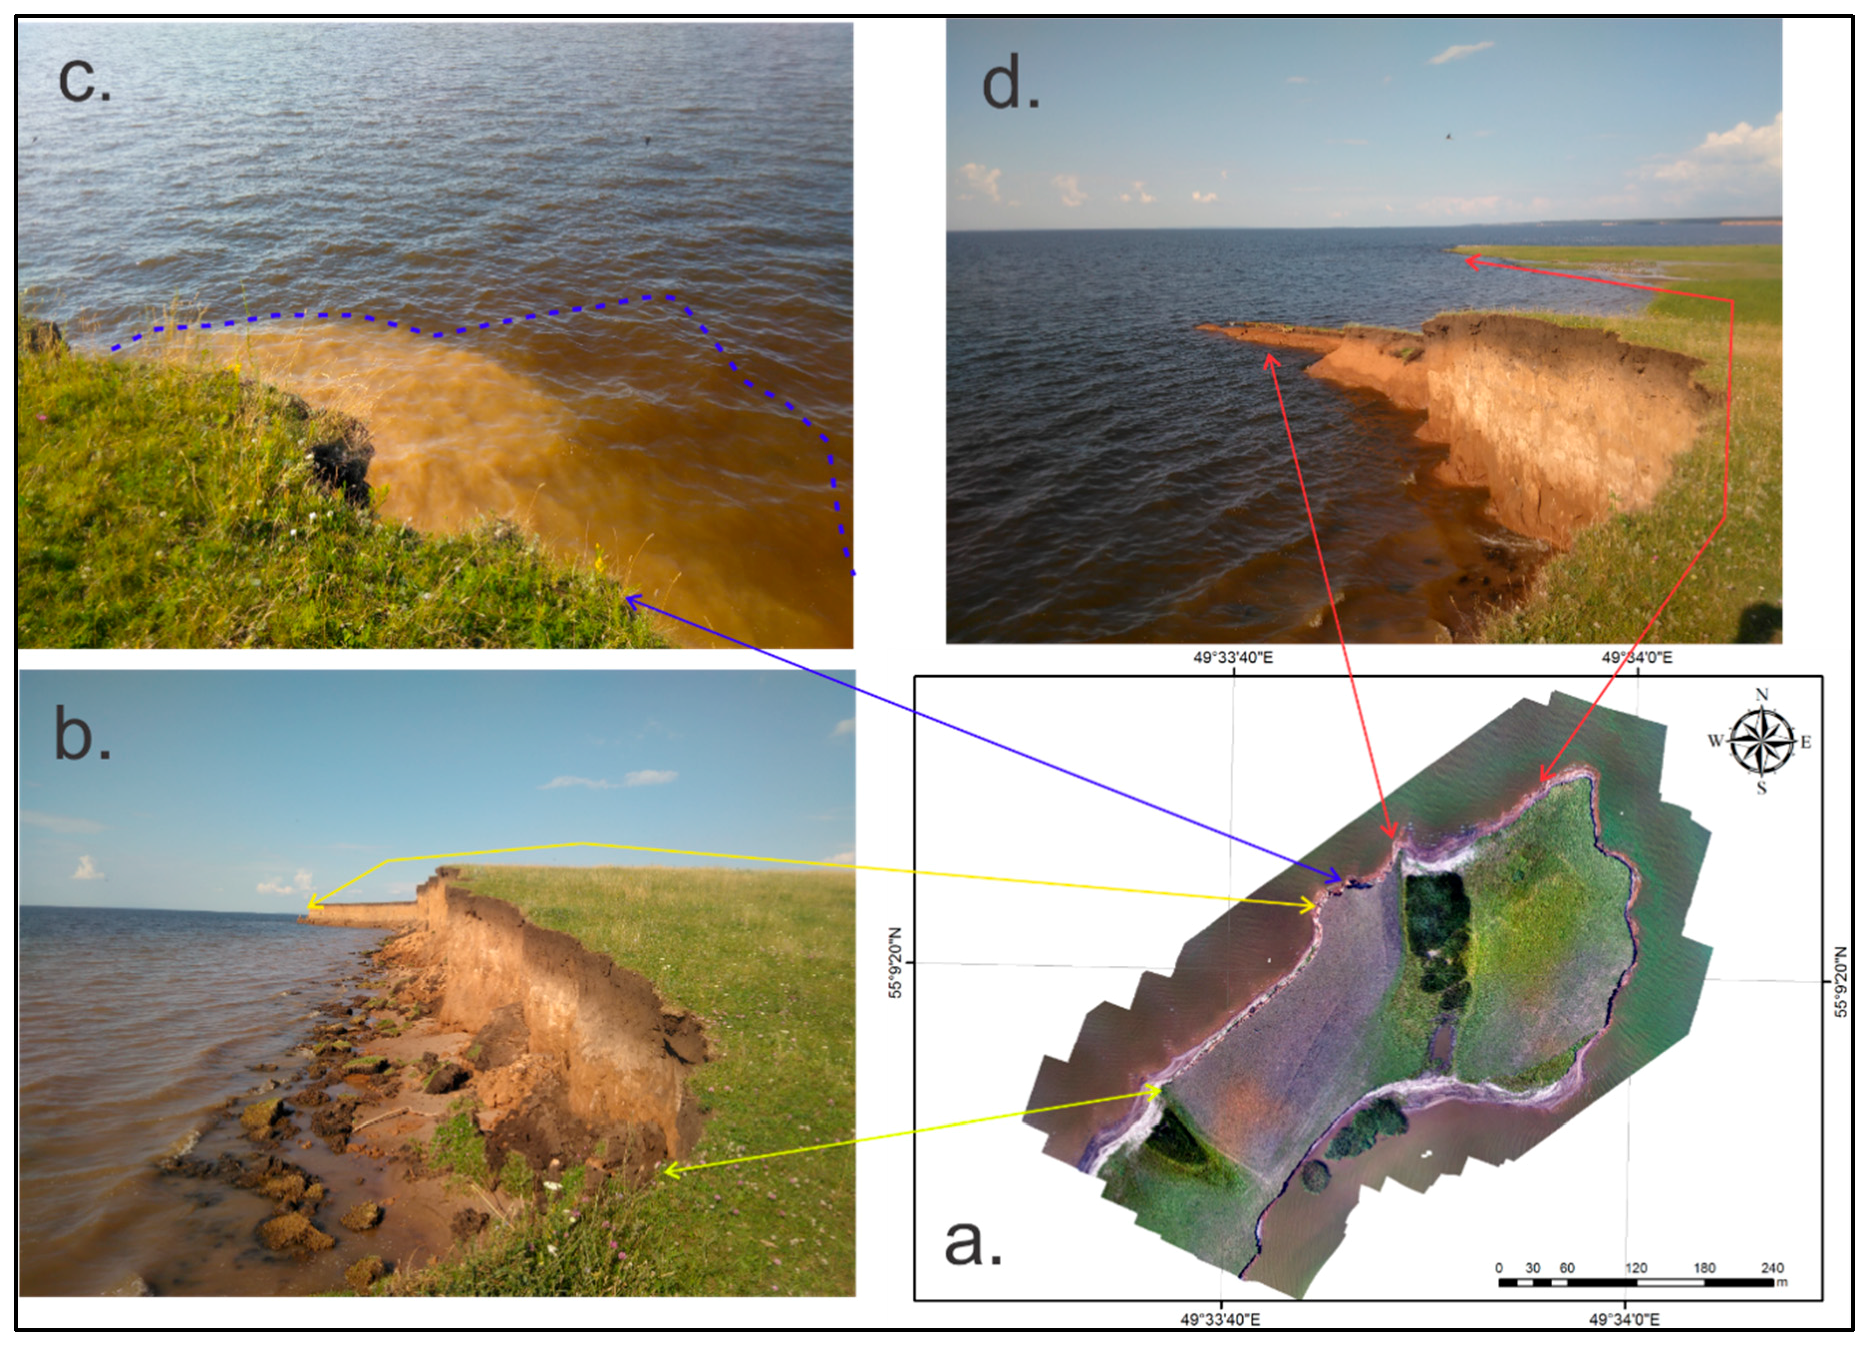
61]; the altitude is between 54–60 m a.s.l. According to the general view of the site (
Figure 8a), the northern part of the site is represented by a very steep cliff (
Figure 8b) which is continually eroding. Previous preliminary studies [
44] have revealed that the erosion rate is about 2–3 m/year.
5.4.1. Sector 1
Sector 1 was not actively eroded between 1958 and 1980 because it was protected by another island (60–90 m north-west,
Figure 7), as indicated by the relatively low values of the shoreline retreat (
Table 4); in this way, the site was protected from the mechanical action of waves (
Figure 8c). Later on, it can be seen that after the island disappeared, the yearly erosion has considerably increased, along with the specific land loss and volume. The direction of the Kama River flow is from north, north-east; being located at the “shelter” of Sector 2 from the speed and currents of the Kama River, this section was in some way protected. However, this sector became likely to be eroded, due to the high erosion rates of Sector 2 and having an elongated shape; this is highlighted of the specific land loss for 1958–1980.
Very high values of the specific land loss, in comparison with other sectors, is due to the height of the coast; which, in some parts can reach 5 m in height. Following the analysis, Sector 1 can be characterised as an extremely dangerous one.
5.4.2. Sector 2
Unlike Sector 1, Sector 2 was and still is under the direct exposure of the Kama River flow and currents. As can be seen in
Table 5, the specific land loss is at extremely high rates (
Figure 8d). This sector is the most exposed and threatened by erosion. The shoreline retreat is generally stable, varying within 2 m. According to the specific land loss indicator, it can be observed that the destruction occurred, especially within the first two periods, which is typical for the initial stage of lowland reservoir development. During this period, the extremities of this sector are cut off, after which the erosion process stabilises. Between 1958–2008, approximately 70% of the eastern part of the site was eroded. Following that, part of the river’s current’s strength was redistributed along the north-western part, which explains the sudden decrease in land loss. The height of the coast does not exceed 2 m, therefore, Sector 2 can be classified as moderately dangerous.
5.4.3. Sector 3
Sector 3 is located in the close proximity to Aktai River mouth, where is protected from the mechanical action of waves and Kama River strong currents. This portion of the Beganchik site shoreline is the most stable. As it can be seen from
Table 6, there have been no significant changes regarding this part of the coast from 1958 to 2018; except the period 1980–2014, when the specific land loss is higher when compared to other periods, but considerably lower when compared with the other two sectors. The most intensive processes of coastal transformation in the study area were observed in Sectors 1 and 2, open to the destructive effect of the currents and the mechanic action of waves. The erosion intensity may vary from year to year, depending on the water level oscillations in the reservoir. In order to have a more detailed situation on the Beganchik site erosion rates, continuous annual observations are needed.
Particular attention should be paid to Sector 1, in which the most important part of the site is located. If the erosion rates remain stable, the site will be completely impacted in about two or three decades. This imposes urgent mitigation measures from local authorities, along with the sustainable management of cultural heritage sites.


