3.1. Water-Management Simulations
The performance of the water-management model was analyzed taking into account its capacity to represent the volume or the area evolution of each reservoir in the basin, as well as the evolution of rice-cultivated areas at catchment scale during the years.
Three parameters were identified for the calibration of the water-management model:
Average irrigation supply: Average water volume required to irrigate 1 ha of rice in one harvest period. This volume includes the irrigation demand of the crop, as well as the water losses in the transport from the dam until the cultivated area.
Planted-area risk: Extra area cultivated, taking into account the probable precipitation that may occur during the irrigation period. This area is added to the one corresponding to the volume of water stored in the reservoir.
Water-application return: A surplus of the irrigation-water volume that is not used by the plant and flows into the stream network of the watershed.
The values of these parameters obtained from the calibration and their range of variation are presented in
Table 5. The range of variation considered for each parameter was defined considering respectively the actual daily water use for irrigation (information obtained from the interview of local farmers and agronomists); the cultural factor based on the willingness to risk to plant more area than the one calculated in the first week of October, hoping in a rainy summer (information obtained from the interview of local farmers); field monitoring and calculation [
45].
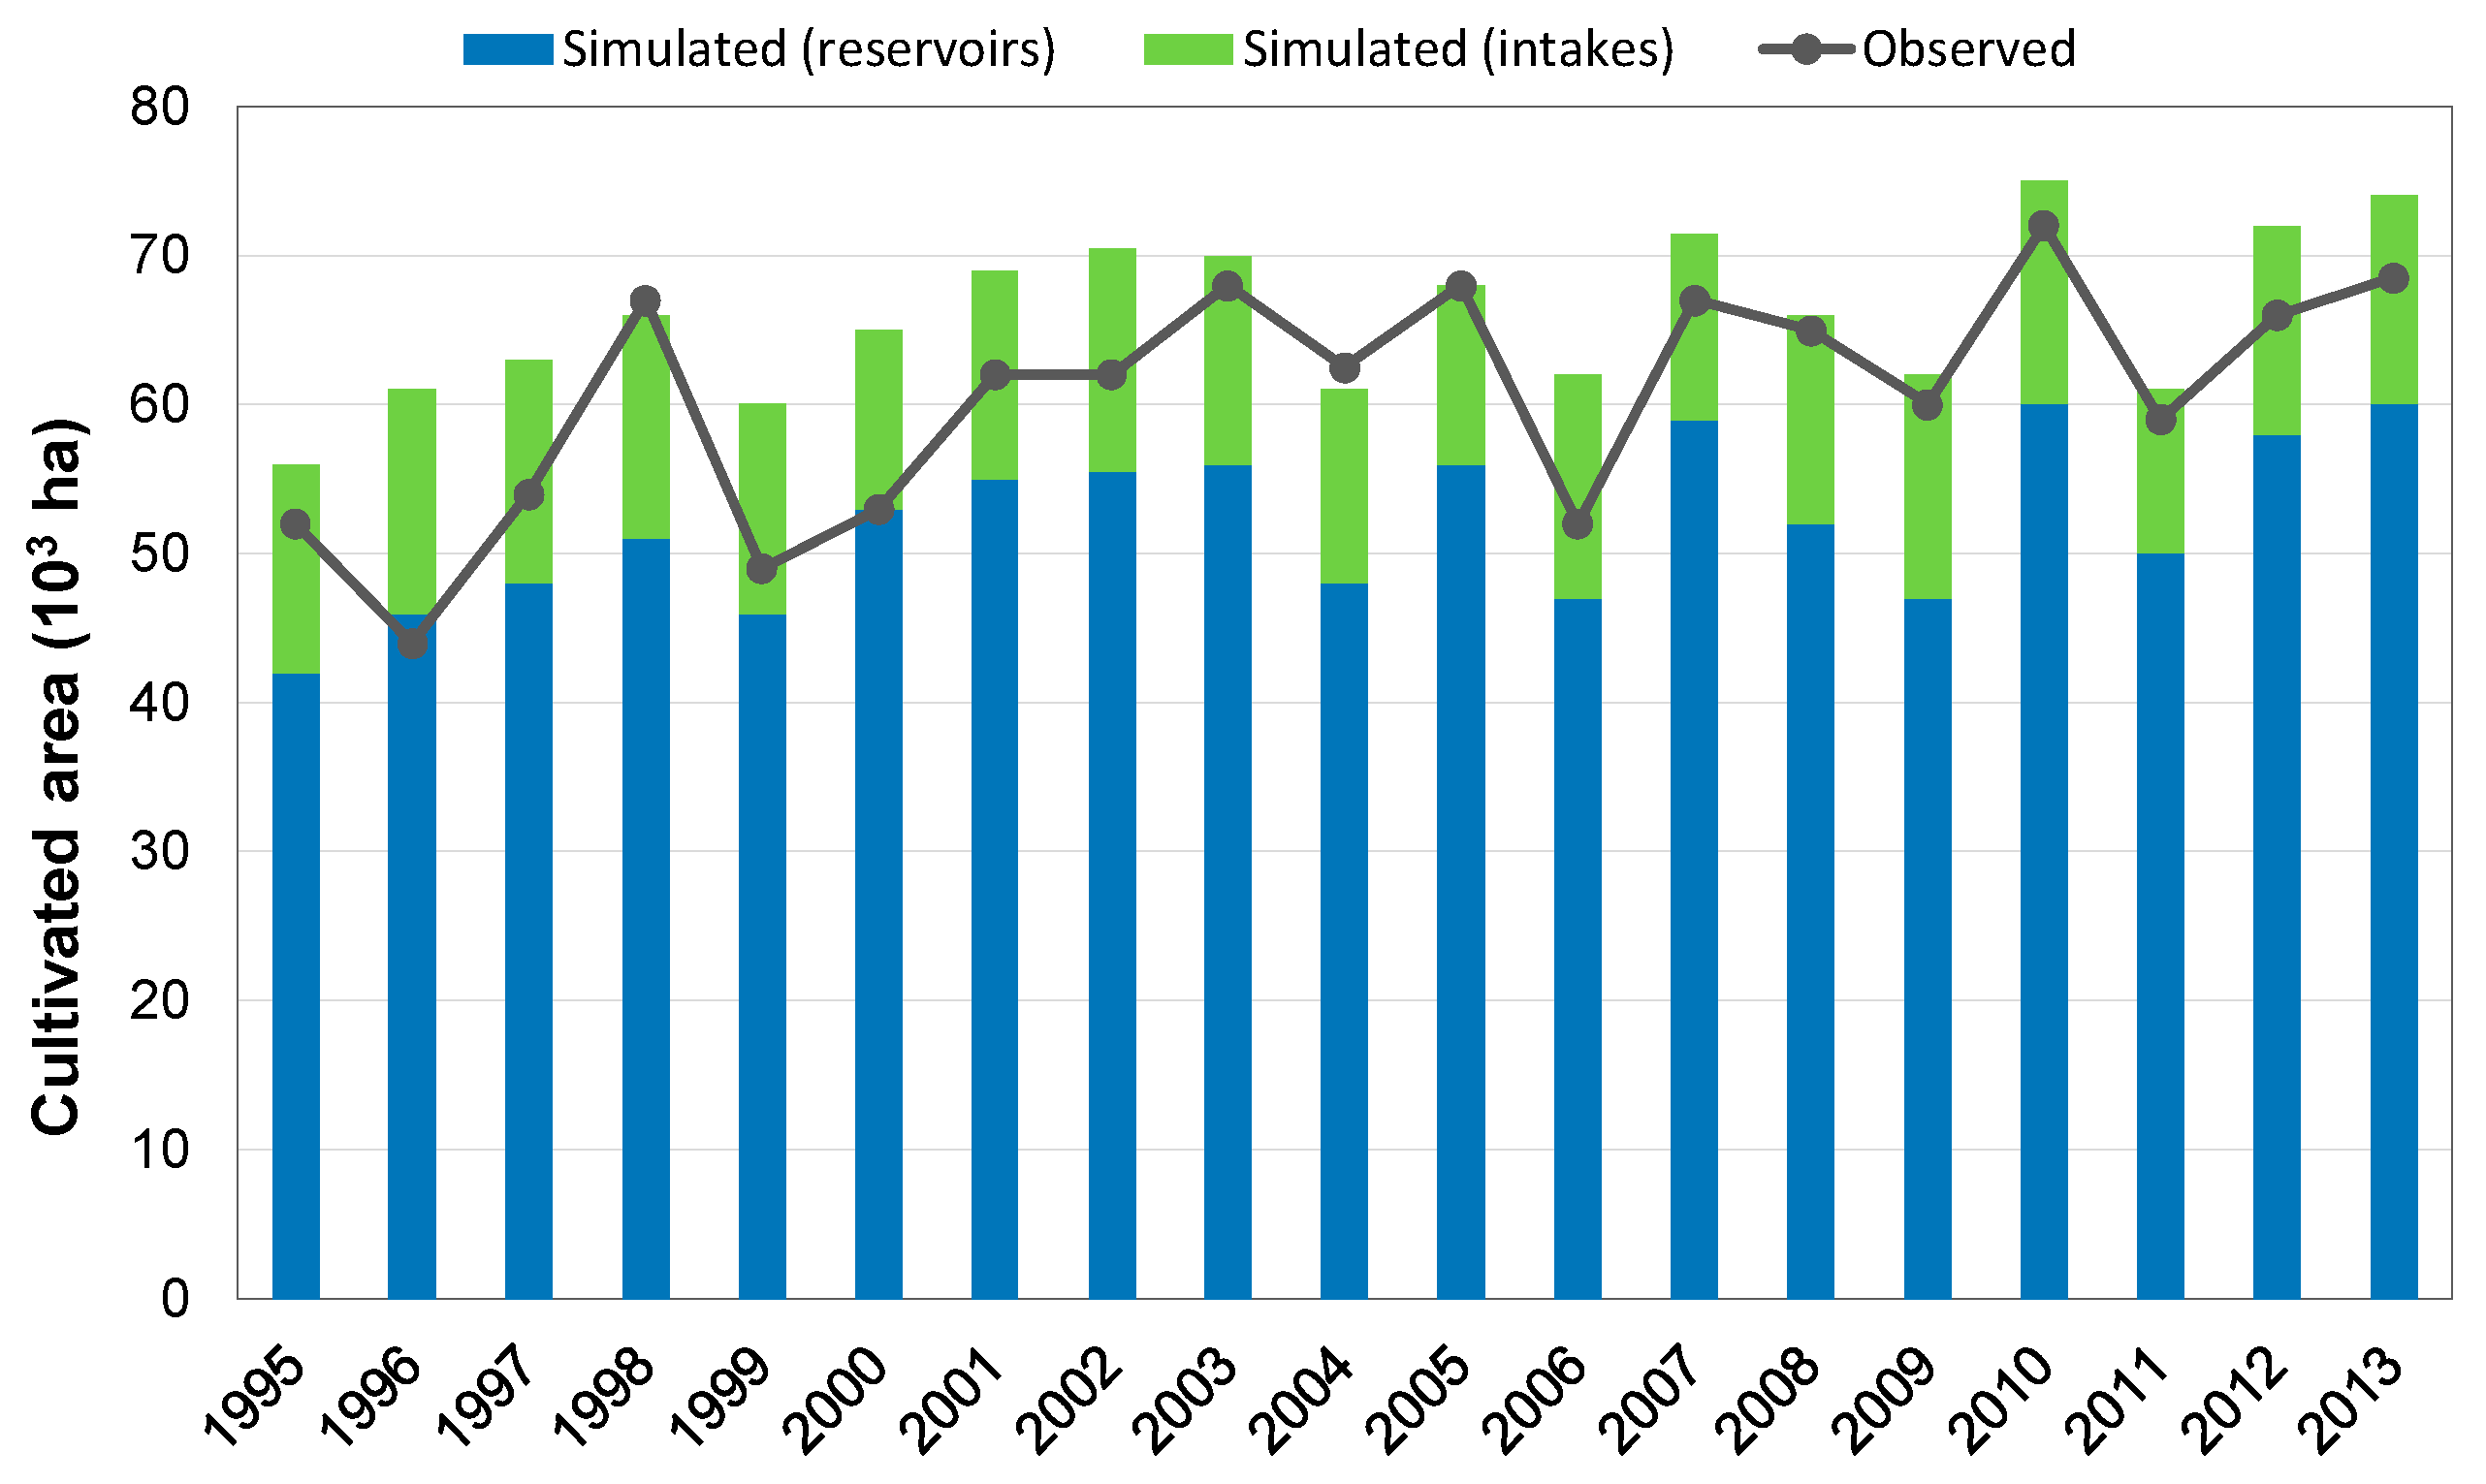
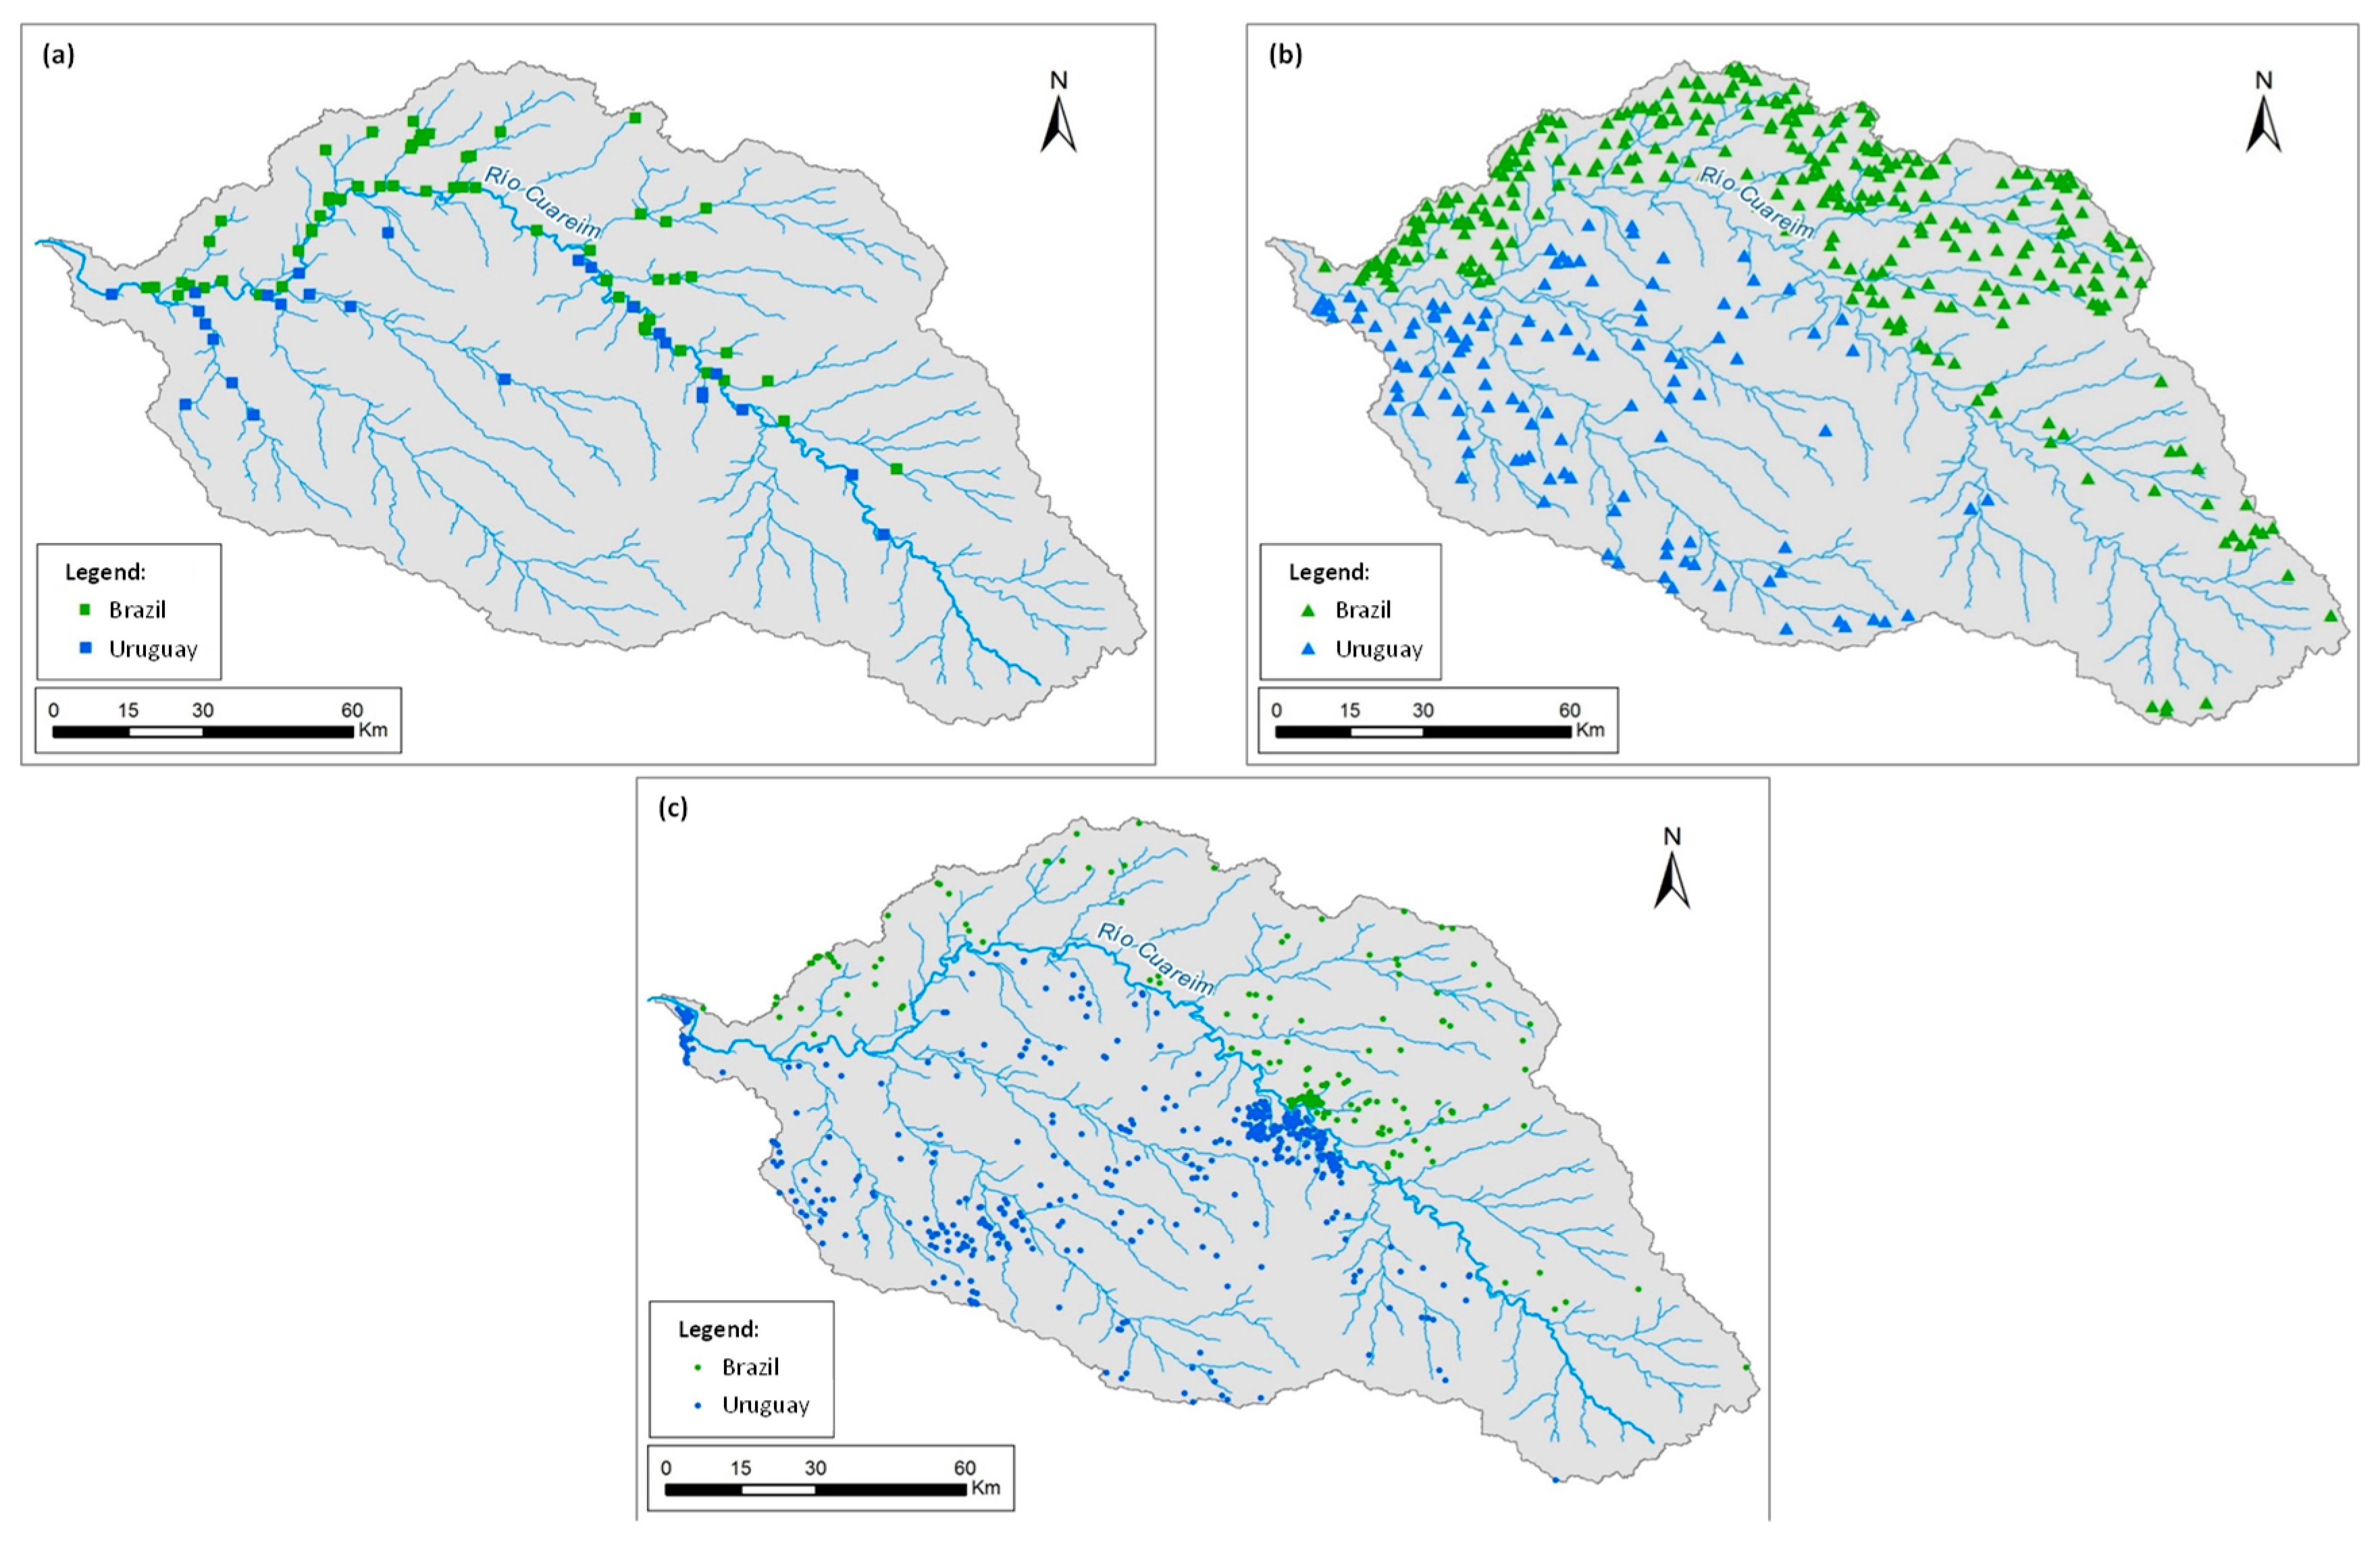
The calibration process was conducted by comparing the measured planted area, obtained from the Rice Institute of Rio Grande (IRGA, Brazil) and the Rice Cultivators Association (ACA, Uruguay), with the simulated one for all the small reservoirs and water intakes (Brazilian and Uruguayan). The graphical results of this comparison are shown in
Figure 7.
Working within the established range, and comparing the simulations with the measurements, the calibration was performed until a good fit was obtained. Agreement between the measured and simulated planted area for almost all simulations was overall very satisfactory. It is worth remarking that the observed volume for direct intakes is the maximum volume authorized, which is not always the volume actually used. This uncertainty in the input parameters justifies the not perfect match between simulations and observations. Therefore, if the observed data in
Figure 7 range within the green bars, the agreement between observations and simulations can be considered satisfactory.
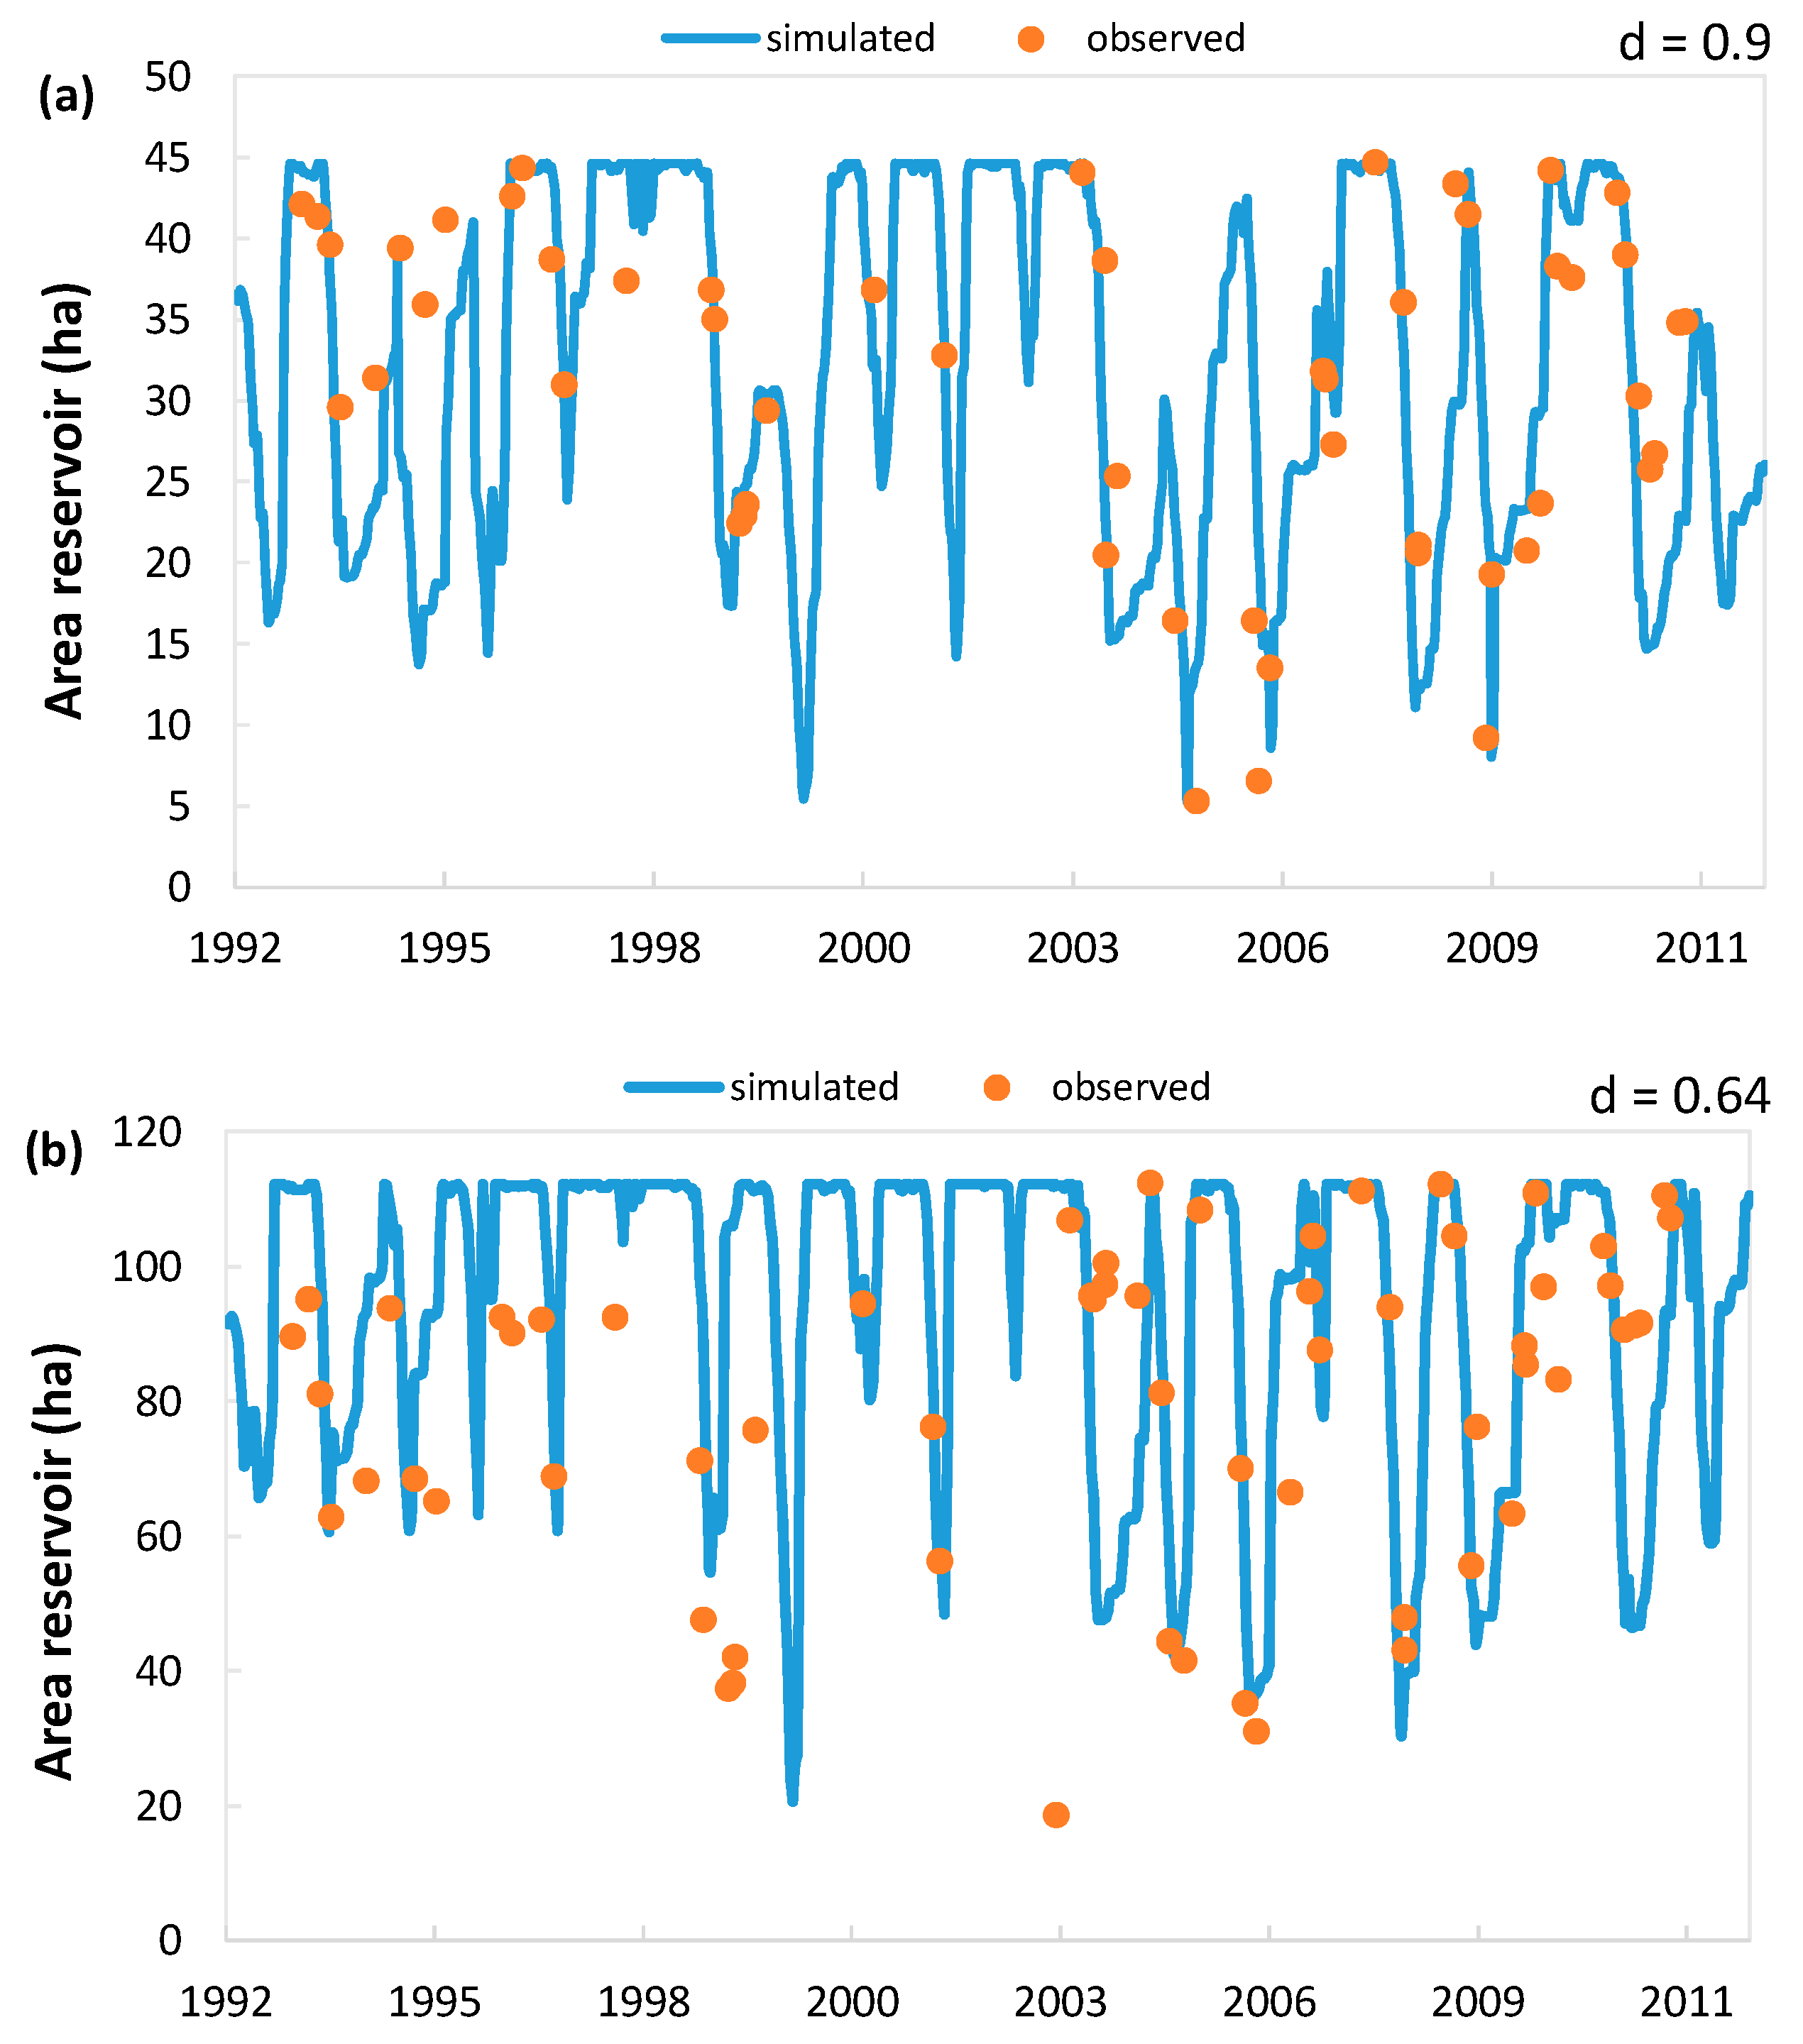
The validation process was conducted by comparing the simulated reservoir area with the measured/estimated one, obtained from satellite images. The simulated surface for each reservoir was obtained by combining the simulated volume in each week of the water balance and the volume/area curves obtained from each reservoir. In
Figure 8, a graphical and numerical/statistical comparison between the simulated and measured reservoir area is shown.
The results of the validation process were very satisfactory. It was found that more than 50% of the reservoirs were characterized by , and 80% of the reservoirs were characterized by .
The novelty of this modeling approach is represented not only from the possibility to analyze the effect on existing users of a new possible authorization to use the resource in the basin (direct intake or reservoir), but also because it allows to analyze the effectiveness of fulfilling the water demand of any particular water intake or reservoir.
3.2. Multi-Criteria Decision Analysis
An MCDA was conducted for ranking reservoir-site alternatives from the most to the least equitable and reasonable, considering the economic, social, and environmental factors listed in the UN Watercourses Convention [
11].
As mentioned in
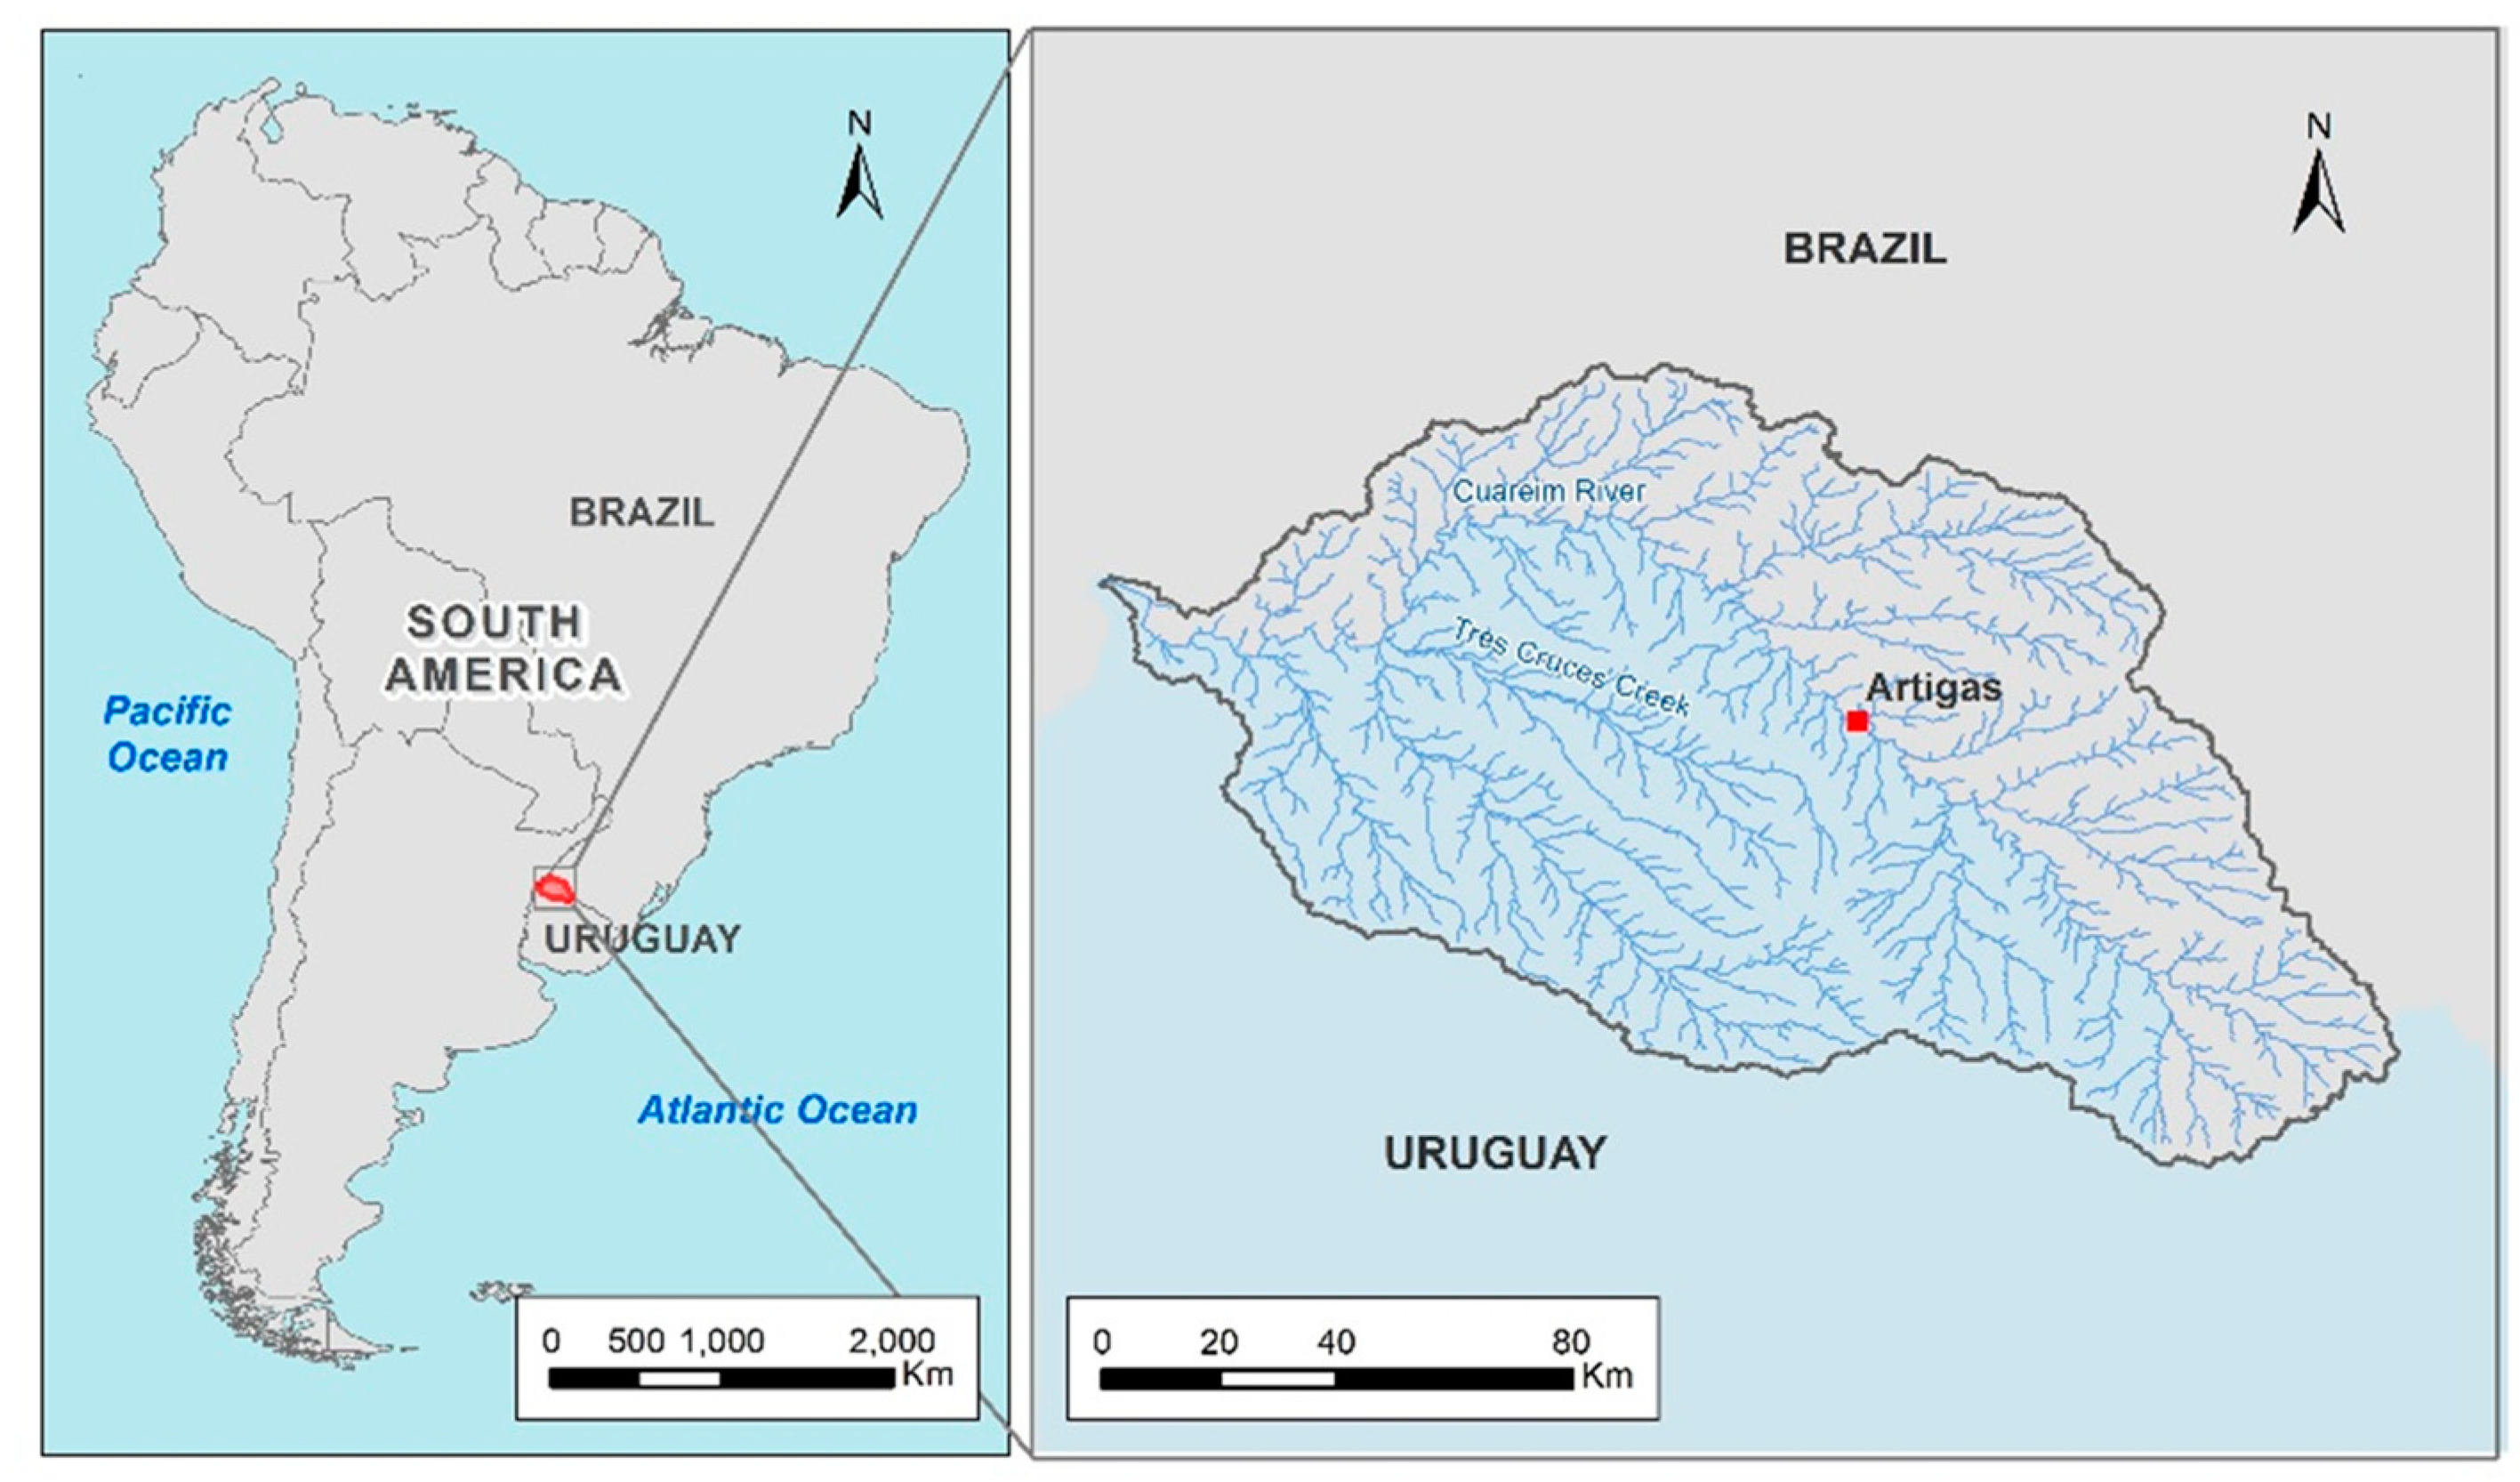
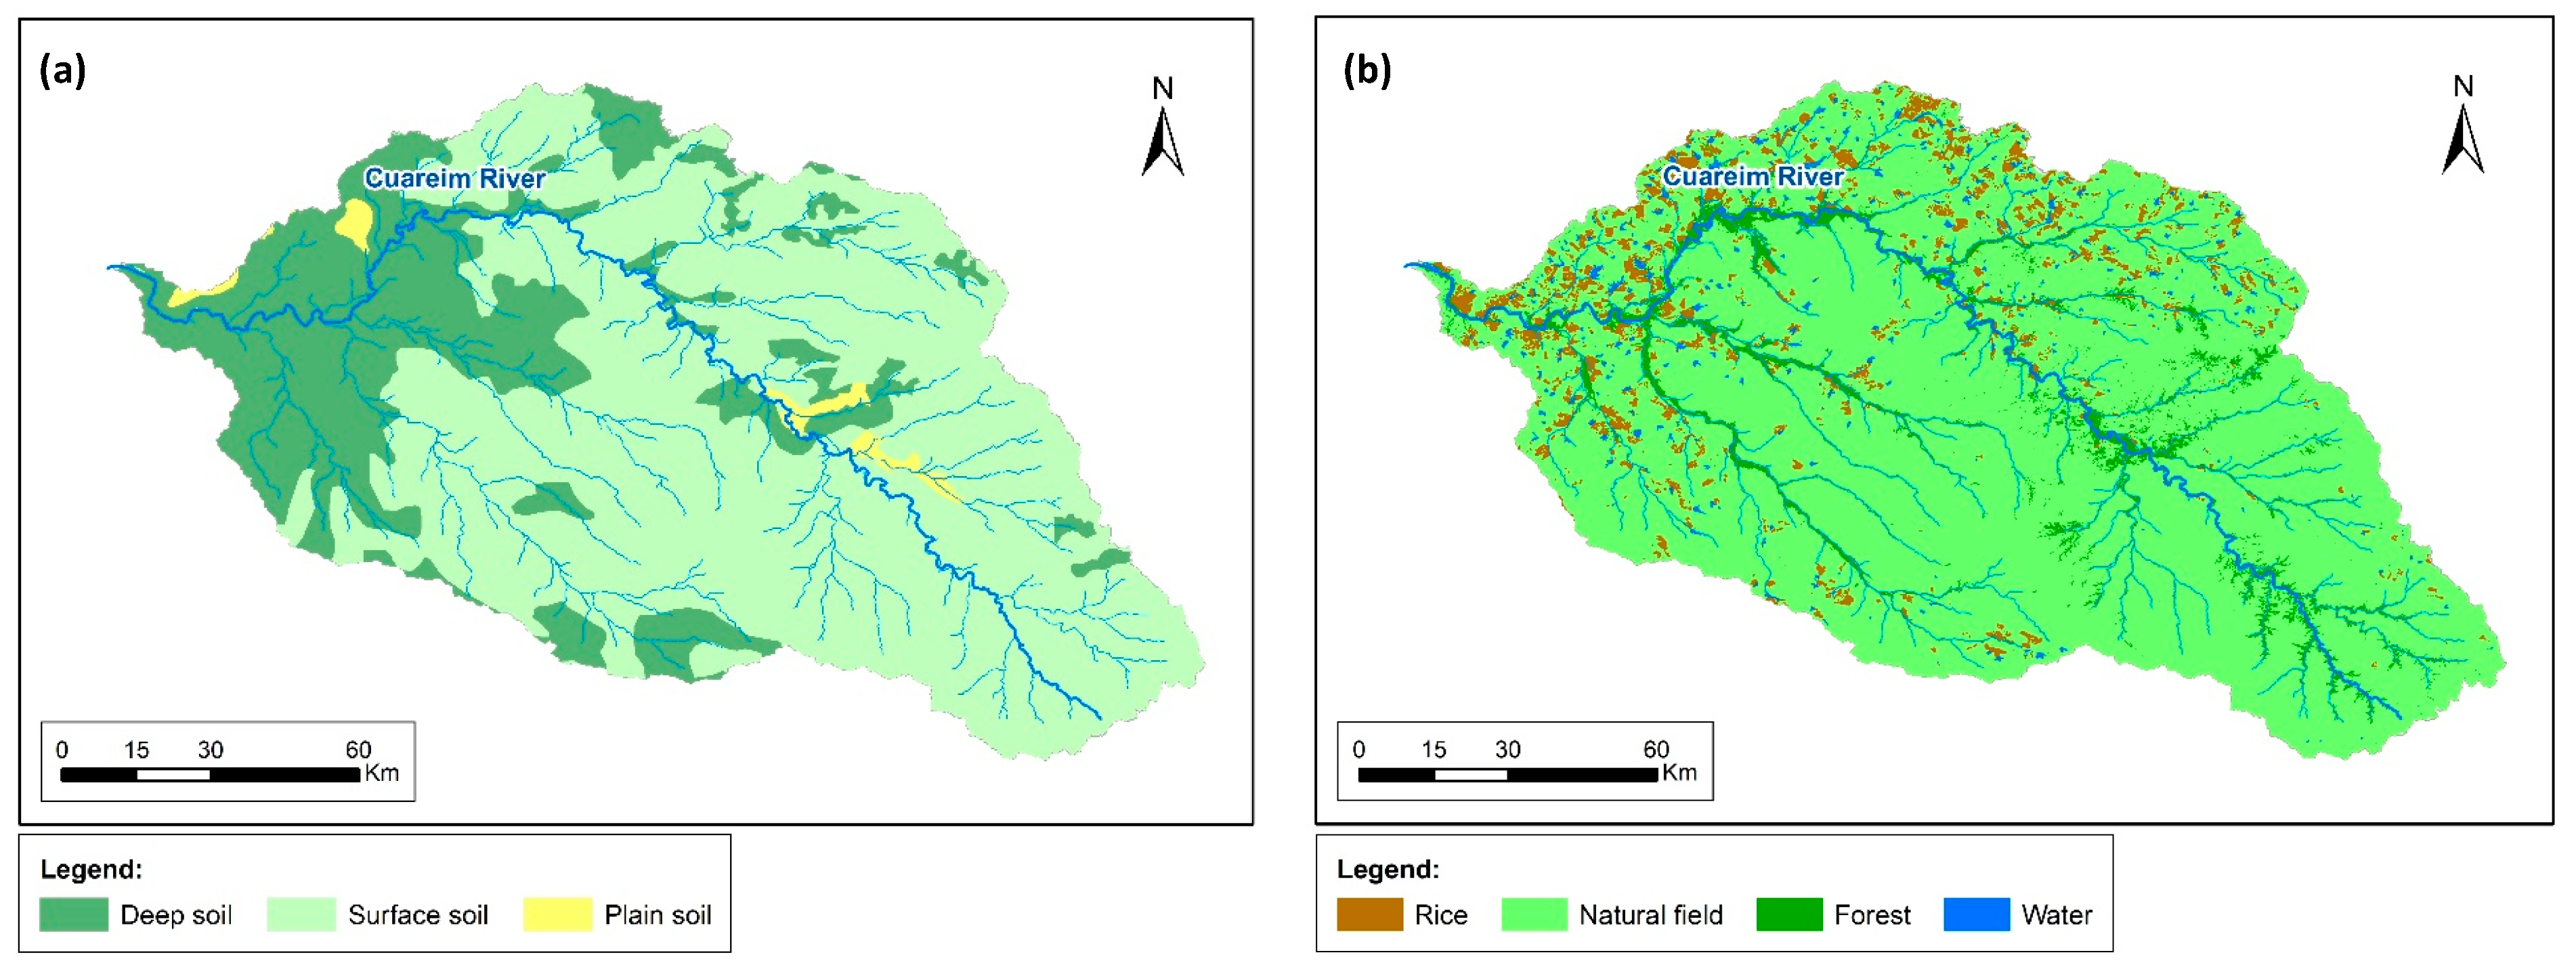
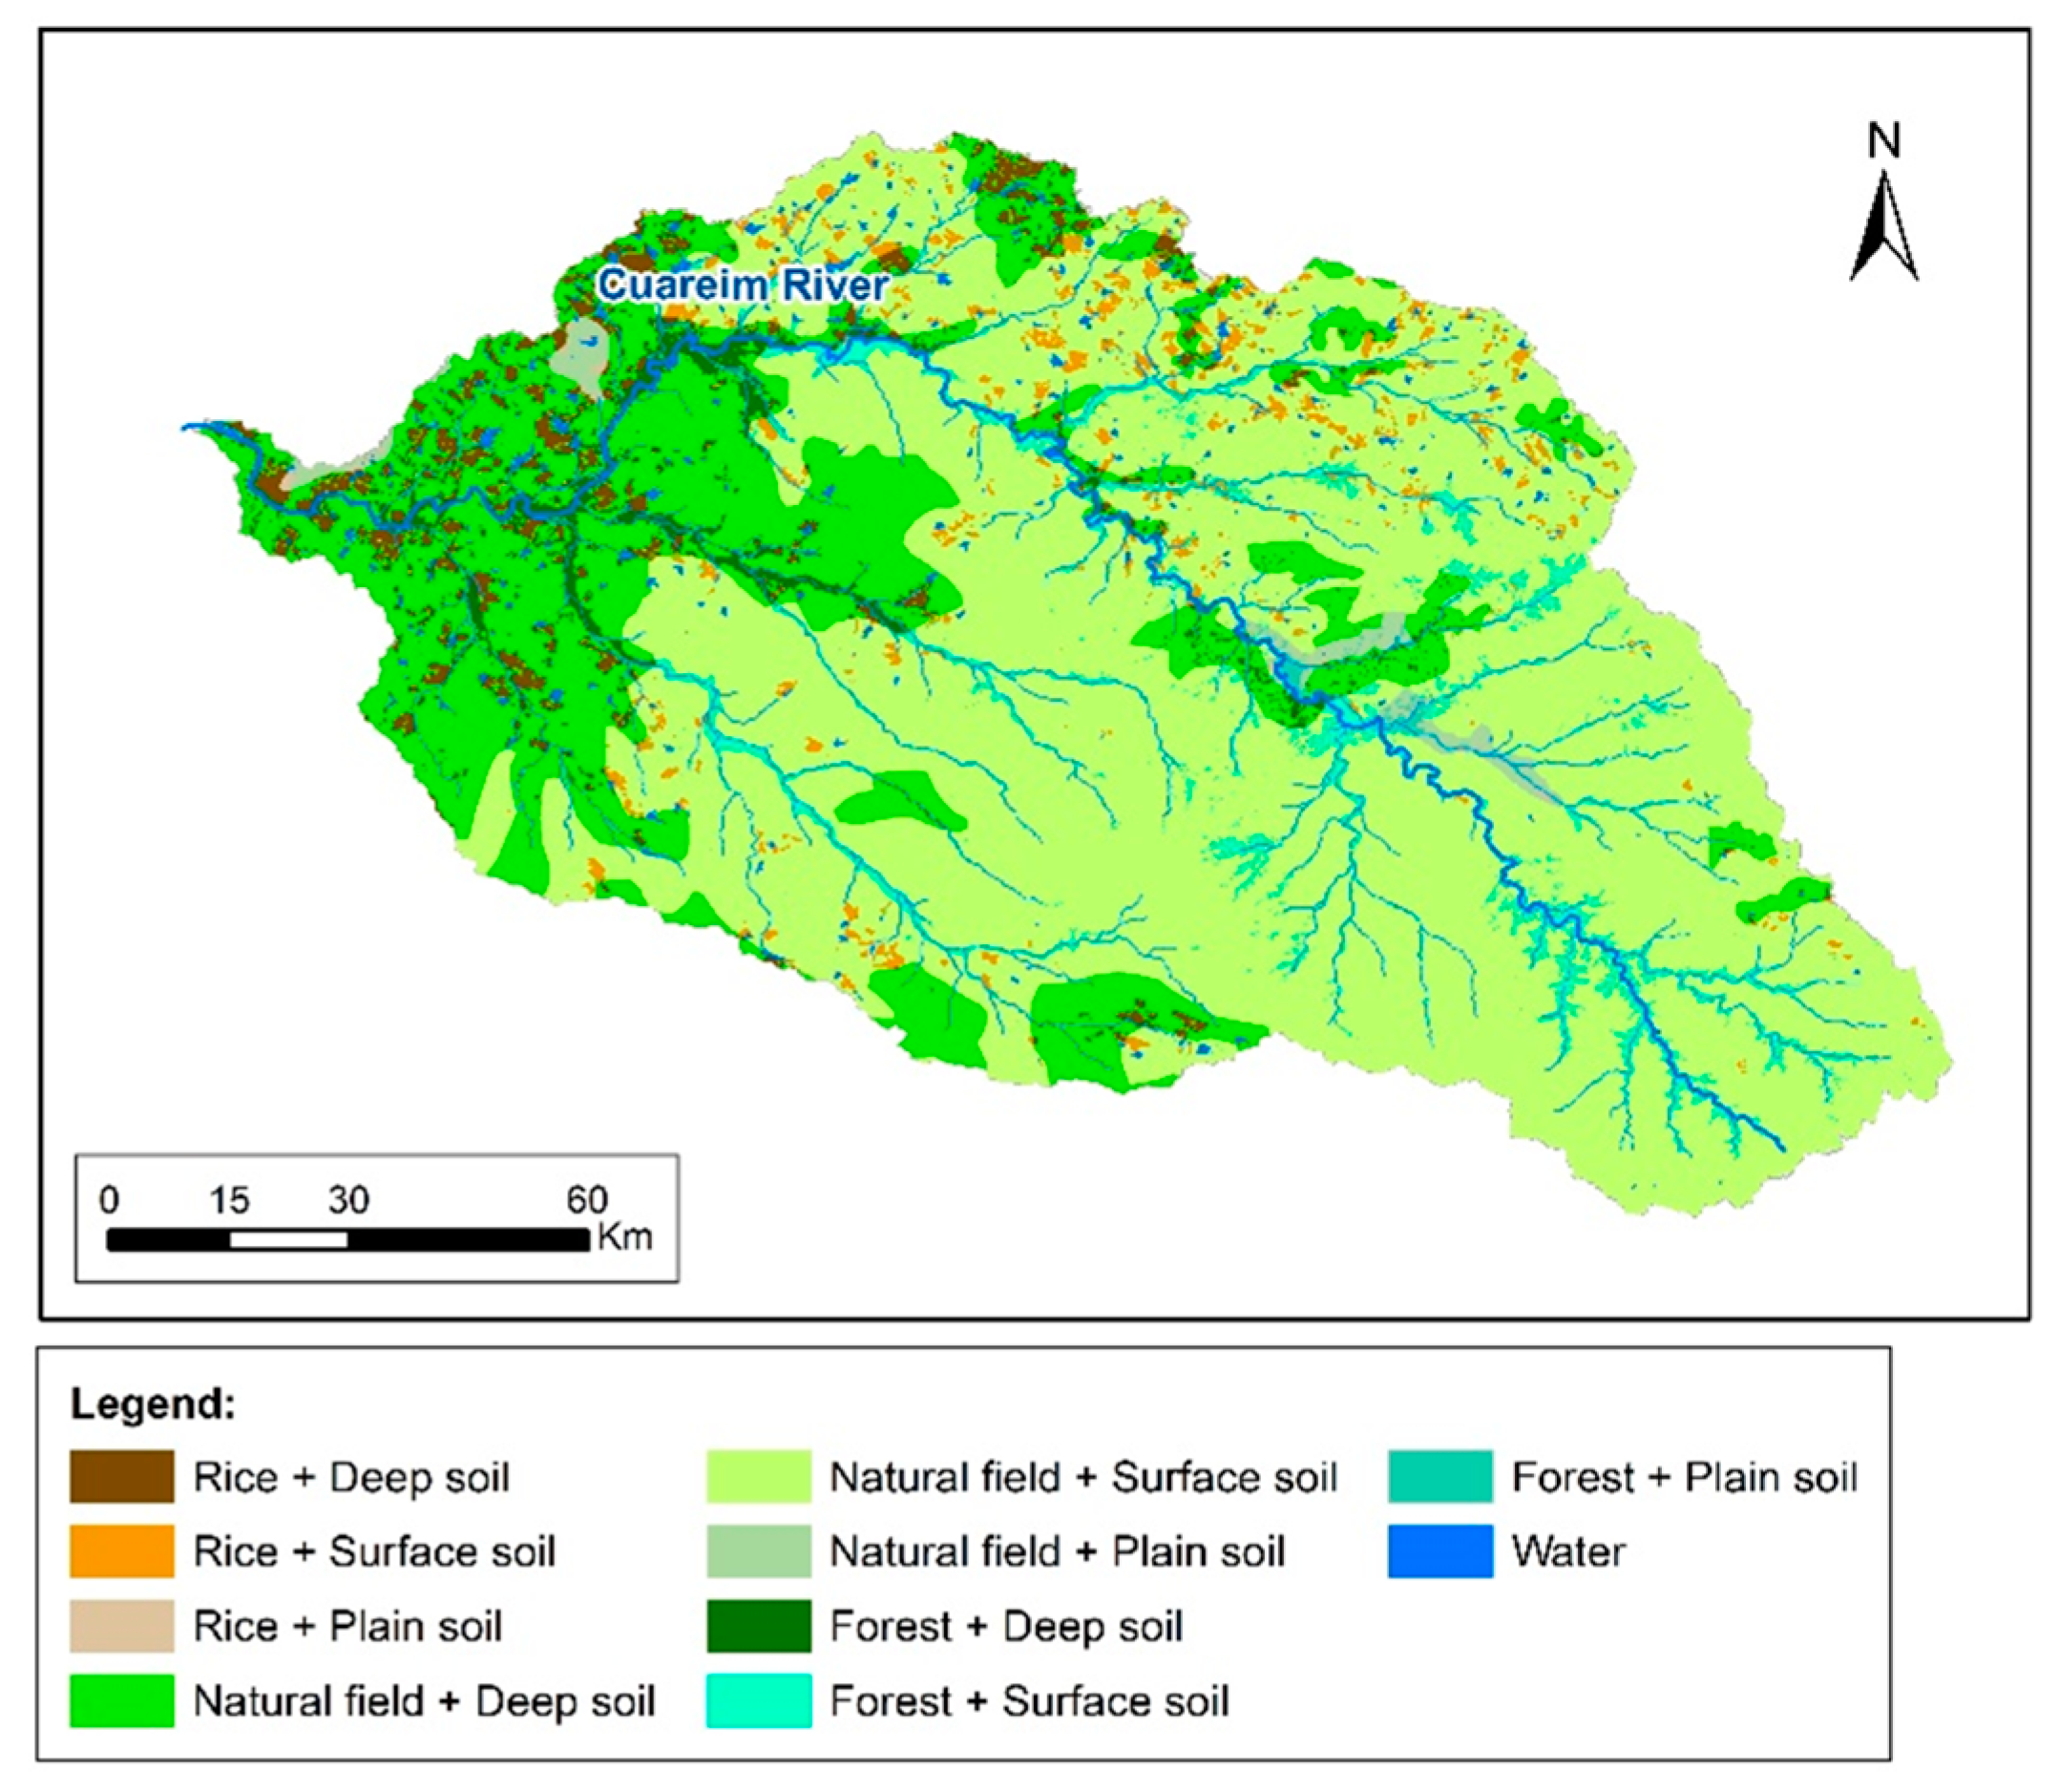
Section 2.2, the downstream part of the Cuareim/Quaraí watershed is more suitable for rice cultivation than the rest of the basin, due to its slope and soil type. To analyze the real water-sharing conflict raised during the bi-national meeting in 2016 [
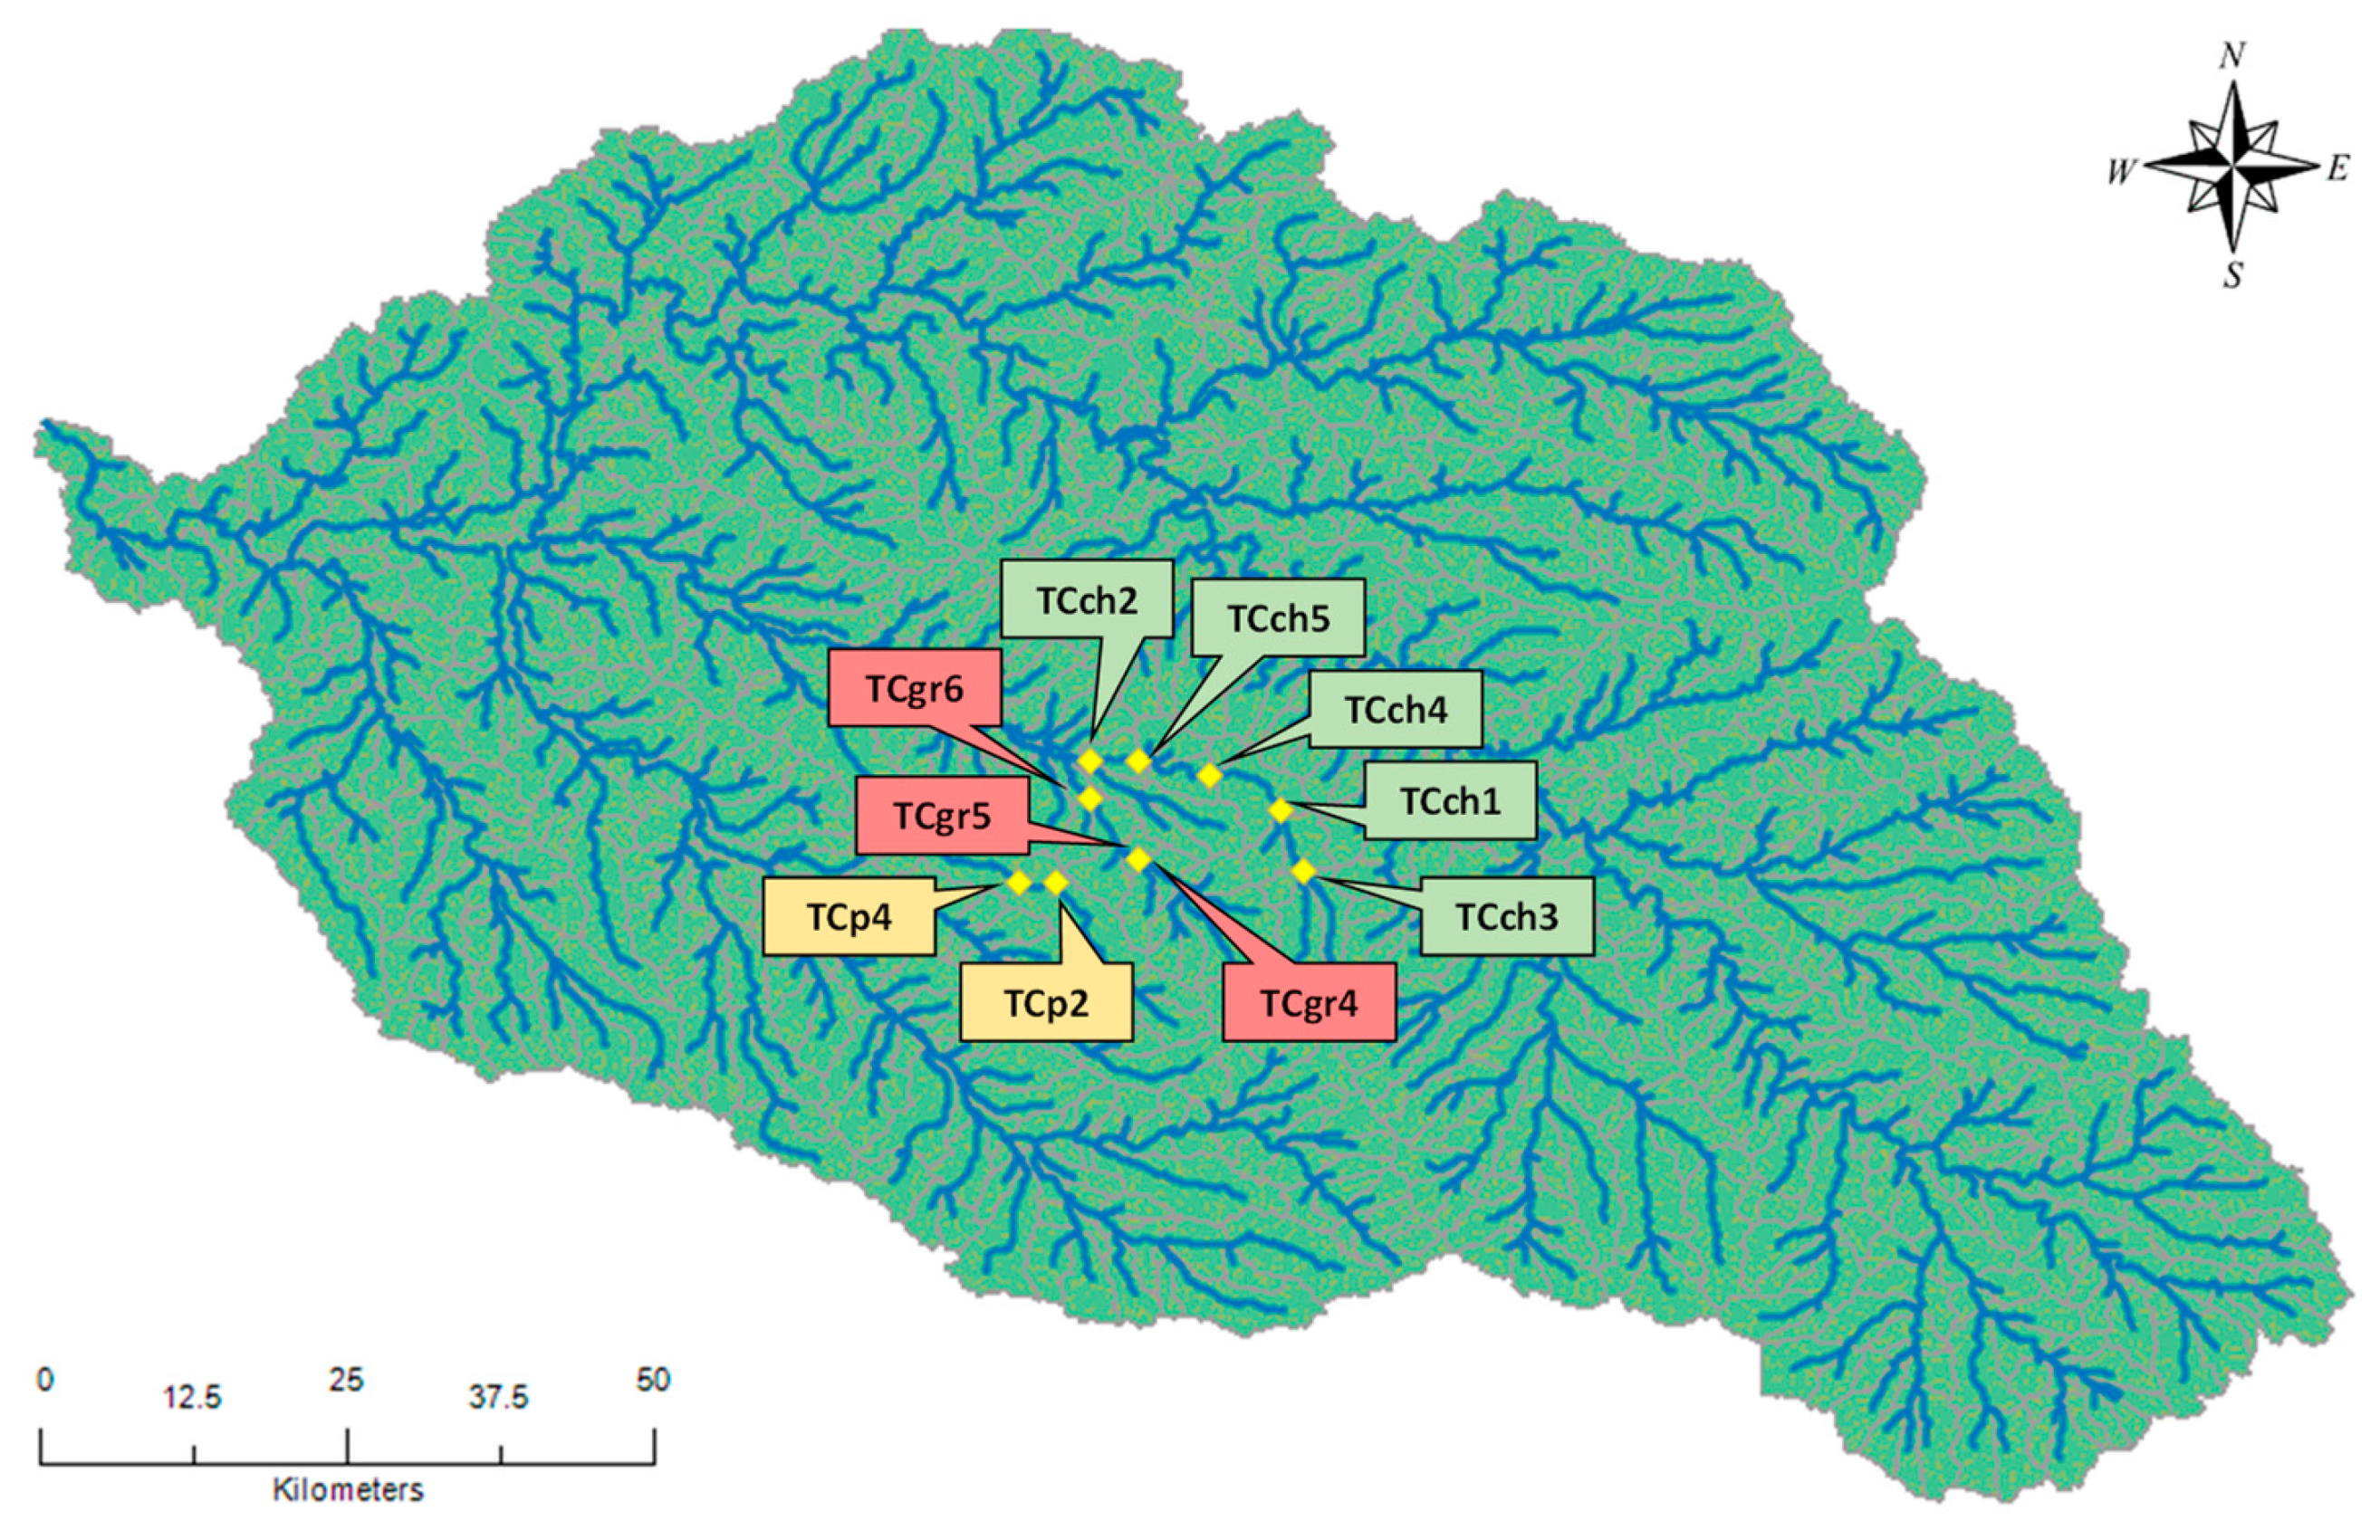
16], the Uruguayan side was chosen for possible future water allocations. In particular, among all the sub-basins, the Tres Cruces (TC) one was considered the most suitable for building reservoirs [
46]. In this subcatchment, all the possible areas that may generate a reservoir able to irrigate a planted surface greater than 1000 ha were considered. On the basis of this, ten possible sites were identified and used in the MCDA (
Figure 9). It is worth noting that these reservoirs are different from the previous small reservoirs (
Figure 5b) since they may be of interest of a group of farmers, of the region, even of the country if they are considered as part of a strategic plan for the watershed development.
In
Table 6, we show where each factor of the UN Watercourses Convention [
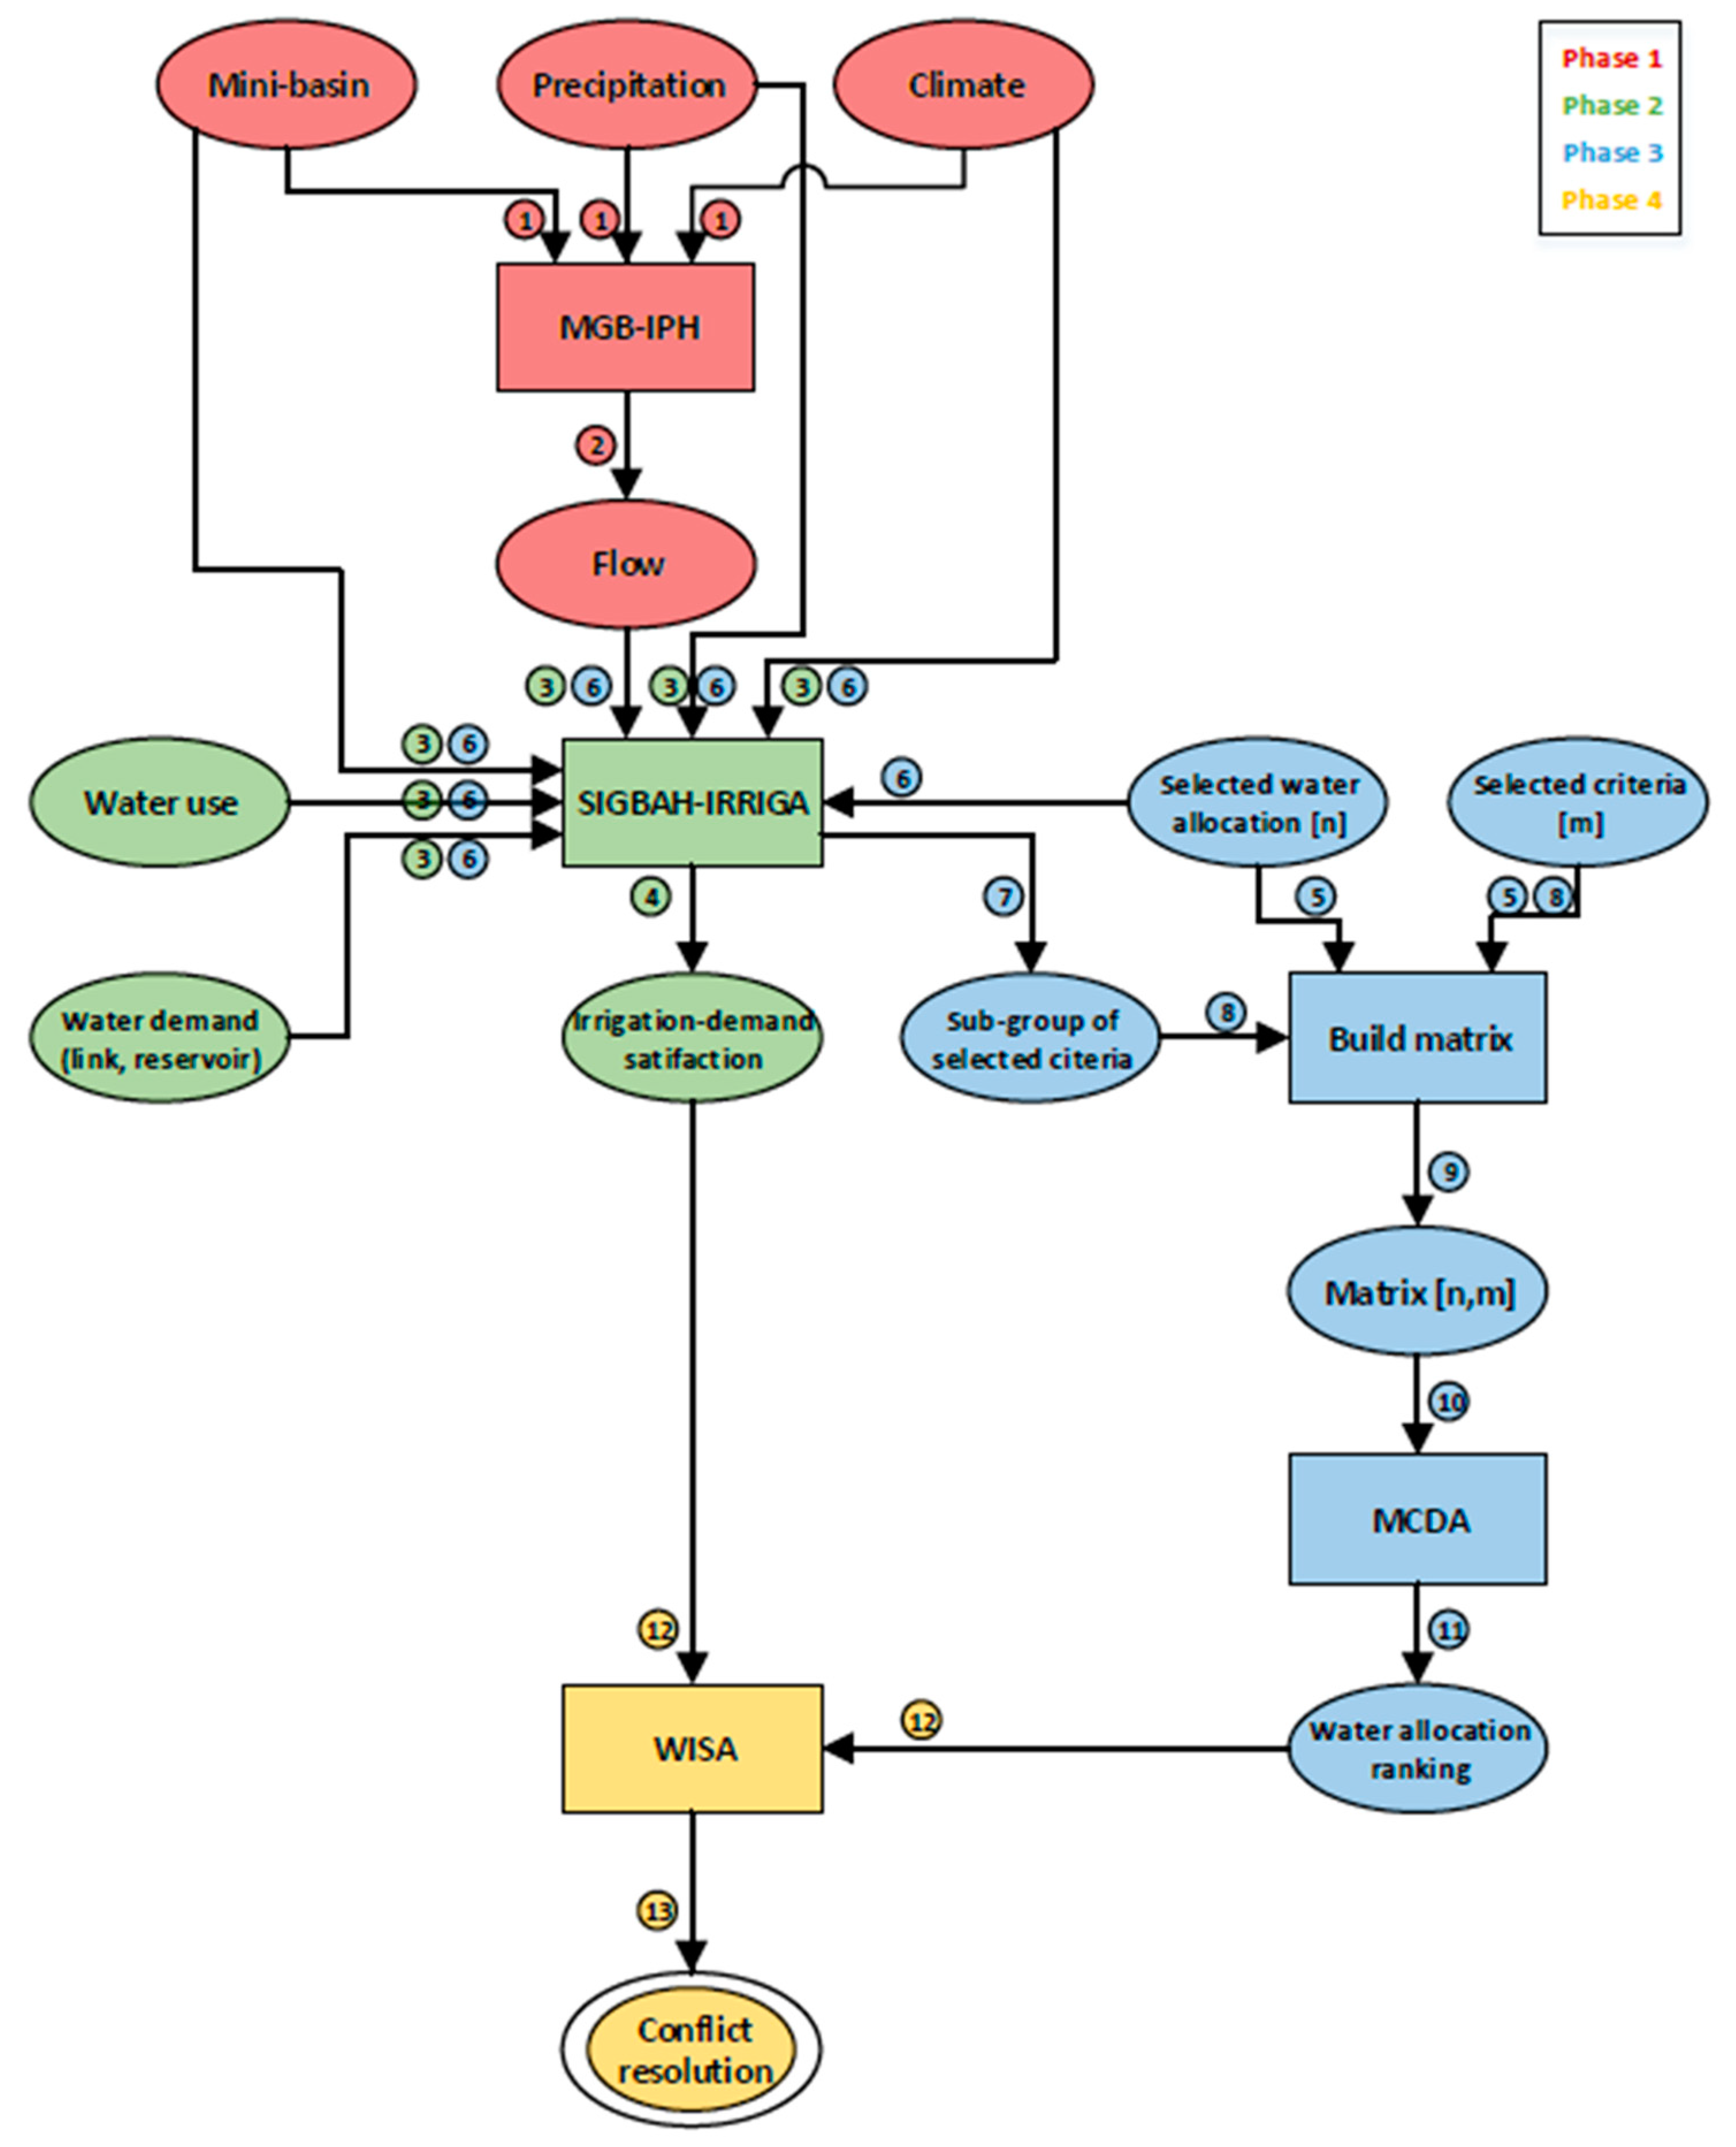
11] is taken into account in the new framework developed in this study. In Phase 2, water use and water demand were part of the input data of the water-management model, while irrigation-demand satisfaction was the output (
Figure 1). In Phase 3, the ten criteria mentioned above were listed.
A data matrix (10 × 10) was the input for the MCDA. In particular, PROMETHEE and GAIA methods were used. GAIA was primarily adopted as a visualization tool for assessing the influence that each factor has in the analysis. PROMETHEE was used to rank the sites from the best to worst in terms of the socio-economic and environmental factors listed above.
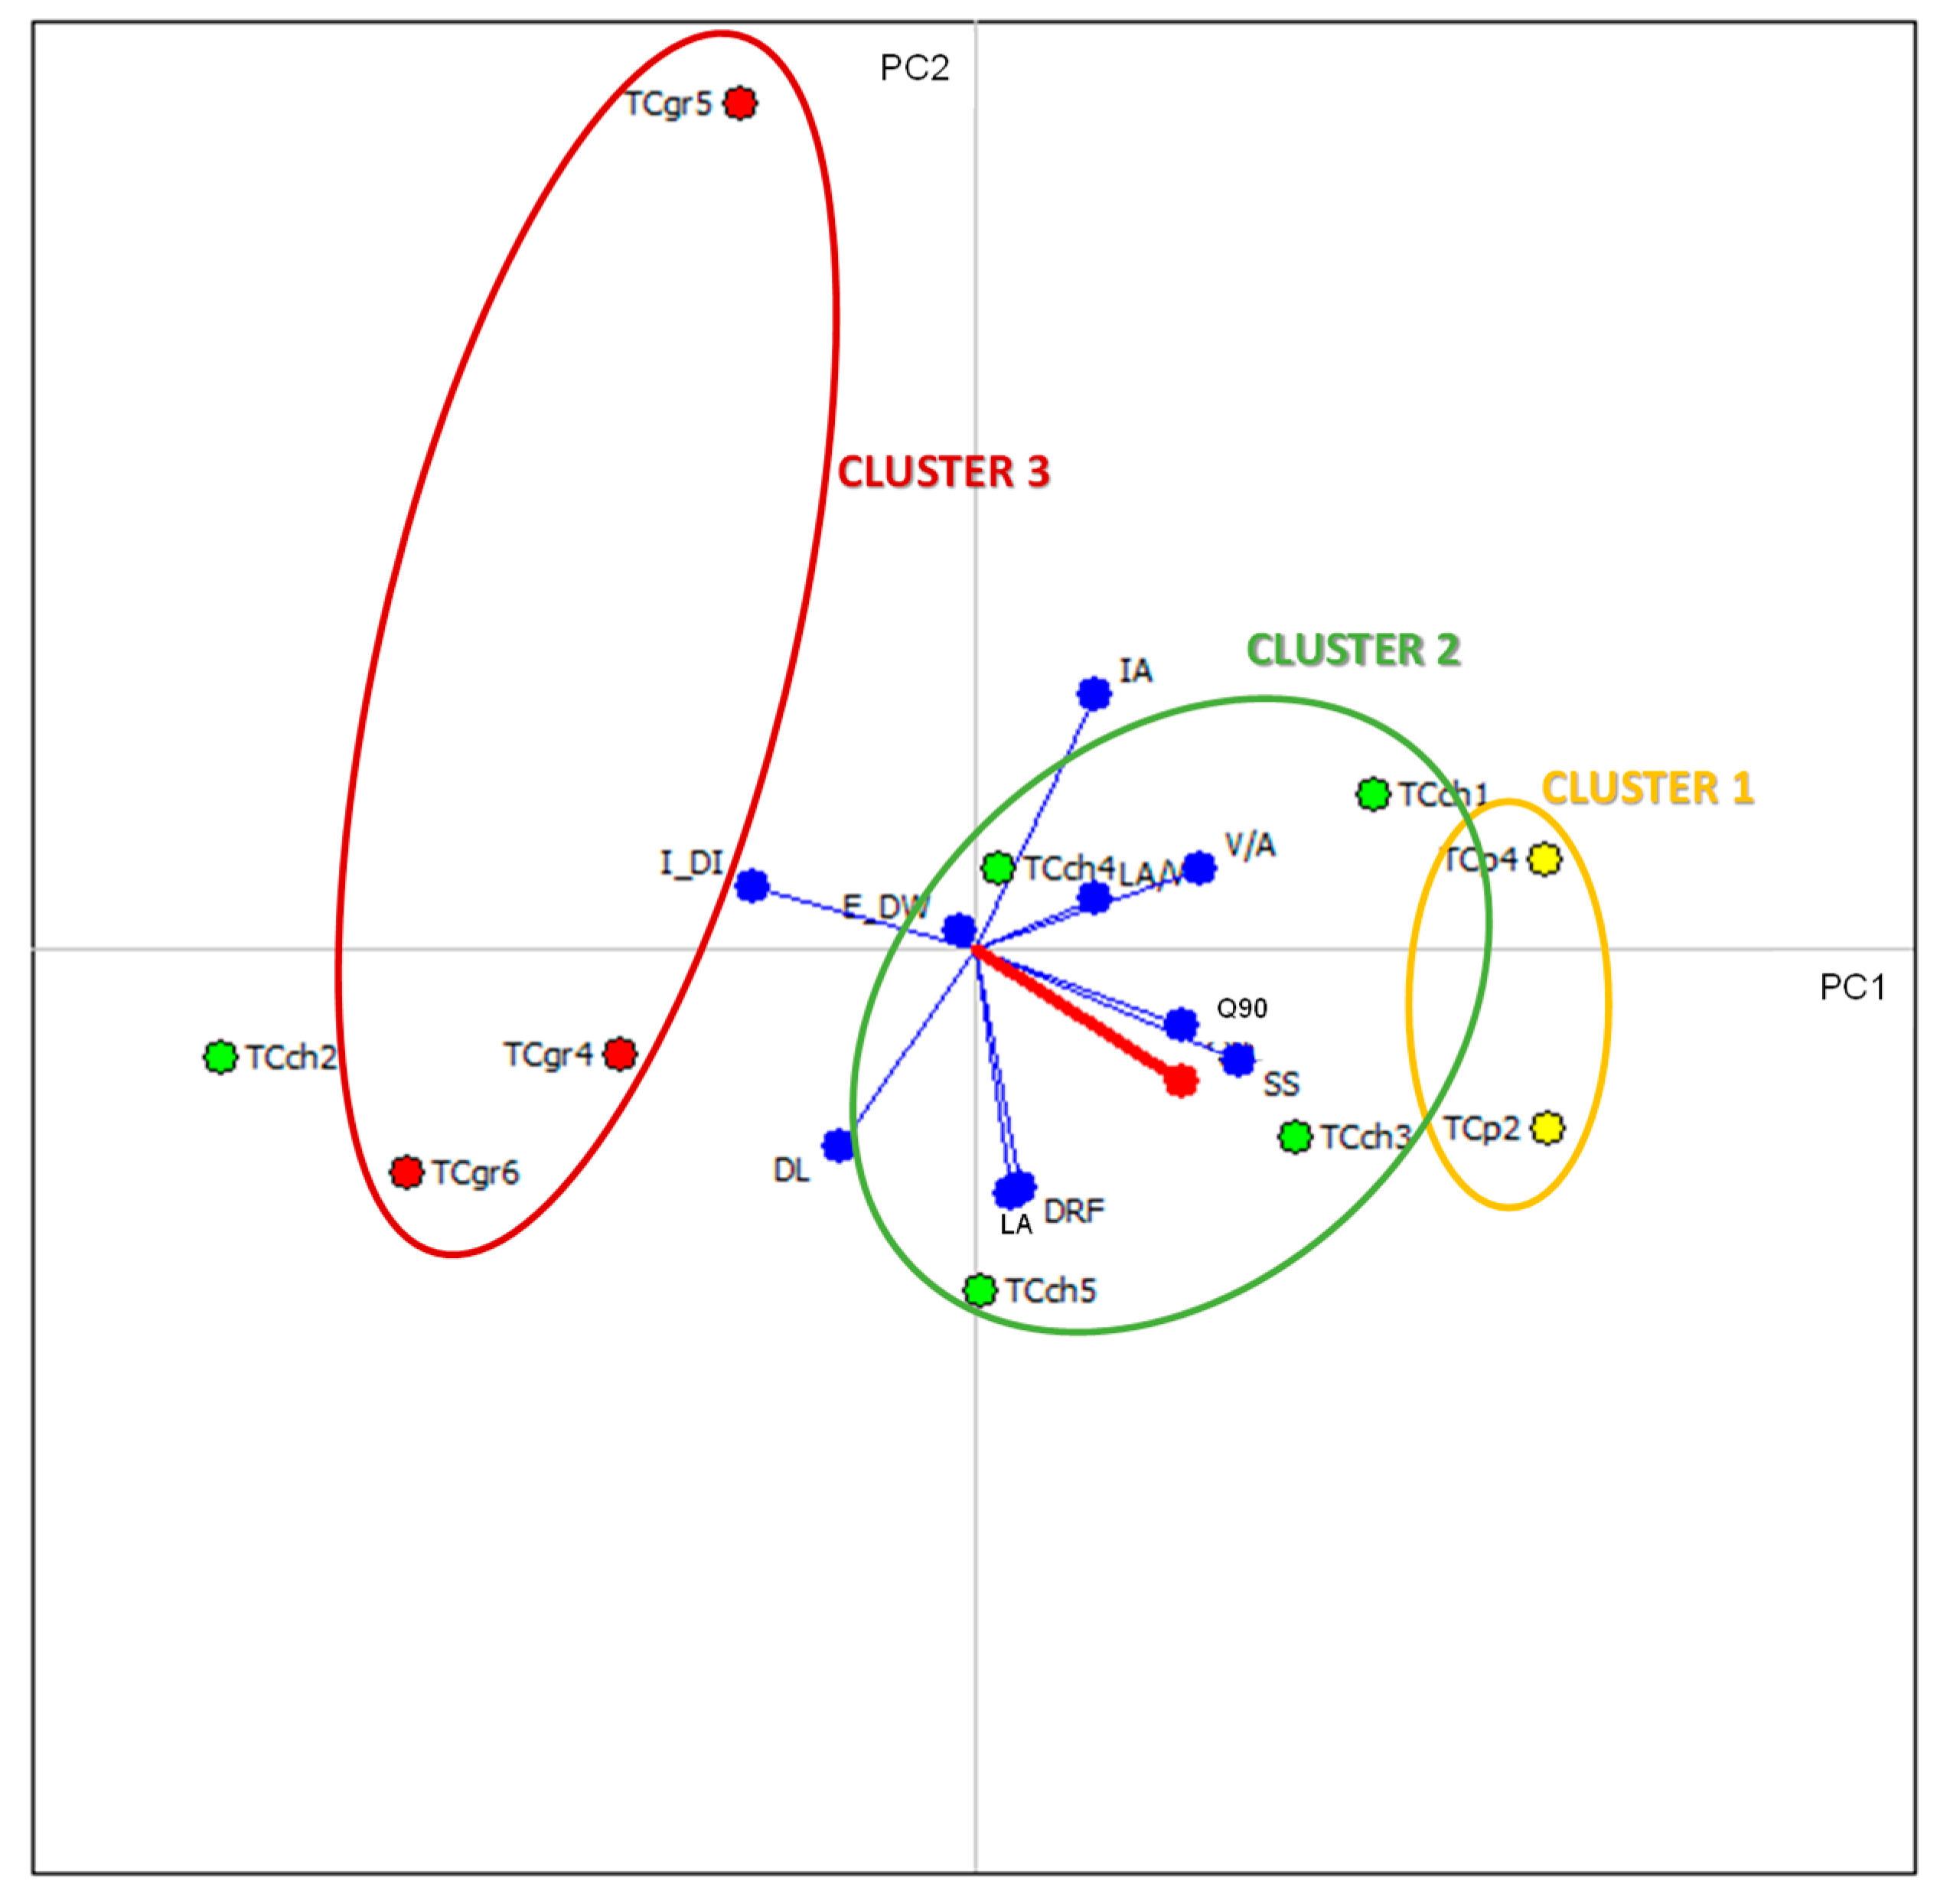
Seventy-nine percent of the total variance of the data matrix was accounted for the GAIA analysis, which indicates that more than three-quarters of the available information was included in the GAIA analysis (
Figure 10). The scores plot summarizes the similarities of the objects and their behavior in the two components. In
Figure 10, except for TCch2, three clusters can be identified. They include the possible sites of the three main channels selected for water allocations (TCp, TCch, and TCgr). TCch2 represents an atypical reservoir since the biggest basin area and one of the smallest stored water volumes characterize it; therefore, it is not an efficient reservoir from the irrigation point of view.
The loadings plot analyzes the role of all the variables in the two PCs chosen, their correlations, and their importance in the system. In the loadings plot represented in
Figure 10, most of the criteria are characterized by vectors with similar length, e.g., with similar importance.
E_DW is the least significant factor, considering its length. This outcome is confirmed from the fact that dams are never located in the mainstream of the Cuareim/Quaraí river; therefore, the construction of a possible reservoir on the mainstream can only slightly affect them. It is worth noting that GAIA incorporates a decision axis (
pi), represented with a thick red vector in
Figure 10. When
pi is long, the most preferred objects are oriented in its direction and furthest from the point of interception of PC1 and PC2 axes. In our case,
I_DI, SS, and
Q90 are the criteria with major influence. These three variables alone cover the factors (a), (b), (c), (d), and (f) of the UN Watercourses Convention, which represent the factors covered by the entire Phase 3 of the proposed scenario-based framework (
Table 4). This information has particular importance for data-scarce transboundary-basins, where it is not possible to compute the ten criteria previously selected. In those cases, the primary objective of this work can still be accomplished. This makes our new scenario-based approach universally-accepted.
PROMETHEE was used to rank the possible sites based on the ten selected criteria. The user is required by the PROMETHEE method to maximize or minimize each criterion, e.g., declaring whether the higher values of a variable (maximized) or the lower one (minimized) are preferred. In this study,
DL, LA, SS, DRF, LA/V, I_DI, and
Q90 were minimized, while the remaining factors (
IA and
V/A) were maximized, and the same weight was assigned to all of them so that no variable was favored over the other. The preference function chosen for all the variables was the linear function. Taking into account GAIA outcomes,
E_DW was excluded from PROMETHEE analysis. In
Table 7, the results of PROMETHEE I and PROMETHEE II are summarized.
The PROMETHEE outcome not only confirms the three clusters previously identified with GAIA, but also shows the intersection between Cluster 1 (yellow dots in PROMETHEE) and Cluster 2 (green dots in PROMETHEE) in the water allocation ranking. TCch sites can be among the best and the least equitable and reasonable reservoir locations. The more downstream the site is located, the least suitable for water storage it is. TCch1, TCch3, in particular, and TCp group are the best places for possible future reservoir construction, taking into account the ten selected socio-economic and environmental criteria. Whereas the group TCgr represents the most detrimental place. This rank confirmed the atypical behavior of TCch2. In fact, as mentioned above, it is characterized by the biggest basin area and one of the smallest stored water volume. Therefore, it is not an efficient reservoir from the irrigation point of view. It is noteworthy that the difference between TCch2 and TCgr5 (last two rankings) is very few. Therefore, based on each specific case study, a particular best and least allocation strategy can be chosen by decision makers.
3.3. WISA
In the context of the bi-national (Uruguay/Brazil) meeting in 2016, a water-sharing conflict arose [
16]. The issue referred to decreases in the water volume for irrigation by Brazilian farmers downstream due to the increase in the irrigation water supply for Uruguayan farmers provided by reservoirs construction. With the aim at resolving this conflict, two scenarios were defined to analyze the selection of the best location strategy in terms of the socio-economic and environmental factors considered in this study, and quantify the benefits of this choice. In
Table 8, a description of the two scenarios is reported.
Scenario 0 represents the current water-management situation in the Cuareim/Quaraì watershed. This scenario was used as the baseline condition. Based on the outcomes obtained from the MCDA, Scenario 1 considers the implementation of a reservoir in TCch1, that represents the most equitable and reasonable reservoir site. These two scenarios were implemented in a GIS environment and run with SiGBaH-Irriga for the period 1991–2015 (15 years). To analyze the real water-sharing conflict raised during the bi-national meeting in 2016 [
16], in
Table 9, the efficiency of all the direct intakes located downstream the new reservoir located in TCch1 is reported. The values are ordered on the basis of the water intake position (from upstream to downstream). The efficiency reduction obtained with S1 is also calculated (column S0–S1 in
Table 9).
It is noteworthy that the efficiency of the three water intakes (71, 72, and 73) located immediately downstream, the reservoir located in TCch1 is increased after the reservoir installation. This is justified from the fact that an environmental flow equal to 0.047 m3/s is considered all year long. Therefore, in this way, a minimum amount of flow is guaranteed even during the hot and dry seasons. Furthermore, the maximum efficiency reduction is equal to 0.33% for Brazilian water intake (#31). This means that in 15 years (the entire simulation periods), the farmer #31 (considering a single water intake associated to a single or a small group of farmers) lost 0.33 ha of harvested area. It is possible to state that 1 ha of rice allows a net income of approximately US$ 1100 considering the amount or rice cultivated in 1 ha, the cost for packaging the rice, and the cost to produce 1 ha of rice harvested in the basin. Based on this, the farmer #31 lost approximately US$ 360 per planted hectare in 15 years.
Thus, with this methodology, we were able to satisfy the need of Uruguayan farmers of having more water sources during the dry season without critically compromising the efficiency of the existing water resources of the Brazilian farmers. This new approach, not only considered socio-economical aspects, but also took into account the environmental ones by guaranteeing a constant environmental flow all year long. The Cuareim/Quaraí watershed case study was used as an application of the scenario-based framework proposed in this work, confirming that this new approach is very flexible and can be applied to any transboundary watershed to resolve water-sharing issues among riparian countries for reasonable and equitable water allocation.

 ,
, 


