Article

Evaluating the Functioning Mechanisms of ‘TANK Systems’ in Peri-Urban Areas of Chennai, India—Land Use Change as the Determinant

by
Rukkumany R. Harishankar
* and
Ranee Vedamuthu
Department of Architecture, School of Architecture and Planning, Anna University, Chennai600085, India
*
Author to whom correspondence should be addressed.
Water 2019, 11(6), 1219; https://doi.org/10.3390/w11061219
Submission received: 27 May 2019 / Revised: 6 June 2019 / Accepted: 9 June 2019 / Published: 11 June 2019
(This article belongs to the Section Water Resources Management, Policy and Governance)

Abstract

:
Ensuring the sustenance of water resources that act as sources of water for cities threatened by urbanization and developmental pressures is a crucial problem in peri-urban areas. The objective of this research was to establish the role of change in agricultural land use as a determinant in the evaluation of the existing water management system and to ascertain whether the control by the government or community management can be effective in ensuring the sustenance of water resources in peri-urban areas. The cases selected for the study were the water management systems present in two villages located in the peri-urban areas of Chennai, India. This research adopted a case study strategy with mixed methods of analyses. The analysis traces trajectories of change in the land use of agricultural lands and the common lands related to water management through methods, trend analysis, analysis of spatial patterns of change and the changes in the components of the community management. Results from the analysis indicated that under the context of intensive change from agricultural to nonagricultural land uses, the interlinkages within the traditional community management model had broken up, making community control improbable. The current management model of the government was also found to be inadequate. Results indicated that government agencies with trained personnel engaged in periodic maintenance activities, constant monitoring against encroachment, and pollution, and through the formation of user associations under their control can ensure the sustenance of water resources.

1. Introduction

Across the world, cities are stressed for water [1] and depend on the water resources within peri-urban areas [2]. The sustenance of these water resources is an important concern for the welfare of the increasing urban population [3]. Existing water management systems in peri-urban areas have to contend with changes in their contexts due to developmental pressures, significantly fuelling the conflict over the land and water resources between rural and urban areas. A significant manifestation of this conflict is the change in the land use from agricultural (rural) to nonagricultural (urban) land uses [4]. This change in the land use from agriculture to nonagricultural land uses is an important factor as agriculture usually was the major consumer of water in most peri-urban areas and the management of water resources was organized around this requirement [3]. The selection of the management model that can ensure the sustenance of water resources, therefore, needs to take into cognition the situational reality of these systems [5,6], especially under changed conditions as encountered in peri-urban areas [7]. The problem of selecting an appropriate management model for sustaining water resources is complicated due to the dynamic nature of changes in the peri-urban areas, as peri-urban areas tend to be a mix of urban and rural, whereas institutions and management systems tend to be organized based on rural and urban administrative boundaries [8]. Water management in complex situations such as these needs alternative strategies. However, it is difficult to decide which of these strategies will be the most effective [9]. Governance approaches for resource management systems that have existed over a long time have to be selected based on the context in which they are placed [10]. Understanding the relationship between the land use change of agricultural lands to nonagricultural land uses and related changes in the water resources management is the first step in evaluating the effectiveness of a water management system and proposing an appropriate water management system.
Various forms of water management system in India had sustained the supply of water to the people since ancient times [11]. In the state of Tamilnadu, located in the southern part of India, the most prevalent system of water management is connected to ‘Tanks’ or reservoirs. Here, tank refers to water storage reservoirs of an area of a few hundred square meters to thousands of square meters. The term tank comes from the Portuguese ‘Tanque’ or the Latin ‘Stagnum’ [12]. The water management systems are called ‘tanks systems’ [13,14,15] or ‘tank irrigation systems’ [16] based on their prominent feature, the tanks. Like many traditional water management systems of India, the tank systems have also declined and their components are in damaged condition [14,17,18].
The traditional tank system was a complex and interdependent system managed by the community [18,19]. The basis of this interdependency was the interrelationships within the system through benefits acquired by the people related to the existence of agricultural activity, especially paddy cultivation [12,16,18] (Figure 1). The decline of the tank systems was attributed to various factors in the past related to the transfer from community control to state control [5,14,17,18,20,21] and to the lack in their maintenance and protection by these government agencies that control these water resources [14,22,23]. The present management of the components of this interconnected system is by multiple government agencies [22] (Figure 2), supported in some cases by user associations that partially control and maintain some of the components of the system. To arrest the decline, the government had enacted laws and established organizations to protect the water resources [15,24,25]. The Tamilnadu state government law, ‘Protection of Tanks and Eviction of Encroachment Act, 2007’ (Act 8 of TN G.O.dt.22.05.2007), prohibits the conversion of common lands related to water storage, conveyance and foreshore areas for any other developmental purposes. The state government had also set up a nodal agency WRO-Water Resources Organization under the P.W.D.—Public Works Department for protection and management of water resources. Two agencies of the government play a salient role in the management of the components of the tank systems. The P.W.D.—Public Works Department is a centralized state department with finances and trained personnel to maintain the tanks and its components. This agency, however, has under its control only tanks of water storage area more than 40 acres (16 hectares). Tanks with lesser water storage area and their components come under the control of the Panchayat—the village administrative council. This agency, in general, lacks funds and do not have enough trained personnel to maintain the tanks and related components [15,16,23]. In spite of these measures, urbanization is known to have caused damage to the tank systems [2,14,26].
The technology of the water management is a function related to ‘agroclimatic and agrarian contexts’ [27] and agriculture also plays an important role in the social dynamics of the tank systems [12,28,29,30]. Mizushima (1966) [20] and Yanagisawa (2008) [31] traced the connection between the changes in the water management systems and the change in land ownership and administration during the colonial period and after. Studies by Janakarajan et al. (2007) [2], Rodrigo (2004) [26], and Datchayani et.al (2013) [32] further explored this connection between the change in the land use in peri-urban areas and their impact on the changes in the social dynamics of water resources management. However, very few studies have analyzed the relationship between agricultural land use change and the changes in the functioning mechanisms of the tank systems. The aim of this research was to explore this relationship between change in the land use of agricultural lands to nonagricultural land uses and the change in the functioning mechanisms of the tank systems.
This research started with the proposition that change in the land use of agricultural lands to nonagricultural land uses is an important determinant in the success or failure of the water management system. To establish the role of land use change as a determinant, this research undertook two lines of enquiry:
  • The first line of enquiry was related to the existence of the components and interrelationships of the community management system under the context of change in agricultural land use. This line of enquiry was conducted to evaluate the possibility of reviving community management.
  • The second line of the enquiry was related to the current management system. This line of enquiry was conducted to evaluate the effectiveness of the current management system by the government.

2. Materials and Methods

2.1. Study Area

The research undertook a case study of tank systems located within two villages in the peri-urban areas of Chennai city, located in the southern part of India. Chennai is a metropolitan city with chronic water problems. Chennai, like many tropical cities, has the dual problems of flooding [33] as well as water scarcity [34], both due to poor water management. The city depends on its peri-urban areas for water and these peri-urban water resources are deteriorating [2,26,35]. The cases selected are located partly inside and just outside the boundary of the Chennai Metropolitan Area [36] (see Figure 3). One such case is described as follows; a village with significant land use change in the agricultural land to other land uses such as institutional and industrial whereas the other case is a village with a less intensive change in the agricultural lands, i.e., agricultural lands have been converted to sites for residences but they remain as vacant plots of lands (Table 1).

2.2. Data Sources

The components and interrelationships of the tank systems were identified and the model of the tank systems was formulated based on the review of literature on the tank systems, reconnaissance survey, and an open unstructured interview conducted with the administrative personnel and experts about the tank systems. The current status of the components of the community management model was ascertained through a survey of the tank and its components conducted by the researcher in addition to structured interviews conducted with the administrative personnel of the village. The instruments used for the survey and the structured interview (Appendix A) were developed based on the reconnaissance survey and open interviews conducted in the study area, prior to the survey. The interview was conducted with all the administrative officials that control and maintain the tank systems at the village level in both the cases. These consisted of the village administrative officers, the panchayat head, and the assistant engineer in charge of the tanks, in the case of the tanks under the control of P.W.D. Four sets of land use data for the period of 30 years from 1986 to 2016, each representing one decade was created from primary data consisting of revenue, survey, settlement records, and cadastral maps of the two case villages to create the base land use data for analysis. The source for the data were the following departments of the Tamilnadu state government; survey and settlement for the cadastral maps and the record department of the Taluk office for the land use data of the two villages for the four years, one in each decade. The base year 1986 was selected by checking the data from 2016 and going back one decade at a time, till the land use was completely agricultural in case 2 and more than 90% of the agricultural land remained unconverted in case 1.

2.3. Data Processing

The data of the site survey and structured interview with the officials were aggregated and entered as spreadsheets in excel (Appendix E). The status of the tank systems was computed based on the score of the components for each tank: encroachment of water storage area, status of the channel network connected to the tank, condition of the bund with its vegetation, existence and nature of foreshore vegetation including common grazing land, usage of the tank water, usage of the tank and its environs for social and recreational purposes, and extraction of products from the tank and its environs (Appendix B). These scores were then totalled and used for the comparison of the status of tanks and land use change.
GIS has been used for the processing of spatial data and also to link land use data with the spatial data. CAD data was accessed in a GIS environment and then georeferenced. Subsequent to editing errors, aspatial data was joined with spatial data using the union command. Cadastral maps prepared by the department of survey and settlement; the government of Tamilnadu formed the basis for the land use maps. Hard copies of the village maps split into 2 or 4 sheets obtained from this agency were scanned and subsequent to understanding the issues with the maps obtained, such as variation in scales ranging from 1:5000 to 1:10,000, and with due consideration of the flexibility of the software it was decided to use Auto-CAD software for generating digital data.
For creating the spatial land use map of the village, each and every land parcel was assigned with a unique number and survey number as per the hard copy of the map and in par with spreadsheet generated from the land use register for both the cases. The primary unit of data selected for the analysis was taken as a ‘plot’ with a distinct survey number, following the method by Ramesh et al. (2011) [37], Du xingdong et al. (2014) [35,38], and Ainiwaer et al. (2019) [39] by aggregating the subdivisions of the plot, as many of the plots in the original survey have been further subdivided into 100–200 subdivisions in the subsequent decades. The land use data for each plot from the revenue records were similarly arrived by aggregating the land use of all the subdivisions. In the case of the common lands when they were part of a plot, they were given a unique survey ID.
The land use data were aggregated into a land use classification system following the classification for agricultural lands followed by the Department of Revenue, Government of Tamilnadu, and the land use classification to be used for urban area as per the regulations derived by the department of ‘Town and Country Planning’ of the Government of Tamilnadu [40] (see Table 2).
Out of the 18 types of common lands found in these two villages, only 10 pertaining to the water management were taken for analysis and aggregated into three classifications based on their function, water storage area, water conveyance areas, and protective area.

2.4. Analysis Methods

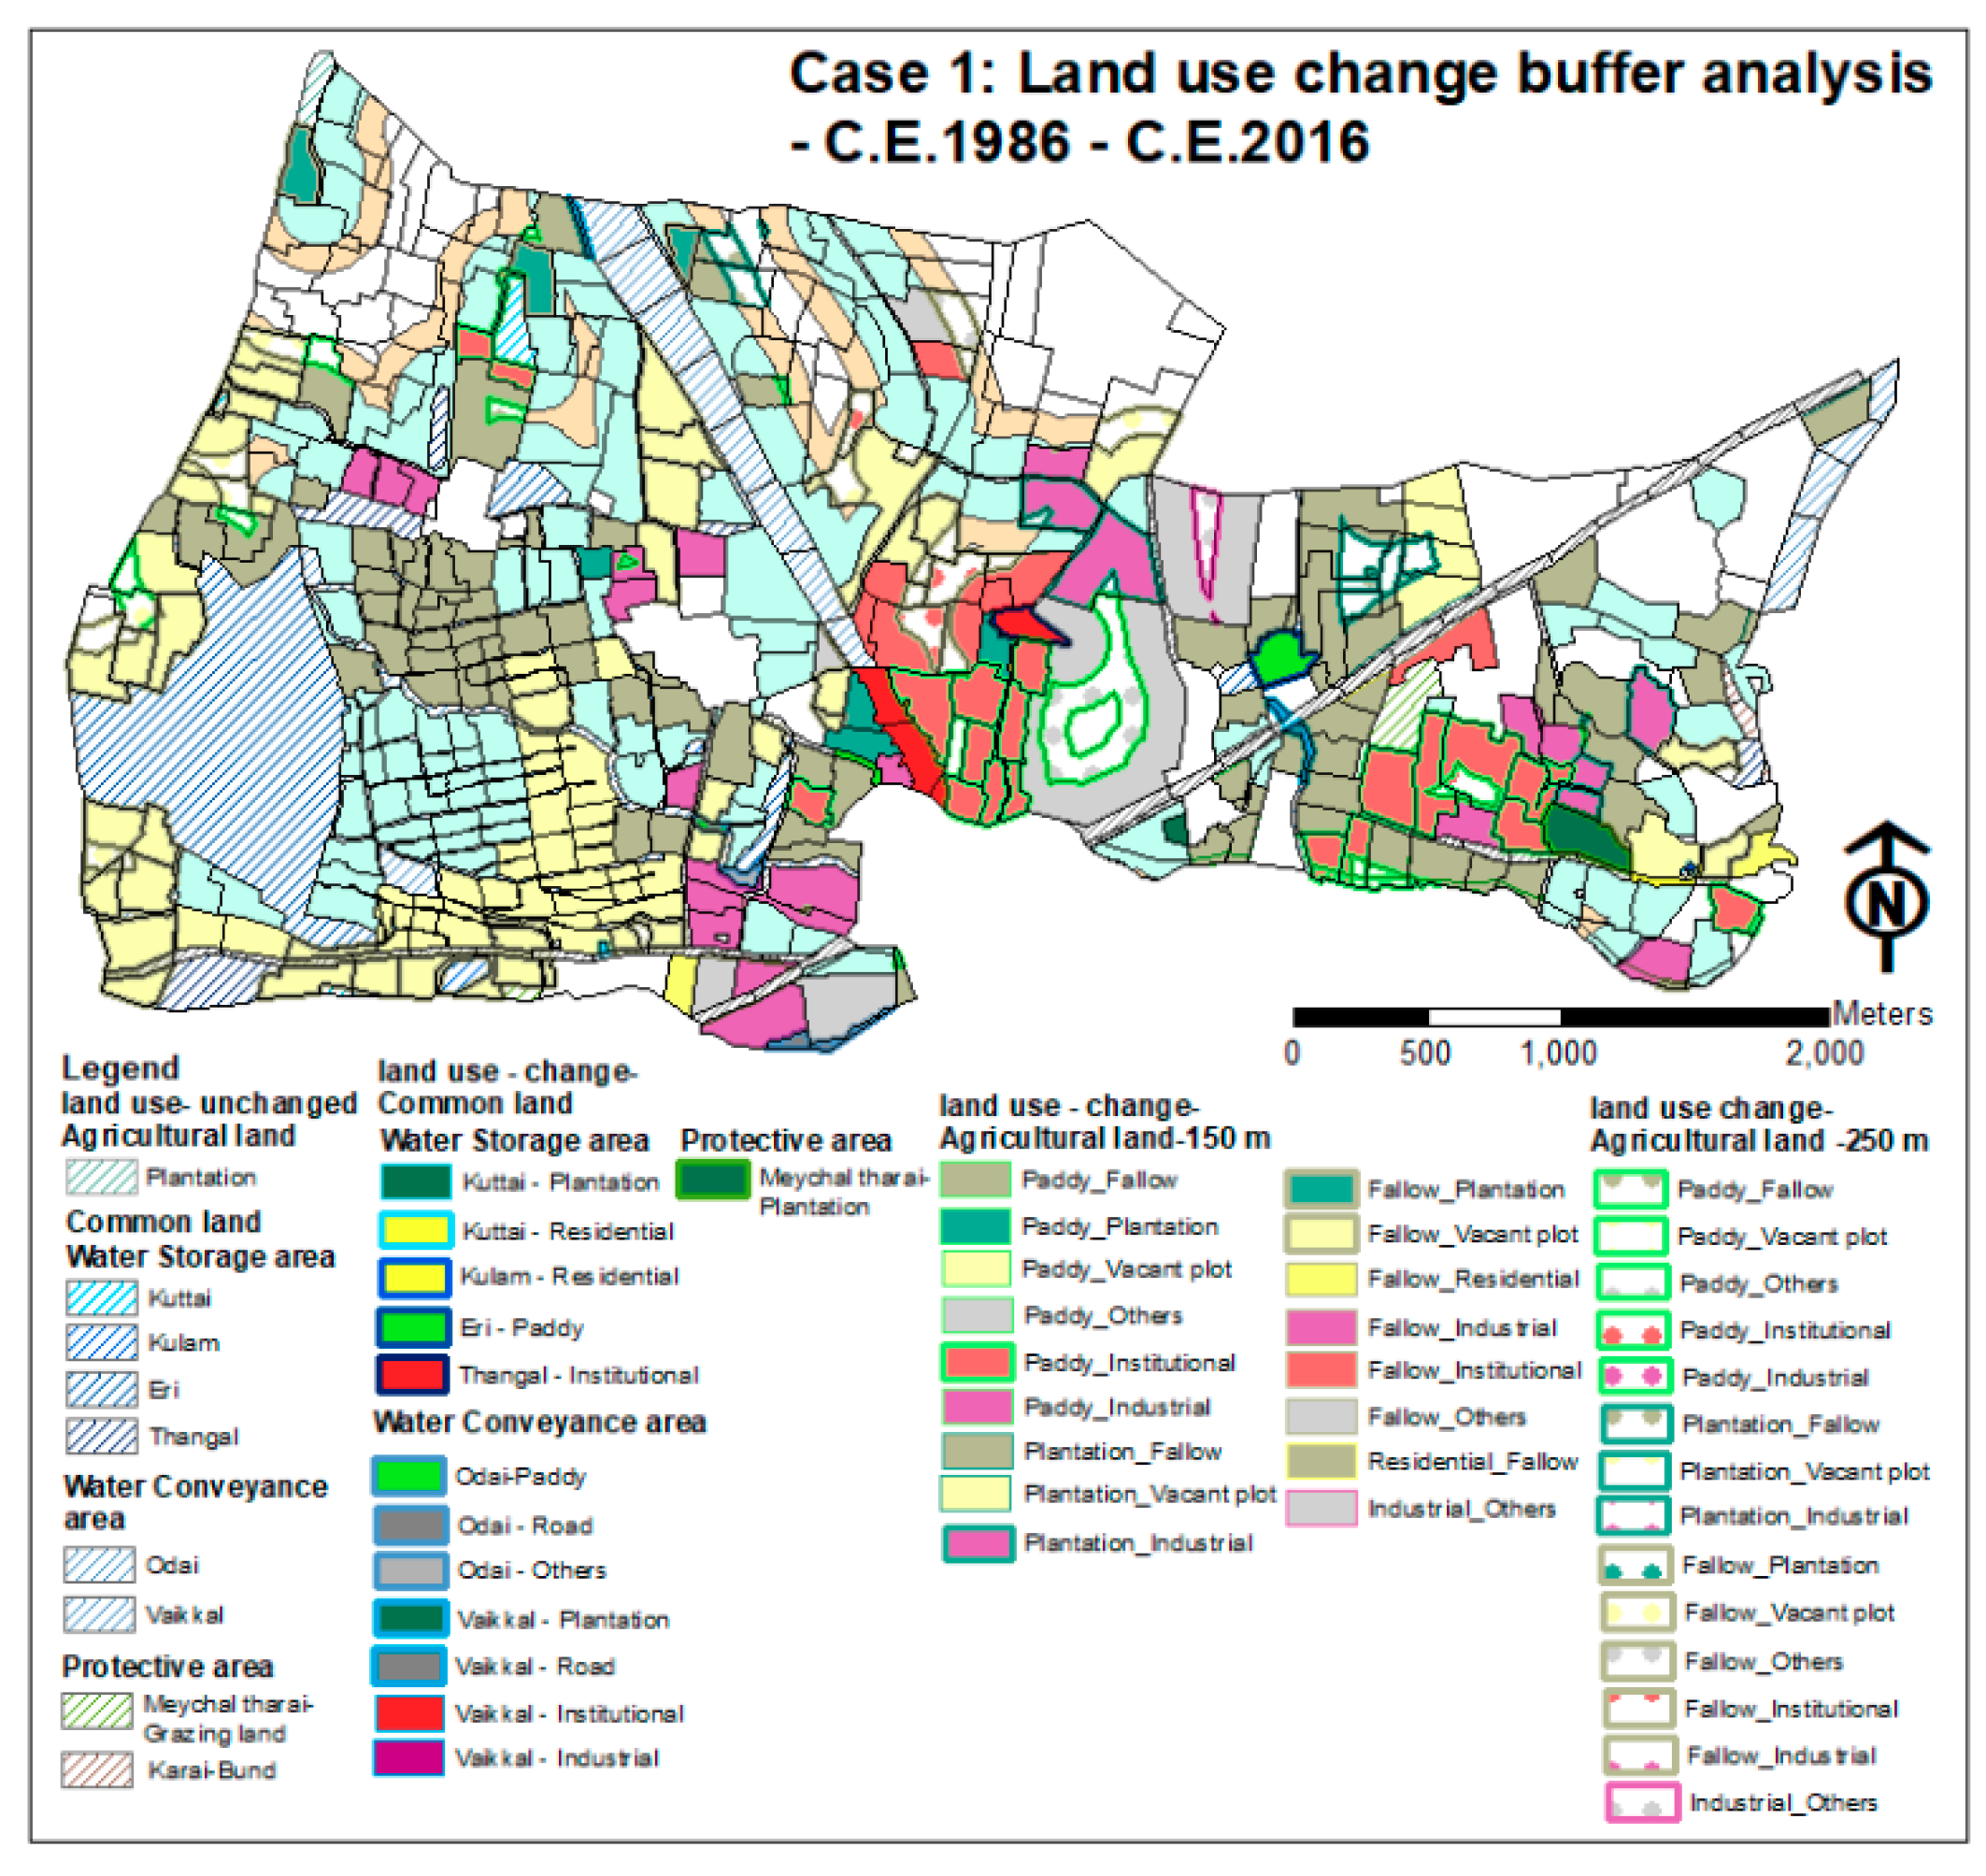
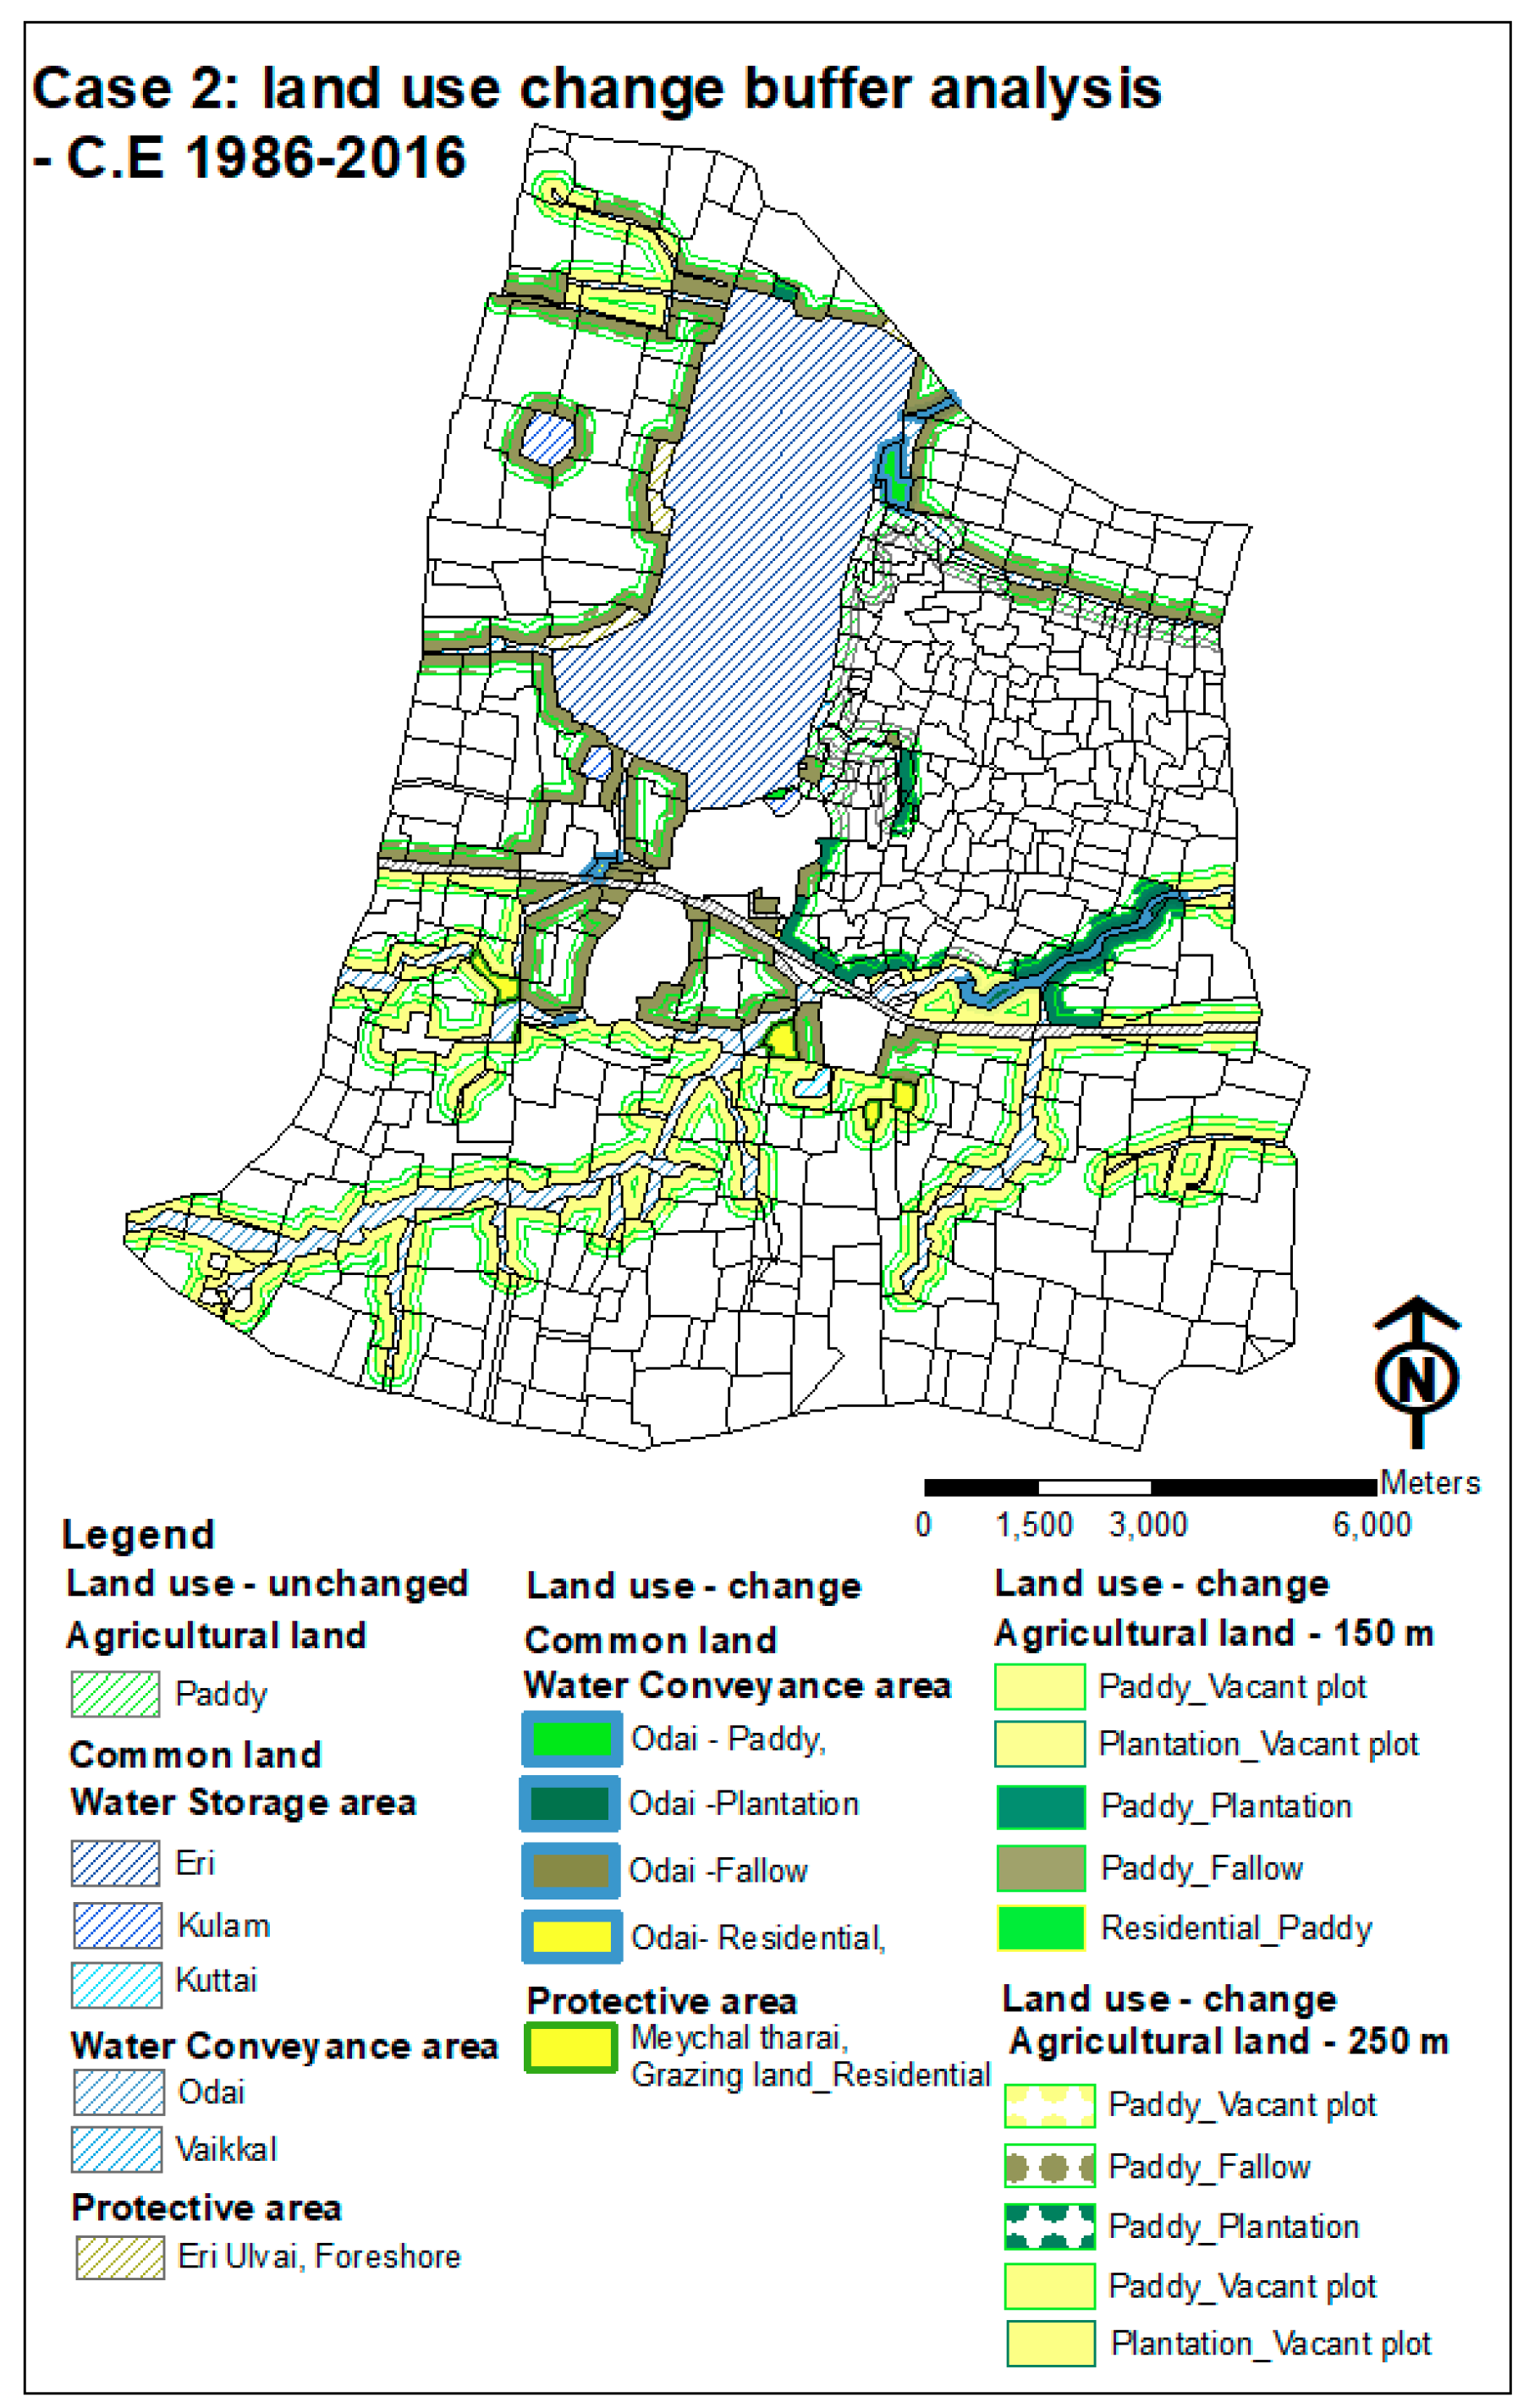
This research has adopted a mix of quantitative and qualitative methods for analysis. The method trend analysis is adopted to bring out the underlying pattern of land use change over time as trend analysis facilitates the extraction of patterns from a time series data [41]. To evaluate the effectiveness of the current government model of the water management system, correlation analysis was used to analyze the relationship between the change in agricultural lands and the change in common lands related to water management [42] (Figure 4). As one of the major measures taken by the government for the protection of the water resources is legislation preventing the land use conversion of common lands related to water management, the illegal conversion of land use of common lands to other land uses was deemed as encroachment, and was taken as the major factor for the analysis. For the identification of themes and patterns [43] (Figure 4), the analysis of trajectories of change in common lands related to the water management system, with reference to changes in agricultural lands, was adopted. The method is as follows.
  • Compare the land use map of 2016 with 1986.
  • Apply buffer analysis in GIS using ARC map buffer tool for a distance of 150 and 250 meters.
  • Identify the number of plots of common land plots (related to water storage, conveyance, and protective areas) changed into other land uses.
  • Trace for the changed common land plots, the change in the land use of the surrounding plots and the common land plot in the previous sets of data (1986 (base year data), (1986–1996) and (1996–2006).
  • Identify the trajectories of change.
To ascertain the existence of the components and the functioning mechanisms of the community management model under the context of change in agricultural land use, a scoring system was followed. The data of the site survey and structured interview with the officials were aggregated and became the basis for the score of the following components for each tank; encroachment of water storage area, status of the channel network connected to the tank, condition of the bund with its vegetation, existence and nature of foreshore vegetation including common grazing land, usage of the tank water, usage of the tank and its environs for social and recreational purposes, and extraction of products from the tank and its environs (Appendix E). These scores were then totaled and the total score of the tank was compared with change in agricultural land use. The presence of the social institutions and the nature and extent of their activities in the village was ascertained through structured interviews with personnel in charge of the tanks. However, there was no presence of social institutions in case 1 and only an informal association of wetland owners having very limited activities was found existing in case 2. Therefore, this aspect was not considered for the scoring of the tanks and for the analysis.

3. Results

3.1. Trends of Land Use Change

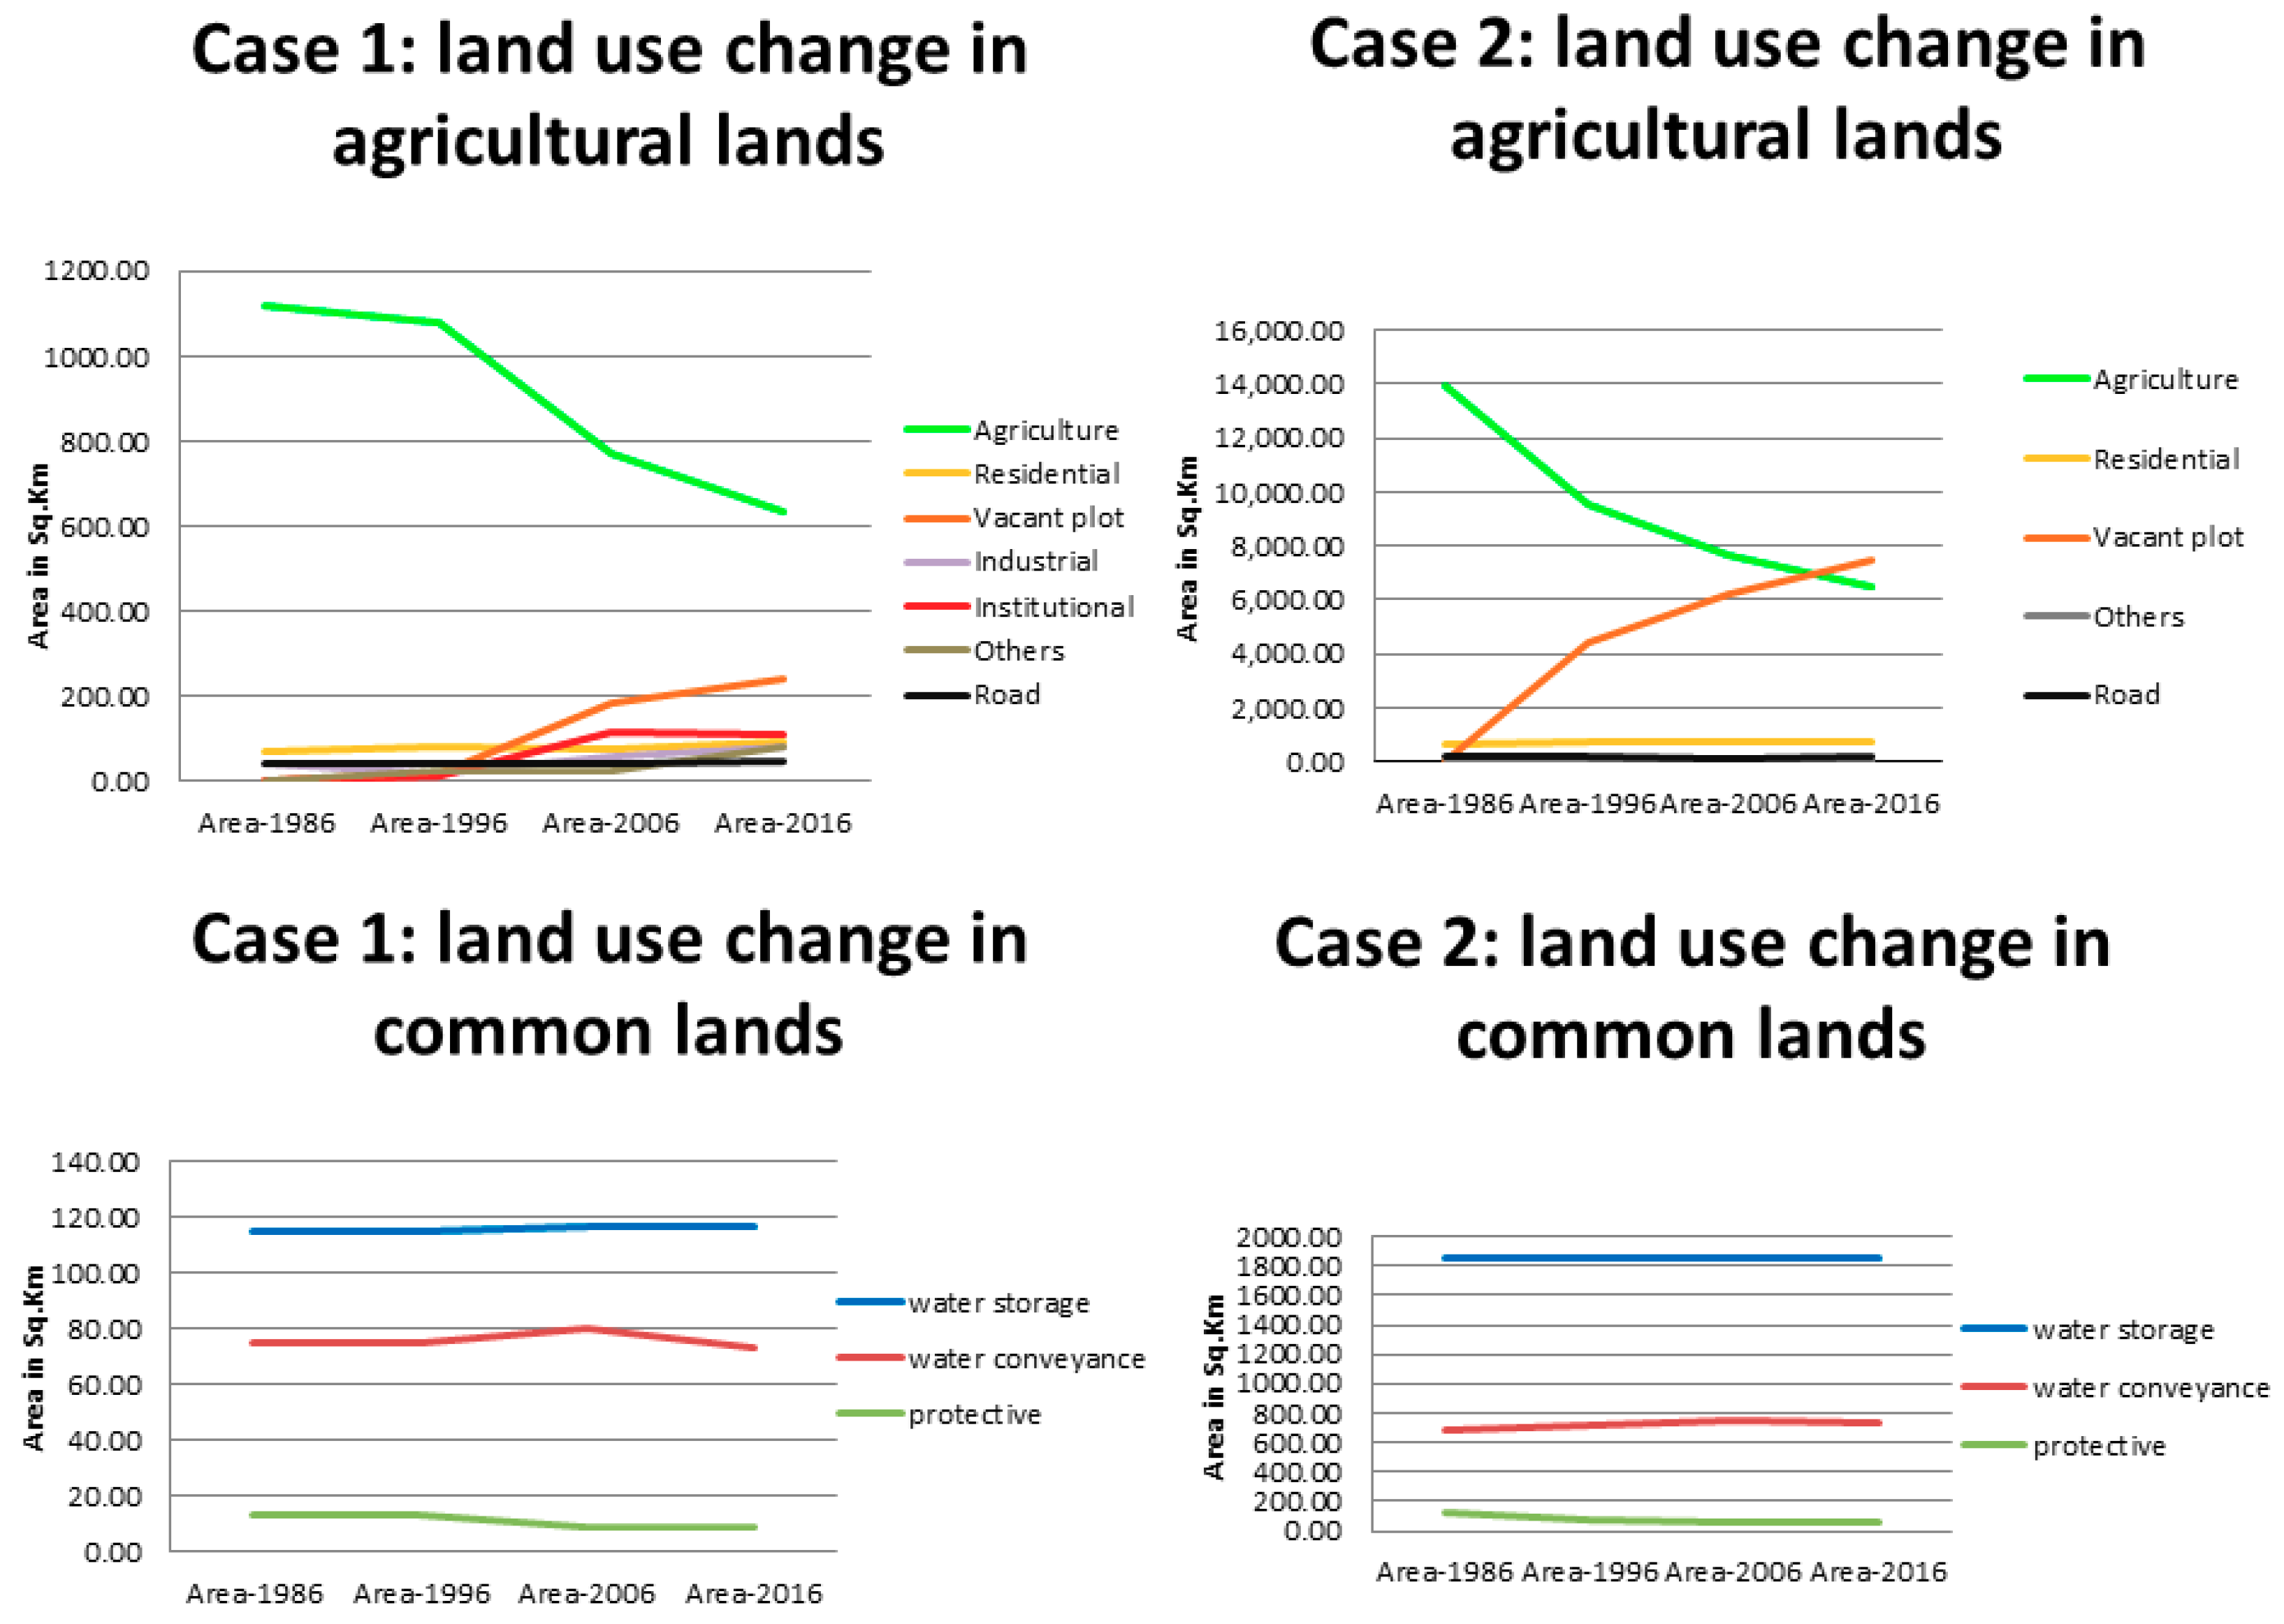
Agricultural lands: In both cases, the area under paddy cultivation had a consistent decreasing trend. The land under plantation also had a decreasing trend in case 1, whereas it had a marginal increasing trend in case 2. In case 1, the land area under fallow decreased initially, increased in between and finally decreased. In case 2, the land areas under fallow had an increasing trend (Figure 4 and Figure 5). In case 1, all land uses other than paddy, plantation, and fallow exhibited an increasing trend which clearly showed the presence of developmental pressures and the progression of the case 1 from rural to urban. In case 2, among the nonagricultural land uses, the category ‘vacant plot’ was only present and had an increasing trend indicating that though the intensity of development pressures is low during the period of study, this may change in the future. The absence of land uses for other purposes such as industrial and institutional indicated that this village has remained predominantly rural during the period of study.
Water resources: In both cases, the water storage area is fairly constant throughout the study period without any noticeable change (Figure 5 and Figure 6). The water conveyance areas and the protective areas showed a declining trend. In case 1, the water conveyance areas showed a notable decline, whereas in case 2, the decline was minor. In both cases, the protective areas had a declining trend, attributed to the significant increase in the conversion of common grazing land to other purposes as the other protective areas such as bund and foreshore remained fairly constant.

3.2. Relationship between Change in Agricultural Land Use and Change in the Land Use of Common Lands

3.2.1. Correlation

A strong positive correlation was observed only in case 1 between the changes in land under the category of protective areas and the total agricultural land, as well as for all the two subtypes—paddy and fallow—under the agricultural land use (Table 3). This encroachment or illegal conversion of the land use of common land meant to act as protective areas for the tanks such as bund and foreshore to other land uses shows the disconnect between the people and the tank system at present. This encroachment is primarily in the community grazing land, as these were not specifically protected by the law and therefore were more vulnerable. A strong negative correlation was observed between the change in the area of lands under the category water storage areas in cases 1 and 2; as the area has not changed, the correlation could not be calculated. In the case of water conveyance areas too, there was a predominant negative correlation. This could be because the tanks and connected channels under P.W.D (Public Works Department) (See Figure 2) control and maintenance have remained free from encroachment and the total area of these was significantly more than the tanks under panchayat control, which have been encroached.

3.2.2. Spatial Pattern of Change

The analysis of the spatial location of common lands in which land use conversion has taken place showed that a strong relationship between the change in the agricultural lands and the changes in the water resources, as all the changed common land plots, are located within zones of agricultural land use change (Figure 7 and Figure 8). The instances where there were changes (19 out of 26 instances) in land use of the common lands; they were surrounded by agricultural lands which have changed from paddy cultivation to other land uses.

3.2.3. Trajectories of Change

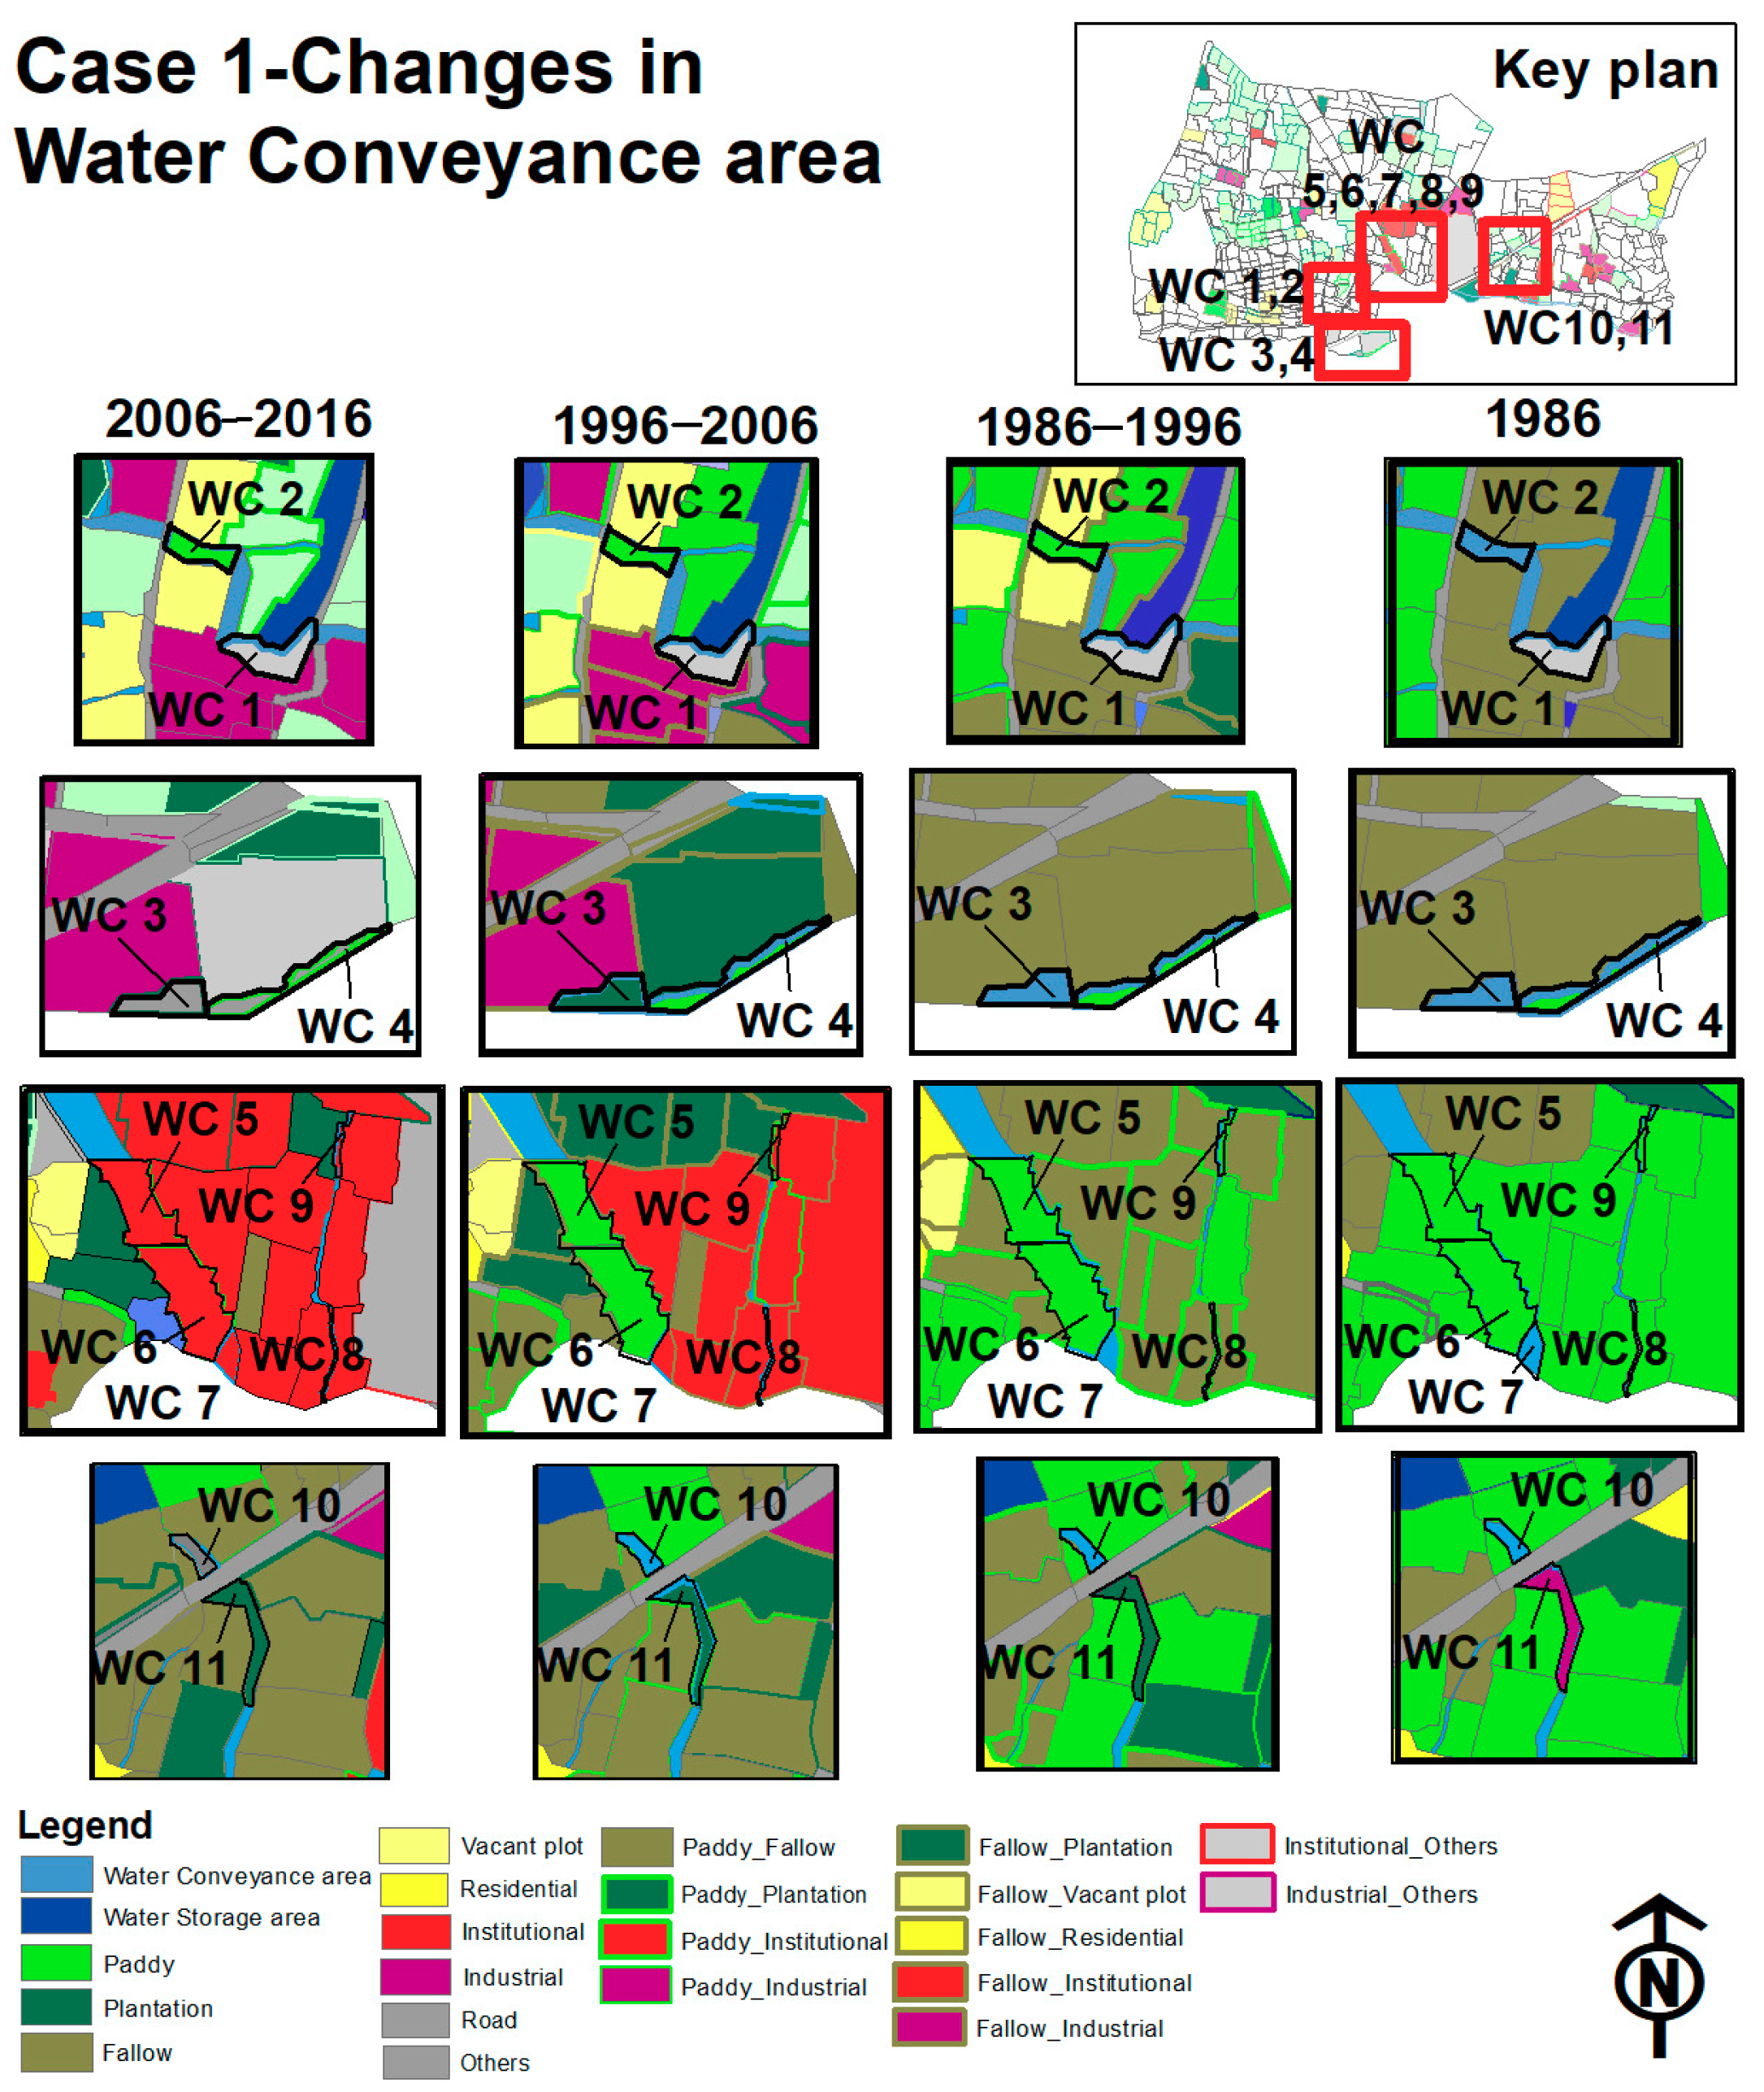
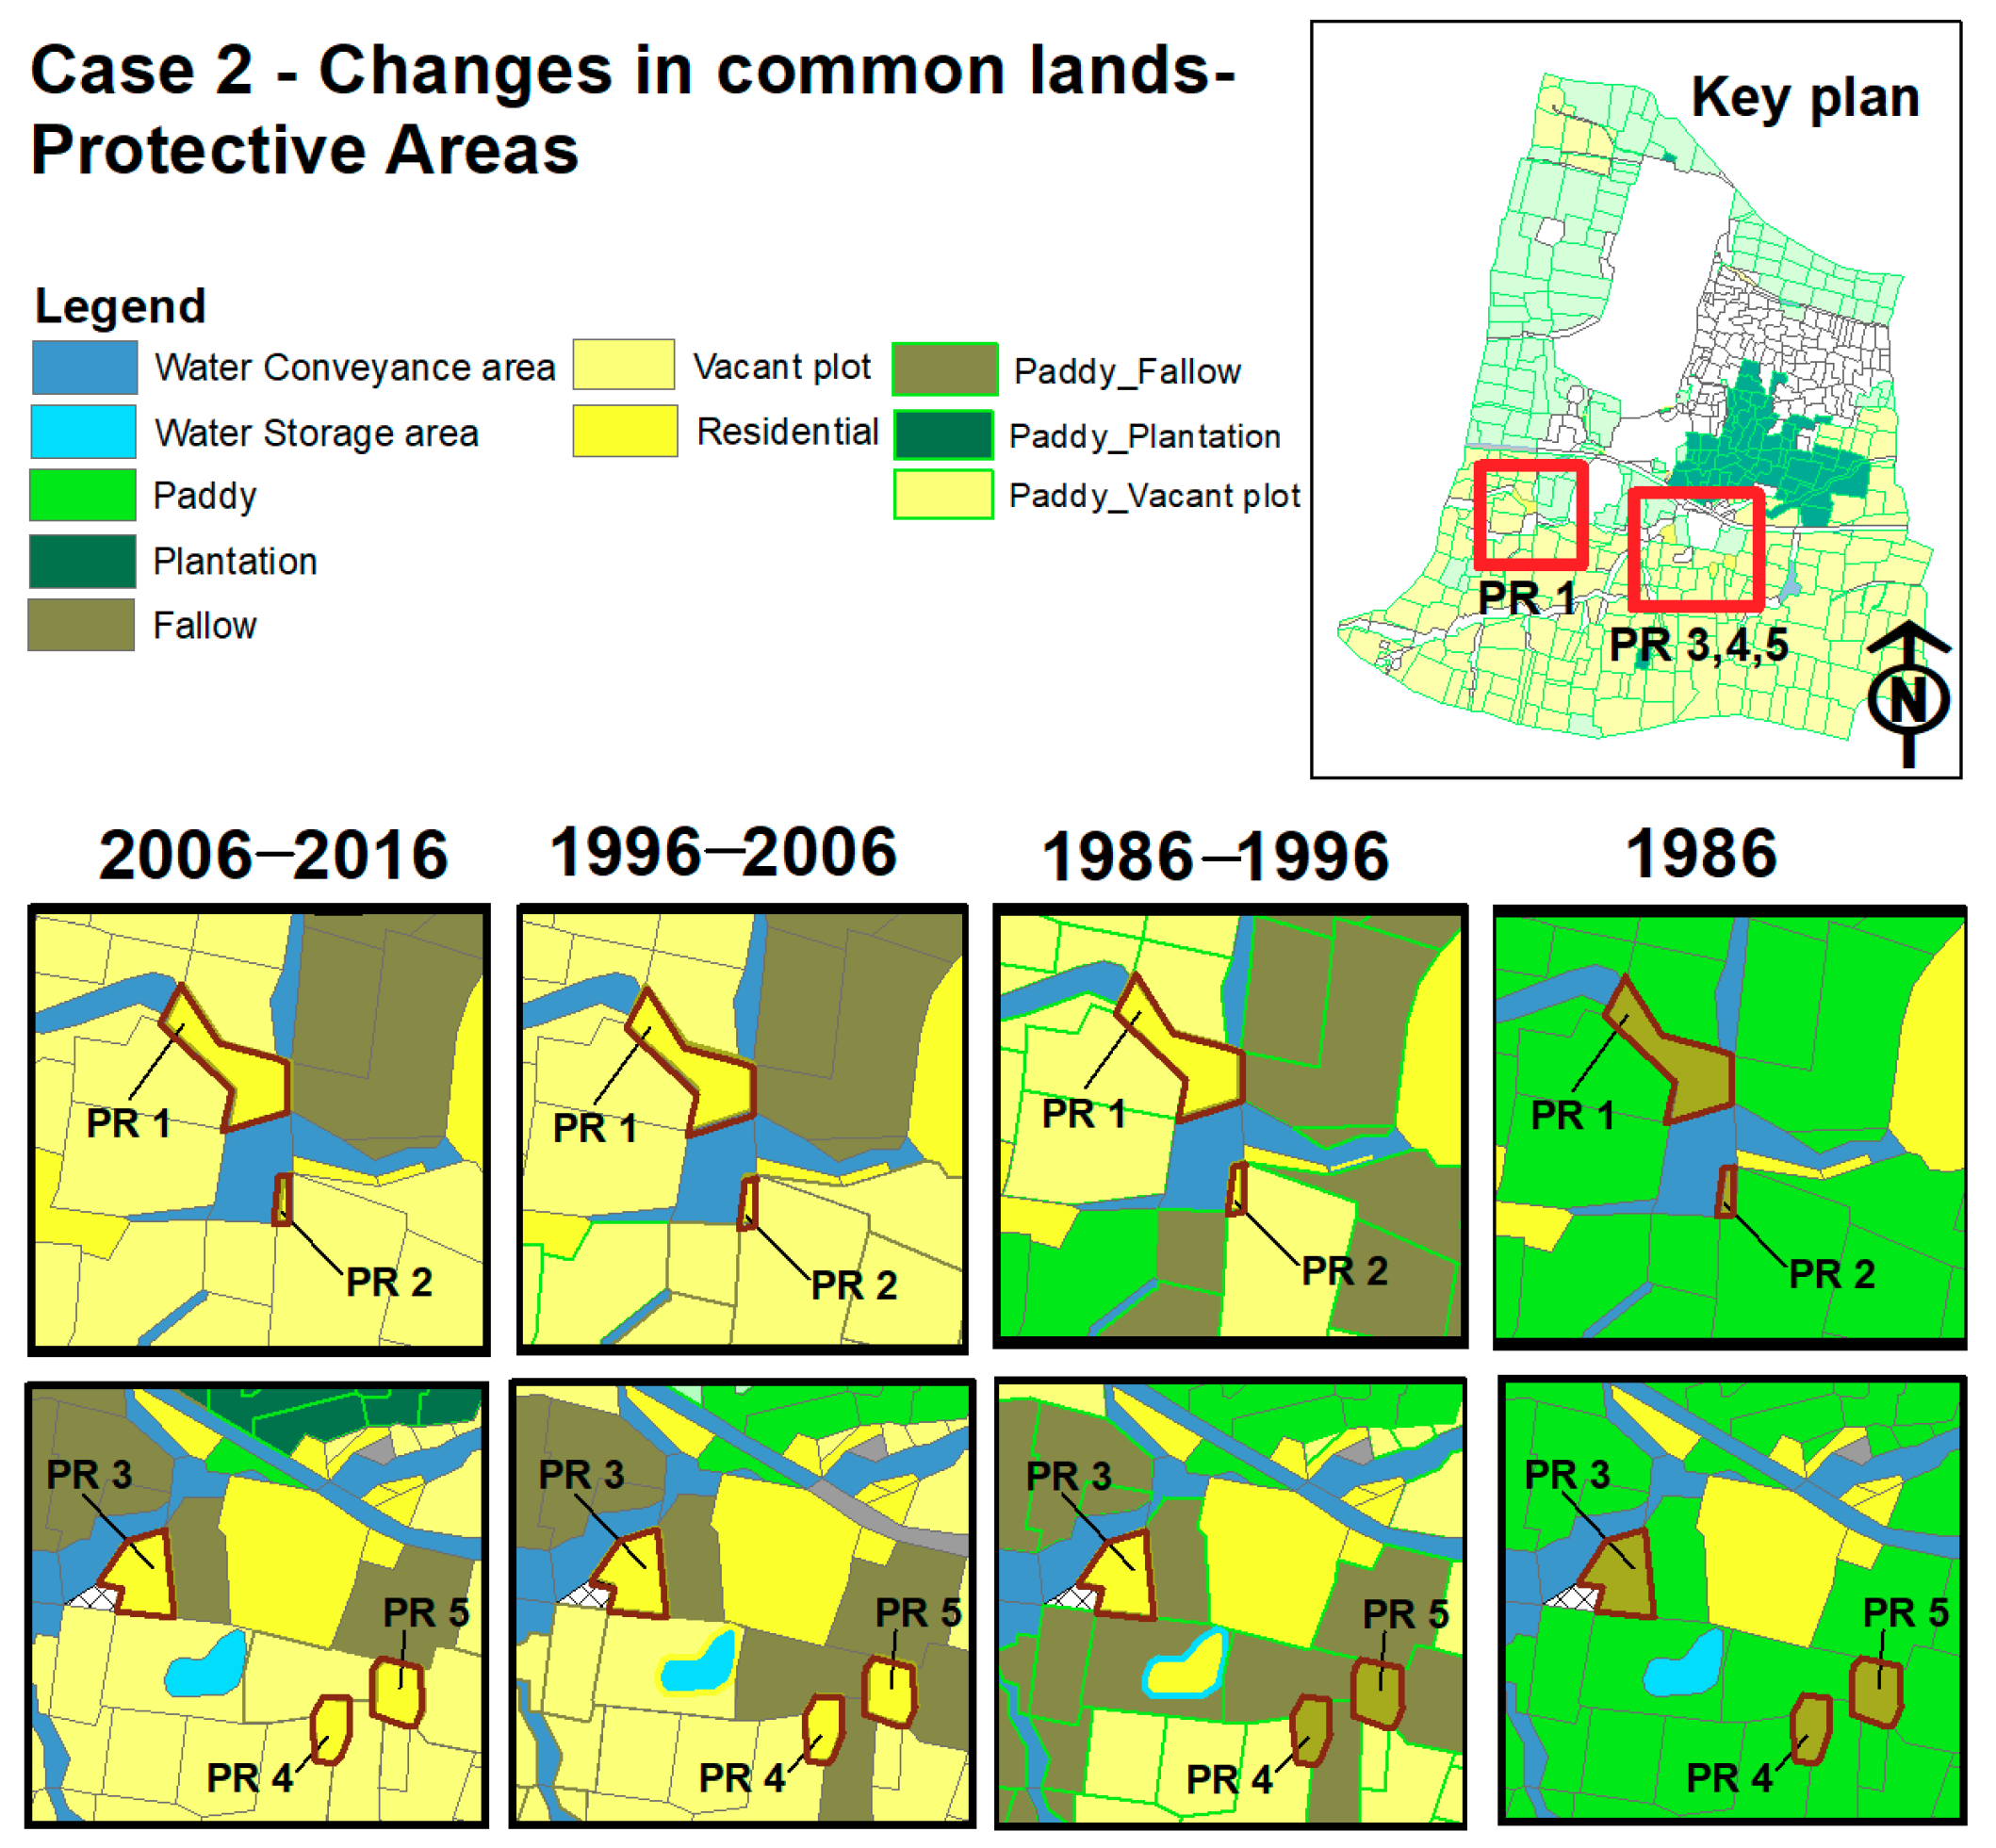
The following are the conclusions derived from the analysis of the plots of changed common land and the change in land use of the surrounding agricultural lands over four sets of data across forty years (see Figure 9 and Figure 10 and also Appendix C).
  • The predominant trajectory of change in both cases is Paddy to fallow→conversion of common lands.
  • The change in the common lands is preceded by a change in the agricultural land from paddy.
  • The patterns of land use change in the common lands reflect the land use change of the surrounding agricultural lands. In case 2, with less intensive developmental pressures, the land use of common lands has changed to paddy and plantation in the water conveyance areas. The protective area plots that have changed to residential were located nearby the traditional residential areas of the village and also in zones where the agricultural land has been converted to vacant plots.
  • In case 1, the instances of changes were similarly related to the land use of surrounding plots, i.e., common lands were converted into institutional when the surrounding land use of the plots had already been converted to institutional. This relationship indicates that the encroachment of the common land is by the surrounding plot owners, which is to be expected. It is clear from this observation that the encroachment of the common land is due more from proximity causes.

3.3. Relationship between Change in Agricultural Land Use and the Functioning Mechanisms of Community Management

The community control upon the tank system was found to be very weak in the study area. In case 1, there was no existence of social institutions, such as the traditional tank institutions, or the more recent tank user associations. The social institutions were the most essential component of the community management and without them, it is impossible to control the misuse of the system leading to its damage (Figure 1). However, they were notably absent in both the cases. In case 2, there was an informal association of wetland farmers, but it had limited influence and minimal activities. The only activity undertaken by them was decision making regarding the opening of the sluices for irrigation purposes when the major tank in the village gets filled. The officers interviewed were of the opinion that no formal social institutions either traditional or modern had existed in the study area in the last two decades.
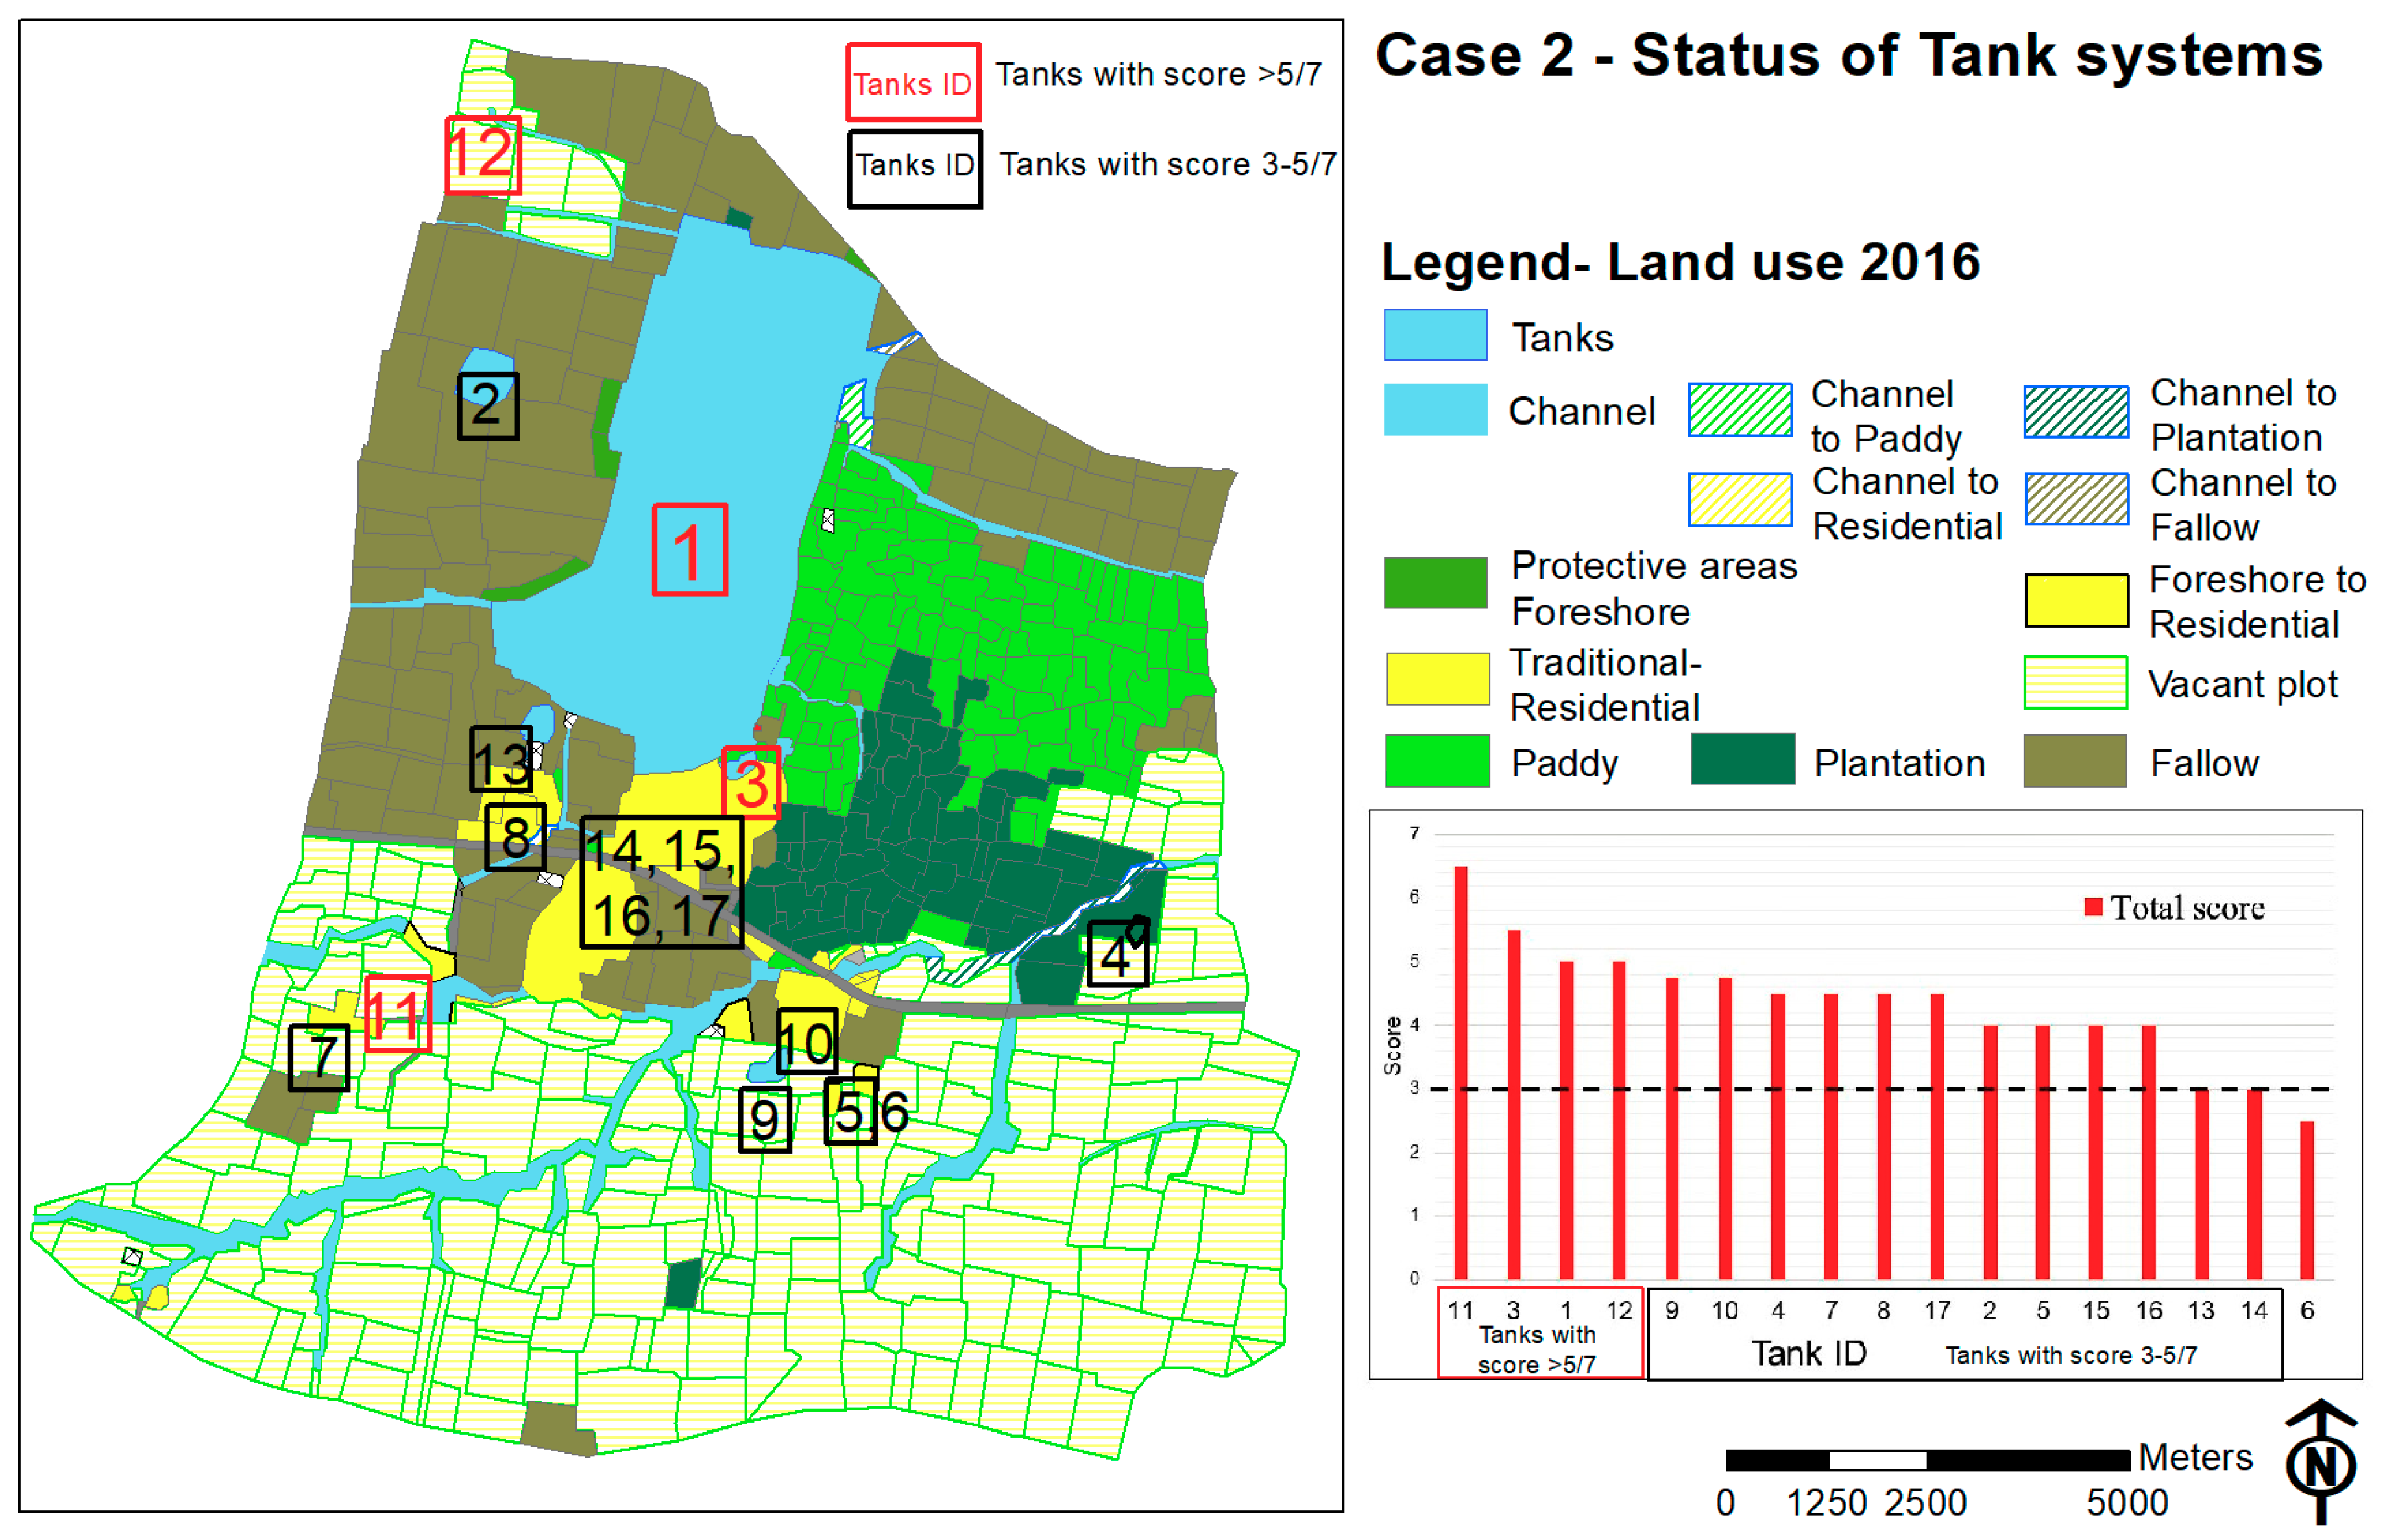
The analysis of the total score of the tanks revealed that a distinct variation exists in the status of tank systems between the cases taken for study (Figure 11 and Figure 12). In case 1, the extraction of products part of the benefits from the tank system was absent in all the tanks, except 1. Water is no longer drawn from nine tanks. However, one tank served as a recreational and social venue. In case 2, water was drawn for use from almost all of the tanks. The extraction of products was also carried out in almost all the tanks. There was social and recreational usage of four tanks. The analysis of the tanks, in terms of benefits acquired from them in both cases, clearly indicated there is reduction in case 2 and discontinuance of activities in case 1, which once served as incentives for maintaining the tanks. The condition of the bund and the channels was also found to be poor case 1 and in better condition in case 2. The total number of tanks not used and not existing at present (that is they have been filled up completely) is five in case 1, whereas there are no tanks under this category in case 2. The tanks with the score of 0 in case 1 are all located amidst lands with change in agricultural land use to land uses—Institutional, Industrial, and Others. The tanks with a score of more than 5 were all located amidst lands with no change in agricultural land use and the land use category of Vacant plots (Figure 13 and Figure 14).

4. Discussions

4.1. Role of Land Use Change as a Determinant in the Evaluation and Selection of the Water Management System

Water management consists of the set of actions that ensure the sustenance of the water resources. The governance system that undertakes the water management collectively manages both the allocation of the resources and the possible conflicts. This governance system is generally negotiated by social institutions in traditional water management systems [10]. Therefore, the question of the appropriate management system has been primarily addressed as a factor of social relations in previous literature, especially the dynamics of the social relations as a result of changes such as urbanization [2,5,7,21,26]. The sustenance of the water resources was also addressed as a factor of maintenance activities in previous literature [13,16,17,18]. The role of land use change in affecting both these aspects however had not been previously addressed. In peri-urban areas consisting of a mosaic of both urban and rural land uses [8], the extent and intensity of land use change is an important factor to be considered for management of water resources. The results of this study had indicated that the intensity and extent of land use change are closely related to the changes in the functioning mechanisms of the water management systems. This results from this research indicate that land use change of agricultural lands can be thus be an important determinant to analyze the appropriateness of the existing water management systems.
This research acknowledges that factors, such as demography, policies of the government, market factors, among others, influence land use change and are influenced by land use change and these factors also can influence the water management systems, however they have not been dealt with in this paper as they were beyond the scope of this paper. Further research on the relationship between these factors, land use change and the changes in the water management systems will be of help to evolve more efficient management actions for the sustenance of water resources.
Previous literature on the relationship between land use change and water resources have been with reference to the groundwater depth and quality [39,44,45], water quality in terms of pollution [46], and water quantity due to overextraction [47]. These studies have used remotely sensed data at a large regional scale. The methods used in these studies are not best suited to analyze small variations within a village level that create changes within the functioning mechanisms of local water management systems such as the tank systems. The method used in this research for integration of spatial data and the administrative data sources, such as land use records as well as the data about the actual status of the system through survey and structured interviews, can be applied to other studies of similar scale and complexity. The method used in this research will be of use also to other researchers working with the integration of cadastral and small-scale data into thematic land use maps for analysis. Integration of different types of data has been known to impart clear social understandings and solutions that can provide valuable insights for policy, governance, and management actions [10]. Analysis of spatial patterns over time with the help of GIS [48], in this research, had led to the isolation of events that caused the change in the water management systems. The spatial analysis combining land use maps and data from the survey had imparted clear understanding of the underlying spatial aspects of the land use change. Thus, the method used in this research had primarily enabled the understanding of the functioning mechanisms of the system and the changes in them. The advantage of this method is that it proposes a way through which land use change data can be combined with the data on the status of the system at a micro-level that can provide valuable insights for the decision regarding management policy and actions.

4.2. With Change in the Agricultural Land Use the Functioning Mechanisms of both Community Management and State Control are Ineffective

The break up in the functioning mechanisms of the tank systems was less in case 2 and high in case 1. In case 2, there were only a few instances of common land conversions, and the components of the community management had also not sustained notable damage. There was the presence of a nominal social institution in the form of tank user association, dependence on small tanks for drinking water and other purposes in this case 2. In this case, the conversion of agricultural lands in terms of the area was higher than in case 1, but the conversion was less intensive. The agricultural lands had been only converted to vacant plots which have not been developed. In case 1, with a higher intensity of change in the land use of agricultural lands, there were significant instances of common land conversions. The components of the community management had sustained significant damage too in this case. The secondary activities that had helped in the maintenance of the system in the form of product extraction had been abandoned and do not exist. Social institutions are absent and there is no dependence on tanks for drinking water. Even though a few of the tanks were being used for recreational purposes, this had not led to any social initiative to protect the tanks.
The findings of this research support the argument proposed by Wade [5] and Shah [27]: that need for water and the benefits attained from the system are the basis of the community controlling mechanisms. When there is no need for water from tanks and there is no interest in the extraction of benefits or if the extraction of benefits is denied, the people are no longer interested in protecting the system, making the system vulnerable to exploitation and damage. The conversion of agricultural lands to other land uses is thus a significant factor in the survival of the system, as it controls both the need for the water and the benefits from the system [19]. The state protection through legislation that should have replaced the community protection is hampered by weak enforcement in the cases studied, resulting in the illegal conversion of common land required for the water management to other land uses. Similar issues related to weak state control have been reported by others [20,27,49,50]. However, this research has brought attention to the fact that land use change plays a significant role in the breaking up of the linkages within the system that supported community management by exploiting the weak enforcement of the legislation by the state.
Even though the ownership and control of the tanks and related areas were with the government, whether the community is still dependent on the resources in terms of acquiring benefits from the components was analysed to evaluate the probability of restoring community control. The analysis of the components of the tank systems in terms of the presence of institutions and usage of the tanks in both cases had shown that change in the agricultural land use is strongly related to the breaking up of linkages within the system that had protected the system. In Case 1, with intensive land use change of agricultural lands, there is no presence of social institutions and there is no dependency on the water resources, and this is reflected in the poor status of the water storage, conveyance, and protective structures. In case 2, the status of the water resources is in better condition. The reasons for this are less intensive change in the agricultural land use, the presence of paddy cultivation, the existence of a nominal user association, high dependence on the tanks for water, and extraction of products aiding the maintenance of the tanks. As the need for the water and the benefits to people in terms of products extracted are both connected with agriculture, the change in the land use effectively removes the balance that had ensured the sustenance of the tank systems. The role of some of the tanks had changed to open spaces for recreation. Though it could be argued that this connection with the people can create a new balance of need and costs, it has not led to the formation of any community associations in the study area. Thus, it can be concluded that with an intense change in the agricultural land use, the likelihood of reviving the community management model of the tank systems becomes improbable.
In case 2, with less intensive change in agricultural land use, the illegal land use conversion of common lands was lower in number, leading to the interpretation that the protection afforded by the state through legislation had prohibited the conversion especially in water storage and conveyance areas. Such an argument is further supported by the fact that the conversion had happened predominantly in the common grazing land under the category protective areas in case 2, which are not specifically protected by the law. However, when the intensity of the change in agricultural land use was higher, as in case 1, this protection had not prevented the conversion of common lands in all three categories. In addition, the trajectories of change (see Figure 8 and Figure 9) in case 1 clearly showed that the change in water resources was preceded by or concurrent to the changes in the agricultural land to other land uses that surround them, especially the conversion of agricultural land from paddy cultivation. Another salient aspect is that in the cases studied, the tanks and their components come under two agencies and two different maintenance protocols. The tanks that come under the P.W.D (Public Works Department) with a more active role in maintenance are in better condition than those that come under the panchayat, which has fewer resources to maintain the tanks. Therefore, it is clear that an agency which has an active role in the maintenance of the tanks is required to protect them.
This research had shown that in peri-urban areas with significant land use change, both the traditional model of management and the current management model of the government are ineffective. However, to an extent, the water resources under P.W.D, as the government agency, are in a relatively better condition. The condition of the tanks under P.W.D also cannot be sustained in the long term as the tanks are linked and even though the tanks under P.W.D are free from encroachment, they are affected by the changes in the tanks under panchayat, which act as the feeders for the larger tanks. Therefore, it is proposed that for the sustenance of water resources in peri-urban areas, active involvement of the government is required for all the tanks, channels, and protective areas of the tank system. The agencies that have ownership and control need to be present and engaged in the maintenance of water resources. These agencies require financial and administrative resources to implement measures that can protect and maintain water resources.

Author Contributions

Data curation, R.R.H.; Formal analysis, R.R.H.; Methodology R.R.H.; Supervision, R.V.; Writing—original draft, R.R.H.; Writing—review & editing, R.R.H.

Funding

Part of the research work was conducted at the ‘CITERES’, Université François Rabélais, Tours, France under the guidance of Laura Verdelli and Denis Martouzet. This period of stay at the research lab was funded by the ‘ARCUS’ project grant.

Acknowledgments

The primary data used in this research were derived from the records, maps, and documents of the Department of Revenue, Department of Survey and Settlement, and the Department of TNGIS of the State Government of Tamilnadu, India. The authors wish to thank the departments and their personnel for their help.

Conflicts of Interest

The authors declare no conflicts of interest. The funders had no role in the design of the study; in the collection, analyses, or interpretation of data; in the writing of the manuscript, or in the decision to publish the results.

Appendix A

Appendix A.1. Questionnaire used for the Structured Interview and format for the collection of Data about Tanks to be Collected at Village Level

  • Is there any irrigation or other schemes for bringing/transfer of water operational here? (for example—Telugu Ganga scheme)
  • Tank memoirs for this area available? If so for how many years back? Historical data?
  • Tanks in the village—List and categories—P.W.D or Panchayat or Private?

Appendix A.2. For Each Tank

  • Name of Tank
  • Control agency
  • Catchment area of the tank: total area and location
  • Purpose of Tank—If Irrigation or others.
  • For Tanks used for irrigation: Is it still used for irrigation—If yes questions in section a, if not question in section b.
  • Section A:
    • i: Ayacut area (current and historical data)
    • ii: Sluice and distribution Channels details:
    • iii: Who maintains channels and sluices?
    • iv: Who takes care of distribution? Opening of sluices etc?
    • V: Any Tank user associations present? If so, what are their activities?
  • Section B:
    • i: Was it used for irrigation before?
    • ii: if yes till when and why isn’t it used for irrigation now?
    • iii: What is the purpose of the tank now?
  • For Tanks used for other purposes:
    • i: What is the purpose of the tank?
    • Ii: was it used for other purposes before?
  • What are the activities carried out by the side of the tanks/in tank bed/in bund by the people?
    • Routine:
    • Religious
    • Communal
    • Recreational
  • What is the source of water supplied to households? How is it distributed?
  • Are there any products collected from the tank and its surroundings?
    • Fruits/fodder/wood from Trees:
    • Grass cutting/Grazing
    • Roofing material
    • Silt from tank bed
    • Clay from the tank bed:
    • Others:

Appendix B

Table A1. Tank system status—scoring system.
No.AspectCriteriaScore
1.Water Storage areaWater storage area not changed in the last decade1
Water storage area partly reduced due to conversion for other purposes. A reduction in area of <50% was included in this category.0.5
Water storage area completely converted for other purposes/Water storage area reduced by more than 50%0
2.Status of the channel network connected to the tankClear1
Area reduced0.5
Obstructions0.5
Blocked0.5
Filled in0
3.Bund with its vegetationPresent on all three sides1
Partly present0.5
Damaged/not present0
4.Foreshore vegetationWooded1
Shrubs0.5
Scrub0.5
Grass/Ground cover0.25
No vegetation0
5.Common grazing landPresent 1
Part of the area existing0.5
Occupied for other purposes0
6.Social and recreationalFrequent activity1
Occasional activity0.5
No activity0
7.Usage of the tank waterFor original purpose1
Changed to lower purposes (e.g., drinking to washing/cleaning)0.5
Not used/not usable0
8.Extraction of productsFor Revenue (fees collected for extraction of products)1
For Personal purposes0.5
No extraction0

Appendix C

Table A2. Trajectories of change.
ID of Changed Plots Land Use of Surrounding Agricultural LandYearLand Use of Common LandTrajectory
Water Storage areas
WS1Paddy, Road1986WSPaddy to fallow → WS to residential
Fallow1986–1996To residential
Vacant plot1996–2006Residential
Vacant plot2006–2016Residential
WS2Fallow, Paddy1986PlantationFallow to institutional → WS to Plantation to institutional
Fallow, to fallow1986–1996Plantation
To plantation, to institutional1996–2006Plantation
To others, Institutional2006–2016Institutional
WS3Paddy, plantation, residential1986PaddyPaddy + Plantation+ Residential→WS to paddy to plantation
Paddy, To fallow, residential1986–1996Plantation
Paddy, fallow, residential1996–2006Plantation
Paddy, fallow, residential2006–2016Plantation
WS4Paddy, plantation1986PaddyPaddy to fallow → WS to paddy
To fallow, plantation1986–1996Paddy
Fallow, plantation1996–2006Paddy
Fallow, plantation2006–2016Paddy
WS5Paddy1986WSFallow to vacant plot → WS to residential
To fallow1986–1996WS
To vacant plot1996–2006Residential
Vacant plot2006–2016Residential
Water Conveyance areas
WC1Fallow1986WCFallow to vacant plot → WC to paddy
To vacant plot1986–1996Paddy
Vacant plot1996–2006Paddy
Vacant plot2006–2016Paddy
WC2Fallow1986OthersFallow → WC to others
Fallow1986–1996Others
To industrial1996–2006Others
Industrial2006–2016Others
Land use of Surrounding agricultural landYearLand use of common landTrajectory
WC3Fallow1986PaddyFallow → WC to Paddy
Fallow1986–1996Paddy
To industrial1996–2006Paddy
Industrial2006–2016Others
WC4Fallow1986WCFallow to institutional → WC to Plantation to others
Fallow1986–1996WC
To industrial1996–2006To plantation
Industrial2006–2016To others
WC5Fallow, paddy1986PaddyFallow → WC to Paddy
Fallow, to fallow1986–1996Paddy
To plantation, to institutional1996–2006Paddy
plantation, institutional2006–2016To institutional
WC6Paddy1986PaddyPaddy → WC to Paddy
To fallow1986–1996Paddy
To plantation, to institutional1996–2006Paddy
plantation, institutional2006–2016To institutional
WC7Paddy1986WCFallow to plantation, others → WC to institutional
To fallow1986–1996WC
To plantation, to others1996–2006To Institutional
plantation, others2006–2016Institutional
WC8Paddy1986WCFallow to plantation, institutional → WC to paddy to institutional
To fallow1986–1996WC
To plantation, to institutional1996–2006To paddy
Institutional2006–2016To institutional
WC9Paddy1986WCFallow to institutional to others → WC to institutional
To fallow1986–1996WC
To institutional1996–2006To Institutional
Institutional, to others2006–2016Institutional
WC10Paddy, Fallow1986WCPaddy, fallow → WC to Paddy
Paddy, Fallow1986–1996WC
Paddy, Fallow, to plantation1996–2006WC
Paddy, Fallow, plantation2006–2016to road
WC11Plantation, paddy1986IndustrialPlantation, paddy → WC to industrial to plantation
Fallow, paddy1986–1996Industrial
Fallow, to plantation1996–2006Plantation
Fallow, plantation2006–2016Plantation
Protective Areas
PR1Paddy, fallow, plantation1986PRFallow to institutional→ PR to plantation
To fallow, fallow, plantation1986–1996PR
To institutional, fallow, plantation1996–2006Plantation
To institutional, fallow, to industrial2006–2016Plantation
Land use of Surrounding agricultural landYearLand use of common landTrajectory
Water Conveyance areas
WC1Paddy1986PaddyPaddy to Fallow → WC to paddy to WC to fallow
Paddy1986–1996WC
To fallow1996–2006WC
Fallow2006–2016Fallow
WC2Paddy1986PaddyPaddy → WC to paddy
Paddy1986–1996Paddy
To fallow, paddy1996–2006Paddy
Fallow, paddy2006–2016Paddy
WC3Residential, paddy1986ResidentialResidential, paddy → WC to Residential
Residential, fallow1986–1996Residential
Residential, fallow1996–2006Residential
Residential, fallow2006–2016Residential
WC4Paddy1986PaddyPaddy to plantation → WC to Paddy to plantation
To Plantation, paddy1986–1996To plantation
Plantation, paddy1996–2006Plantation
Plantation, to plantation2006–2016Plantation
Protective Areas
PR1Paddy1986PRPaddy to fallow, vacant plot → PR to residential
To fallow, vacant plot1986–1996To residential
Fallow, vacant plot1996–2006Residential
Fallow, vacant plot2006–2016Residential
PR2Paddy1986PRPaddy to fallow, vacant plot → PR to residential
To fallow, vacant plot1986–1996To residential
Fallow, vacant plot1996–2006Residential
Fallow, vacant plot2006–2016Residential
PR3Paddy1986PRPaddy to fallow, vacant plot → PR to residential
To fallow, vacant plot1986–1996To residential
Fallow, vacant plot1996–2006Residential
Fallow, vacant plot2006–2016Residential
PR4Paddy1986PRPaddy to fallow, vacant plot → PR to residential
To fallow, vacant plot1986–1996PR
Fallow, vacant plot1996–2006To residential
To vacant plot2006–2016Residential
PR5Paddy1986PRPaddy to fallow, vacant plot → PR to residential
To fallow, vacant plot1986–1996PR
Fallow, vacant plot1996–2006To residential
To vacant plot2006–2016Residential
Figure A1. Trajectories of change: Case 1—water conveyance area.
Water 11 01219 g0a1
Figure A2. Trajectories of change: Case 1—protective area.
Water 11 01219 g0a2
Figure A3. Trajectories of change: Case 2—protective area.
Water 11 01219 g0a3

Appendix D

Figure A4. Output of buffer analysis—Case 1.
Water 11 01219 g0a4
Figure A5. Output of buffer analysis—case 2.
Water 11 01219 g0a5

Appendix E

Table A3. Consolidated data from the interview for all the tanks in both cases.
No.Survey No.Name of the TankType of the TankControl -AgencyArea (m2)If Irrigation TankPurpose-NowPurpose-EarlierActivityFrequency
ICase 1:
1116Un eriEriP.W.D24,082.49yesIRRIRRcultural activities aroundhigh
2195MevalurkuppameriEriP.W.D748,668yesIRRIRRagricultural and cultural activities aroundhigh
3287Kattagaram EriEriPanchayat22,340.10yesNOIRRno major activities aroundlow
4171Kulam 1KulamPanchayat981.79noWaWano major activities aroundhigh
5249Kulam 2KulamPanchayat17,426.58noWaWano major activities aroundna
6280Katan kulamKulamPanchayat3336.10noWaWacultural activities aroundhigh
7400KannadiyanpalayamkulamKulamPanchayat4387.92noWaWacultural activities at occasionshigh
814KalkuttaiKuttaiPanchayat2493.18noCaCacattle grazinglow
938Kuttai 2KuttaiPanchayat22,585.50yesIRRIRRno major activities aroundlow
1040EaswarankoilkuttaiKuttaiPanchayat3715.12noNOSAcultural activities aroundlow
11126ArasankalanikuttaiKuttaiPanchayat5,166.28noWaWano major activities aroundhigh
12131KarpagaviyagarkoilkuttaiKuttaiPanchayat4727.99noSASAcultural activities aroundlow
13234Kuttai 2KuttaiPanchayat3454.64noWaWacultural activities aroundfestive seasons
14251KakkukuttaiKuttaiPanchayat8481.46noWaSAcultural activities aroundlow
15254SudukattukuttaiKuttaiPanchayat835.91noCrCrcremationvery low
16421Sri Palliyaththamman koil kuttaiKuttaiPanchayat1871.63noSASAcultural activities aroundlow
174aPapankalanikuttaiKuttaiPanchayat4284.02yesNOWano major activities aroundvery low
1823Thangal 1ThangalPanchayat13,153.37yesNOIRRno major activities aroundvery low
1945SakaraithangalThangalPanchayat2242.50noWaWano major activities aroundlow
20176VannirthangalThangalPanchayat15,518.53yesIRRIRRno major activities aroundlow
21214Thangal1ThangalPanchayat41,829.37yesDyIRRdumping waste and garbagehigh
22401KonnerithangalThangalPanchayat1997.63noNOWadumping waste and garbagelow
IICASE 2:
1186PeriyaeriEriP.W.D.724,900YesWaIRR
2211VannankulamKulamPanchayat5637NoWaWa
3254NallathanikulamKulamPanchayat11,133NoDrDrFishing is prohibited for some time now
4, 5331KulamKulamPanchayat10,292YesStIRR
6367MandhaivelikulamKulamPanchayat2997YesCaIRR
7369MandhaivelikulamKulamPanchayat1366YesStIRR
8490KulamKulamPanchayat1744YesStIRR
9247/AAnnanagarkulamKulamPanchayat1515NoWaDr
10405, 289NallathannikulamKulamPanchayat10,075NoDrDr
11497, 499New water bodyKulamPanchayat5469NoDrDr
12198KuttaiKuttaiPanchayat122YesStIRR
13242KuttaiKuttaiPanchayat6361YesNO (Dry)IRR
14254KuttaiKuttaiPanchayat2717YesStIRR
15254KuttaiKuttaiPanchayat1858YesGrIRR
16254KuttaiKuttaiPanchayat1343YesGrIRR
17273KuttaiKuttaiPanchayat3293YesStIRR
18415KuttaiKuttaiPanchayat12,594NoStSt
19182 bKuttaiKuttaiPanchayat96,158.96YesStIRR
Dy—dump yard, Wa—washing clothes, IRR—irrigation, NO—no usage, Ca—cattle feeding, SA—serves water for temple, Cr—serves water for crematory rituals, Dr—Drinking Water, St—Overfow Storage, Gr—Storage of Grey water.

References

  1. McDonald, R.I. Water on an urban planet: Urbanization and the reach of urban water infrastructure. Glob. Environ. Chang. 2014, 27, 96–105. [Google Scholar] [CrossRef] [Green Version]
  2. Janakarajan, S.; Butterworth, J.; Moriarty, P.; Batchelor, C. Strengthened city, marginalised peri-urban villages: Stakeholder dialogues for inclusive urbanisation in Chennai, India. In Peri-Urban Waterconflicts-Supporting Dialogue and Negotiations; Technical Paper Series 50; Butterworth, J., Ducrot, R., Faysse, N., Janakarajan, S., Eds.; International Water Sanitation Centre: Delft, The Netherlands, 2007; pp. 51–75. [Google Scholar]
  3. Butterworth, J.; Warner, J. Introduction. In Peri-Urban Waterconflicts-Supporting Dialogue and Negotiations; Technical Paper Series 50; Butterworth, J., Ducrot, R., Faysse, N., Janakarajan, S., Eds.; International Water Sanitation Centre: Delft, The Netherlands, 2007; pp. 8–23. [Google Scholar]
  4. Balasubramanian, R.; Choi, S.C. Urbanisation, population pressure and agricultural intensification: Evidences from Tamilnadu, India. J. Rural Dev. 2010, 33, 87–108. [Google Scholar]
  5. Wade, R. Village Republics: Economic Conditions for Collective Action in South India; ICS Press, Institute for Contemporary Studies: San Fransico, CA, USA, 1994. [Google Scholar]
  6. Grafton, R.Q. Governance of the commons: A role for the state? Land Econ. 2000, 76, 504–517. [Google Scholar] [CrossRef]
  7. Aubriot, O.; Prabhakar, P. Ignatius. Water Institutions and the ‘Revival’ of tanks in South India: What is at stake locally. Water Altern. 2011, 4, 325–346. [Google Scholar]
  8. Gomes, S.; Hermans, L.; Islam, K.; Huda, S.; Hossain, A.T.; Thissen, W. Capacity building for water management in peri-urban communities, Bangladesh: A simulation-gaming approach. Water 2018, 10, 1704. [Google Scholar] [CrossRef]
  9. Alamanos, A.; Mylopoulos, N.; Loukas, A.; Gaitanaros, D. An integrated multicriteria analysis tool for evaluating water resource management strategies. Water 2018, 10, 1795. [Google Scholar] [CrossRef]
  10. Delgado-Serrano, M.M.; Ramos, P.A.; Zapata, E.L. Using Ostrom’s DPs as fuzzy sets to analyze how water policies challenge community-based water governance in Colombia. Water 2017, 9, 535. [Google Scholar] [CrossRef]
  11. Agarwal, A.; Narain, S. Dying Wisdom: Rise, Fall and Potential of India’s Traditional Water Harvesting Systems (State of India’s Environment, Volume 4); CSE: New Delhi, India, 1997. [Google Scholar]
  12. Ariza, P.; Galan, E.; Serranao, T. Water Tank as Ecosystems—Ecosystemic Perception of Local Population for Integral Management of Water Tanks in Tamilnadu, South India. Master Thesis, Ciencias Ambientales, Universitat Autonoma de Barcelona, Barcelona, Spain, 2007. [Google Scholar]
  13. Ratnavel, S.M.; Gomathinayagam, P. Search If Ancient Wisdom—Irrigation Tanks; DHAN Foundation: Madurai, India, 2006. [Google Scholar]
  14. Ramasamy, S. Law, Technology and Water Conflicts in Developing Societies: A Case Study of Tank Systems in Tamilnadu. Ph.D. Thesis, Faculty of Social Sciences and Humanities, University of Westminster, London, UK, 2014. [Google Scholar]
  15. Elumalai, G. Institutional reforms, support and policy issues for development and management of small village tanks in Tamilnadu. In Village Tanks of South Asia; DHAN Foundation: Madurai, India, 2002; pp. 138–142. [Google Scholar]
  16. Arumugam, N.; Mohan, S.; Ramprasad, R. Sustainable developement and management of Tank irrigation systems in South India. Water Int. 1997, 22, 90–97. [Google Scholar] [CrossRef]
  17. Vaidyanathan, A.; Sivasubramaniyan, K. Tank irrigation in South India: An Overview. In Tanks of South India; Vaidyanathan, A., Ed.; Centre for Science and Environment: New Delhi, India, 2001; pp. 5–28. [Google Scholar]
  18. Mukundan, T.M. The Ery systems of South India; Akash Ganga Trust: Chennai, India, 2005. [Google Scholar]
  19. Rukkumany, R.H.; Vedamuthu, R. Storing monsoon waters: The tank systems of Tamilnadu. In Monsoon Assemblages; Monsoon Waters: London, UK, 2019; pp. 210–221. [Google Scholar]
  20. Mizushima, T. Mirasi system and local society in Pre-colonial South India. In Local Agarian Societies in Colonial India-Japanese Perspectives; Robb, P., Sugihara, K., Yanagisawa, H., Eds.; Routledge, Taylor and Francis Group: London, UK, 1996. [Google Scholar]
  21. Mosse, D. The Rule of Water: Statecraft, Ecology and Collective Action in South India; Madhav, G., Ramachandra, G., Eds.; Oxford University Press: New Delhi, India, 2003. [Google Scholar]
  22. Sivasubramaniyan, K.; Vaidyanathan, A. Tanks of Periyar Vaigai basin. In Tanks of South India; Vaidyanathan, A., Ed.; Centre for Science and Environment: New Delhi, India, 2001; pp. 31–54. [Google Scholar]
  23. Vaidyanathan, A. Conclusions and implications. In Tanks of South India; Vaidyanathan, A., Ed.; Centre for Science and Environmen: New Delhi, India, 2001; pp. 155–162. [Google Scholar]
  24. Naz, F.; Subramanian, S. Water Managment across Space and Time in India; ZEF Working Paper Series; Department of Political and Cultural Change, Center for Development Research, University of Bonn: Bonn, Germany, 2010; Volume 61, pp. 1–32. [Google Scholar]
  25. Oppen, M.V.; Subba Rao, K.V. Tank Irrigation in Semi-Arid Tropical India Economic Evaluation and Alternatives for Improvement; International Crops Research Institute for the Semi-Arid Tropics: Patancheru, Andhra Pradesh, India, 1987; pp. 1–42. [Google Scholar]
  26. Rodrigo, G. Water, Water, Nowhere: A Case Study of Palayaseevaram Village Regarding Sharing of Water with the Chennai City and Its Impact on the Village; WHIRL Project Working Paper; Natural Resources Institute, University of Greenwich: Chatham, UK, 2004; Volume 9, pp. 1–23. [Google Scholar]
  27. Shah, E. Social Designs: Tank Irrigation Technology and Agarian Transformation in South India; Wageningen University Water Resources Series Orient Longman: New Delhi, India, 2003; Volume 4. [Google Scholar]
  28. Janssen, M.A.; Anderies, J.M. Robustness Trade-offs in Social Ecological Systems. Int. J. Commons 2007, 1, 43–65. [Google Scholar] [CrossRef]
  29. Nagendra, H.; Elinor, O. Applying the social-ecological system framework to the diagnosis of urban lake commons in Bangalore, India. Ecol. Soc. 2014, 19, 1–8. [Google Scholar] [CrossRef]
  30. Sanchayan, N. Ownership and outcomes: The case of Lakes and Wetlands in India. In Workshop in Political Theory and Policy Analysis; Indiana University: Bloomington, Indiana, 2012. [Google Scholar]
  31. Yanagisawa, H. Village common land, manure, fodder, and intensive agricultural practices in Tamilnadu from mid-nineteenth century. Rev. Agrar. Stud. 2011, 1, 23–42. [Google Scholar]
  32. Dhatchayani, S.; Arul, C.; Ambujam, N.K. Impact of urbanization on landuse in a peri-urban, Chennai—A case study of catchment and command area of Chemberabakkam tank. Int. J. Eng. Sci. Technol. 2013, 5, 182–194. [Google Scholar]
  33. Lavanya, K. Urban Flood Management—A case study of Chennai city. Arch. Res. 2012, 2, 115–121. [Google Scholar] [CrossRef]
  34. Sethuram, S. Case study: Water management issues in Chennai, India. Univ. J. Environ. Res. Technol. 2014, 4, 299–306. [Google Scholar]
  35. Anuradha, B.; Rajeswari, M.; Ambujam, N.K. Socio-economic impact of irrigation tank restoration on livelihood options in Peri-urban and rural areas. In Proceedings of the International Conference on Economics, Social Sciences and Languages (ICESL), Singapore, 14–15 May 2014; pp. 67–71. [Google Scholar]
  36. Chennai Metropolitan Developement Authority. Chapter I: Introduction. In Second Master Plan for Chennai 2026; Chennai Metropolitan Developement Authority: Chennai, India. Available online: www.cmdachennai.gov.in/volume1.html (accessed on 15 December 2017).
  37. Ramesh, S.; Nagarajan, N.; Poongothai, S. Land use in suburbia: Perungalathuur village of Chennai metropolitan area. Int. J. Sci. Eng. Res. 2011, 4, 1–6. [Google Scholar]
  38. Du, X.; Jin, X.; Yang, X.; Yang, X.; Zhou, Y. Spatial pattern of land use change and its driving force in Jiangsu Province. Int. J. Environ. Public Health 2014, 11, 3215–3232. [Google Scholar] [CrossRef]
  39. Ainiwaer, M.; Ding, J.; Wang, J.; Nasierding, N. Spatiotemporal dynamics of water table depth associated with changing agricultural land use in an arid-zone oasis. Water 2019, 11, 673. [Google Scholar] [CrossRef]
  40. Department of Town and Country Planning. Information Handbook under the Right to Information Act; DTCP: Chennai, India, 2005; pp. 29–43. [Google Scholar]
  41. Venkatasubramaniam, G.; Van Klink, I.; Richard-Ferroudji, A. Scenarios for Water and Agriculture in the Pondicherry Region; Project Report; French Institute of Pondicherry: Pondicherry, India, 2017. [Google Scholar]
  42. Horn, S. Using a GIS to Determine How Different Types of Land Cover Have Changed over Time in the State of Connecticut; Papers in Resource Analysis; Saint Mary’s University of Minnesota Central Services Press: Winona, MN, USA, 2010; Volume 12, pp. 1–11. [Google Scholar]
  43. Creswell, J.W. The selection of Research Design. In Research Design: Qualitatice, Quantitative, and Mixed Method Approaches, 3rd ed.; SAGE Publications: New Delhi, India, 2009; Volume 1, pp. 3–23. [Google Scholar]
  44. Wang, J.; Gao, Y.; Wang, S. Land use/cover change impacts on water table change over 25 years in a desert-oasis transition zone of the Heihe river basin, China. Water 2015, 8, 11. [Google Scholar] [CrossRef]
  45. Kumar, P.; Dasgupta, R.; Johnson, B.A.; Saraswat, C.; Basu, M.; Kefi, M.; Mishra, B.K. Effect of land use changes on water quality in an ephemeral coastal plain: Khambat city, Gujrat, India. Water 2019, 11, 724. [Google Scholar] [CrossRef]
  46. Ding, J.; Jiang, Y.; Fu, L.; Liu, Q.; Peng, Q.; Kang, M. Impacts of land use on surface water quality in a subtropical River Basin: A case study of the Dongjiang River Basin, Southeastern China. Water 2015, 7, 4427–4445. [Google Scholar] [CrossRef]
  47. Bossa, A.Y.; Diekkrugar, B.; Agbossou, E.K. Scenario-based impacts of land use and climate change on land and water degradation from the meso to regional scale. Water 2014, 6, 3152–3181. [Google Scholar] [CrossRef]
  48. Pinto, P.J.; Kondolf, G. Evolution of two urbanized estuaries: Environmental change, legal framework and implications for sea-level rise vulnerability. Water 2016, 8, 535. [Google Scholar] [CrossRef]
  49. Lindberg, S.; Rajagopal, A.; Djurfeldt, G.; Athreya, V.B.; Vidyasagar, R. Designing collective action: Problems of local water management in Tiruchi district. Rev. Agrar. Stud. 2011, 1, 157–178. [Google Scholar]
  50. La Vanchy, G.T.; Romano, S.T.; Taylor, M.J. Challenges to water security along the “Emerald coast”: A political ecology of local water governance in Nicaragua. Water 2017, 9, 655. [Google Scholar] [CrossRef]
Figure 1. Traditional community managed model of tank systems (source—authors).
Water 11 01219 g001
Figure 2. Present government management model of the Tank systems (Source—authors).
Water 11 01219 g002
Figure 3. Study area location.
Water 11 01219 g003
Figure 4. Components of analysis.
Water 11 01219 g004
Figure 5. Trends in land use change for case 1 and case 2.
Water 11 01219 g005
Figure 6. Trends in land use change components within agricultural land and common land for case 1 and case 2.
Water 11 01219 g006
Figure 7. Spatial pattern of land use change of common lands in case 1.
Water 11 01219 g007
Figure 8. Spatial pattern of land use change in case 2.
Water 11 01219 g008
Figure 9. Trajectories of land use change: Case 1—water storage area.
Water 11 01219 g009
Figure 10. Trajectories of change: Case 2—water conveyance area.
Water 11 01219 g010
Figure 11. Case 1: Score of tanks based on components.
Water 11 01219 g011
Figure 12. Case 2: Score of tanks based on components.
Water 11 01219 g012
Figure 13. Relationship between change in agricultural land use and the status of the tank systems in case 1.
Water 11 01219 g013
Figure 14. Relationship between change in agricultural land use and the status of the tank systems in case 2.
Water 11 01219 g014
Table 1. Details of area under each land use type.
Case 1
Land Use TypeArea-1986 km2Area-2016 km2Change in Area (1986–2016) km2Total % of Land Changed (1986–2016)% of total Area in 1986% of total Area in 2016
Fallow5.615.13−0.48−8.5337.8134.59
Paddy4.270.62−3.66−85.5628.804.16
Plantation1.300.58−0.72−55.628.793.90
Total agriculture11.186.33−4.86−43.4475.4042.65
Residential7.160.910.1927.024.836.13
Vacant plot0.032.422.398278.660.1916.29
Industrial0.410.820.4198.302.805.55
Institutional0.001.101.10100.000.007.41
Others0.010.800.799371.050.065.40
Water Storage areas1.171.15−0.02−1.607.877.74
Water Conveyance areas0.750.73−0.02−2.475.064.93
Protective areas0.130.08−0.05−36.040.870.56
Total land area in the village14.8314.83
Case 2
Fallow038.2538.25100.000.0021.89
Paddy139.4915.30−124.20−89.0379.848.75
Plantation0.0611.0110.9519716.100.036.30
Total agriculture139.5564.55−75.00−53.7479.8736.94
Residential6.797.260.487.043.884.16
Vacant plot074.4574.45100.000.0042.61
Others0.030.030.0121.170.010.02
Water Storage areas18.6118.610.000.0010.6510.65
Water Conveyance areas6.817.300.487.113.904.18
Protective areas1.160.65−0.51−43.850.660.37
Total land area in the village174.72174.72
Present government management model of the tank systems (source—authors).
Table 2. Land use classification system.
Land Use Classification as Per the Regulations of the Department of Town and Country Planning, Government of TamilnaduLand Use Classification followed in this Research
Residential use zoneDivided into two classifications—1. Vacant plot, 2. Residential
Commercial use zoneAs this category of land use was very limited in the study area and was merged with land uses that are different from the categories given in this table and classified as Others.
Industrial use zoneIndustrial
Educational use zoneInstitutional
Public and semipublic use zoneCommon lands
Agricultural use zoneDivided into three classifications (1) Paddy. (2) Plantation. (3) Fallow.
Table 3. Correlation values between change in land under agricultural land use and change in total land area existing as common lands related to water management.
Correlation Values
Change in Common Lands Related to Water ManagementChange in the Total Land under Agricultural Land UseChange in the Total Land under FallowChange in the Total Land under PaddyChange in the Total Land under Plantation
Case 1Case 2Case 1Case 2Case 1Case 2Case 1Case 2
Water storage areas0.96No change in water storage areas0.74No change in water storage areas0.86No change in water storage areas0.21No change in water storage areas
Water conveyance areas0.050.910.790.480.210.870.990.66
Protective areas0.970.580.720.500.890.960.220.22