1. Introduction
Coastal upwelling regions are rich in nutrients and essential for the trophic chain of coastal fish species. About 20% of the worldwide fish catchment is captured in coastal upwelling regions [
1], although upwelling areas enclose less than 1% of the world’s oceans. Populations of small pelagic fishes, such as sardine, horse mackerel, mackerel and anchovy, show evidence of significant long-term natural fluctuations in their abundance due to upwelling, which has implications for medium and long-term forecasting of catches [
2,
3,
4]. Therefore, upwelling systems are among the most studied in the ocean due to their high productivity, intense fisheries activity and consequent economic and social implications [
3,
4].
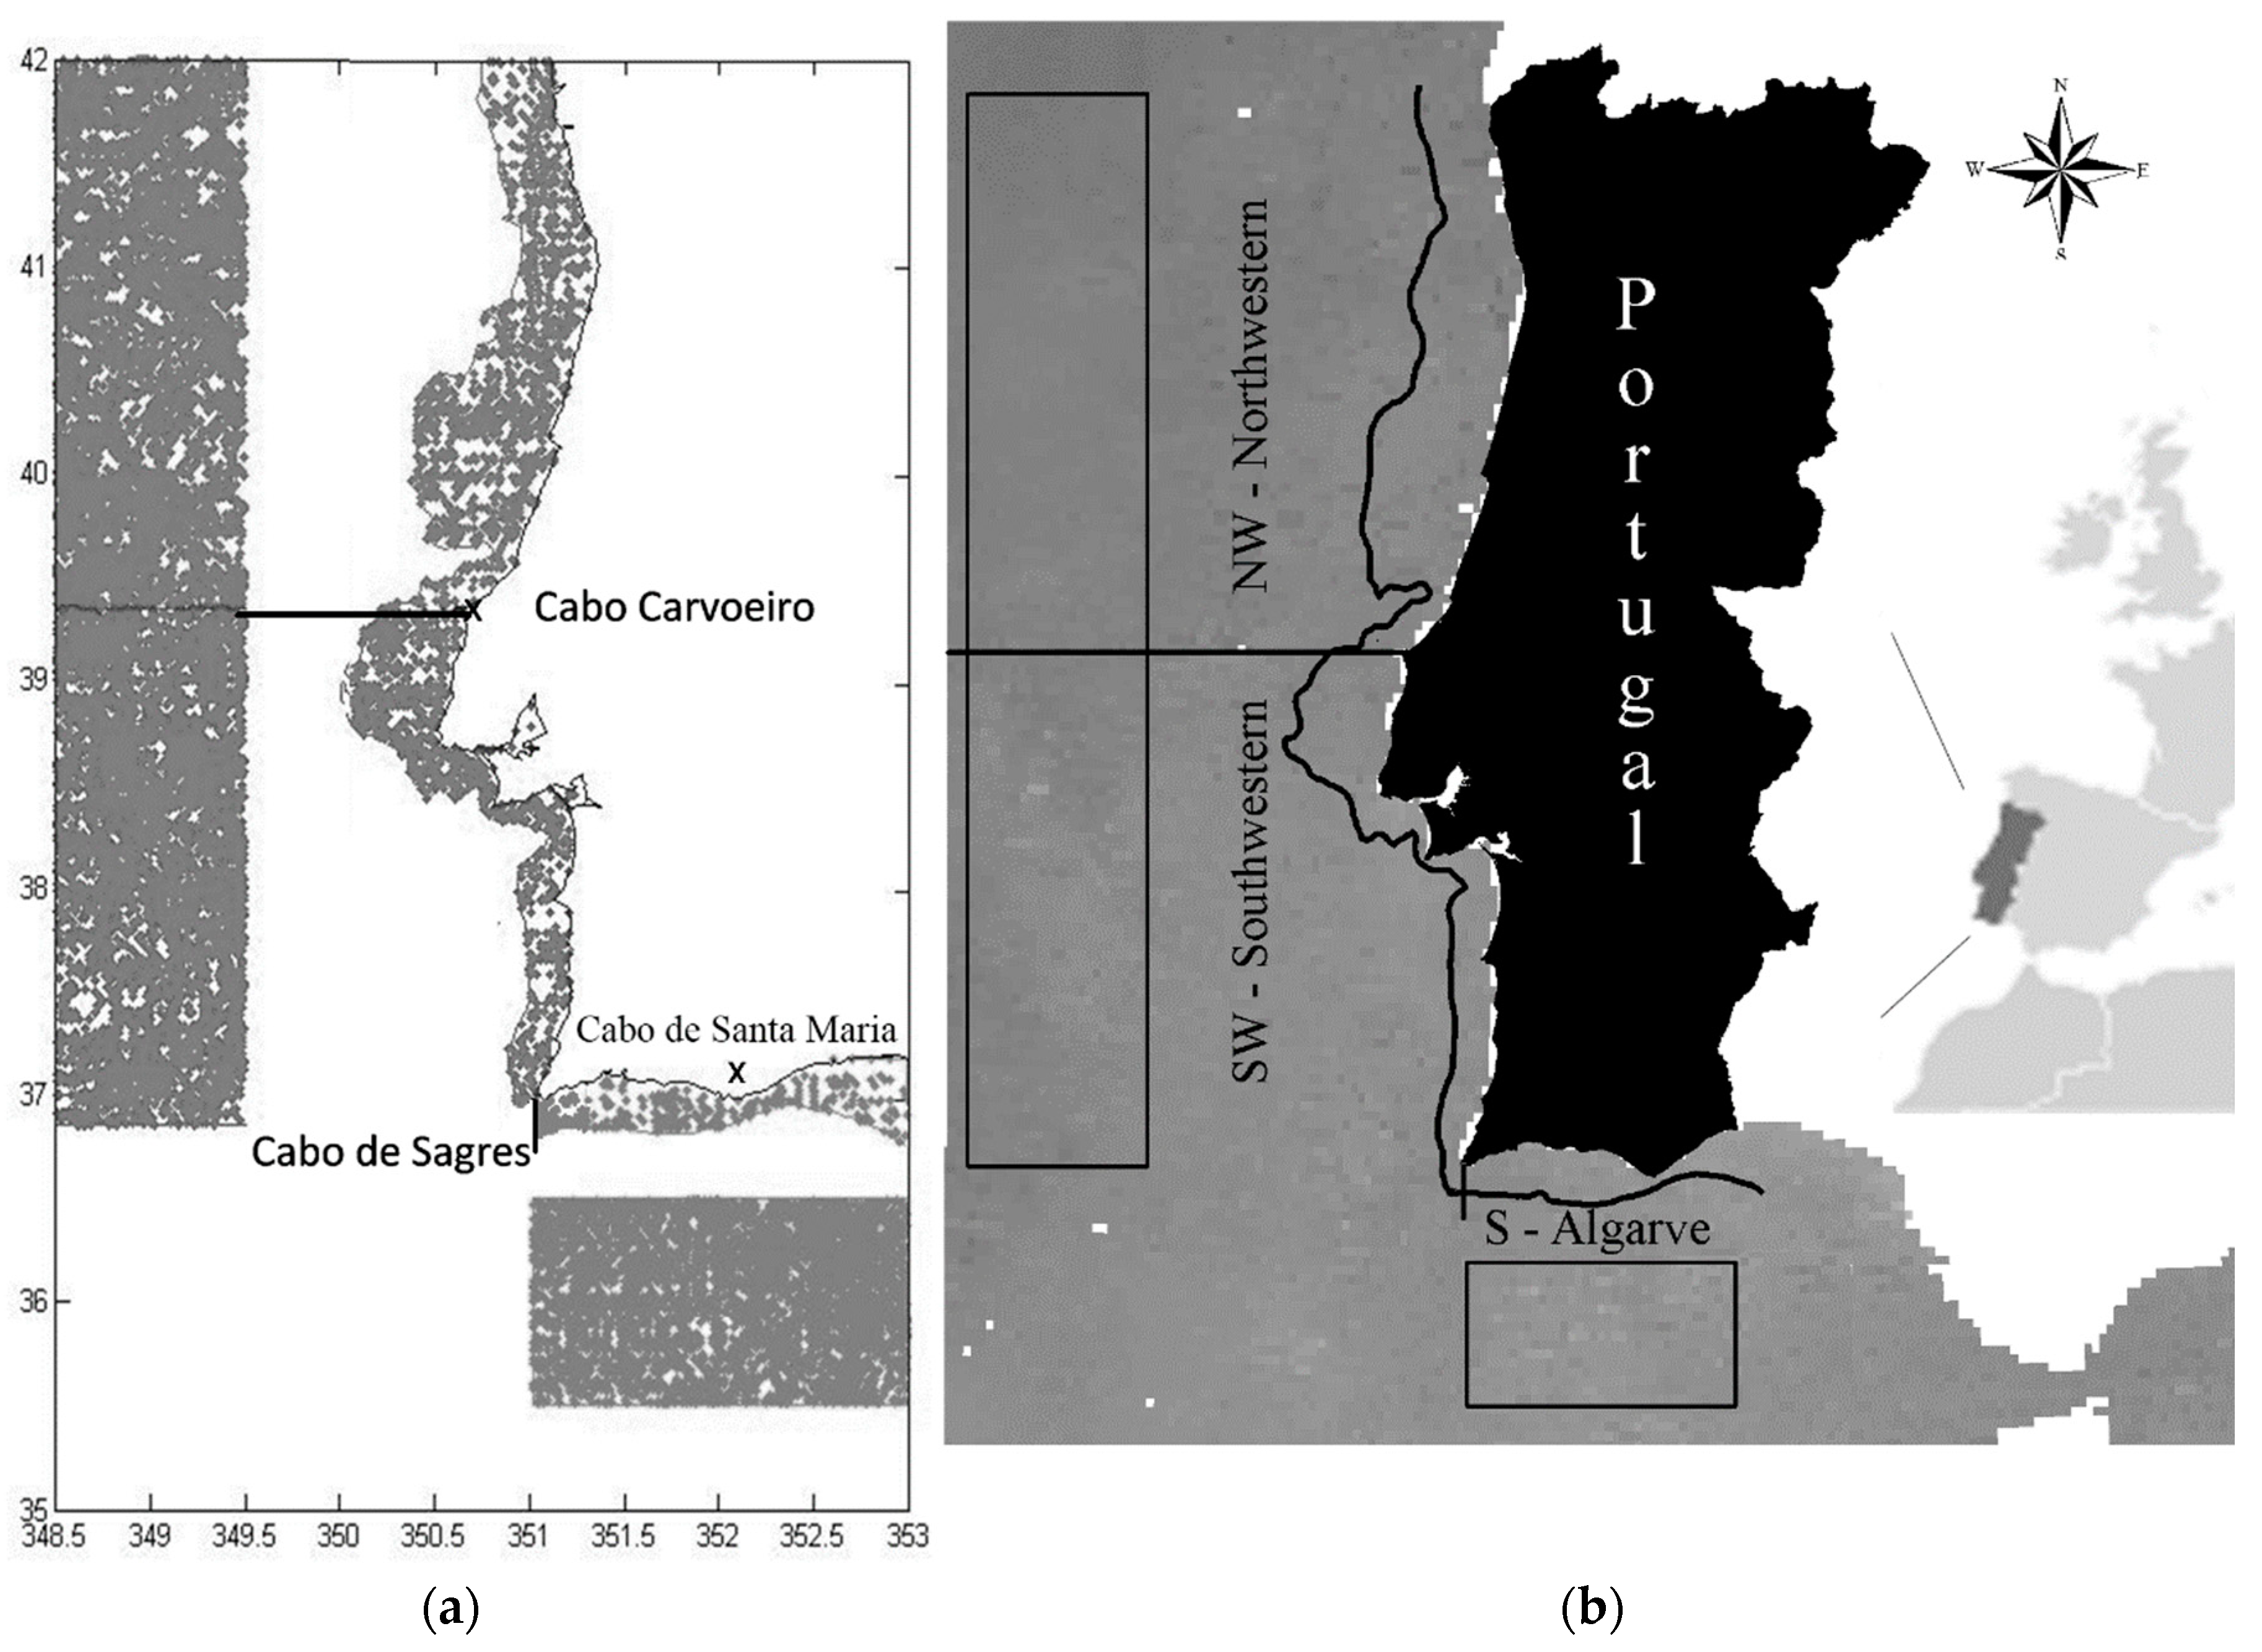
The Portuguese coast is a very complex ecosystem as far as the upwelling regime is concerned [
5] proposed that the Iberian Margin could be divided into different upwelling regions, each showing a different upwelling pattern related to characteristic topographical constraints. [
5,
6] documented the presence of a complex mesoscale activity along the Portuguese coast that generates distinct upwelling structures in different spatial scales. [
5,
7] recognized the necessity of specific wind regimes to generate coastal upwelling along the Iberian Margin only due to its orientation: northerly winds produce upwelling off the western coast whereas westerly winds drive it off the southern coast. The main oceanographic features referred to in the literature for the Iberian Portuguese coast are the Iberian Poleward Current (IPC), the upwelling jet and associated features like upwelling filaments and eddies and the Western Iberia Buoyant Plume [
8]. According to the first climatological analyses using wind and sea surface temperature (SST) datasets for periods before 1970, maximum coastal upwelling occurs in the peak summer months (July to September), and minimum in winter [
9,
10]. After the 1970s several changes in this pattern were reported [
2] namely a delay in the peak of intensity of the upwelling-favourable winds [
11,
12]. At the same time, some authors found an increasing trend in upwelling intensity [
11,
13], but others reported a decreasing trend [
14,
15]. Therefore, these changes in upwelling intensity during spring/summer need to be investigated.
The pioneering work of [
13] states that an intensification of coastal upwelling as a result of the strengthening of the alongshore wind induced by an increased land-ocean pressure gradient related to the global climate change. Subsequent investigations have reached contradictory results about the temporal fluctuations of the upwelling in Iberian Peninsula. Based on measured coastal winds, [
16] 2004) concluded that the upwelling index off the western Iberia coast weakened from the 1940s to the 2000s. Later, based on a statistical model, this result was confirmed by [
17]. Based on spatial averages of satellite-derived SST, [
17] found that the upwelling variability pattern is better described as a decadal scale shift of upwelling regime intensity from weak upwelling in the 1980s to a stronger one in the 1990s. A summary of these opposed results is given in [
18]. This controversy is depicted in [
14] who argued that there was no evidence of upwelling intensity off the Iberian coast. [
19] studied the response of Iberian upwelling to atmospheric forcing in a regional climate scenario. Latter authors assumed that the process is not easily reproduced by current large-scale coupled models due to its coarse resolution [
20] and its simulation still carries difficulties, in particular, in places characterized by frequent on–off switching of upwelling and by complex coastal circulations.
Observations of upwelling, or coastal wind responsible for its establishment, indicate that it can show significant inter-annual variability, with indications of recent systematic changes possibly in response to global warming. The western Iberia system behavior was also associated with the North Atlantic Oscillation [
21]. [
6,
22] showed the presence in the Western Iberia ecosystem of different mesoscale upwelling structures that respond in different ways to the observed ocean warming, superimposed on the larger scale variability, as being the primary factor controlling the ecosystem functioning in the region. A complex structure of interleaved alongshore slope, shelf and coastal currents that interact with eddies, buoyant plumes, upwelling filaments and fronts, surface layer expressions of the subsurface circulation and internal waves is revealed by the latest research of [
6,
22].
This time-series study will allow us to evaluate climate and environmental changes in upwelling trends. Therefore, results can contribute to fisheries oceanography field by allowing to understand how regional upwelling dynamics affect/correlated with fisheries data or biological oceanographic features. This work uses two datasets to analyze yearly, monthly and seasonal upwelling time series in three different areas of the Iberian Portuguese coast. The datasets included satellite Remote Sensing (RS: from 1985 to 2009) and a longer time series of “in situ” observations, International Comprehensive Ocean—Atmosphere Data Set (ICOADS: 1950 to 2010) that were compared for: (i) assess patterns among time series among datasets; (ii) assess differences in time series among geographic areas. A multi-model time-series analyses approach was employed to assess variation and sudden shifts in upwelling trends.
3. Results
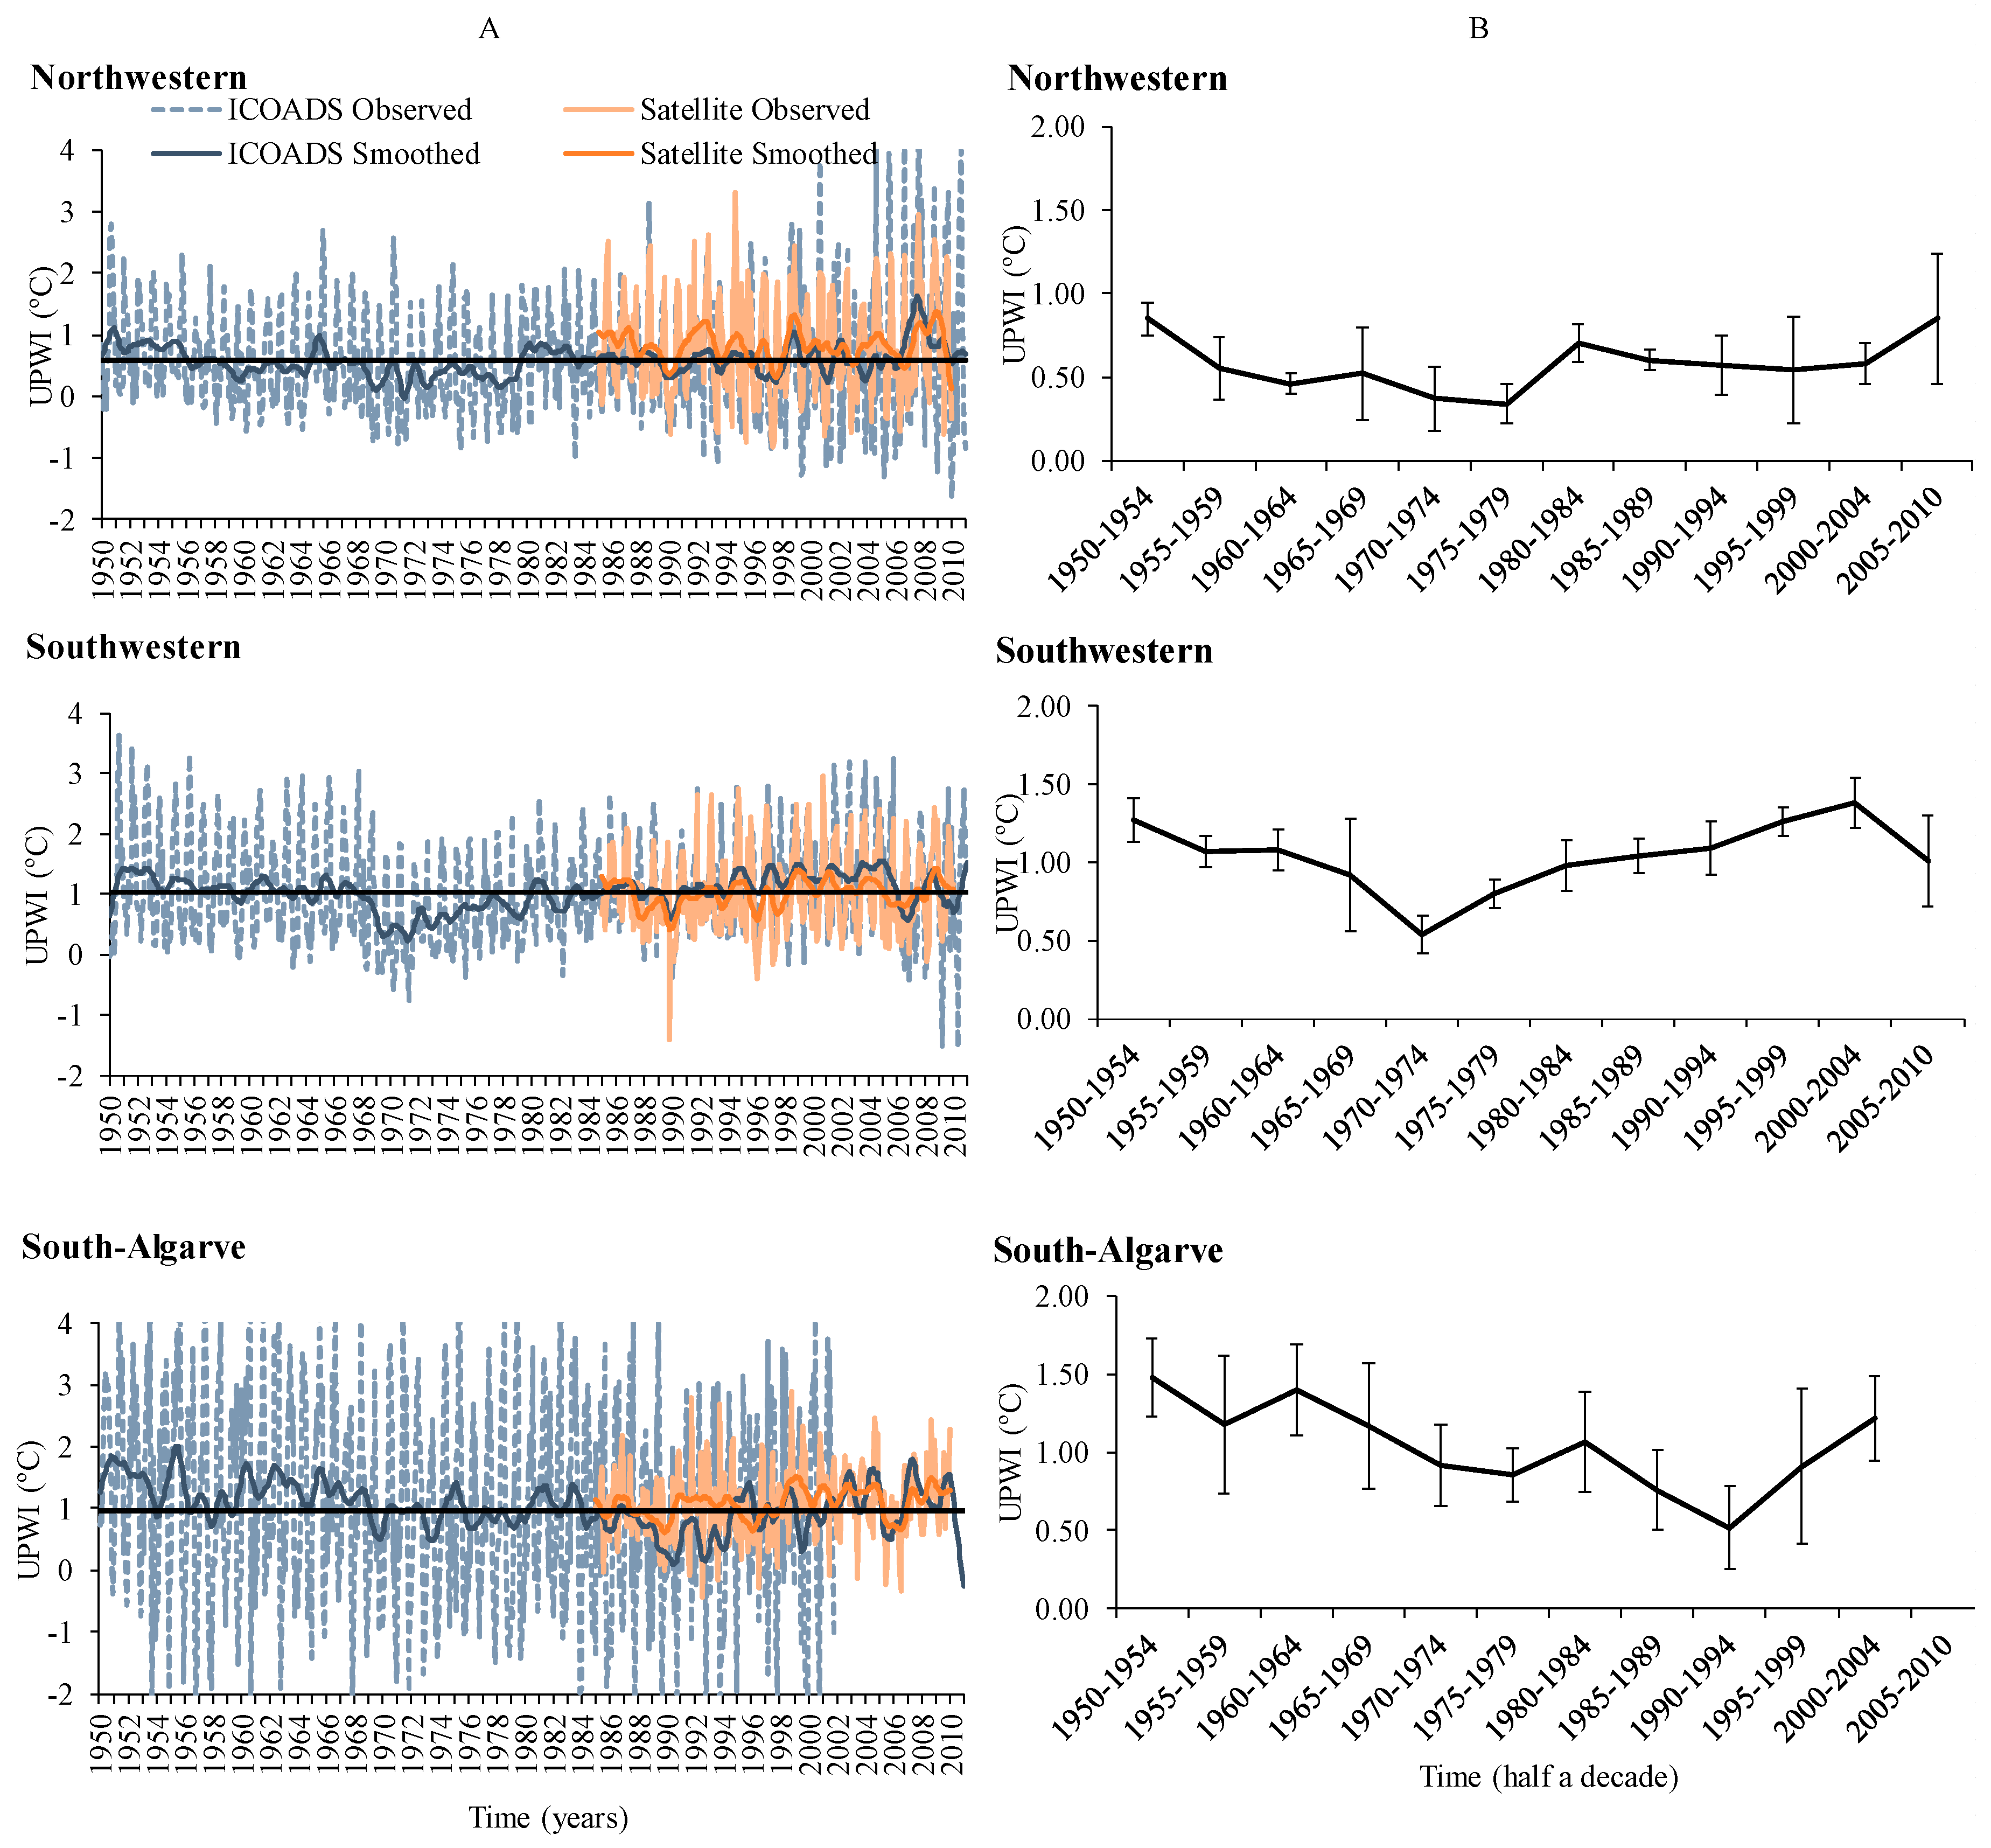
The observed monthly UPWI time series show a large variability (
Figure 2, Table 2). Overall, observed and smoothed (LSD) UPWI monthly values together with the half a decade averages (
Table 1 and
Table 2) of the UPWI showed that:
- (i)
all the areas show the highest UPWI values in the 50s;
- (ii)
the UPWI values are higher in S, which means that the thermal gradient between offshore and coastal waters is higher there. Moreover, the UPWI standard deviations are higher in this area;
- (iii)
overall UPWI generally decrease until mid 70’s in SW area, late 70s in NW area and mid 90s in S area;
- (iv)
in the NW and SW UPWI increases since the 1980 and 2005;
- (v)
in the S contrary to both NW and SW, the UPWI generally decreased along the entire time-series until 1995, increasing afterwards;
- (vi)
half a decade averages of the UPW are positive, which indicates predominance of upwelling regime;
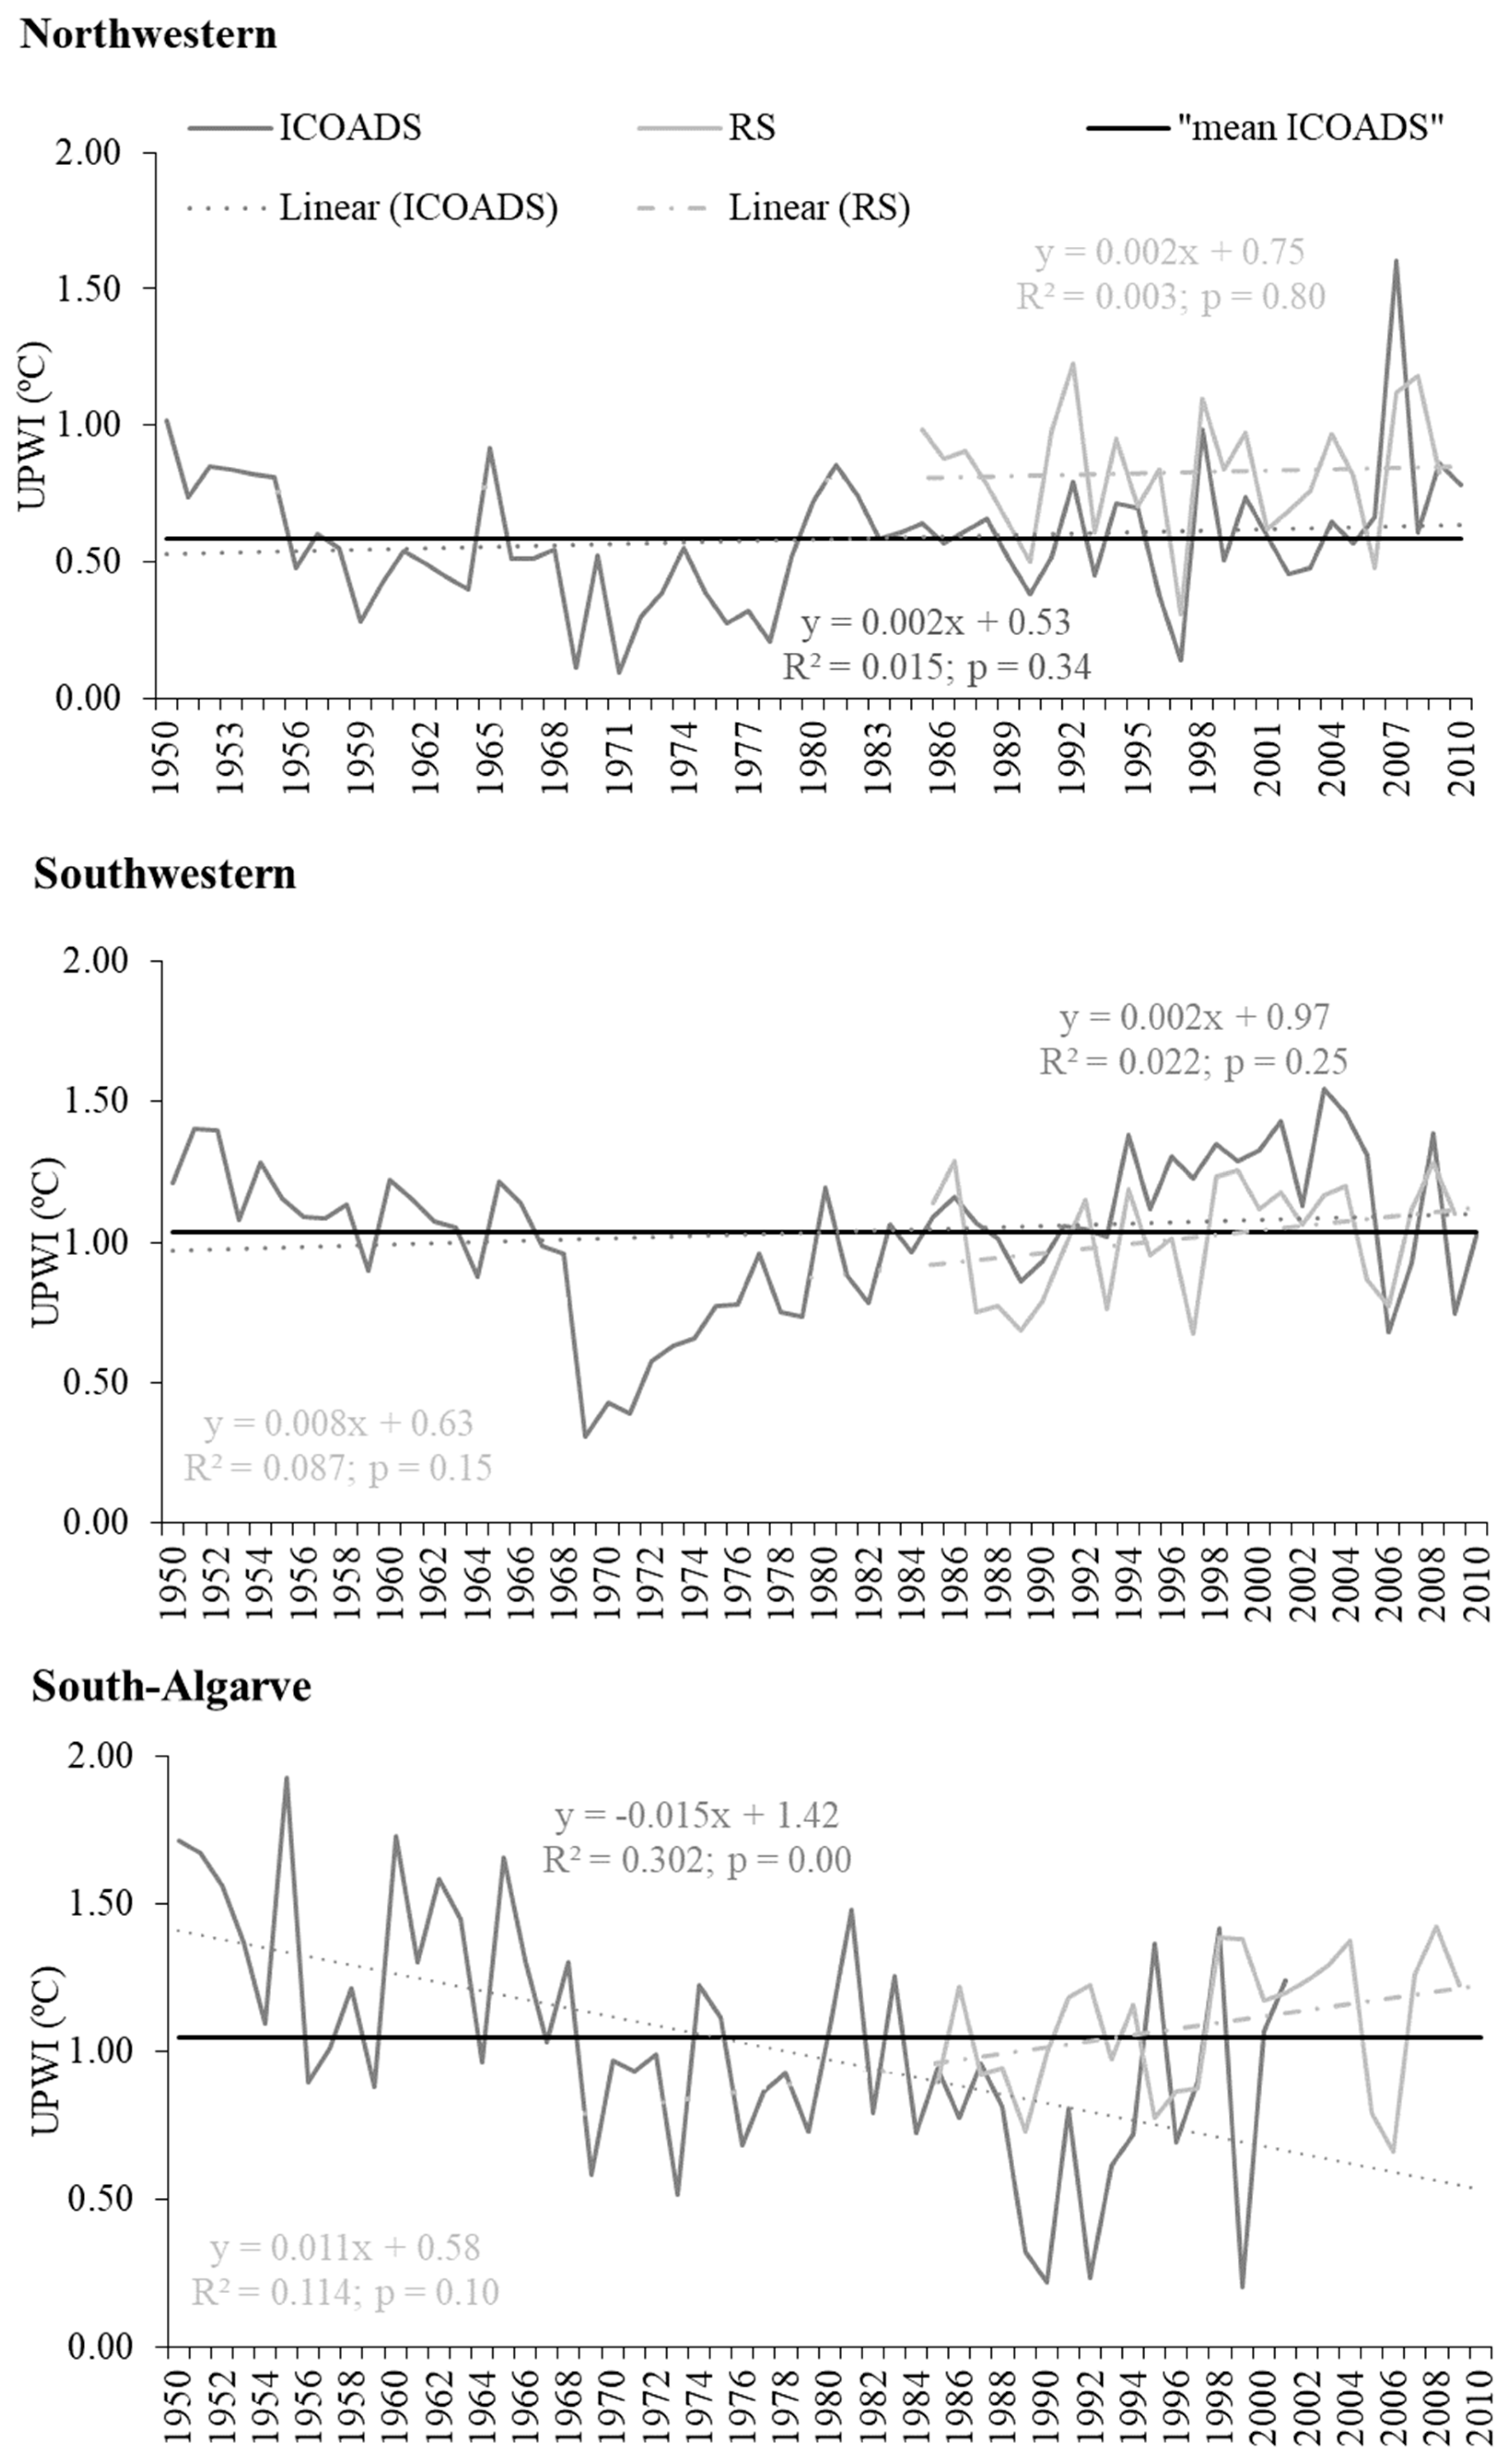
The long-term (ICOADS: 1950–2010) yearly linear UPW trend increased smoothly (un-meaningful) in NW and SW (0.02 °C decade-1) while in the S the UPW (−0.15 °C decade-1) decrease at a stronger rate (approximately 7 times more) than in western areas (
Figure 3,
Table 3). Similar to ICOADS findings the short-term (RS: 1985–2009), the yearly linear UPWI trend increased smoothly (un-meaningful) for the NW and SW coasts (0.02 °C decade-1 and 0.08 °C decade-1). However, the linear yearly trend in the Southern area increased for RS data (0.11 °C decade-1) while in ICOADS it decreased (ICOADS: 1950–2002). Overall, the linear regression model was only statistically significant (
p < 0.01) for S area regardless of the dataset (
Figure 3). Nevertheless, the coefficient regression values (R2–value) were low independent of the area and dataset.
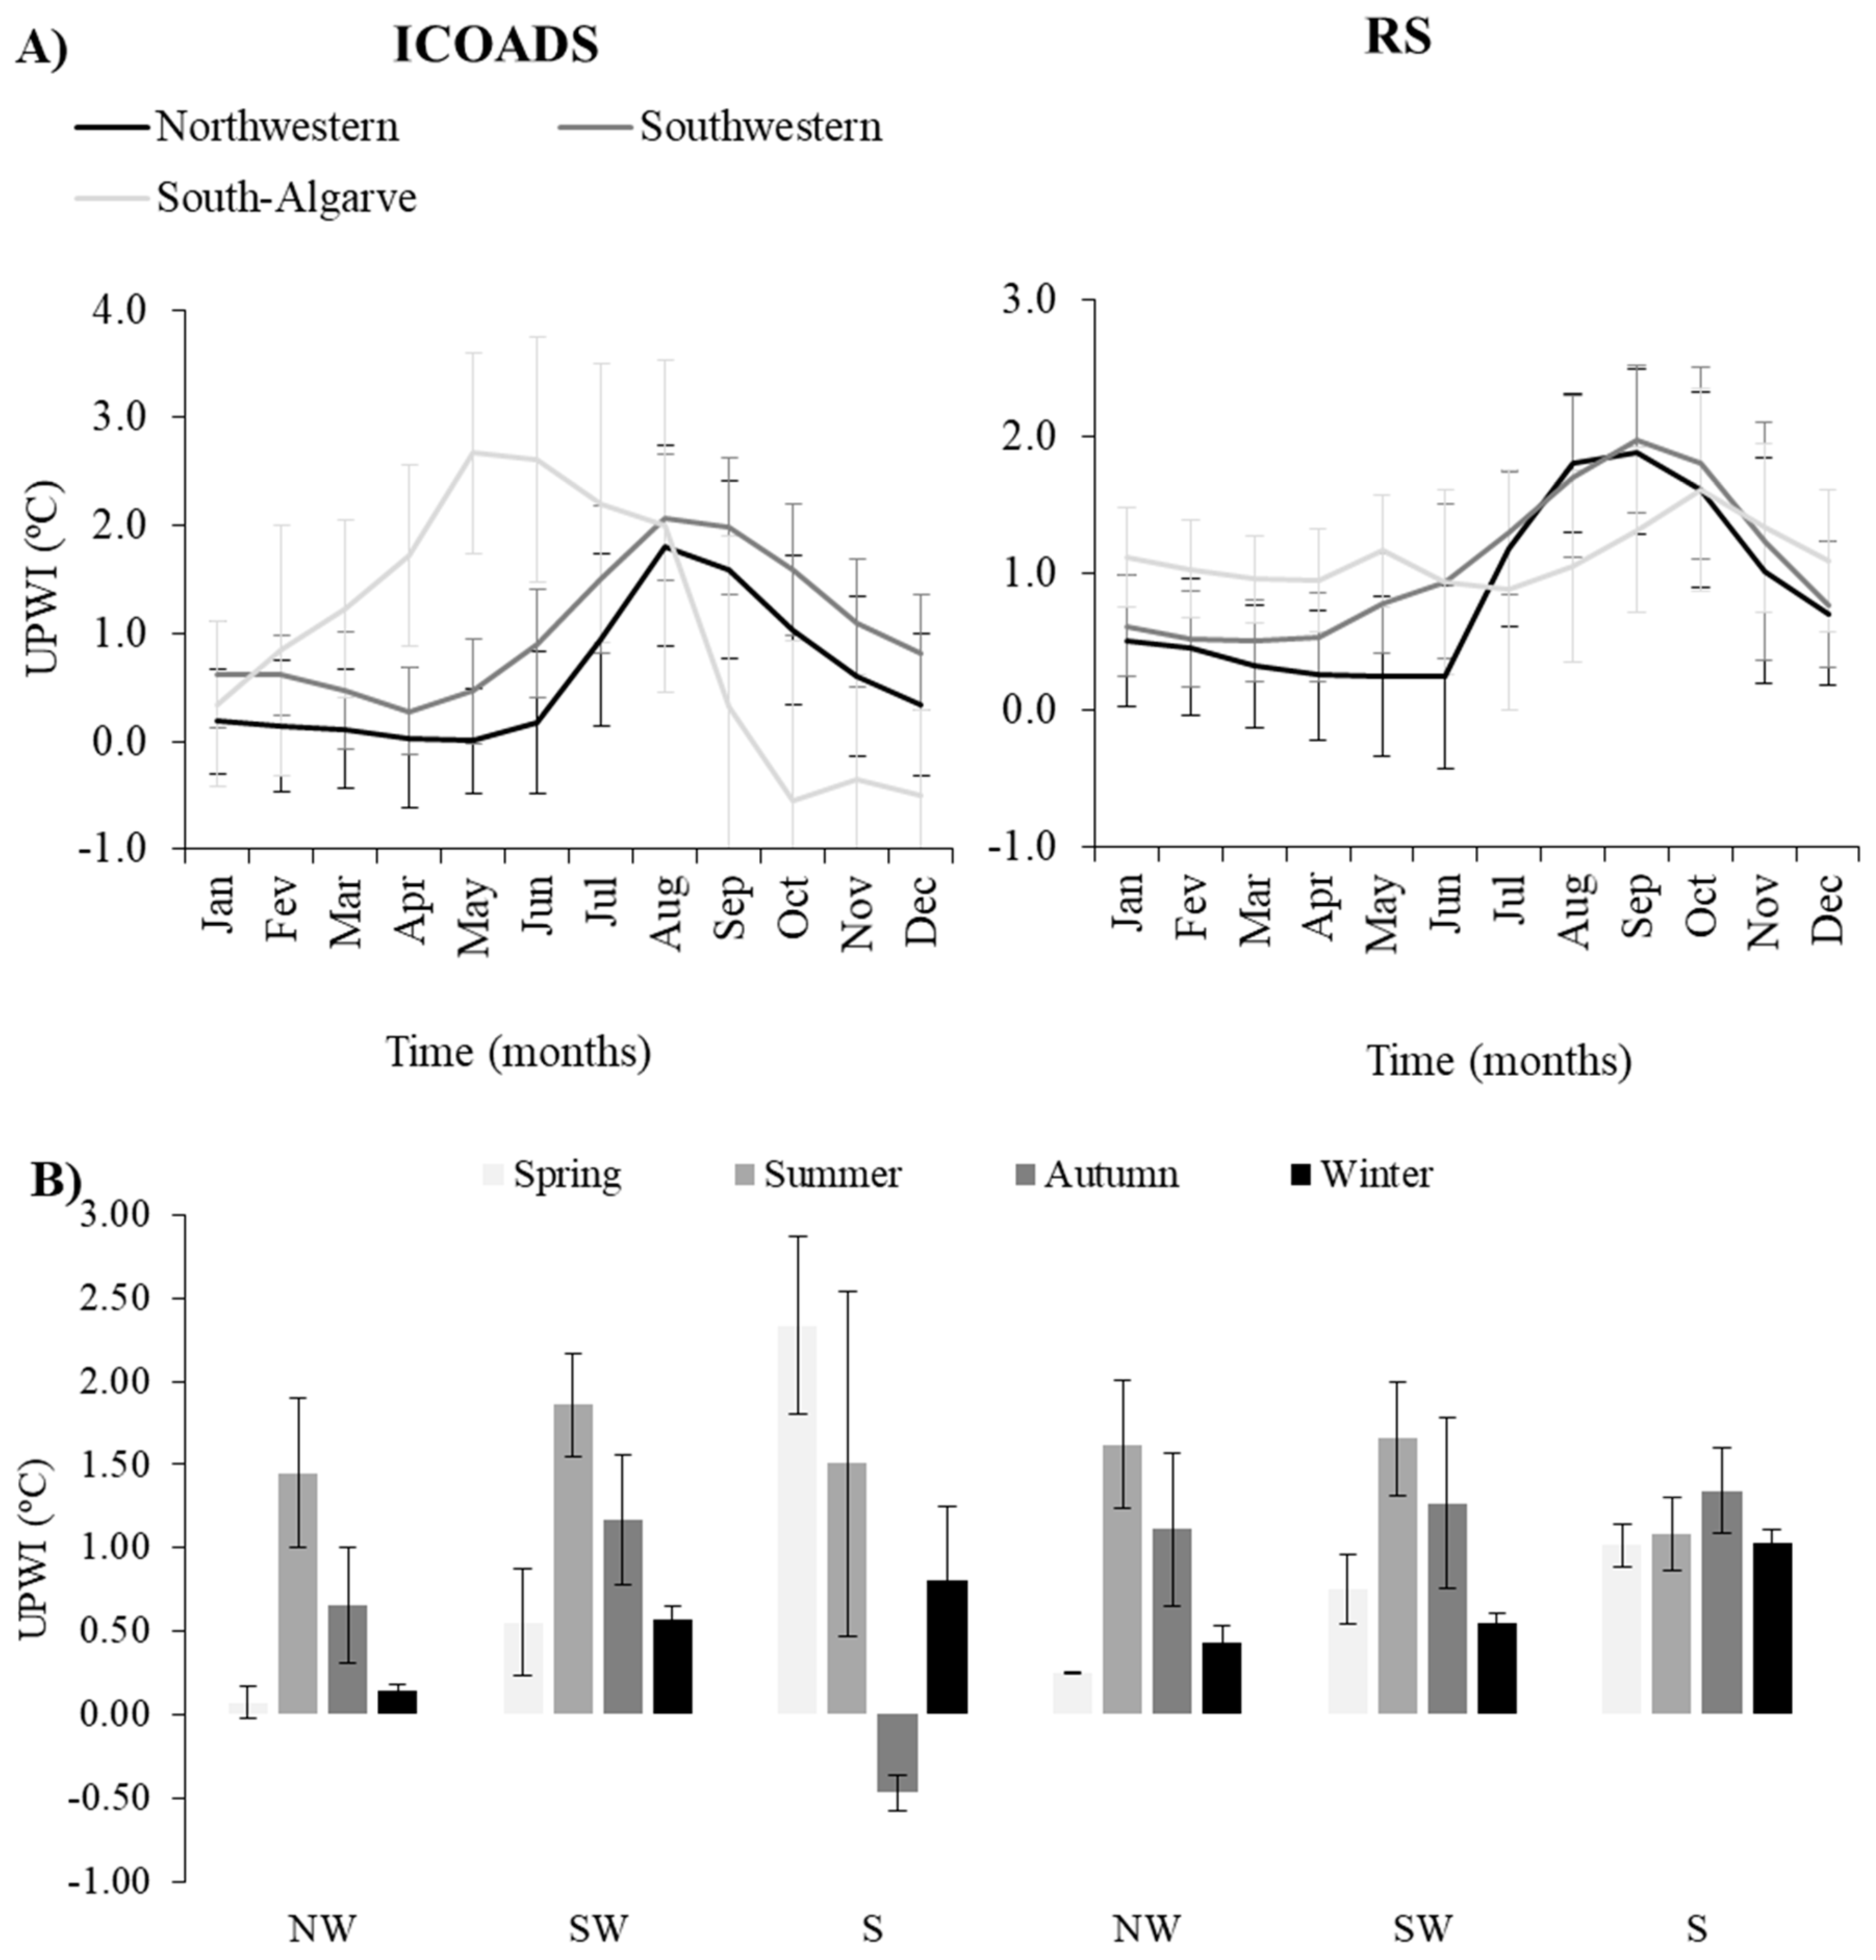
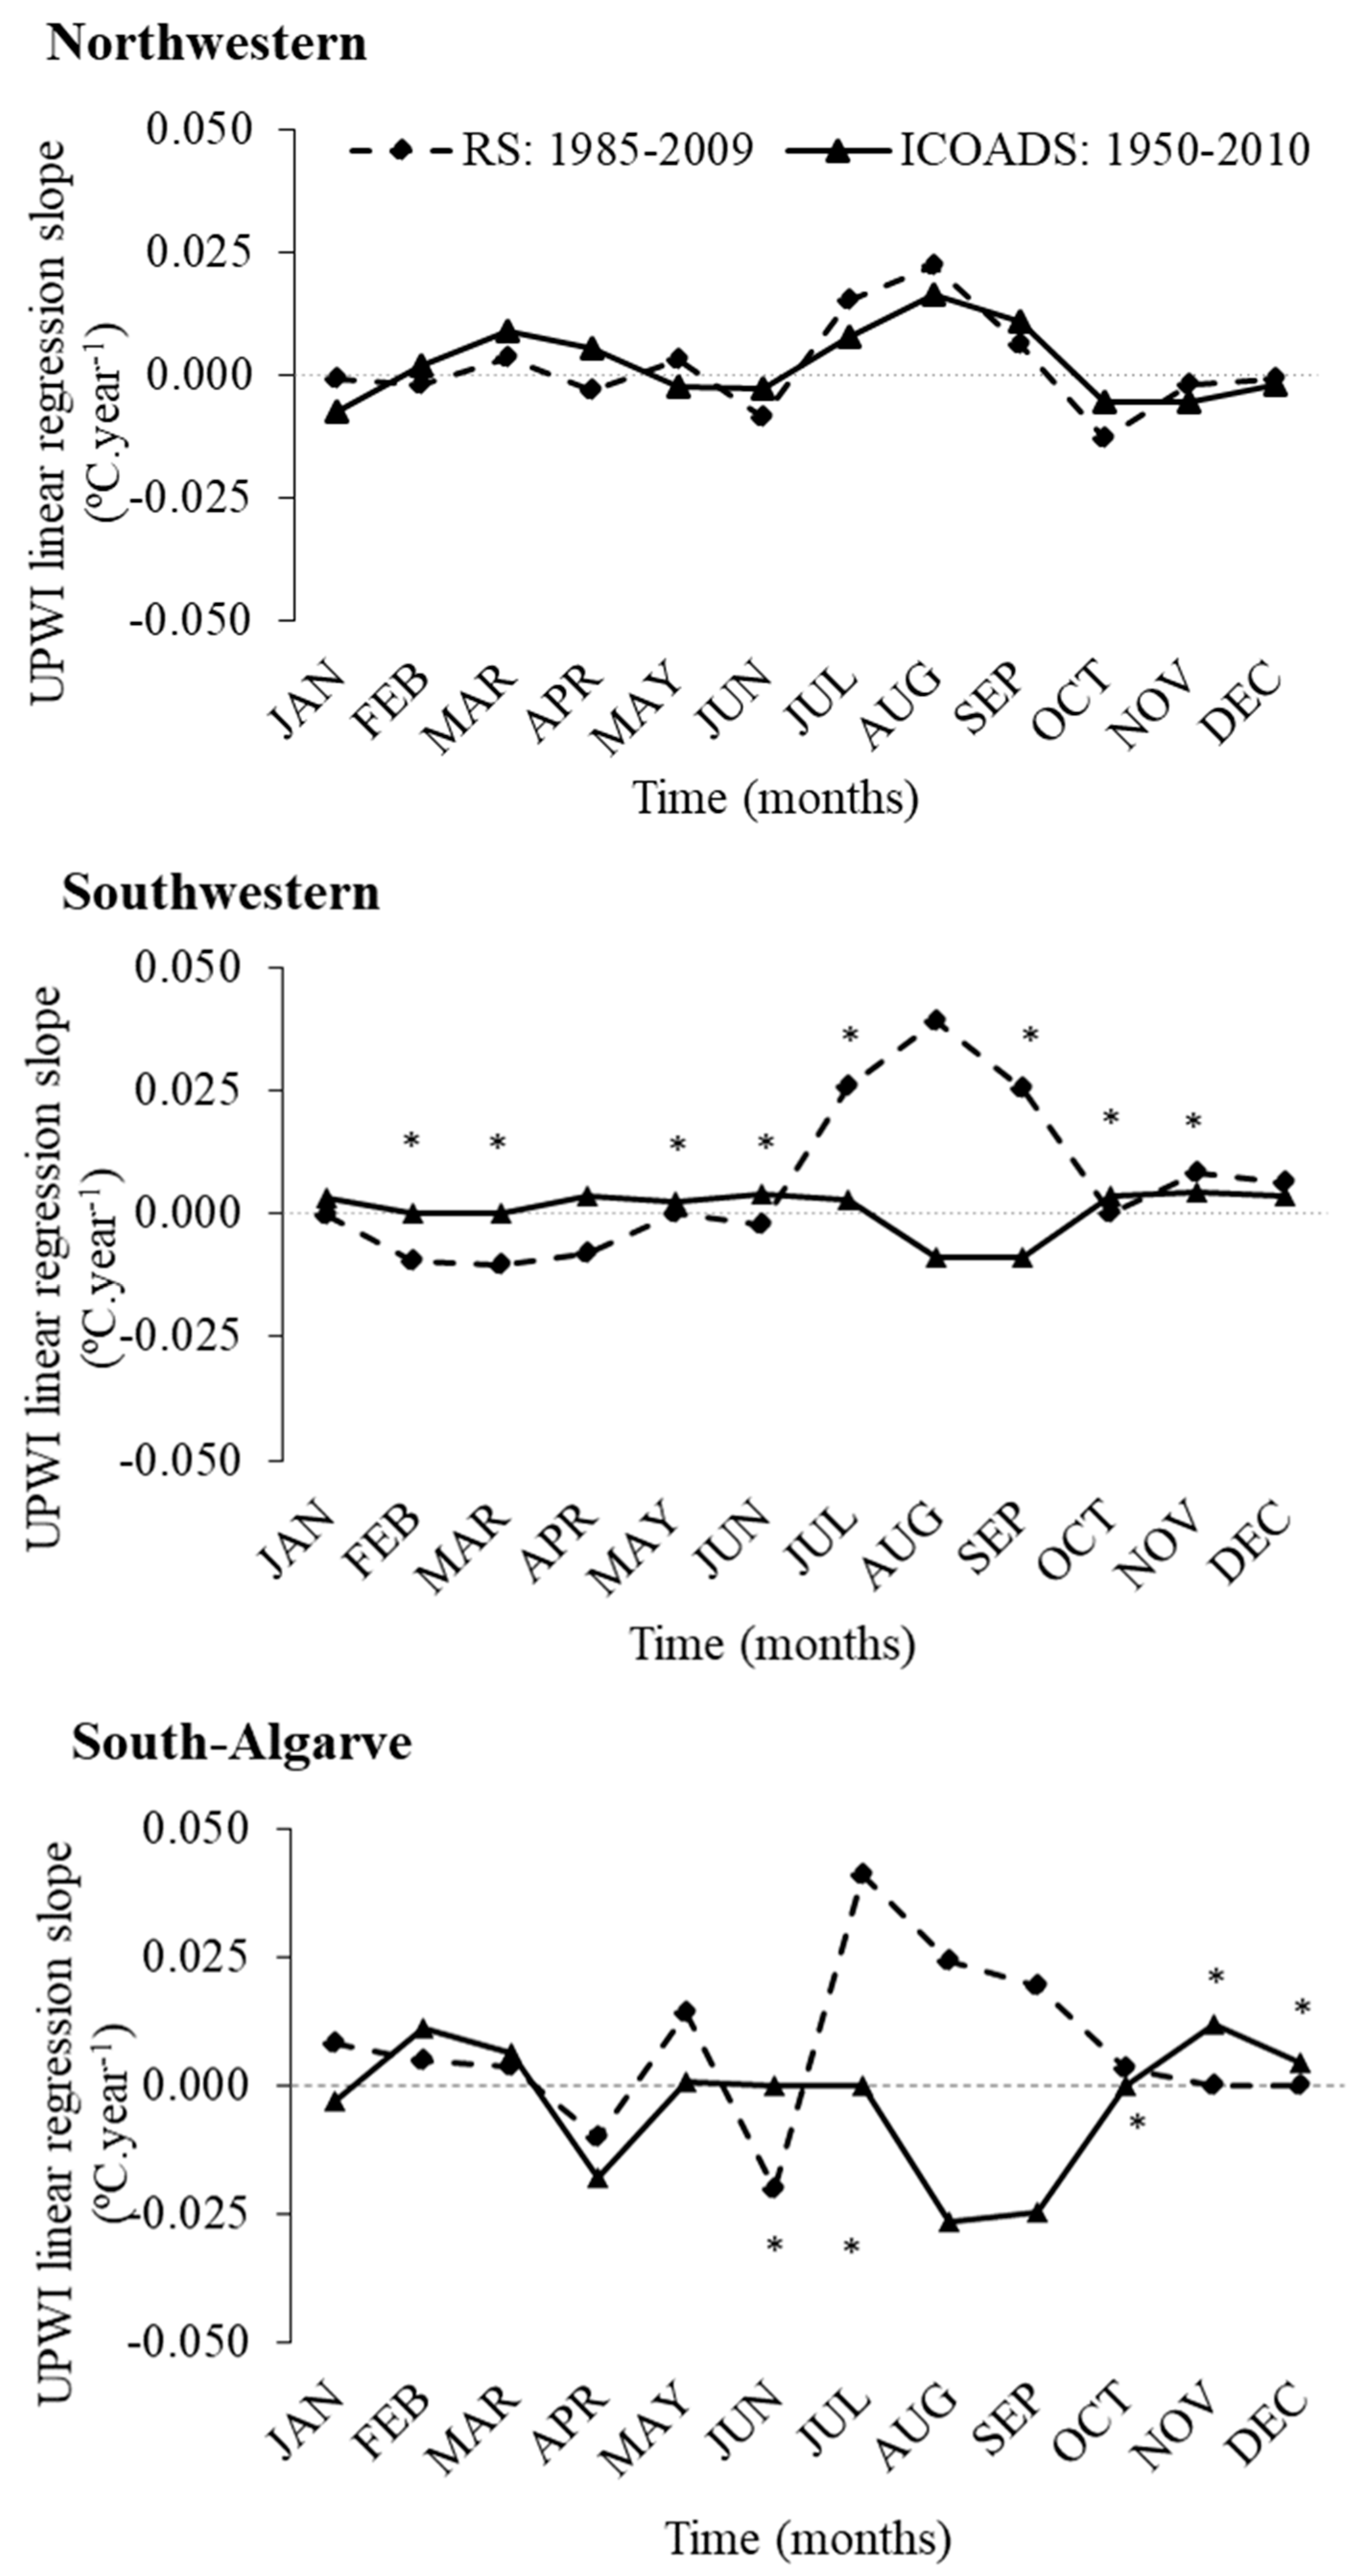
The yearly evolution of monthly UPWI-average (
Figure 4;
Table 2) show a seasonal pattern (
Figure 5) characterized by:
- (i)
in the west (NW and SW) coast for both databases (IOCADS and RS) the UPWI index values are lower from January until June peaking in August-September and decreasing after September until December;
- (ii)
in S some differences are found among databases regarding the evolution of average monthly UPWI index over the years. In the ICOADS dataset the upwelling season (May to August) differed from NW and SW coasts (July to September).
- (iii)
The seasonal pattern of UPWI (
Figure 4B) is similar in ICOADS (ICOADS: 1950–2010) and RS (RS: 1985–2009) datasets in NW and SW coasts (increase of UPWI values from spring to summer when it peaks and a decline thereafter in autumn and winter), regardless of the season. In S coast the ICOADS (ICOADS: 1950–2010) seasonal averaged data reveal large UPWI values in spring and summer, with a drop into negative values (downwelling) in autumn. After autumn in S UPWI average seasonal value increased again in winter. In S coast the RS data (RS: 1985–2009) reveal that the UPW seasonal variation in recently decades are similar to seasonal patterns found for both RS (RS: 1985–2009) and ICOADS (ICOADS: 1950–2009) for NW and SW.
- (iv)
In NW and S, in recent decades (RS: 1985–2009), an increase in UPWI in Autumn was recorded; in S, in recently decades, a decline of the average Spring and Summer UPW values are observed relative to long-term data (ICOADS: 1950–2002).
Higher yearly UPW intensity rates (slope of the linear regression analyses) were recorded for RS than in ICOADS dataset in June/July-August in SW and S areas (
Figure 5;
Table 3). In the SW, however, in recent years (RS: 1985–2009) in winter (February and Mars) and early spring (April) of the UPWI index was lower than for long-term data (ICOADS: 1950–2010).
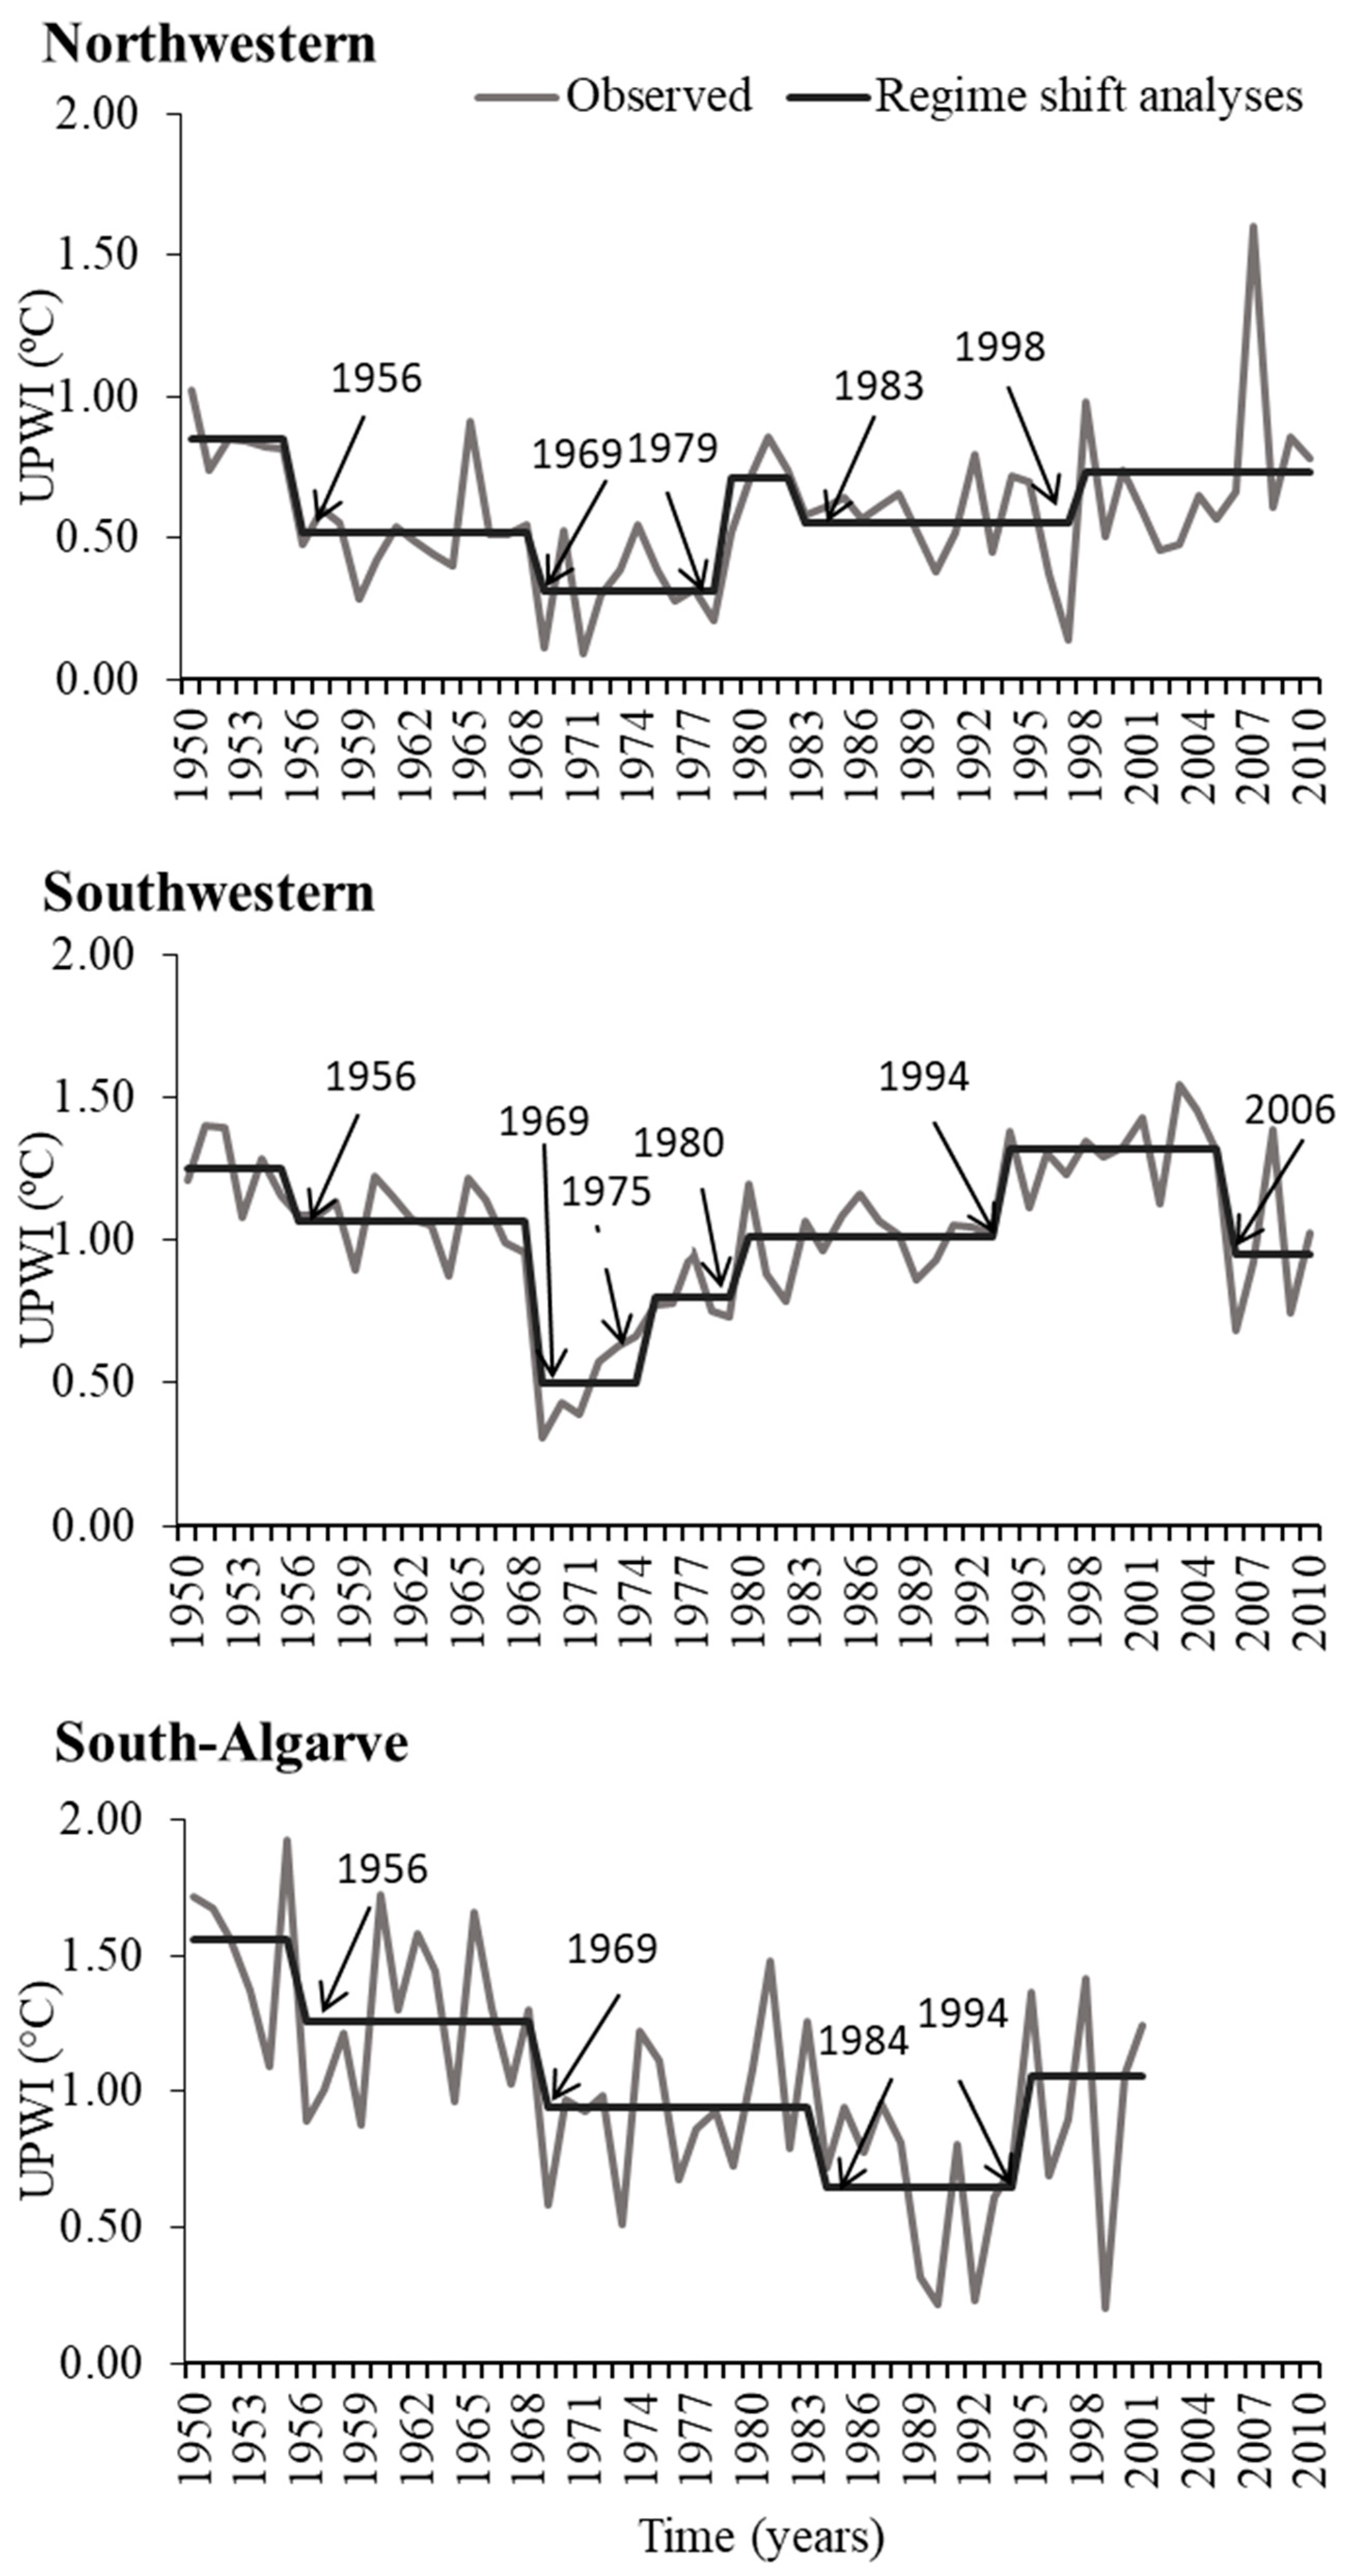
The observed yearly time series trends agree with the estimated Regime Shift Index (RSI) trends (
Figure 6;
Table 4). The RSI reveal considerable relaxation from 1956 to 1968 in all areas. Comparing UPWI values using 1950s as the historical period the RSI analyses showed that:
- (i)
in NW coast after 1956 a significant drop in UPW intensity was observed over a 23-year period with two markedly sudden changes periods after 1956 and 1969. By 1979 the UPWI rise to values similar to those observed in the beginning of the time series (0.31 °C to 0.71 °C; RSI = 0.82) enduring until 1983 when another shift is detected, with the decrease of the UPW (0.71 °C to 0.55 °C; RSI = −0.20) until 1998 when UPWI rises to similar values of the previous shift (0.55 °C to 0.73 °C; RSI = 0.61); in latter decades UPW intensity is lower than in the early 1950s.
- (ii)
in the SW area before 1975, two significant shifts, that lasted 20 years (1956–1968 and 1969–1975), showing a decline in UPWI intensity are found. Afterwards, a clear upwelling intensification was recorded in three consecutive periods that lasted thirteen years: from 1975 to 1980 (0.50 °C to 0.80 °C; RSI = 0.90), from 1980 to 1994 (0.80 °C to 1.01 °C; RSI = 0.45) and from 1994 to 2006 (1.01 °C to 1.32 °C; RSI = 0.85) when the UPWI reached the maximum values in the entire time series and then abruptly drops resulting in a new relaxation period (1.32 °C to 0.95 °C; RSI = −1.26), to values lower than in the early 1950s; in latter decades, the UPWI values are lower than in the early 1950s.
- (iii)
in the S area, after mid 1950s (1956), a relaxation of UPWI was recorded in three consecutive periods: 1956–1968, 1969–1983 and 1984–1994 (0.94 °C to 0.65 °C; RSI = −0.52). That means that a significant decline over more than thirteen five years. After 1995, the UPWI values show an intensification period (0.65 °C to 1.06 °C; RSI = 0.89) that continues until the end of the time series (2002); in later decades UPWI intensity is lower than in the early 1950s.
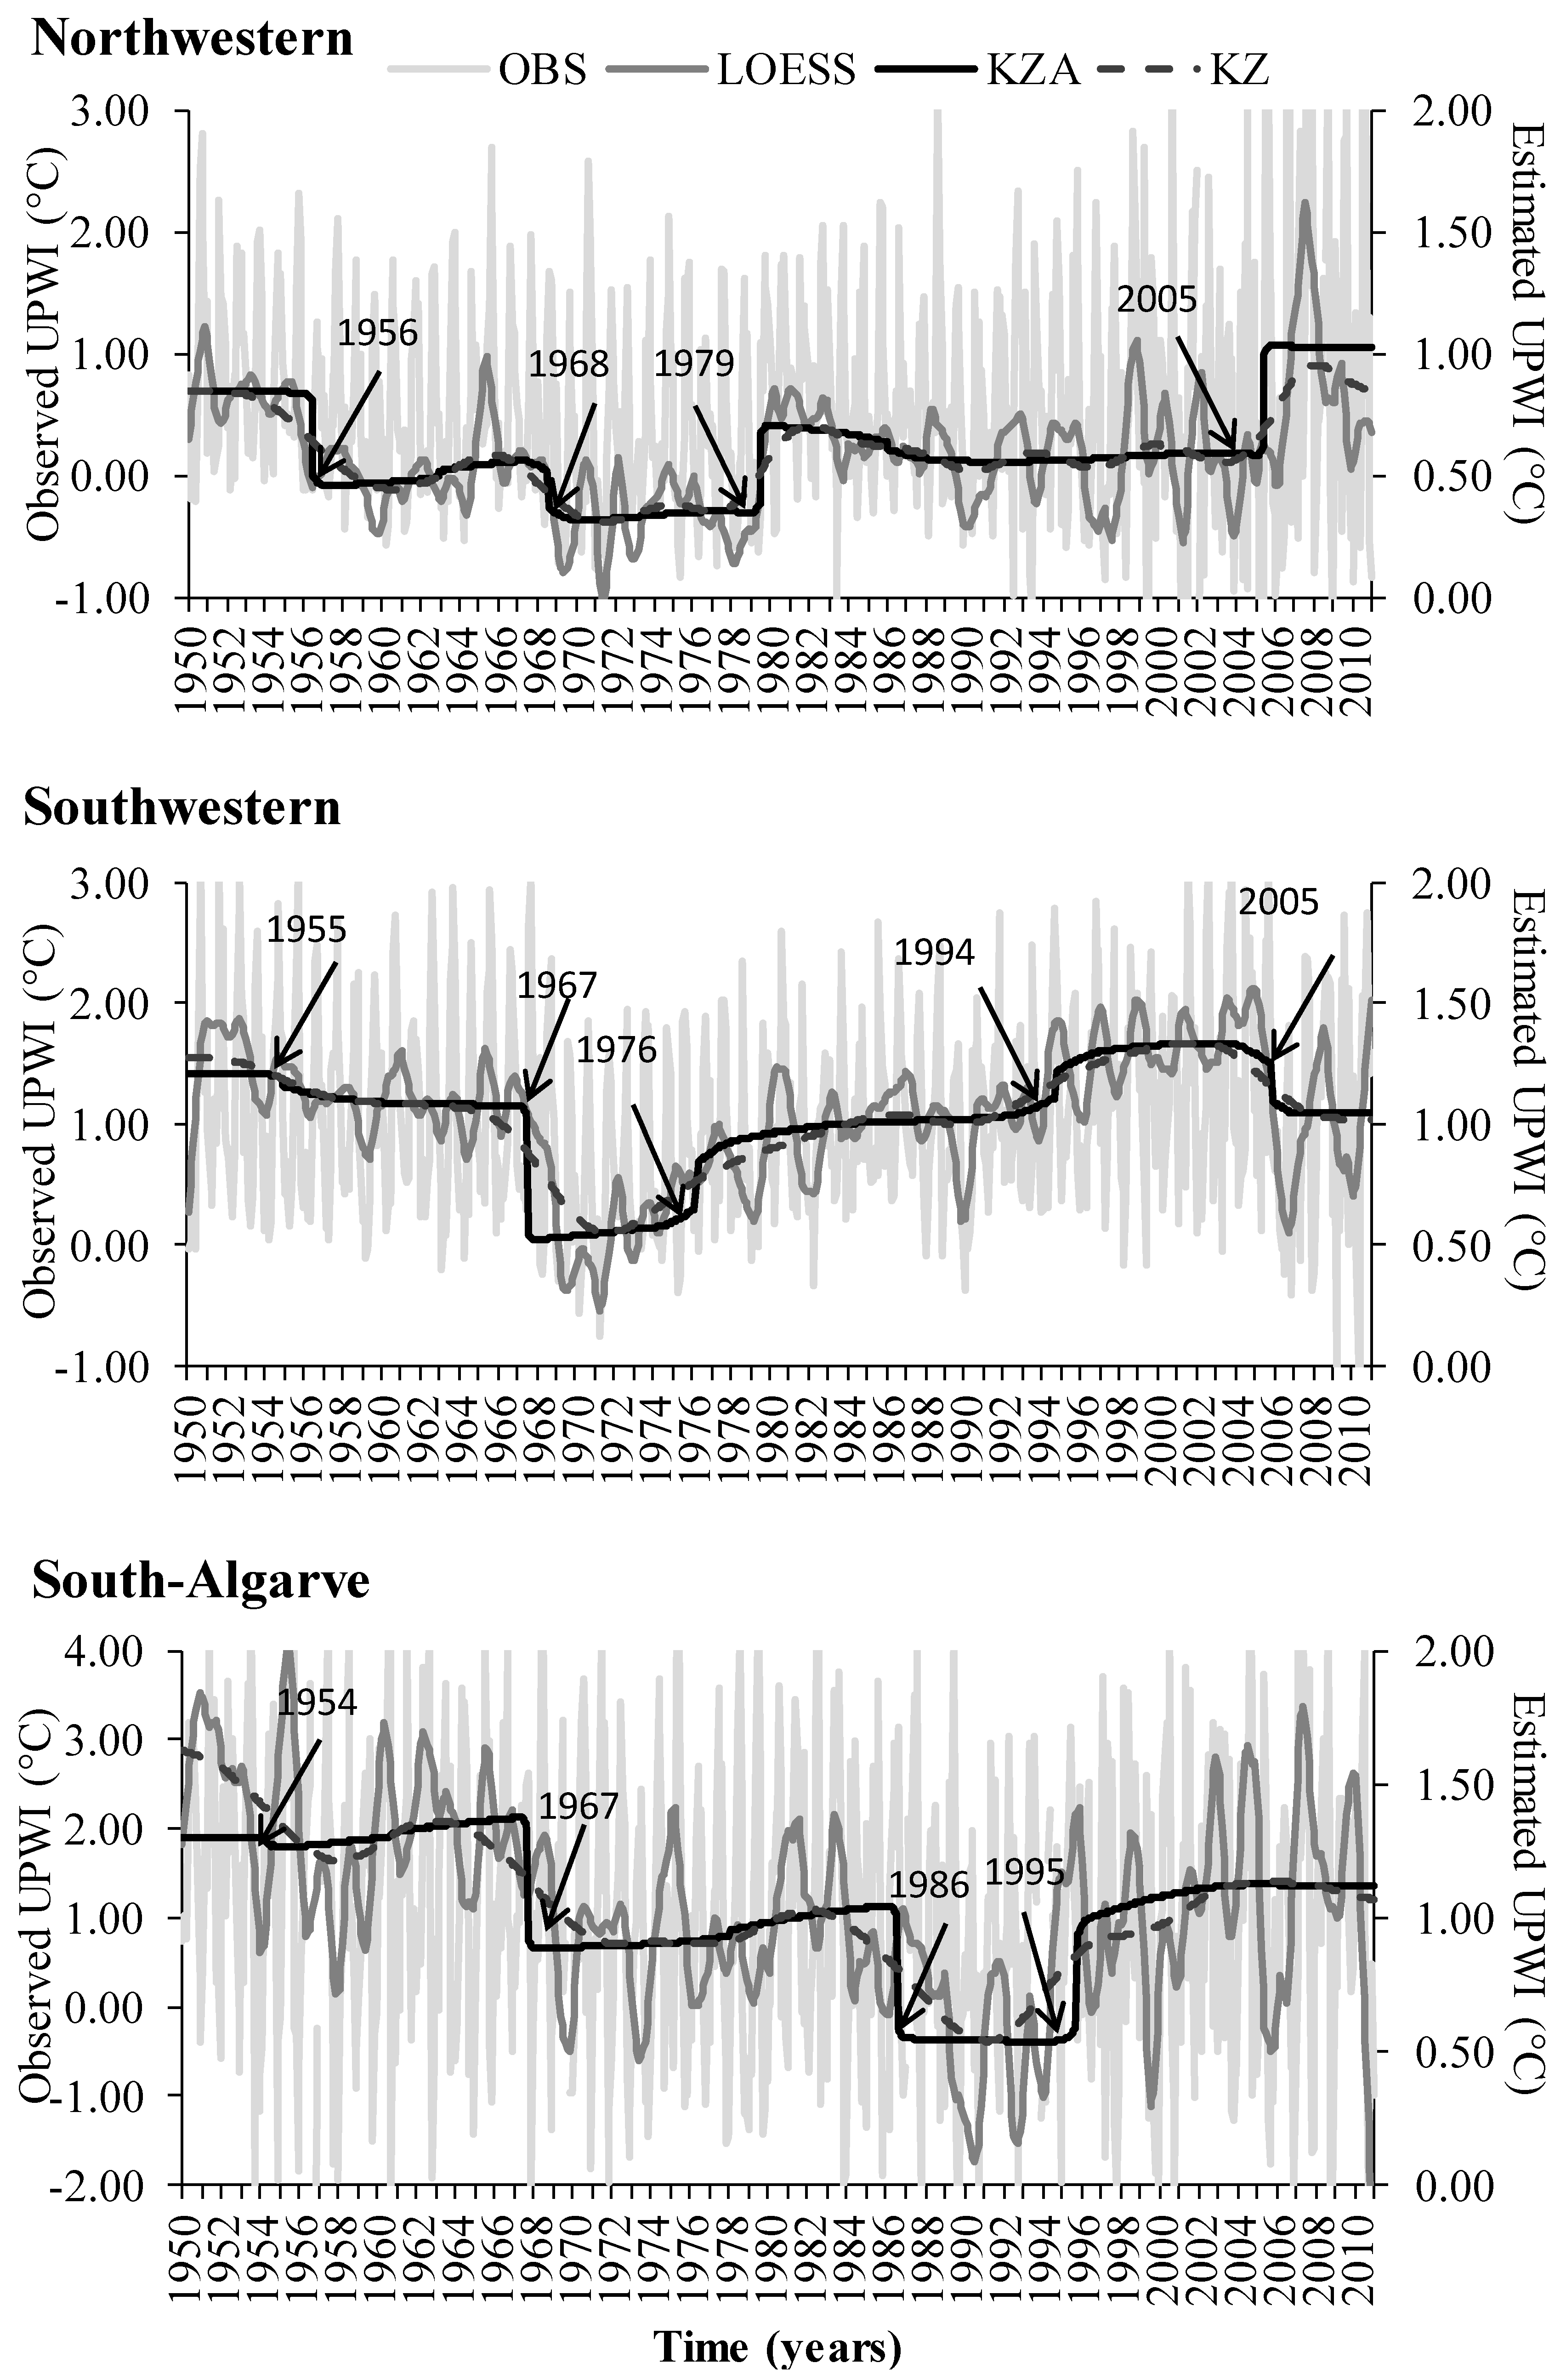
The results from the KZA and KZ analyses (
Figure 7;
Table 5) resemble some periods detected previously by the RSI analyses. In both analyses (RSI and KZA/KZ) the same two UPWI relaxation periods (from 1956 to 1959 and from 1968–1969 to 1979) were observed in the beginning of NW time-series. They lasted over 23 years, with approximately the same time interval recorded for RSI: from 1956 to 1968 and from 1968–1969 to 1979. After 1979 two shifts revealing a progressive increase of UPWI were identified by the KZA and KZ: (i) a first rise of the UPWI from 1979 to 2005 and (ii) afterwards another increase from 2005 onwards, when the UPWI values reach a maximum.
For the SW, KZA and KZ results were equivalent to previous obtained by the RSI analyses.
In S, KZA and KZ overall showed also similar results to those achieved by the RSI analyses, that is a long time period (~35 years) of UPWI decrease with two periods of sudden shifts, rather than 3 as in RSI: from 1967 to 1986 and from 1986 to 1995 (with UPWI reaching a minimum and even negative values, that is downwelling prevalence) followed by recover of the mean UPWI values after 1995.
Comparing the half decade averages of the UPW index long-term time-series from ICOADS dataset (recall
Figure 2b) with the results of the sudden changes (
Figure 6 and
Figure 7), it was possible to observe similar results:
- (i)
a decrease of the UPWI half-decadal values until 1970–1975 in NW and 1970-1975s in the SW
- (ii)
in S, a continuous decline in half-decadal is observed until 1995.
Overall, RSI, both KZ and KZA and half-decadal observations reveal that in the late 2000s the UPW was lower than in the early 1950–1960s, excluding some peaks in particular observed years/half-decades periods.
4. Discussion
Overall, the long-term and short-term yearly and monthly time-series have the same common trend regardless of the areas, as DFA analyses reveal, although the absolute UPWI values are different. Therefore, this allows comparison among different periods (short term: 1985–2009, and long-term: 1950–2010) as the time series are expected to be similar over time, independently of the data/years availability.
The long-term time-series (ICOADS) enables a good understanding of the evolution of the UPWI across different areas of the Portuguese coast. UPWI time series along the Portuguese Iberian coast is characterized by high inter-annual and monthly variability, as shown by observational data. Considering monthly smoothed-LOESS and linear yearly trends, in the last 60 years (ICOADS: 1950–2010), the results showed that UPWI intensification rate in NW and SW was 0.02 °C decade-1, while in the S UPWI weakened at −0.08 °C decade-1. In S the yearly linear regression trends were statistically significant for both ICOADS and RS data. Moreover, the results also reveal that during the last 25 years (RS: 1985–2010) the entire Portuguese coast experienced a stronger intensification of the upwelling regime with S, presenting the highest increase rate (0.011 °C year-1). Therefore, comparison between recent (RS) and long-term data reveal different information regarding UPWI in two distinct periods.
The sudden shifts analyses (RSI, KZA and KZ) provide complementary information to the observed, linear, and SDL, and reveal episodes of UPWI sudden shifts superimposed to the inter-annual and seasonal variability. The UPWI trend and the shifts interval (increase or decrease the intensity of the UPWI over a period) are coincident among monthly (KZA and KZ) and annual (RSI) sudden change techniques. These analyses showed that in a given shift the change in UPWI values could be several times higher than the inter-annual (yearly linear intensity rate) and seasonal variability. The duration of intervals between successive shifts, regardless of the area, is of several decades (decadal trends). For instance, in S three successive intervals encompassed more than three decades of UPWI weakening. This trend changed in 1994 with a new shift (
Figure 6). In the SW coast, a relaxation of UPWI occurred over more than 20 years (1955–1969), and thereafter intensification was recorded for more than three decades. In NW after a relaxation of UPWI, from 1956 until 1969, intensification and relaxation periods alternated over decadal or decadal and half intervals. Different analyses reveal different information that may contribute to a better picture of the UPWI trends and oscillations over the last half-century and results are open to discussion. Analyzing the SST over the Western coast of Iberian Peninsula, [
42] observed a cooling period between 1950 and 1974 followed by intense warming between 1974 and 2008, corresponding to our upwelling intensification and relaxation shifts, regardless of the coastal areas. [
15] through their work based on measured coastal winds and SST datasets concluded that the upwelling off western Iberia coast had weakened since the 1940s until 2000s. This is in line with the observed results for the three coastal areas until 1967–1968.
Long-term data allow the identification of climatic change periods (the climate normals are 30 years, as defined by the World Meteorological Organization) and such profiles leads to question about large scale cycles (several decades) in UPWI regimes that are still poorly understood. Across Portugal, different coastal areas results showed climatic cycles of UPW relaxation and intensification (more than 30 years) followed by a turnover regime of several decades. This could mean that long-term events or low frequency events are a matter of discussion, but more data would be required to answer such a question.
In NW the yearly UPWI rates (slope of the regression models;
Figure 3) were similar among RS and ICOADS and the sudden shifts intervals shorter and more variable than in SW and S, highlighting the more regular UPW behavior at decadal scales (RSI and KZA results) further north. This is consistent with the findings of [
22] that showed that warming rates differences between offshore and coast (our UPW index) in NW increase in a similar way. Conversely, in the SW the authors found a larger warming rate offshore than inshore, resulting in an increase contrasting in SST along the years. This also matches our results, as the UPWI increased during that period. Results showed that the upwelling pattern off the SW Iberian Peninsula underwent a slight intensification since 1969. The results from the present work and [
22] are corroborated by [
43] who showed that between 1989 and 2007 opposite trends in upwelling frequency are found at the western northern limit (NW), where upwelling has been decreasing in recent decades. At the western south edge (SW) there is some evidence of increased upwelling.
In S, different results between present work, [
22,
43] works are found. According to [
22], in S warming of offshore water occur between 1985 and 2008 at a large rate than in nearshore waters. Therefore, the latter authors expected intensification of upwelling between 1985 and 2008. Nevertheless, [
43] simulations showed that offshore waters have increased at higher rate in recent decades (1989–2001). The results of [
43] are in agreements with S results in the last decades (RS: 1985–2009), as the intensification of UPWI is noted only after 1994. Such an increase in UPWI in recent decades in S (1994–200) is lower than in earlies 1950s and preceded a great period of 30 years of UPWI decline until middle 1990s. In S the RSI and KZA between 1984 and 1994 revealed some of the lowest UPWI values. For S the discrepancy between present results and warming rates in [
22] may be attributed to the sparse upwelling events off the south coast and the local particularities of the circulation in the region [
44]. Accordingly, [
45] stated that the Algarve cannot be assumed to be an upwelling system, defined as a system were upwelling prevails during a substantial part of the year, but rather a region where upwelling events do occur at times.
With our results the hypothesis proposed by [
10] and later taken up by [
12,
17,
46,
47], which states that the existence of an intensification of coastal upwelling in the last part of the 20th century due to global climate change, is not supported by considering our ICOADS and RS SST short-term data analyses. For instance, such a global pattern was only evident in S (providing linear regression significant slope for RS) and SW (sudden shift analyses). This finding validates the hypothesis taken by [
13,
15,
16] that found evidence of a decrease in coastal upwelling in similar periods in SW. Nonetheless, for the SW and S, a critical remark is observed: (i) since 2005 the upwelling intensity diminished to smaller yet positive UPWI values (prevailing UPW conditions) in SW; and (ii) in S the increased mean values of UPWI are below those recorded in the early 1950s. That is, the UPWI values at the early 1950s in the present study are anchor points for interpretation of recent time series data. Such upwelling intensification described by the above works for the latter 20th century was not observed in NW, where a more stable condition remains, as shown by: (i) weak magnitude regarding consecutive variation in UPWI average shifts values and (ii) shifts among consecutive intensification or relaxation periods in NW contrasting with consecutive shifts with the same trend in SW and S. Therefore, our results show meridional variation of the upwelling behavior with more stable conditions in NW.
Differences in monthly UPWI rates (
Figure 4 and
Figure 5) between the long-term (ICOADS) and short-term (RS) time series in the SW and S areas during summer months (June/July–August) were observed. It is evident that the strongest upwelling signal takes place between July and September, i.e., corresponding to the peak summer months, as expected for the Iberian Upwelling System [
5]. The similarities observed between both datasets in NW could be related to intrinsic features, namely as a transition zone with a particular oceanographic regime [
22,
48]. The average monthly UPWI results (ICOADS: 1950–2010) reveal that UPW season varied between S (from May to July) and NW and SW (from July to October). ICOADS is a much larger dataset and thus the average values are the results of a large number of years. In S coast the RS data (1985–2009) show that the average mean seasonal variation values in recent decades are similar to seasonal patterns found in both RS and ICOADS for other areas (NW and SW). Therefore, based on RS data, we can postulate about phenological changes in UPWI in S. In fact, in recent decades, individual monthly analyses reveal (slope of the linear regression analyses): (i) relaxation in UPWI in SW in specific winter months (February and Mars) and (ii) intensification of the UPWI in July to September summer months in SW and S coast. [
22] found an increase of the SST in SW for the same period. This matches the present results in SW and also in S. Another finding supporting phenological UPWI shifts is the increase of the mean seasonal autumn UPWI values in S from downwelling conditions (ICOADAS: 1950–2010) to strong upwelling values. In recent years the higher mean seasonal UPWI values are found in autumn in S. Moreover, comparing RS and ICOADAS average UPW monthly and seasonal values, results allow us to postulate that the slightly inter-annual increase rate of UPWI in NW and SW, namely in recent decades, are linked to increasing of upwelling intensity in autumn and winter in NW and winter in SW after the mid-1980s.
Upwelling long-term variability studies are controversial, both at a global or regional scale. This applies to [
12] results that contrast with other studies after re-analysis of the same data for the same locals with different data sets [
49] or many of the studies cited here for the Portuguese Iberian coast and the present work. In part, such differences are also the result of using different time series data analyses (time period), seasonal amalgamation or geographic constraints of the original time series. The question of whether long-term changes in UPWI are associated with inshore, offshore or both SST changes or to other related features (e.g., NAO or currents shifts) is a matter for future studies and analyses.

 ,
, 


