Article

New Insights of the Sicily Channel and Southern Tyrrhenian Sea Variability

1
Istituto nazionale di Oceanografia e Geofisica Sperimentale, OGS, 34010 Sgonico (TS), Italy
2
Centre for Maritime Research and Experimentation (CMRE), 19126 La Spezia, Italy
3
Consiglio Nazionale delle Ricerche, Istituto di Scienze Marine, CNR-ISMAR, Via del Fosso del Cavaliere, 100, 00133 Rome, Italy
4
Marseille Université, Université de Toulon, CNRS, IRD, MIO UM 110, Marseille, France, 13288 Marseilles, France
5
European Space Research Institute, ESA-ESRIN, 00044 Frascati, Italy
6
Physical Oceanography Research Group, Department of Geosciences, University of Malta, 2080 Msida, Malta
*
Author to whom correspondence should be addressed.
Water 2019, 11(7), 1355; https://doi.org/10.3390/w11071355
Submission received: 31 May 2019 / Revised: 24 June 2019 / Accepted: 27 June 2019 / Published: 29 June 2019
(This article belongs to the Special Issue Ocean Exchange and Circulation)

Abstract

:
The dynamics of the Sicily Channel and the southern Tyrrhenian Sea are highly influenced by the seasonal variability of the Mediterranean basin-wide circulation, by the interannual variability of the numerous mesoscale structures present in the Channel, and by the decadal variability of the adjacent Ionian Sea. In the present study, all these aspects are investigated using in-situ (Lagrangian drifter trajectories and Argo float profiles) and satellite data (Absolute Dynamic Topography, Sea Level Anomaly, Sea Surface Temperature, wind products) over the period from 1993 to 2018. The availability of long time series of data and high-resolution multi-sensor surface currents allow us to add new details on the circulation features and on their driving mechanisms and to detect new permanent eddies not yet described in literature. The structures prevailing in winter are mainly driven by wind, whereas those prevailing in summer are regulated by topographical forcing on surface currents. The strength of the surface structures located at the western entrance of the Ionian Sea and of the mesoscale activity along the northern Sicily coast is modulated by the large-scale internal variability. The vertical hydrological characteristics of these mesoscale eddies are delineated using the Argo float profiles inside these structures.

1. Introduction

Thanks to its location in the centre of the Mediterranean Basin, the Sicily Channel (SC) plays a crucial role in connecting the western and eastern Mediterranean basins and modulating their exchange of surface and intermediate waters [1,2]. The SC is characterized by a complex bottom topography, with submarine ridges and shallow banks, and it is delimited to the north by the Tyrrhenian Sea and the Sicily coast, to the south by the Libyan coast, to the west by the Tunisia coast, and to the east by the Ionian Sea (Figure 1a). Its circulation can be schematized on the vertical as a two-layer exchange with an eastward flow of Atlantic Water (AW) superposed to a westward flow of intermediate water, dominated by the Levantine Intermediate Water (LIW) [3]. Microstructure measurements taken in the SC show that it is a hotspot for turbulent mixing [4,5]. Consequently, the SC is a key area for the regulation of salt exchanges between Eastern and Western basins, with an impact on deep-water formation processes [6].
Circulation in the upper layer of the SC and in the southern Tyrrhenian Sea is mainly dictated by the large-scale Mediterranean thermohaline circulation, the wind-driven currents along the shelf, the upwelling events off Sicily, the sub-basin scale, and mesoscale permanent and quasi-permanent structures [1,3,7,8,9]. The recent results of AW circulation schemes, derived by numerical model simulation [1,3], are summarized in Figure 1b (both permanent and seasonal circulation structures are depicted with the same color in Figure 1b; more details on the time scales and variability of these structures are available in Section 3; acronyms are defined in Table 1). The sub-basin scale structures are characterized by a prominent seasonal variability [9,10,11,12] associated with large wind stress fluctuations [13]. The numerous mesoscale structures located in the SC are mainly driven by the instability of the large-scale circulation, by the interactions between currents and bathymetry, and by the direct wind forcing [1].
Presently, the availability of long time series of in-situ and satellite data and of sophisticated statistical techniques allow us to add new details on the mesoscale features and on their driving mechanisms. In this study, Lagrangian drifter trajectories, Argo float profiles, and satellite data (Absolute Dynamic Topography, Sea Level Anomaly, Sea Surface Temperature, wind products) are used to describe the surface circulation of the SC and the southern Tyrrhenian Sea over the period from 1993 to 2018. The simultaneous use of all these datasets leads to overcoming the intrinsic limitations of each of them, e.g., the accurate but discontinuous spatial and temporal drifter sampling and the low accuracy of altimetry gridded data in the identification of the mesoscale field [14]. Moreover, the knowledge of the mesoscale field is ameliorated using the multi-sensor currents (defined hereafter as ‘optimal currents’) derived from merging the satellite altimetry data and the Sea Surface Temperature (SST) fields [15]. This product enables the improvement of the description of eddy dynamics and non-geostrophic dynamical features [15]. The vertical structures and the hydrological characteristics of the mesoscale eddies are delineated using the Argo float profiles inside these structures. All these data and products enhance the knowledge on the temporal variability of the mesoscale structures, with detection of new features not yet described in the literature, and the addition of new insights on the formation mechanisms of these structures.

2. Materials and Methods

The datasets used for this study are as follows:
  • The OGS Mediterranean drifter dataset in the SC and Southern Tyrrhenian Sea, composed of 377 drifter tracks collected between 1993 and 2018 (Figure 1b). Drifter data were retrieved from the OGS own projects, but also from databases collected by other research institutions and by international data centers (Global Drifter Program, SOCIB, CORIOLIS, MIO, etc.). These data were cleaned of potential outliers and elaborated with standard procedures (editing, manual editing, and interpolation [16,17]). In particular, we use the low-pass filtered and interpolated (6 h) drifter tracks, which represent the near-surface currents between 0 m and 15 m in depth.
  • The daily (1/8° Mercator projection grid) Absolute Dynamic Topography (ADT) and correspondent Absolute Geostrophic Velocities (AGV) derived from altimeter and distributed by CMEMS in the period from 1993 to 2018 (product user manual CMEMS-SL-QUID_008-032-051). The ADT was obtained by the sum of the sea level anomaly and a 20 year synthetic mean estimated in Reference [18] over the 1993 to 2012 period.
  • The Argo float vertical profiles of temperature and salinity from the upper 2000 m of the water column and the horizontal current displacements at the parking depth. In the Mediterranean Sea, the Argo floats are generally programmed to execute 5 day cycles with a drifting depth of 350 m (parking depth). Additionally, they alternate the profiling depth between 700 m and 2000 m (see the MedArgo program in Reference [19]). When a float drifts in a shallow area and touches the ground, it can increase its buoyancy to get away from bottom, or can stay there until it is time to ascent (depending on how it is programmed). Information about grounding events is contained in the Argo float trajectory file. Among all the data available in the Mediterranean Sea, we selected from the part of the Argo floats trajectories which correspond to a float entrapped in the mesoscale structures of the SC and southern Tyrrhenian Sea. These data were used to define the vertical hydrographic peculiarities of the mesoscale features. Details about the missions of the seven floats selected for this work are listed in Table 2.
  • The optimal currents, estimated by Reference [15] and presently available in the period from 2012 to 2016. This product was used to confirm the occurrence of the mesoscale structure derived from altimetry and to estimate their interannual variability. Indeed, the optimal currents are based on the synergy of the daily 1/8° Copernicus CMEMS altimeter-derived geostrophic velocities (data ID: SEALEVEL_MED_PHY_L4_REP_OBSERVATIONS_008_051) and the daily 1/24° CMEMS sea-surface temperatures for the Mediterranean Sea (data ID: SST_MED_SST_L4_REP_OBSERVATIONS_010_021). The optimal reconstruction method is based on the inversion of the ocean heat conservation equation in the mixed layer [15]. The principles of the optimal currents are thoroughly described in References [15,20,21]. Such a method takes advantage of the high-resolution spatial temporal gradients of the satellite-derived SST to improve the temporal (1 day) and spatial (1/24°) resolution of the altimeter derived geostrophic currents at the basin scale. The reconstruction method of the optimal currents yielded positive improvements for both the components of the motion in the SC [15].
  • The Cross-Calibrated, Multi-Platform (CCMP) V2.0 ocean surface wind velocity data, which were downloaded from the NASA Physical Oceanography DAAC for the period from July 1993 to May 2016 [22]. These products were created using a variational analysis method to combine wind measurements derived from several satellite scatterometers and micro-wave radiometers. The temporal resolution of the CCMP product is six hours and the spatial resolution is 25 km (level 3.0, first-look version 1.1).
Drifter velocities were divided in bins of 0.25° × 0.25° and pseudo-Eulerian statistics were computed over the period from 1993 to 2018 and qualitatively compared with the ADT derived from altimetry. The mean current field was also estimated in the period from 2012 to 2016, using the optimal currents. The seasonal variability of the drifter, altimetry, and optimal current fields was estimated by dividing the dataset in two extended seasons, the extended summer corresponding to May–October, and the extended winter to November–April, as suggested by Reference [9].
The CCMP six-hourly gridded analyses were used to quantify the wind stress and the vertical component of the wind stress curl, [curl τ]z, over the study area:
[ c u r l τ ] z = τ y x τ x y ; ( τ y , τ x ) = ρ C D ( u w , v w ) U 10
where (τx, τy) are the wind stress components, ρ (1.22 Kg/m3) is the density of air, (uw, vw) and U10 are the components and the magnitude of the wind speed at 10 m, respectively, and CD is the drag coefficient already used in the Mediterranean Sea by References [23,24], as follows:
C D = 10 3 | U 10 | 3 m s C D = ( 0.29 + 3.1 U 10 + 7.7 U 10 2 ) × 10 3 3 m s | U 10 | 6 m s C D = ( 0.6 + 0.07 U 10 ) × 10 3 6 m s | U 10 | 26 m s
Wind stress and wind stress vorticity fields were used to speculate on the link between the wind variations and the seasonal and/or interannual variability of mesoscale structures.
The monthly means of the AGV and optimal current fields were used to estimate the relative vorticity ( ζ ), defined as the vertical component of the velocity field curl, as follows:
ζ = V x U y ;
where U and V are the velocity components. The resulting current vorticity fields were spatially averaged in the regions of the main mesoscale structures listed in Table 1 and filtered (13 month moving average) in order to remove the seasonal and intra-annual variations.

3. Results

3.1. Mean Currents and Wind Fields

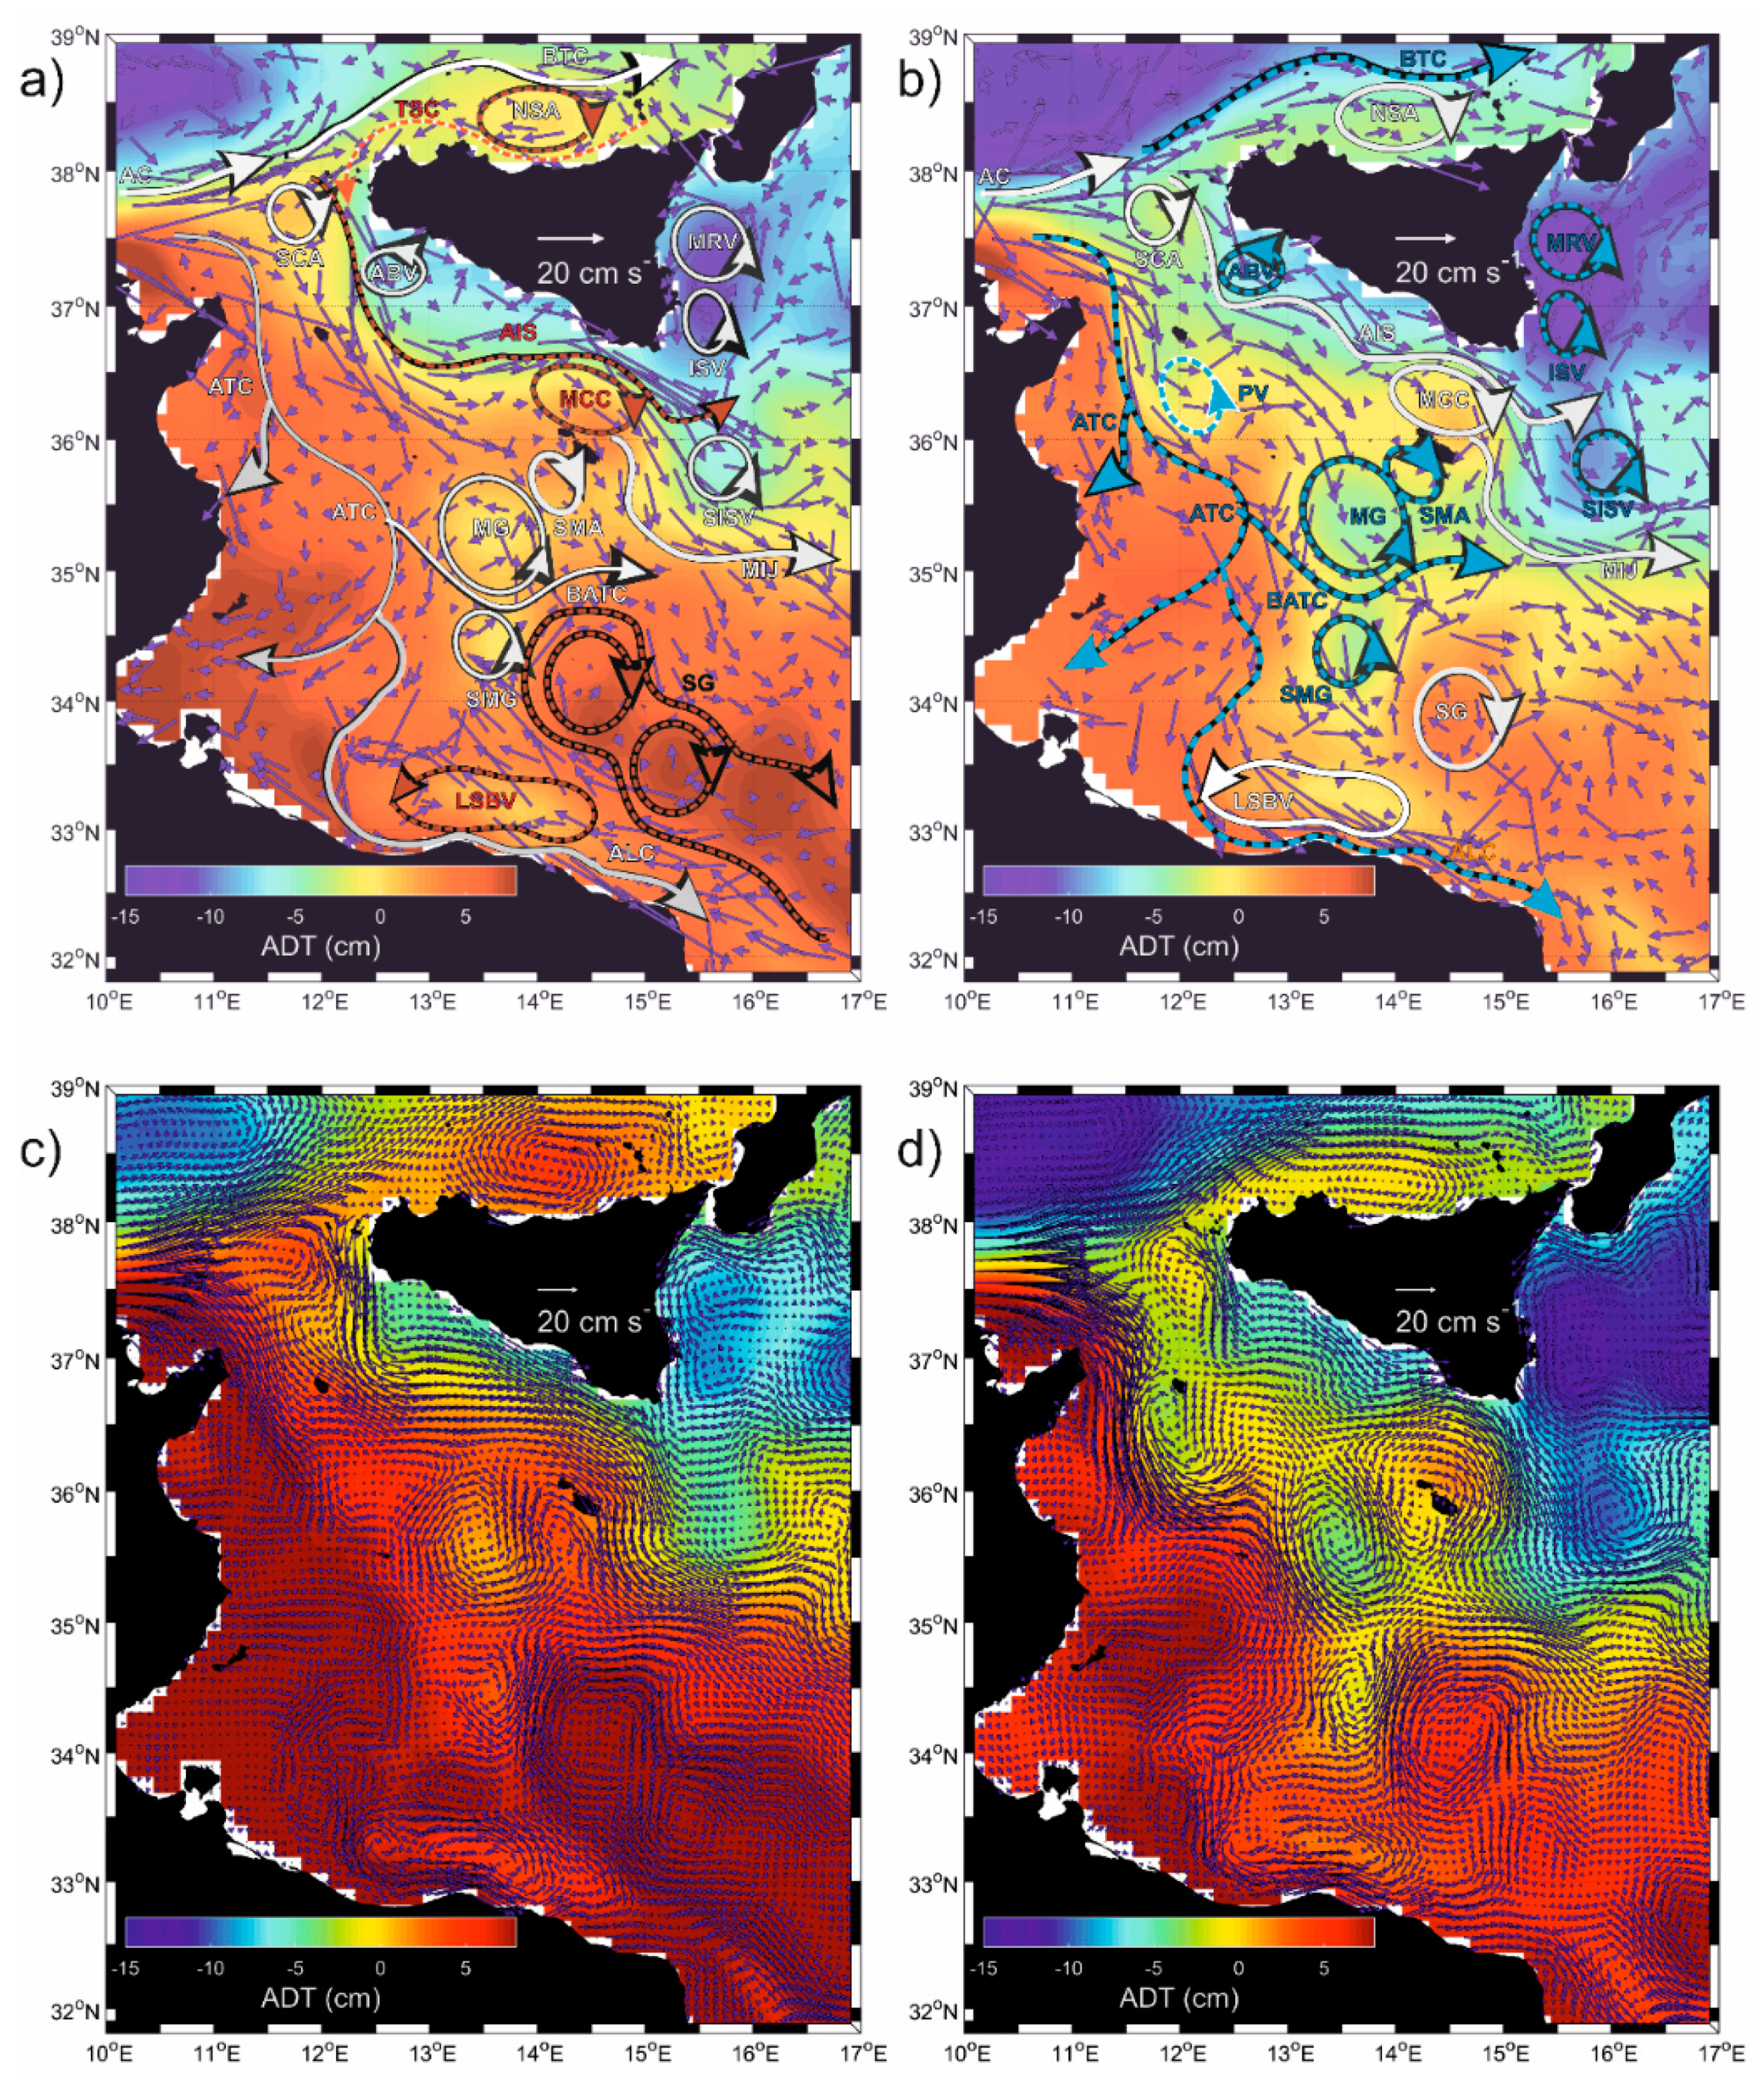
The qualitative comparison between the ADT and drifter data shows that the two datasets fit rather well (Figure 2a) and allow us to update the pseudo-Eulerian current maps described in Reference [9] and to enhance the schematic circulation maps published by References [1,3] summarized in Figure 1b. The averages were made over different periods in accordance with the availability of data, 1993–2018 for the drifter and altimetry data (Figure 2a), 2012–2016 for the optimal currents (Figure 2b), and 1993–2016 for the wind (Figure 2c,d). The time periods are rather long and the statistics are rather robust to consider the average in Figure 2a comparable with those in Figure 2c,d and representative of the mean conditions in the SC. The optimal currents are available over a reduced period and are, therefore, not directly compared with the other datasets. Rather, they are used to bring out some aspects of the current field that are not obvious, using only drifters and altimetry data. The structures emphasized in white in Figure 2a,b, are described here for the first time or with different shapes and positions with respect to those schematized in Figure 1b.
The Atlantic Tunisian Current (ATC) originates from the branch of the Algerian Current (AC) that enters in the SC and flows southward between Pantelleria Island and the Tunisian coast [9]. It shows a complex pattern only partially described by the previous model studies. Indeed, the ATC splits in two branches at about 36.5° N (Figure 2a). One branch continues to move southward along the Tunisian coast (shown in white color), whereas another branch moves eastward south of Pantelleria Island. At about 35.5° N and 13° E, the ATC splits another time. A part of the current forms the Bifurcation Atlantic Tunisian Current (BATC) and the other part turns southward towards the Libyan coast at ~13° E. The latter branch describes the Atlantic Libyan Current (ALC [1,3]), which moves westward towards the Gulf of Gabes and eastward along the Libyan coast (Figure 1b and Figure 2a).
Drifter and altimetry data confirm the well-known meandering pattern of the Atlantic Ionian Stream (AIS) and outline the edge of the Maltese Channel Crest (MCC), located on the Maltese Plateau. The Medina Gyre (MG) is located on the west and/or southwest side of the Malta Island in agreement with the scheme of Reference [3]. The region where the ATC splits and forms the BATC is characterized by a sudden reduction of depth due to the shelf extension (see the location of MG in Figure 1a), which probably facilitates the cyclonic rotation of the surface currents around 35°–36° N and 13°–14.5° E. It is interesting to note that Reference [1] located the MG in a different position southeast of Malta (see Figure 2 of [1]). South of the MG, altimetry and drifter data detect another permanent cyclonic mesoscale structure that has never been described before in the literature; hereafter we will refer to this structure as the Southern Medina Gyre (SMG) (emphasized in white Figure 2a). The Libyan Shelf Break Vortex (LSBV) is well described only by altimetry data (Figure 2a) because of a scarce quantity of drifter tracks along the Libyan coast. This structure appears meridionally elongated and squeezed along the Libyan coast, showing a different shape and location with respect to Reference [1].
The higher spatial resolution of the mean circulation derived by optimal currents (2012–2016; Figure 2b) permits a more detailed description of the mesoscale structure of the SC and the southern Tyrrhenian Sea. The anticyclonic structure, clearly visible along the northern coast of Sicily and located between the Aeolian Islands and Cape Gallo (38.1–38.5° N; 13.5–15° E), was observed by Reference [25] in September 2012, but it was not described by these authors; hereafter it will be defined as the Northern Sicily Anticyclone (NSA). Another mesoscale anticyclone is located at the entrance of the SC (37.5–38° N; 11.5–12° E) and represents a kind of watershed between the waters entering the Tyrrhenian Sea (Bifurcation Tyrrhenian Current—BTC) and those entering the SC; hereafter we will define it as the Sicily Channel Anticyclone (SCA). A third mesoscale anticyclone is squeezed between the MG and Malta Island (35.5°–36° N; 14°–14.5° E) and we will define it hereafter as the Southern Maltese Anticyclone (SMA). Similarly, southeast of the Ionian Shelf break Vortex (ISV), there is another steady cyclonic structure hereafter defined as the Southern Ionian Shelf break Vortex (SISV). In addition, the optimal currents reveal new information on the shape of the Sidra Gyre (SG), which appears as a large anticyclone that involves two smaller anticyclonic structures (Figure 2b) and confirms the existence of the SMG (Figure 2b). The cyclonic circulation in the region of the Adventure Bank Vortex (ABV; 37–37.5° N; 12–13° E) is detected by the three datasets (drifter, altimetry, and optimal currents) but the vortex is not well resolved by any of them. It appears more like a cyclonic meander rather than a vortex (Figure 2, upper panels).
In the study area the mean wind stress is oriented to the east in the southern Tyrrhenian Sea and to the southeast in the SC (Figure 2c) with amplitude (range of values between 0 and 0.04 Nm−2) and directions in agreement with the results of Reference [12]. The regions mostly impacted by the wind stress are located in the band north of 35° N and south of the southern Sicily coast (Figure 2c). The rotating motion induced by the wind (wind stress curl Figure 2d) is cyclonic (positive) along the southern and eastern Sicily coasts and on the Malta plateau, whereas it is anticyclonic (negative) along the Tunisia coast and in the southern Tyrrhenian Sea (along the northern Sicily coast). We can speculate that the wind field plays an important role in shaping the sub-basin circulation (e.g., the branch of the ATC that moves southward along the Tunisia coast) and in defining the sense of rotation of the mesoscale structures located around the Sicily coast (e.g., the ABV, the Messina Rise Vortex (MRV), the ISV, and the NSA).

3.2. Seasonal Variability of Currents and Wind Fields

The seasonal variability of the drifter-derived and optimal current fields is shown in Figure 3, together with the altimetry data. Results substantially confirm the paths described in Reference [9], but add new insights. The BTC is a permanent feature, as shown by Reference [1], and it is stronger in winter (Figure 3b,d; winter speeds larger than 20 cm/s; mean summer speeds of ~10 cm/s), whereas the NSA is much more intense in summer (Figure 3a,c; mean winter speeds of ~5 cm/s; mean summer speeds of ~10 cm/s). Along the northern coast of Sicily, the drifter data describe a westward current during summer, with the consequent inflow of surface water in the SC (Figure 3a), whereas the coastal currents move eastward during winter (Figure 3b). This summer westward current (mean speeds of ~10 cm/s) was already described in Reference [3] and defined as the Tyrrhenian Sicilian Current (TSC). The TSC is not identified by the optimal currents (Figure 3c,d).
The ATC is part of the permanent pattern of the SC, in agreement with Reference [3], and it is more intense and more meandering in nature during the extended winter (Figure 3b,d; maxima winter speeds of ~30 cm/s; maximum summer speeds of ~20 cm/s). It is interesting to note that Reference [1] described it as a winter structure. The cyclonic Pantelleria Vortex (PV) is observed only during the extended winter (Figure 3b,d; speeds of 10–15 cm/s), in agreement with the optimal currents and with Reference [3] and in disagreement with Reference [1], which describes this as part of the permanent pattern. The MCC is stronger during the extended summer (speeds larger than 15 cm/s), as well as the AIS (Figure 3a,c; mean winter speed of ~5 cm/s; mean summer speeds of ~15 cm/s). The SG is stronger and larger in size during summer (Figure 3a,c; mean winter speeds of ~7 cm/s; mean summer speeds of ~12 cm/s; winter longitudinal extension of ~100 km; summer longitudinal extension larger than 250 km), in agreement with the results of Reference [26], which report the SG seasonal expansion in the summer and contraction in the winter. The ISV and the MRV are permanent structures, in agreement with Reference [1], and they are stronger in the winter (Figure 3b,d; mean winter speeds of ~9 cm/s; mean summer speeds of ~6 cm/s). In addition, the SISV is a permanent structure more intense in the winter, according to the optimal currents (Figure 3d; mean winter speeds of ~10 cm/s; mean summer speeds of ~5 cm/s). The BATC is predominant during winter south of the MG (Figure 3b,d; maxima winter speeds of ~20 cm/s; maxima summer speeds of ~10 cm/s), in agreement with Reference [1]. The ALC is stronger in the winter (Figure 3b,d; speeds larger than 15 cm/s), whereas the LSBV is stronger in the summer (Figure 3a,c; speeds larger than 25 cm/s).
The wind stress and the wind stress curl are more intense in winter (Figure 4), influencing the seasonal variability of some sub-basin currents, such as the BTC, the ALC, the BATC. The winter intensification of the BATC and its interaction with the topography lead to an intensification of the MG. The wind stress does not impact the circulation structures, which are more intense in summer (MCC, AIS, NSA, SG), when the wind stress and the wind stress curl are weakened. The seasonal variability of these structures is presumably related to other forcings, such as the instability of the surface currents and the interaction with the topography. The behaviour of the AIS and of the MCC confirms the following insight: The AIS is stronger in the summer (Figure 3a) when the wind stress is weaker (Figure 4a) and its meander on the Malta Plateau (the MCC) is anticyclonic, although the vorticity induced by the wind in this region is substantially cyclonic (Figure 4c). Along the northern coast of the Sicily, the amplitude of the wind stress and the anticyclonic vorticity induced by the wind are stronger in winter (Figure 4), whereas the strengthening of the NSA is observed in the summer (Figure 3a,c). This result suggests that the wind influences the sense of rotation of the surface circulation in the NSA, but other forcings modulate the strength of the seasonal and interannual variability of this circulation structure. The summer intensification of the LSBV appears to be instead related to the intensification of the cyclonic wind stress curl along the western Libyan coast (Figure 4c). The SG shows a pronounced longitudinal extension in summer (Figure 3a), when the wind stress is weaker but the vorticity induced by the wind is essentially anticyclonic in the southeastern region of the SC (Figure 4a). Its southern margin is oriented parallel to the Libyan coast following the 400 m isobath.

3.3. Decadal Variations

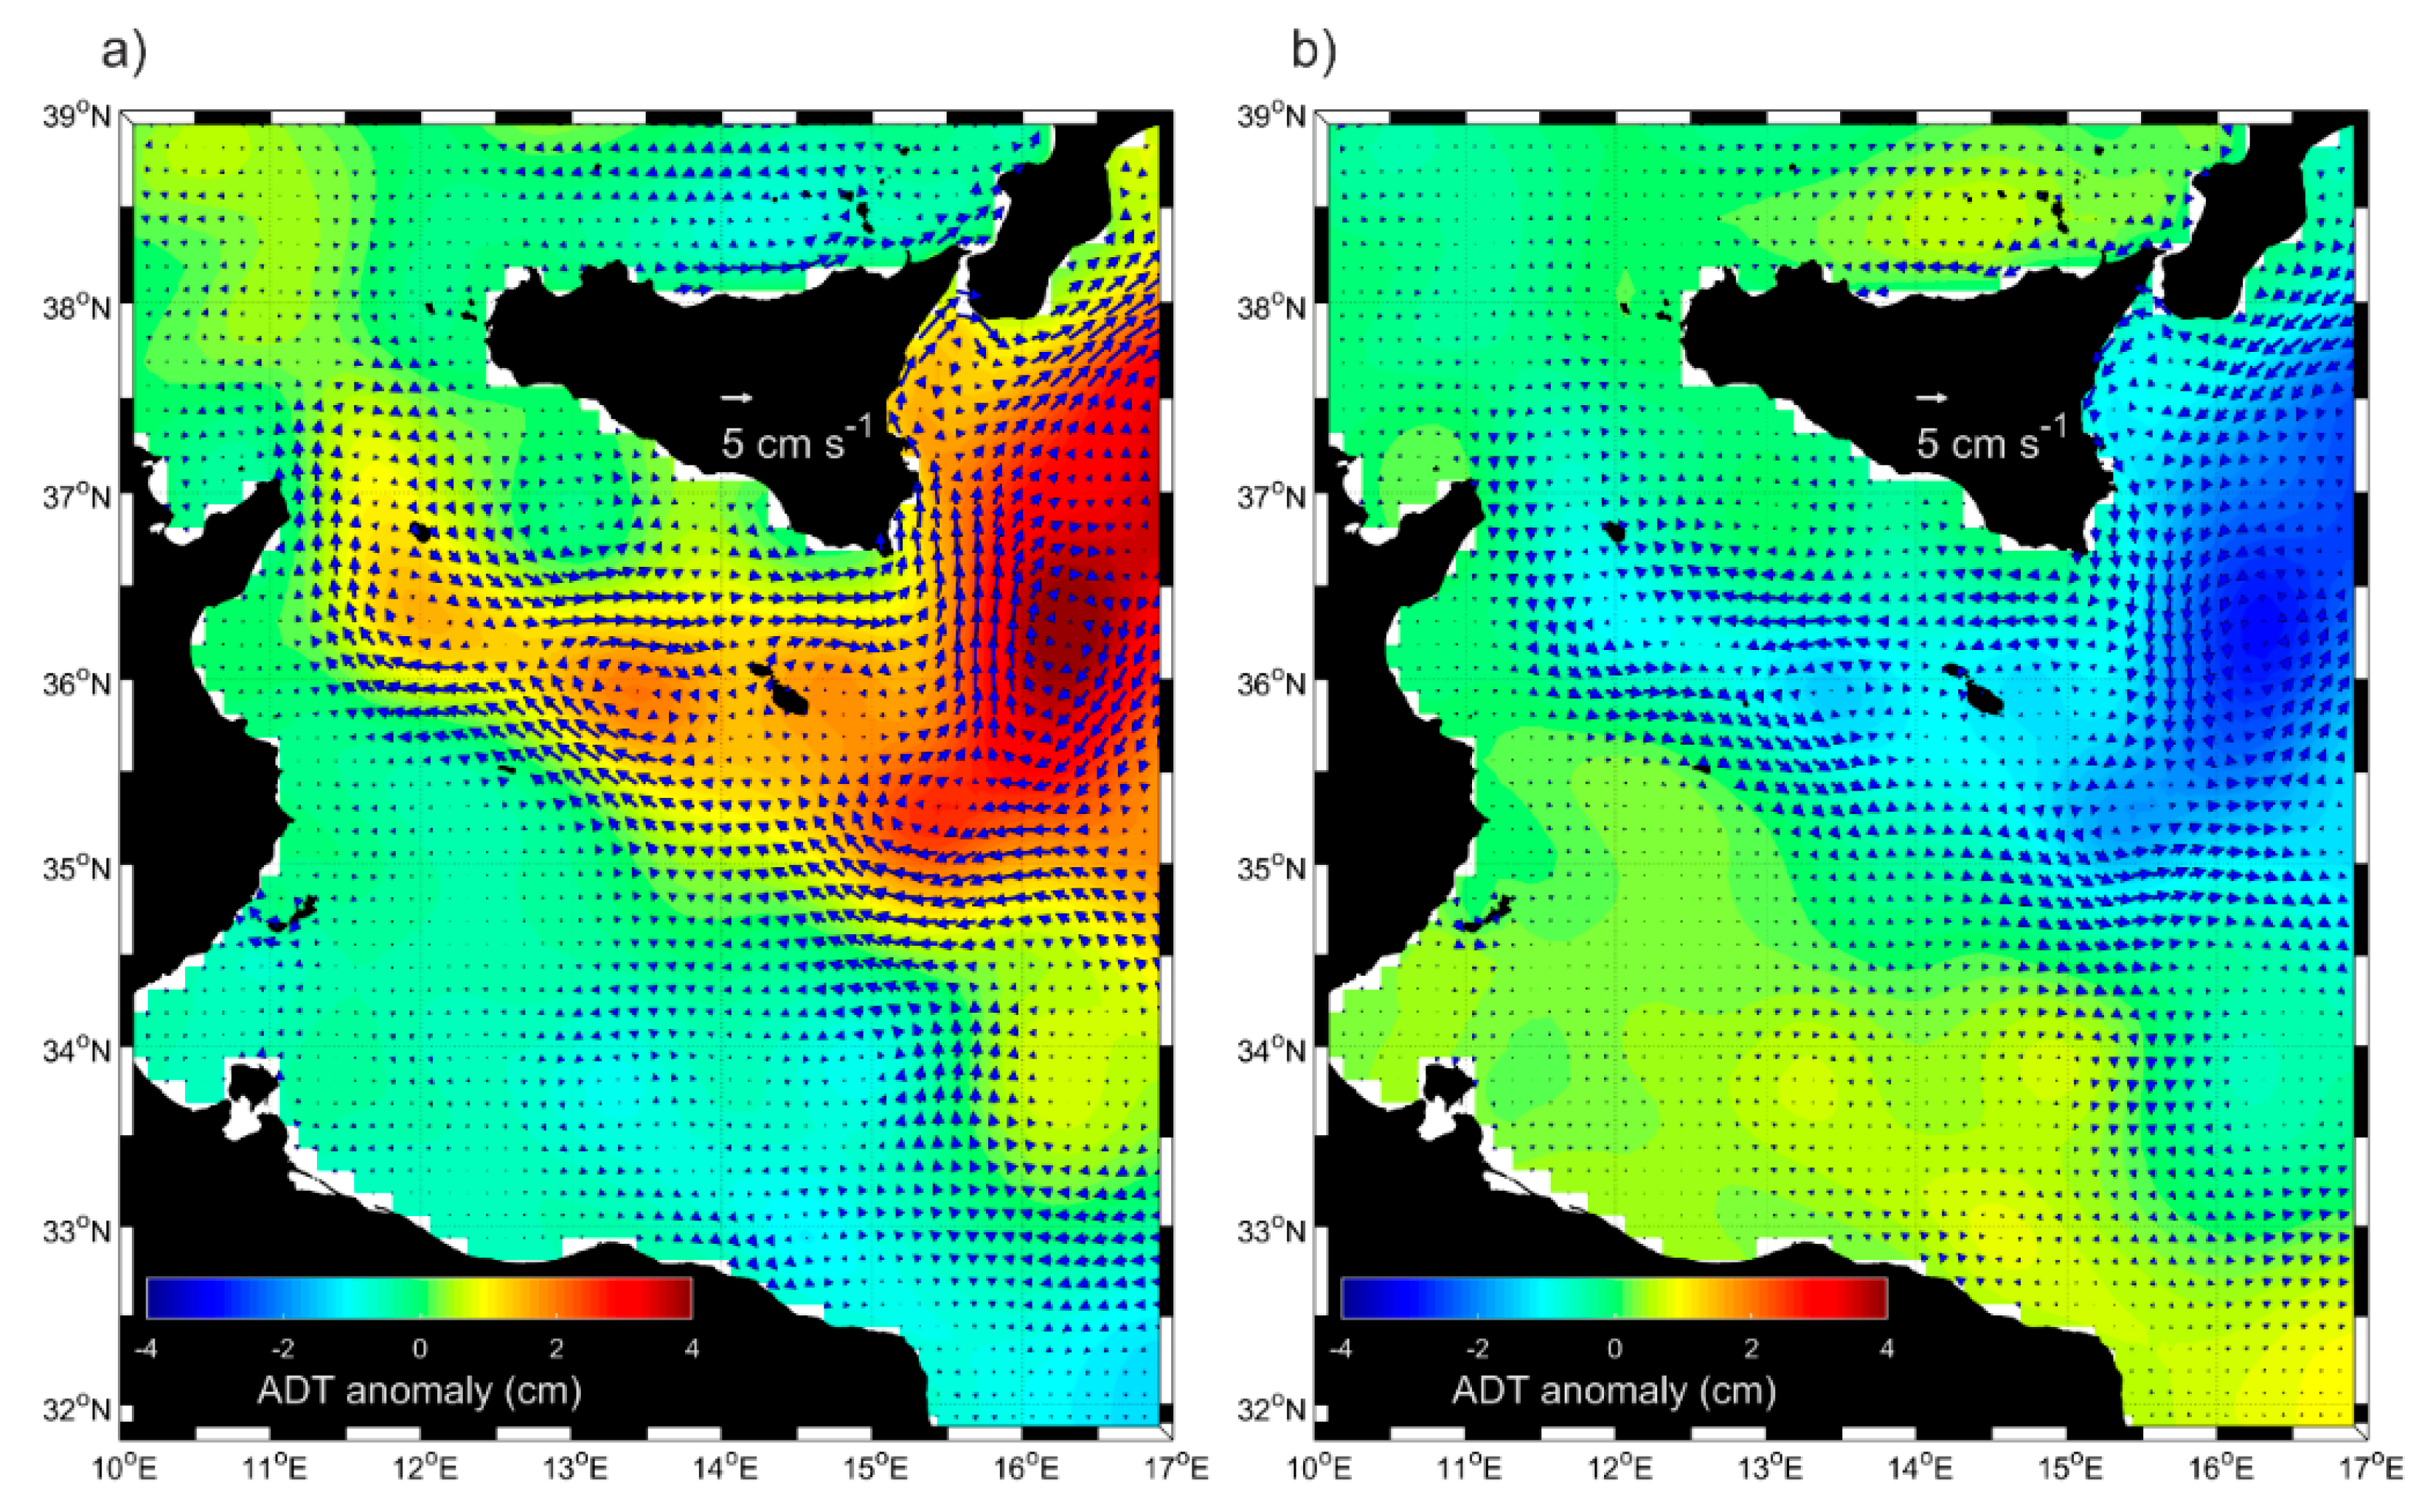
Decadal variations are emphasized by removing the mean ADT and AGV (1993–2018) fields from the interannual composite mean over the time periods characterized by the anticyclonic (1993–1996, 2006–2010, and 2016–2017) and cyclonic (1997–2005 and 2011–2016) circulation modes in the northern Ionian (Figure 5). In the region located between Pantelleria and Malta islands (35.5° N–37° N, 11° E–15° E), the surface currents are smaller than the mean field during the anticyclonic mode (Figure 5a; current anomalies are oriented in an opposite direction with respect to the mean field) and larger during the cyclonic mode (Figure 5b). Along the northern coast of the Sicily, the NSA is reduced in intensity, with respect to the mean field, during the anticyclonic mode (Figure 5a; the current anomalies are oriented cyclonically) and increased during the cyclonic mode.
The largest variations are observed east of 15° E, in agreement with the results of Reference [24]. The MRV and the SISV are less intense than the mean currents during the anticyclonic mode (Figure 5a) and slightly more intense during the cyclonic mode (Figure 5b). The AIS tends to be deflected towards the northern Ionian during the anticyclonic circulation mode (northeastward currents along the Sicily eastern coast) and the MIJ is reduced in intensity with respect to the mean currents (Figure 5a). During the cyclonic circulation mode, the AIS feeds the MIJ, which shows larger intensities with respect to the mean, and the currents are mainly directed southwestward along the western coasts of the Ionian Sea (Figure 5b).

3.4. Interannual Variability and Vertical Structure of the Quasi-Permanent Mesoscale Eddies in the Sicily Channel and Southern Tyrrhenian Sea

The main quasi-permanent mesoscale eddies of the SC and southern Tyrrhenian are analyzed in terms of their interannual variability, using the time series of spatially averaged vorticity fields derived both from altimetry and optimal currents data. In the period in which the optimal currents are available, the accuracy of the vorticity derived by the AGV is generally improved, showing larger complexity in the temporal variability of the signal (see Figure 6, Figure 8, and Figure 11). The thermohaline properties and the vertical extension in the water column of these mesoscale eddies is studied using the Argo float profiles.

3.4.1. Southern Tyrrhenian Sea and Sicily Channel Entrance

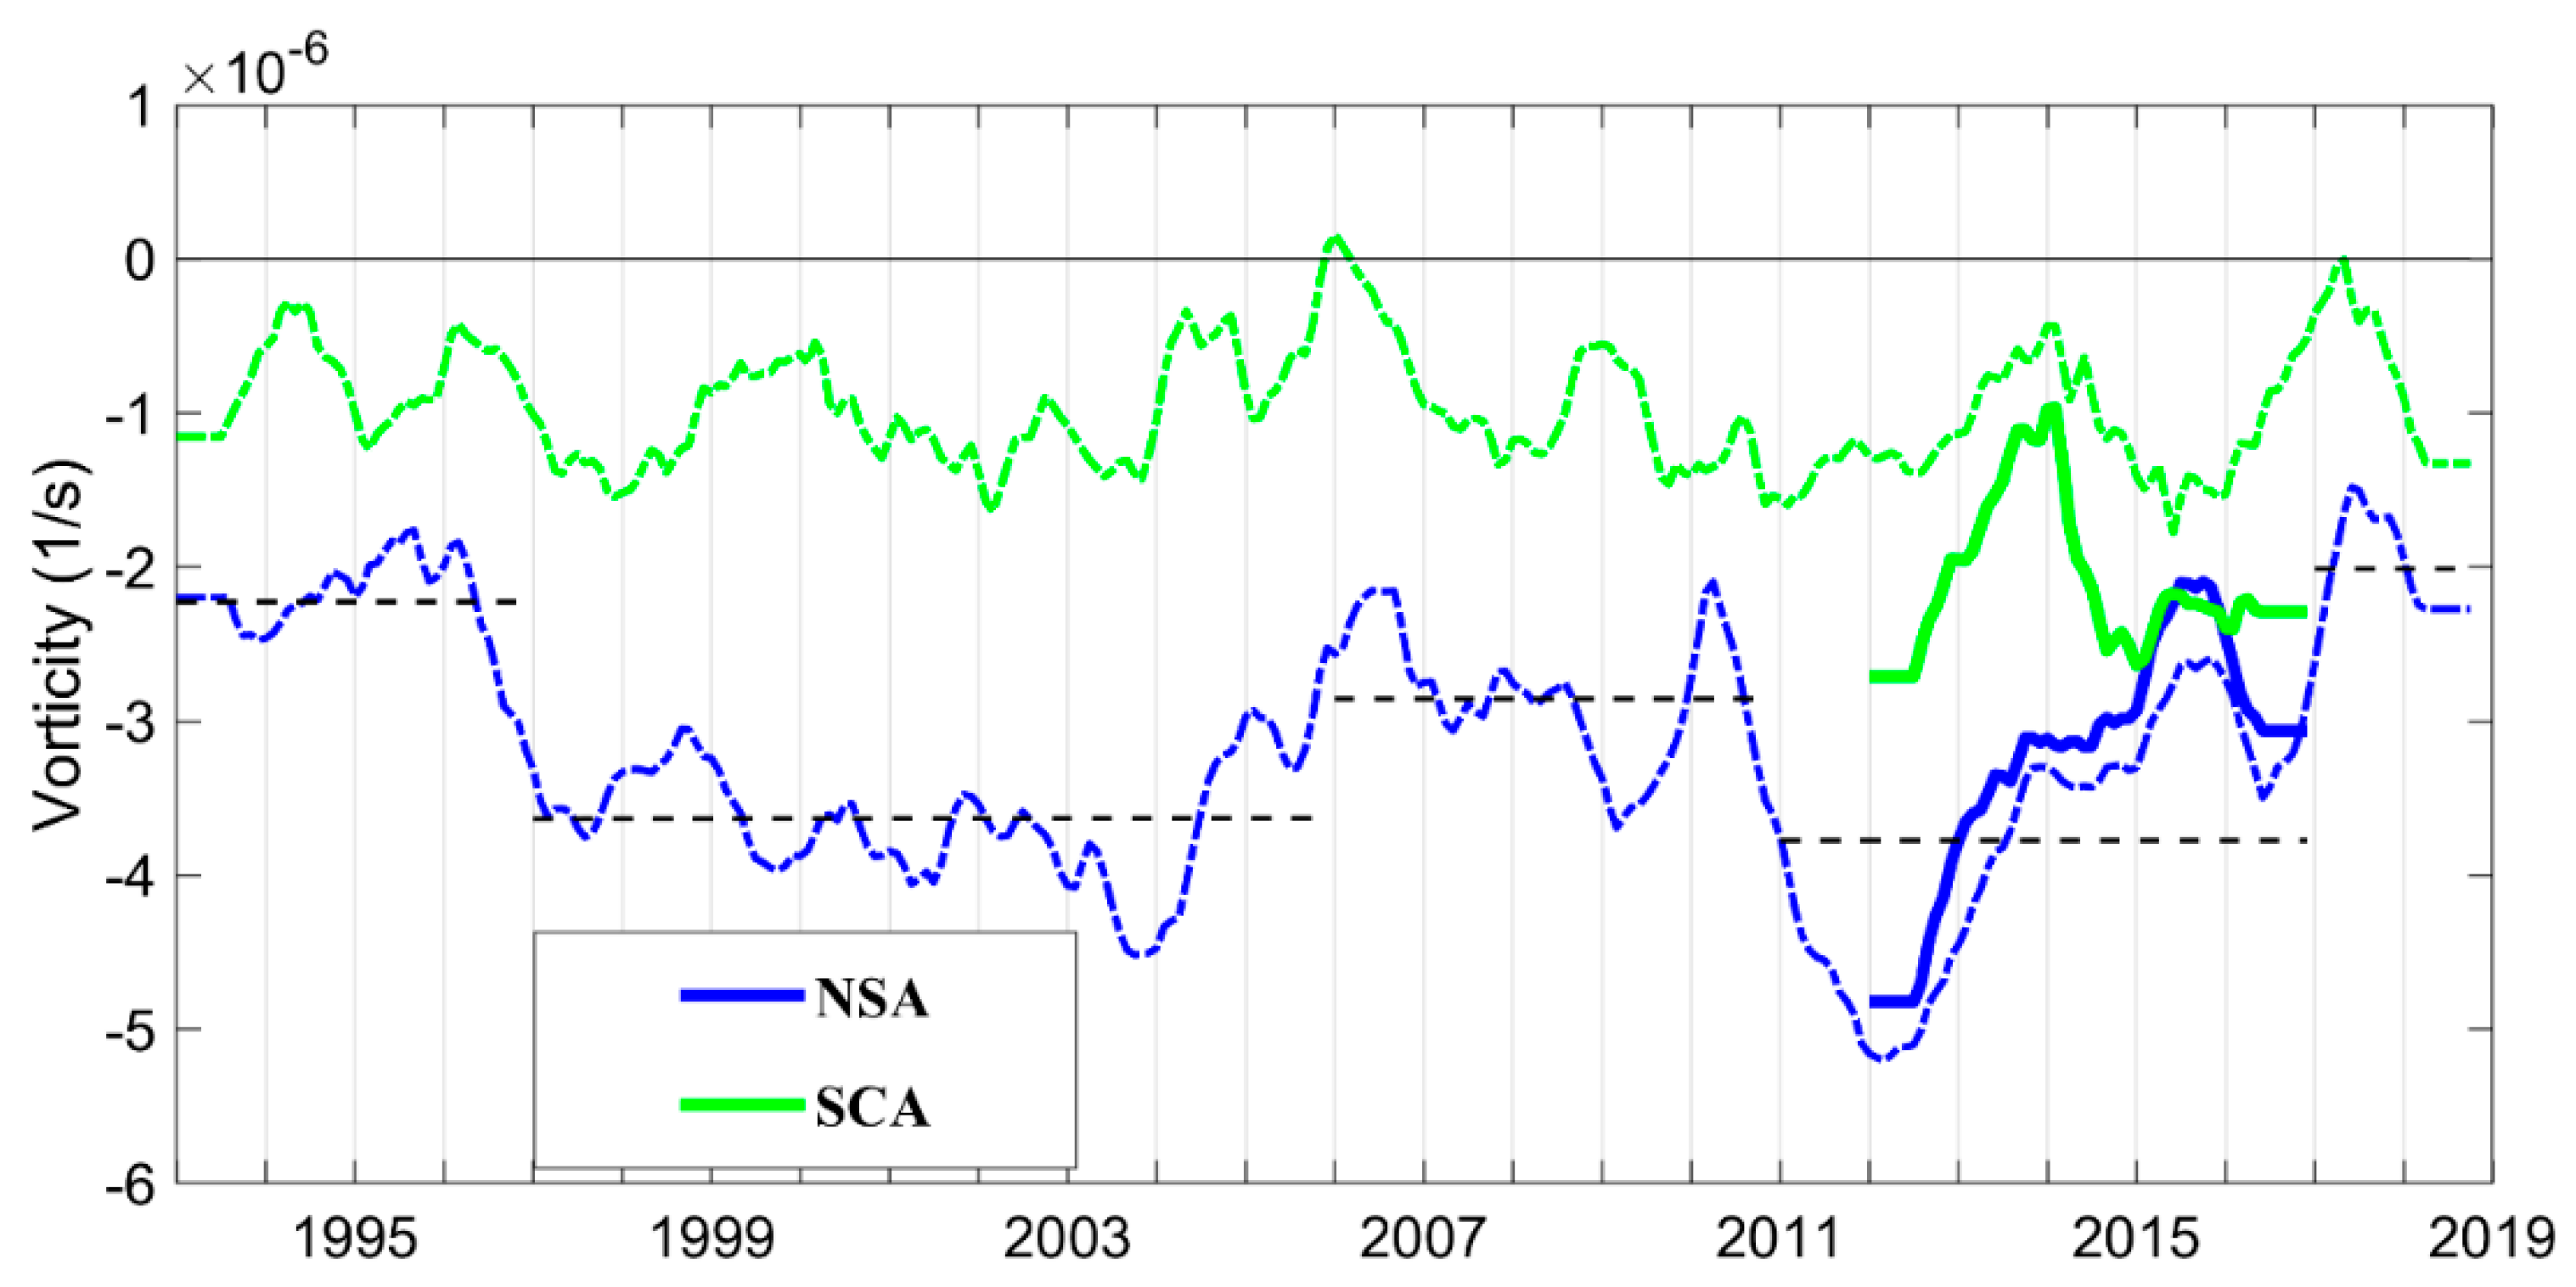
The analysis of the vorticity field in the areas of the NSA (38.1–38.5° N; 13.5–15° E) and SCA (37.5–38° N; 11.5–12° E) confirms that the anticyclonic nature of these regions persists with time (Figure 6). A more accurate analysis of the temporal evolution of the vorticity in the NSA shows quasi-decadal variations of the intensity of the vorticity field that coincide with the inversions of the surface circulation in the northern Ionian. The black dashed lines in Figure 6 give an indication of the mean vorticity values during each anticyclonic/cyclonic circulation mode. The anticyclonic vorticity of the NSA is reduced during the anticyclonic circulation modes of the northern Ionian (1993–1996, 2006–2010, 2017–2018), whereas it is enhanced during the cyclonic circulation modes (1997–2005, 2011–2016). This result supports the relationship between the large–scale interior ocean variability in the central Mediterranean Sea and the local dynamics, suggested by Reference [27]. More specifically, these authors suggest a link between the inversions of the surface circulation in the northern Ionian and the local tidal observations in the area of the Strait of Messina. The present work shows that not only the Strait of Messina, but all the coastal areas adjacent to the northern Sicily coast can be influenced by the variability attributed to the large-scale dynamics of the central Mediterranean.
The vertical structure of the NSA is defined by the profiles of the float WMO 6900981, which circulated on the border of the NSA between late April 2012 and early January 2013 (Figure 7a,b). This float shows that the NSA extends about 50 m in depth and confirms its anticyclonic nature with a reduction of density and the deepening of the isopycnal surfaces, in particular between the end of June 2012 and November 2012, when the float profiles were close to the core of the eddy. The trajectory of the float WMO 6900981 gives an indication of the intermediate current displacements at the parking depth (350 m; see Table 2). It is interesting to note that, during the period covered by the float WMO 6900981, the intermediate currents in the region of the NSA flowed in an opposite direction (cyclonic displacements; Figure 7a), with respect to the mean surface currents (Figure 2b). The diagram in Figure 7b shows a gap of the float profiles between 1 September 2012 and 20 October 2012. Despite this gap, the float remains confined to the eastern part of the NSA, from which it moves away only in December 2012. Unfortunately, we have no floats entrapped in the SCA.

3.4.2. Malta Plateau

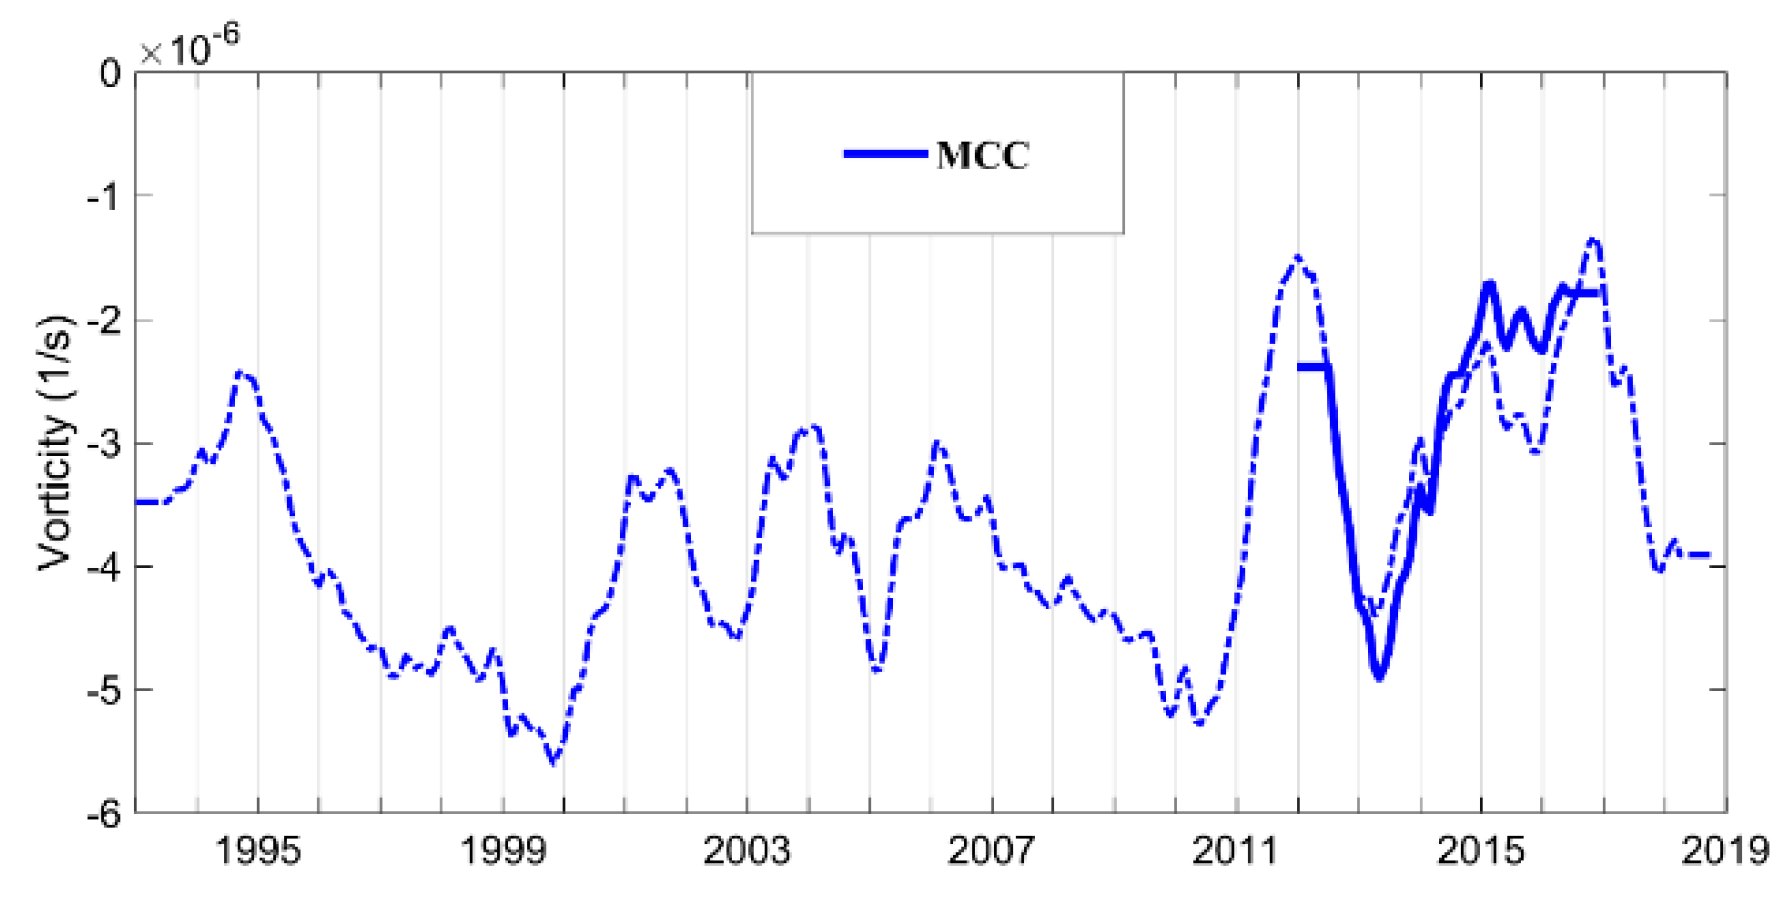
The surface circulation in the region of the Malta Plateau is strongly influenced by the flow of the AIS that forms a large anticyclonic meander defined as MCC. The permanent anticyclonic vorticity in this region (36.1–36.8° N; 14–15° E) is confirmed by the time series of the vorticity field (Figure 8). At local scale, this meander can sporadically create an anticyclonic gyre on the Malta plateau [28].
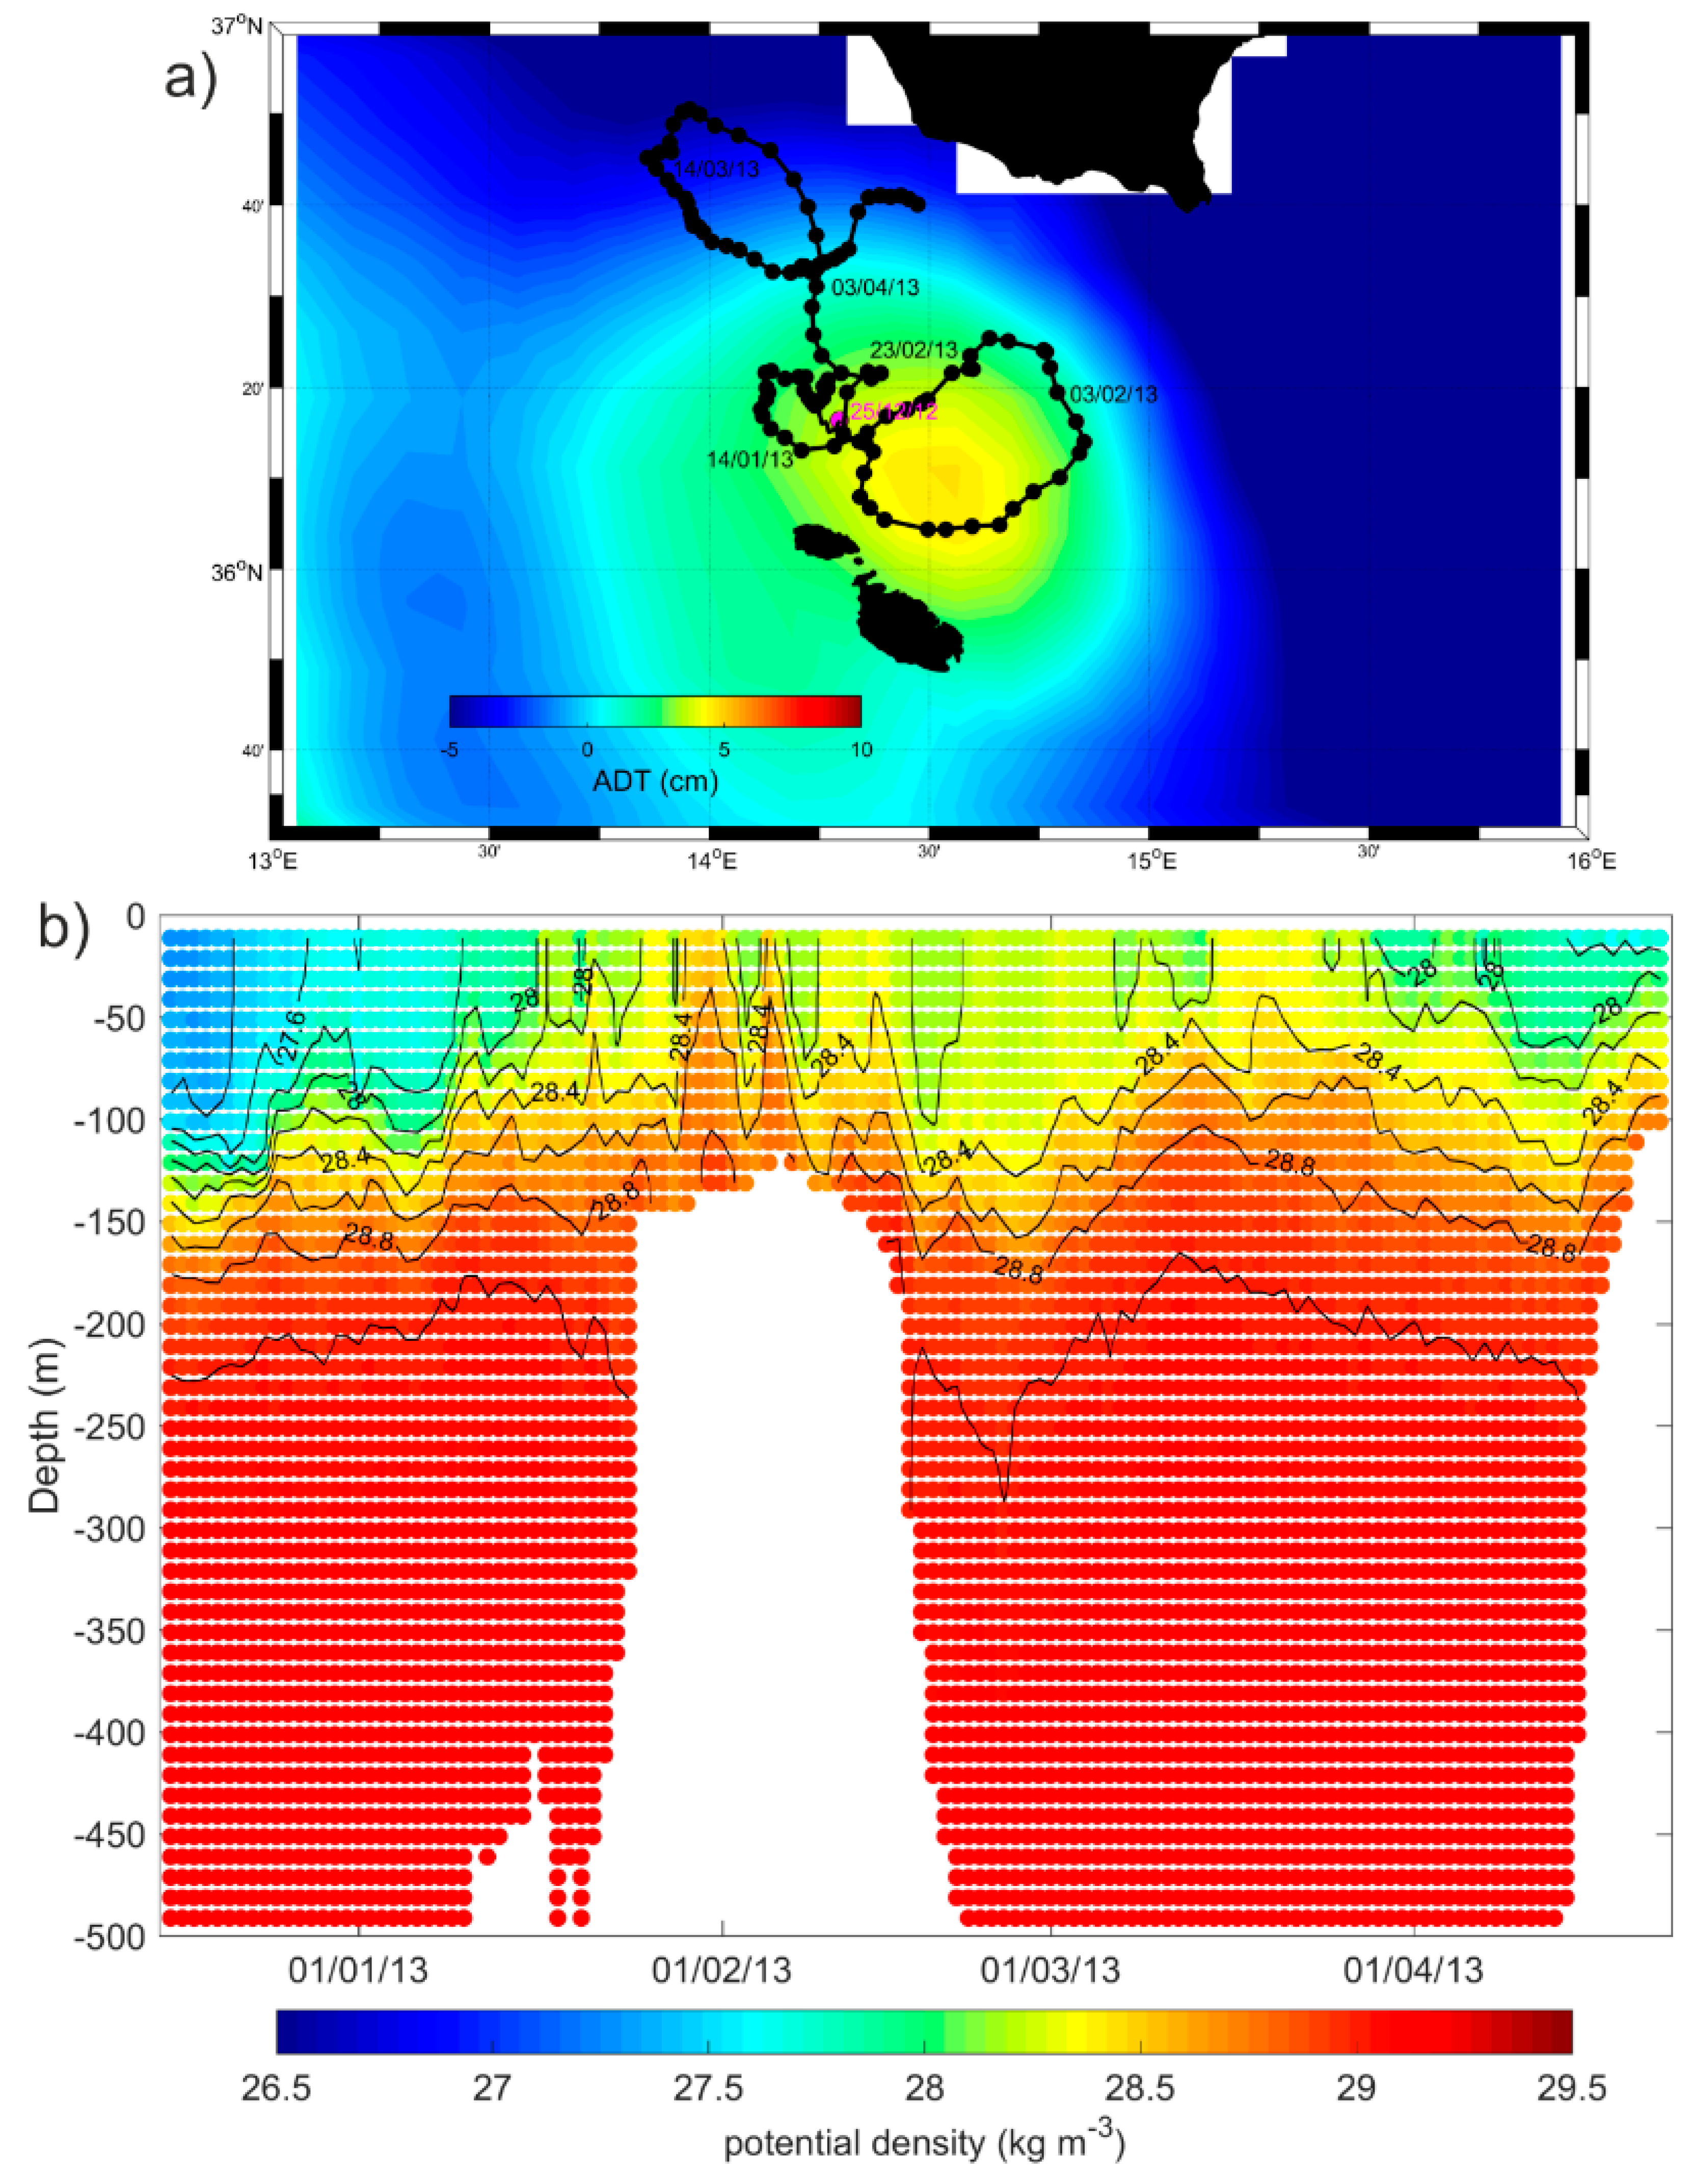
In the framework of the Italia-Malta Calypso Project [28], about 38 drifters were deployed on the Malta plateau between December 2012 and September 2016. These drifters were captured by the anticyclonic gyre on the plateau in two specific deployments, December 2012 and March 2014 (Figure 9). From December 2012 through January 2013, drifters were captured by the anticyclonic gyre for about four weeks (approximately between 14 December 2012 and 10 January 2013) before being transported out of the plateau (Figure 9a). This gyre is also confirmed by the trajectory of the float WMO 6901044 (Figure 10a) and by HF radar measurements [29,30]. On 22 March 2014, six drifters were deployed in the area and were trapped in the gyre for about 2 weeks (Figure 9b). Drifters allow for estimating the radius and the rotation period of the structure considering the centroids computed from all the closed loops of the drifter trajectories. The radius spanned between 11 and 27 km and the period increased from 4.1 to 8.4 days, coinciding with an increased distance from the centre.
The float WMO 6901044 was entrapped in the MCC between 15 December 2012 and 17 February 2013, then it joined a cyclonic structure located north-west of the Malta Plateau (Figure 10a). It had a cycling period of 1 day, and its trajectory gives an indication of the 350 m displacements (see Table 2). In the first part of its tracks, the float sampled the interior of the anticyclonic MCC, showing a deepening of the isopycnal surfaces (December 2012–January 2013) and reduced densities. In February 2013, the float moved along the border of the MCC, then it was entrapped in the cyclonic structure located in the north-western proximities of the Malta plateau (Figure 10b). Both the MCC and the cyclonic structure show a similar vertical structure, extending to a depth of about 200–250 m (Figure 10b).

3.4.3. South of Malta

The time series of the vorticity fields obtained at the locations of the mesoscale eddies south and south-west of Malta are shown in Figure 11. The MG (35°–35.5° N; 13°–14° E) and the SMA (35.5°–36° N; 14°–14.5° E), two adjacent structures located south-west of the Maltese Islands, show larger variabilities of the vorticity field, with respect to the SMG (34°–35° N; 13°–14° E) and LSBV (33°–33.5° N; 12.5°–14° E). This behaviour is probably related to the wind-stress, which is more intense in the Malta region than in the southern SC (Figure 2c). The vorticity of SMA increased with time over the considered period.
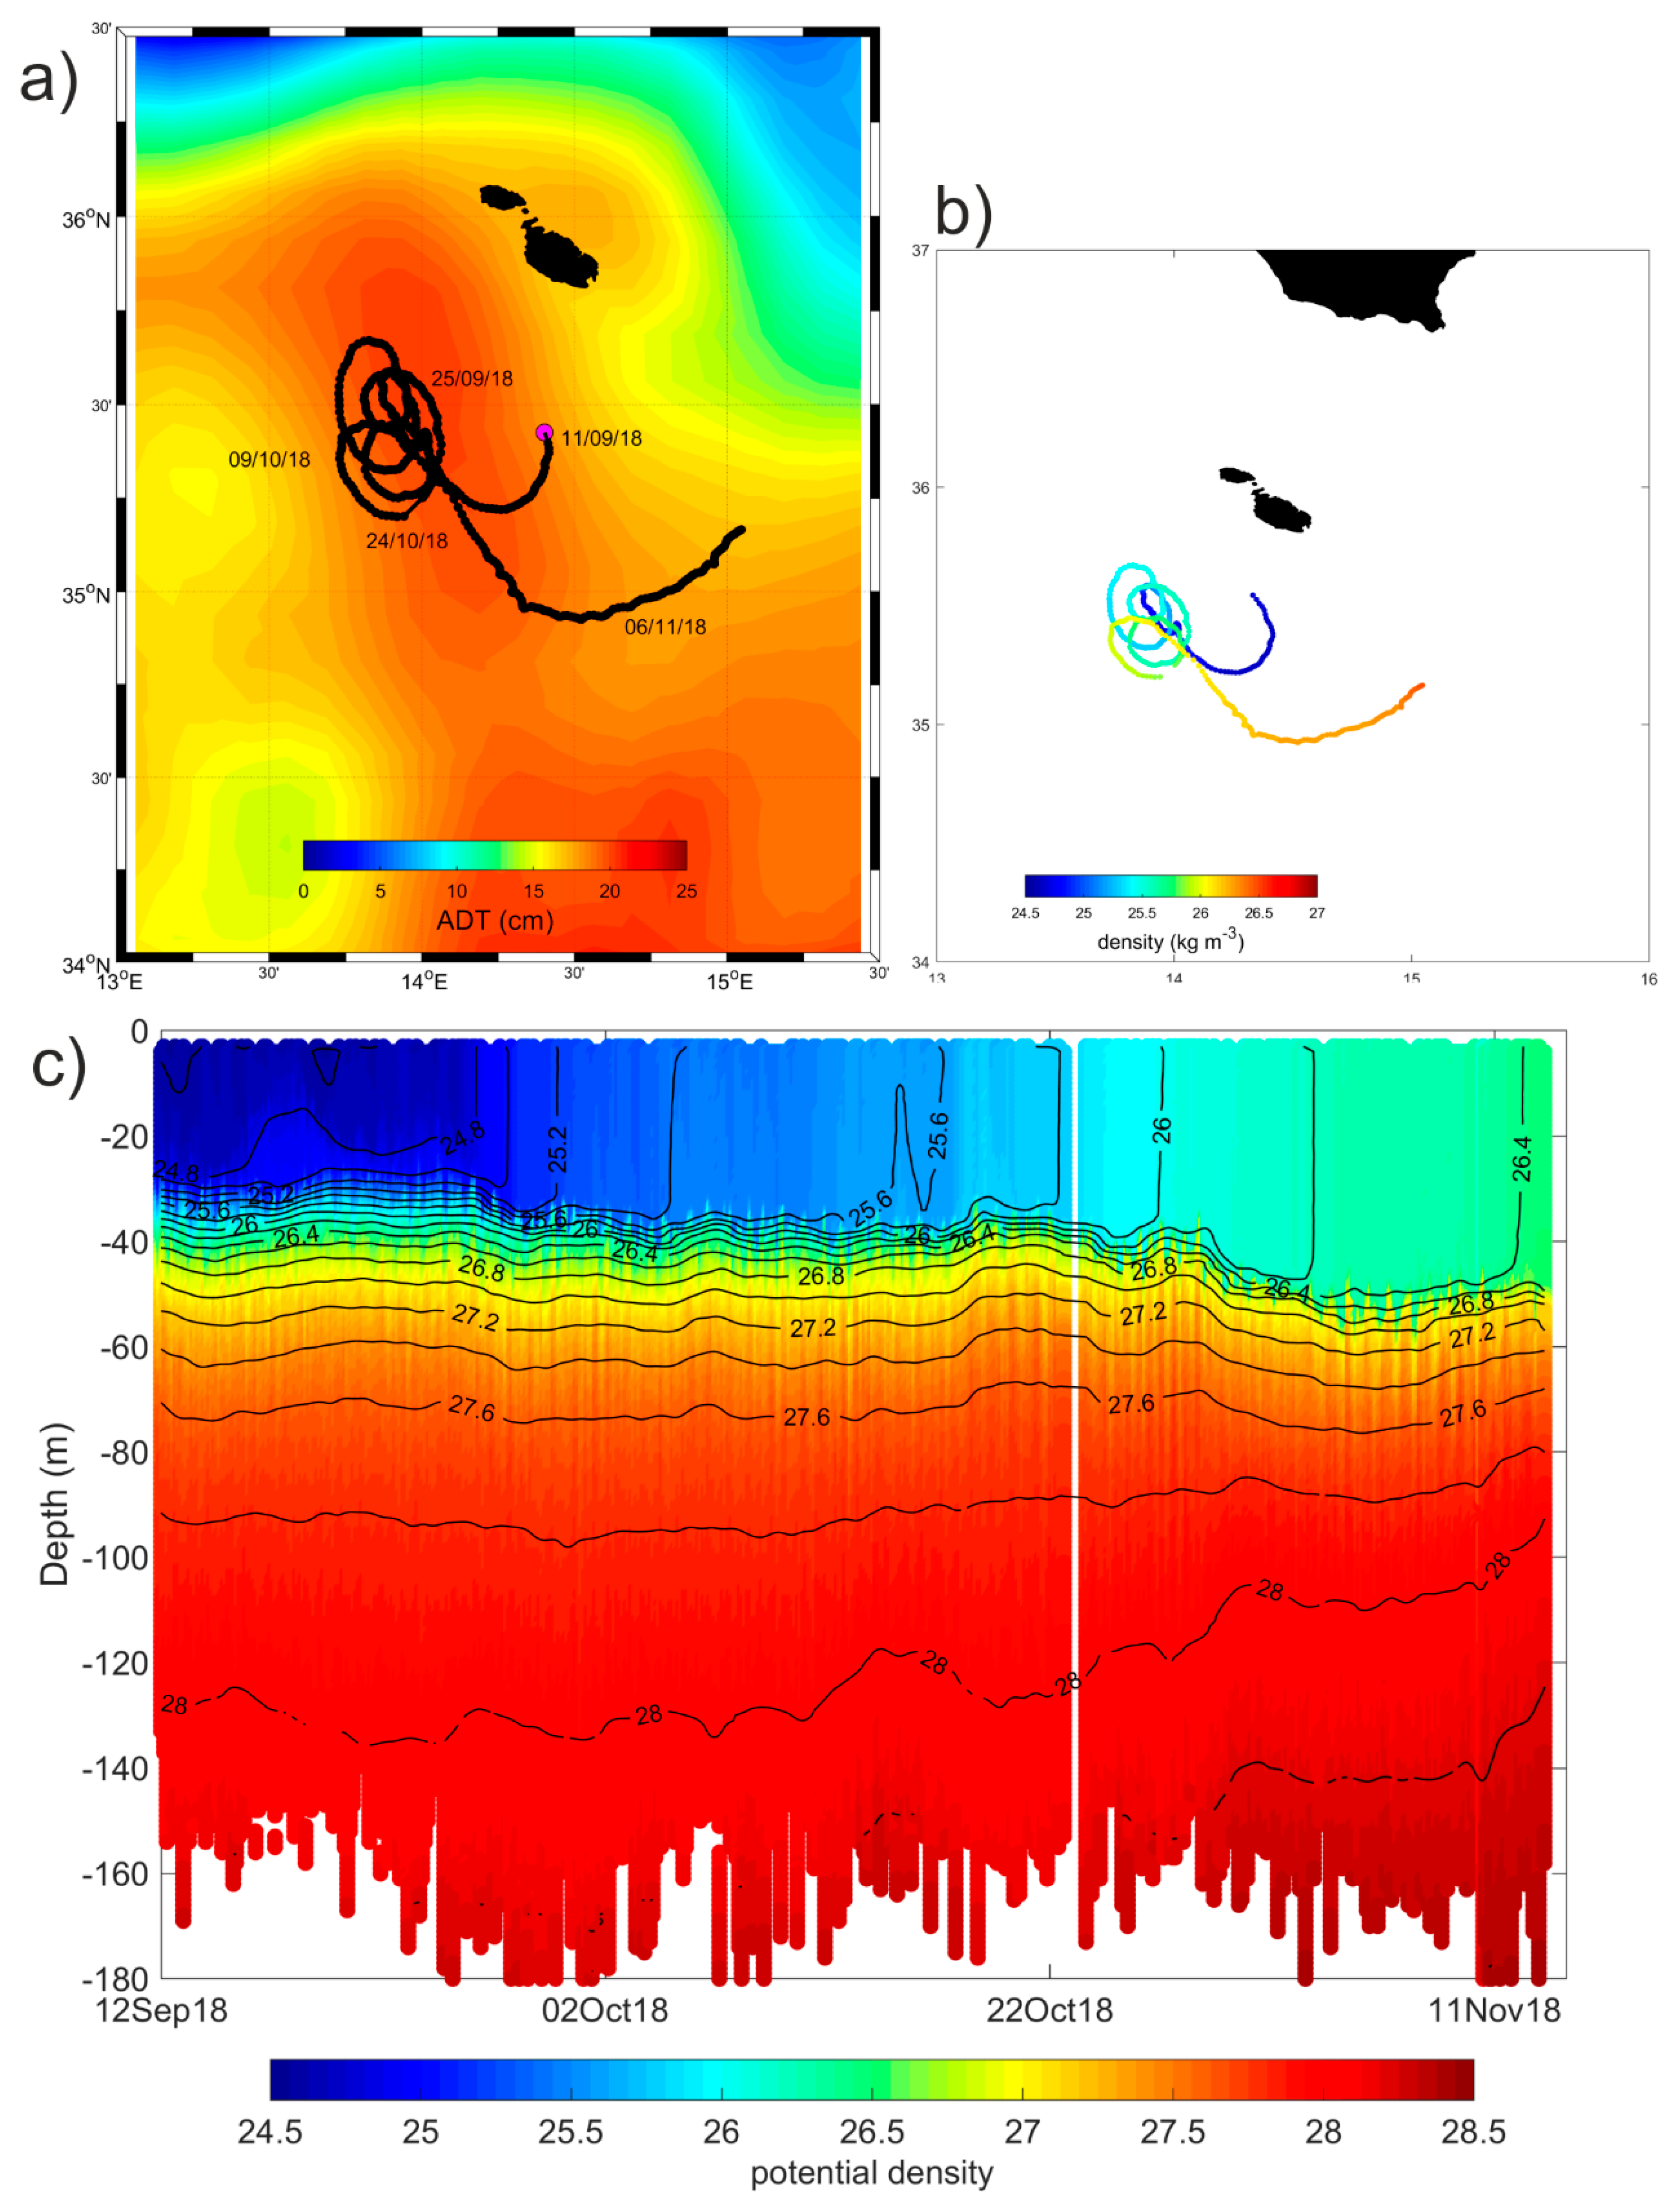
The float WMO 6903242, became entrapped in the anticyclonic SMA in mid-September 2018 and described five loops around the eddy core before being captured by the eastward BATC (Figure 12a). It had a short cycling period (see Table 2) and its trajectory indicates the mean near surface displacements (0–180 m). The subsurface density distribution clearly shows the net differences between the water masses located east (potential density smaller than 24.8 kg/m3) and south (potential density larger than 26 kg/m3) of the of SMA (Figure 12b). The SMA extends down to a depth of about 40 m (Figure 12c). At the end of October 2018, the float left the cyclonic structures and moved eastward, encountering surface waters of eastern origin and denser than 1026 kg/m3.
The float WMO 1900629, coming from the Libyan coast, was entrapped in the cyclonic SMG at the end of 2007 (Figure 13a). This structure is denser than the surrounding waters (Figure 13b). Since, in the region of the SMG, the maximum depth of the sea bottom is about 400 m (Figure 1a), and since the cyclonic trajectory of the float WMO 1900629 (Figure 13a) represents the displacements of the currents at the parking depth of 350 m (see Table 2), we can conclude that the cyclonic structure affects the entire water column in this area.
The cyclonic LSBV is sampled by the float WMO 1900948 during the period from October 2015 to February 2016 is shown in Figure 14a. The entrance of this float in the LSBV is emphasized in Figure 14b by a higher density, compared to the surrounding waters, and by changes in the shape of the isopycnal surfaces. Even if float WMO 1900948 has a parking depth of 1000 m (see Table 2), its displacements represent the current at 350 m depth, due to the bathymetry of the LSBV region (see Figure 1a and Figure 14b). We can conclude that the cyclonic structure affects the entire water column in this area (Figure 14b).

3.4.4. Ionian Cyclones

Figure 15a shows the time series of the vorticity field along the eastern coast of Sicily (MRV and ISV area—36.5°–38° N; 15°–16° E) and in the region of the SISV. Figure 15a shows an inconsistency between the vorticity derived from AGV and those derived from the optimal currents in the region of the SISV. From the optimal current validation carried out by Reference [15], this structure lies in an area where the method degrades the quality of the surface currents (in particular of the meridional component), when compared with the AGV (see Figure 10 of [15]). Therefore, the optimal currents could not be consistent in the description of SISV.
The MRV and ISV are wind-driven structures [7,24] and their interannual variability is related to the wind-stress along the eastern coast of Sicily (Figure 15b,c), e.g., lower values of current vorticity in the MRV-ISV regions are related to lower wind-stress and lower wind stress curl. The SISV (35.5°–36.6° N; 15°–16° E) is not influenced by the wind-stress vorticity, whereas it appears to be influenced by the quasi-decadal reversal of the northern Ionian (see black dashed lines in Figure 15a that give an indication of the mean vorticity value during each anticyclonic/cyclonic circulation mode) in the period from 1993 to 2010. After 2010, the vorticity of the currents was no longer consistent with the decadal variability and, rather, seems to be linked to some other phenomena that are not currently detectable from our datasets.
The float WMO 1900954, coming from the eastern Ionian, was entrapped in the SISV in December 2017 (Figure 16a) and showed an increase of density with respect to the water located north of this mesoscale structure (Figure 16b). Even if the float WMO 1900954 has a parking depth of 1000 m (see Table 2), its displacement represents the current at about 500 m depth, due to the bathymetry of the SISV region (see Figure 1a and Figure 16b). The vertical extension of the SISV is about 100 m (Figure 16b).

4. Discussion and Conclusions

The main findings of this work are summarized in Figure 17, where a schematic diagram of the surface circulation, based on the mean circulation map depicted in Figure 2b, is presented. In Figure 17a the main circulation structures are classified according to their seasonal variability, whereas in Figure 17b they are identified based on the main forcing factor that determines them.
The basin scale circulation is essentially oriented according to the wind stress direction (northwest–southeast; Figure 2a,c and Figure 17). Most of the exclusively main sub-basin scale current systems and mesoscale structures are permanent but affected by a strong seasonal variability (Figure 17a). Only the TSC and the PV show a seasonal incidence and occur in summer and winter, respectively. The BTC, ATC, BATC, and ALC show a winter intensification (Figure 17a) concurrent with the intensification of the wind stress (Figure 3 and Figure 4). For this reason, they are classified as wind-driven features in Figure 17b. The relationship between the sub-basin scale structures and the wind stress variability was already suggested by References [13,31]. Other sub-basin scale and mesoscale structures, e.g., the meandering AIS, the SG, and the MCC, are stronger in summer, when the wind stress is weaker. Hence, we exclude the direct impact of the wind on the variability of these structures. Rather, we suggest that they are influenced by other forcings, such as the instability of the surface currents and/or their interaction with the complex and relative shallow bottom topography (Figure 17b), characterized by continental shelves and channels.
The MG and SMA are located in a highly dynamic region (high level of Eddy Kinetic Energy, see Figure 6 of Reference [24] and Figure 9a of Reference [11]) characterized by the split of the ATC, whose eastward branch forms the BATC, and by a sudden reduction of depth (Figure 1a). These factors probably interact in facilitating the eddies formation and retention. From these considerations, the MG and SMA are influenced by the surface current dynamics and/or topography (Figure 17b). They are stronger in winter because the sub-basin currents, involved in their formation (ATC and BATC), are most intense and energetic in this season (Figure 17a).
The ABV, the MRV, and the ISV are located along the southern and the eastern coast of Sicily where the wind stress curl is steadily cyclonic (Figure 2d and Figure 4c,d). Their strength and their interannual variability are influenced by the temporal evolution of the wind stress amplitude and vorticity (Figure 15 and Figure 17b).
The SMG is located on the margins of the African shelf break (Figure 1a and Figure 2a,b) and its vertical extension affects the entire water column (maximum depth of 400 m), as documented by float WMO 1900629 (Figure 13). The wind stress is weak and dimly cyclonic in this region (Figure 2 lower panels). Therefore, we define the SMG in Figure 17b as strongly influenced by the interaction between the surface currents and the topography.
The mesoscale structures located in regions where the influence of the wind stress is lower can be forced by the large-scale internal variability of the ocean. An example of this interaction is the SISV, whose interannual variability is connected to the decadal variability of the surface circulation in the northern Ionian (Figure 15a). However, the most representative example of the influence of internal forcing on the variability of a mesoscale structure is the NSA. This anticyclone, although located in the southern Tyrrhenian Sea, is affected by the decadal variability induced by the adjacent Ionian Sea (Figure 6). This result, as suggested by Reference [27], opens to a new interpretation of the link between different Mediterranean sub-basins and underlines the importance of internal processes on the variability of the mesoscale structures.
In summary, the surface circulation in the SC and southern Tyrrhenian Sea is characterized by multi-scale spatial and temporal variability. The main spatial scales involved are the basin, sub-basin, and mesoscale. The main temporal scales involved are the seasonal, interannual, and decadal scales. In this work, the complexity of the SC current system was investigated by combining different in-situ data and satellite products. Results provide an updated picture of the surface circulation, detecting new mesoscale features and describing their temporal variability and strength in relation to the main external and/or internal forcings. The winter strengthening of the wind stress directly influences most of the structures stronger in this season. The structures stronger in summer and/or located in high dynamical regions are mainly driven by the instability of the surface current and/or by their interaction with the bottom topography. In the regions where the influence of the external forcings is weaker, the large-scale internal variability of the adjacent Mediterranean basins can influence the local dynamics.

Author Contributions

Writing—original draft preparation, M.M.; writing—review and editing, P.-M.P., D.C., A.D. (Andrea Doglioli), G.N., and R.G.; investigation, M.M. and P.-M.P.; data curation, M.M., G.N., R.G., D.C., and M.-H.R.; formal analysis, M.M., G.N., and R.G.; resources, D.C., M.-H.R., A.G., and R.S.; funding acquisition, P.-M.P. and A.D. (Aldo Drago).

Funding

This research was mainly funded by the Italian Ministry of Education, University and Research as part of the Argo-Italy program, and partly funded by the Italia-Malta Programme—Cohesion Policy 2007–2013, European Union Regional Development Funds (ERDF) through the CALYPSO and CALYPSO FO projects. The program MISTRALS of CNRS funded the drifters deployed during the PEACETIME cruise (Guieu C., Desboeufs K., 2017, RV Pourquoi pas? https://doi.org/10.17600/17000300).

Acknowledgments

The authors would like to thanks all the people who have deployed drifters and made their data available in the Mediterranean Sea in the period 1993–2018. We acknowledge Antonio Bussani for his technical support and his work in the production of the Mediterranean drifter dataset, and Elena Mauri for her constructive comments. We thank the two anonymous reviewers for their constructive comments on the manuscript.

Conflicts of Interest

The authors declare no conflict of interest.

References

  1. Sorgente, R.; Olita, A.; Oddo, P.; Fazioli, L.; Ribotti, A. Numerical simulation and decomposition of kinetic energy in the Central Mediterranean: insight on mesoscale circulation and energy conversion. Ocean. Sci. 2011, 7, 503–519. [Google Scholar] [CrossRef] [Green Version]
  2. Schroeder, K.; Chiggiato, J.; Josey, S.A.; Borghini, M.; Aracri, S.; Sparnocchia, S. Rapid response to climate change in marginal sea. Sci. Rep. 2017, 7, 4065. [Google Scholar] [CrossRef] [PubMed]
  3. Jouini, M.; Béranger, K.; Arsouze, T.J.; Beuvier, S.; Thiria, M.; Crepon, I.; Taupier-Letage, I. The Sicily Channel surface circulation revisited using a neural clustering analysis of a high-resolution simulation. J. Geophys. Res. Ocean. 2016, 121, 4545–4567. [Google Scholar] [CrossRef]
  4. Ferron, B.; Bouruet Aubertot, P.; Cuypers, Y.; Schroeder, K.; Borghini, M. How important are diapycnal mixing and geothermal heating for the deep circulation of the Western Mediterranean? Geophys. Res. Lett. 2017, 44, 7845–7854. [Google Scholar] [CrossRef] [Green Version]
  5. Vladoui, A.; Bouruet-Aubertot, P.; Cuypers, Y.; Ferron, B.; Schroeder, K.; Borghini, M.; Leizour, S.; Ben Ismail, S. Turbulence in the Sicily Channel from microstructure measurements. Deep Sea Res. Part I Oceanogr. Res. Pap. 2018, 137, 97–122. [Google Scholar] [CrossRef]
  6. Millot, C.; Taupier-Letage, I. Circulation in the Mediterranean Sea. Handb. Environ. Chem. 2005, 5, 29–66. [Google Scholar]
  7. Lermusiaux, P.F.J.; Robinson, A.R. Features of dominant mesoscale variability, circulation patterns and dynamics in the Strait of Sicily. Deep Sea Res. Part I Oceanogr. Res. Pap. 2001, 48, 1953–1997. [Google Scholar] [CrossRef]
  8. Béranger, K.; Mortier, L.; Gasparini, G.-P.; Gervasio, L.; Astraldi, M.; Crepon, M. The dynamics of the Sicily Strait: A comprehensive study from observations and models. Deep Sea Res. Part II Top. Stud. Oceanogr. 2004, 51, 411–440. [Google Scholar] [CrossRef]
  9. Poulain, P.M.; Zambianchi, E. Surface circulation in the central Mediterranean Sea as deduced from Lagrangian drifters in the 1990s. Cont. Shelf Res. 2007, 27, 981–1001. [Google Scholar] [CrossRef]
  10. Astraldi, M.; Balopoulos, S.; Candela, J.; Font, J.; Gacic, M.; Gasparini, G.P.; Manca, B.; Theocharis, A.; Tintoré, J. The role of straits and channels in understanding the characteristics of Mediterranean circulation. Prog. Oceanogr. 1999, 44, 65–108. [Google Scholar] [CrossRef]
  11. Poulain, P.-M.; Menna, M.; Mauri, E. Surface geostrophic circulation of the Mediterranean Sea derived from drifter and satellite altimeter data. J. Phys. Oceanogr. 2012, 42, 973–990. [Google Scholar] [CrossRef]
  12. Pinardi, N.; Zavatarelli, M.; Adani, M.; Coppini, G.; Fratianni, C.; Oddo, P.; Simoncelli, S.; Tonani, M.; Lyubartsev, V.; Dobricic, S.; et al. Mediterranean Sea large-scale low-frequency ocean variability and water mass formation rates from 1987 to 2007: a retrospective analysis. Prog. Oceanogr. 2015, 132, 318–332. [Google Scholar] [CrossRef]
  13. Molcard, A.; Gervasio, L.; Griffa, A.; Gasparini, G.P.; Mortier, L.; Ozgokmen, T.M. Numerical investigation of the Sicily Channel dynamics: density currents and water mass advection. J. Mar. Syst. 2002, 36, 219–238. [Google Scholar] [CrossRef]
  14. Amores, A.; Jordà, G.; Arsouze, T.; Le Sommer, J. Up to what extent can we characterize ocean eddies using present day gridded altimetric products? J. Geophys. Res.Ocean. 2018, 123. [Google Scholar] [CrossRef]
  15. Ciani, D.; Rio, M.-H.; Menna, M.; Santoleri, R. A synergetic approach for the space-based sea surface currents retrieval in the Mediterranean Sea. Remote Sens. 2019, 11, 1285. [Google Scholar] [CrossRef]
  16. Menna, M.; Gerin, R.; Bussani, A.; Poulain, P.-M. The OGS Mediterranean Drifter Database: 1986–2016; Technical report 2017/92 Sez. OCE 28 MAOS; OGS: Trieste, Italy, 2017. [Google Scholar]
  17. Menna, M.; Poulain, P.-M.; Bussani, A.; Gerin, R. Detecting the drogue presence of SVP drifters from wind slippage in the Mediterranean Sea. Measurement 2018, 125, 447–453. [Google Scholar] [CrossRef]
  18. Rio, M.H.; Pascual, A.; Poulain, P.-M.; Menna, M.; Barcelò, B.; Tintorè, J. Computation of a new mean dynamic topography for the Mediterranean Sea from model outputs, altimeter measurements and oceanographic in situ data. Ocean. Sci. 2014, 10, 731–744. [Google Scholar] [CrossRef] [Green Version]
  19. Poulain, P.-M.; Barbanti, R.; Font, J.; Cruzado, A.; Millot, C.; Gertman, I.; Griffa, A.; Molcard, A.; Rupolo, V.; Le Bras, S.; et al. MedArgo: a drifting profiler program in the Mediterranean Sea. Ocean. Sci. 2007, 3, 379–395. [Google Scholar] [CrossRef] [Green Version]
  20. Rio, M.H.; Santoleri, R. Improved global surface currents from the merging of altimetry and Sea Surface Temperature data. Remote Sens. Environ. 2018, 216, 770–785. [Google Scholar] [CrossRef]
  21. Piterbarg, L.I. A simple method for computing velocities from tracer observations and a model output. Appl. Mat. Model. 2009, 33, 3693–3704. [Google Scholar] [CrossRef]
  22. Atlas, R.; Hoffman, R.N.; Ardizzone, J.; Leidner, S.M.; Jusem, J.C.; Smith, D.K.; Gombos, D. A cross-calibrated, multiplatform ocean surface wind velocity product for meteorological and oceanographic applications. Bull. Am. Meteorol. Soc. 2011, 92, 157–174. [Google Scholar] [CrossRef]
  23. Shabrang, L.; Menna, M.; Pizzi, C.; Lavigne, H.; Civitarese, G.; Gačić, M. Long-term variability of the southern Adriatic circulation in relation to North Atlantic Oscillation. Ocean. Sci. 2016, 12, 233–241. [Google Scholar] [CrossRef] [Green Version]
  24. Menna, M.; Reyes Suarez, N.C.; Civitarese, G.; Gacic, M.; Poulain, P.-M.; Rubino, A. Decadal variations of circulation in the Central Mediterranean and its interactions with the mesoscale gyres. Deep Sea Res. Part II: Top. Stud. Oceanogr. 2019, in press. [Google Scholar] [CrossRef]
  25. Aulicino, G.; Cotroneo, Y.; Lacava, T.; Sileo, G.; Fusco, G.; Carlon, R.; Satriano, V.; Tramutoli, V.; Budillon, G. Results of the first wave glider experiment in the southern Tyrrhenian Sea. Adv. Oceanogr. Limnol. 2016, 7, 16–35. [Google Scholar] [CrossRef]
  26. Ciappa, A.C. Surface circulation patterns in the Sicily Channel and Ionian Sea as revealed by MODIS chlorophyll images from 2003 to 2007. Contin. Shelf Res. 2009, 29, 2099–2109. [Google Scholar] [CrossRef]
  27. Rubino, A.; Zanchettin, D.; Androsov, A.; Voltzinger, N.-E. Tidal record as liquid climate archives for large-scale interior Mediterranean variability. Sci. Rep. 2018, 8, 12586. [Google Scholar] [CrossRef]
  28. Drago, A.; Ciraolo, G.; Capodici, F.; Cosoli, S.; Gacic, M.; Poulain, P.-M.; Tarasova, R.; Azzopardi, J.; Gauci, A.; Maltese, A.; et al. CALYPSO—An Operational Network of HF Radars for the Malta-Sicily Channel. In Proceedings of the Seventh International Conference on EuroGOOS, Lisbon, Portugal, 28–30 October 2014; Dahlin, H., Fleming, N.C., Petersson, S.E., Eds.; EuroGOOS Publication: Brussels, Belgium, 2015. No. 30. ISBN 978-91-974828-9-9. [Google Scholar]
  29. Capodici, F.; Cosoli, S.; Ciracolo, G.; Nasello, C.; Maltese, A.; Poulain, P.-M.; Drago, A.; Azzopardi, J.; Gauci, A. Validation of HF radar sea surface currents in the Malta-Sicily Channel. Remote Sens. Environ. 2019, 225, 65–76. [Google Scholar] [CrossRef]
  30. Reyes Suarez, N.C.; Cook, M.S.; Gačić, M.; Paduan, J.D.; Cardin, V. Estimation of sea surface circulation structures in the Malta-Sicily Channel from remote sensing data. Water 2019. under review. [Google Scholar]
  31. Pinardi, N.; Navarra, A. Baroclinic wind adjustment processes in the Mediterranean Sea. Deep Sea Res. Part II Top. Stud. Oceanogr. 1993, 40, 1299–1326. [Google Scholar] [CrossRef]
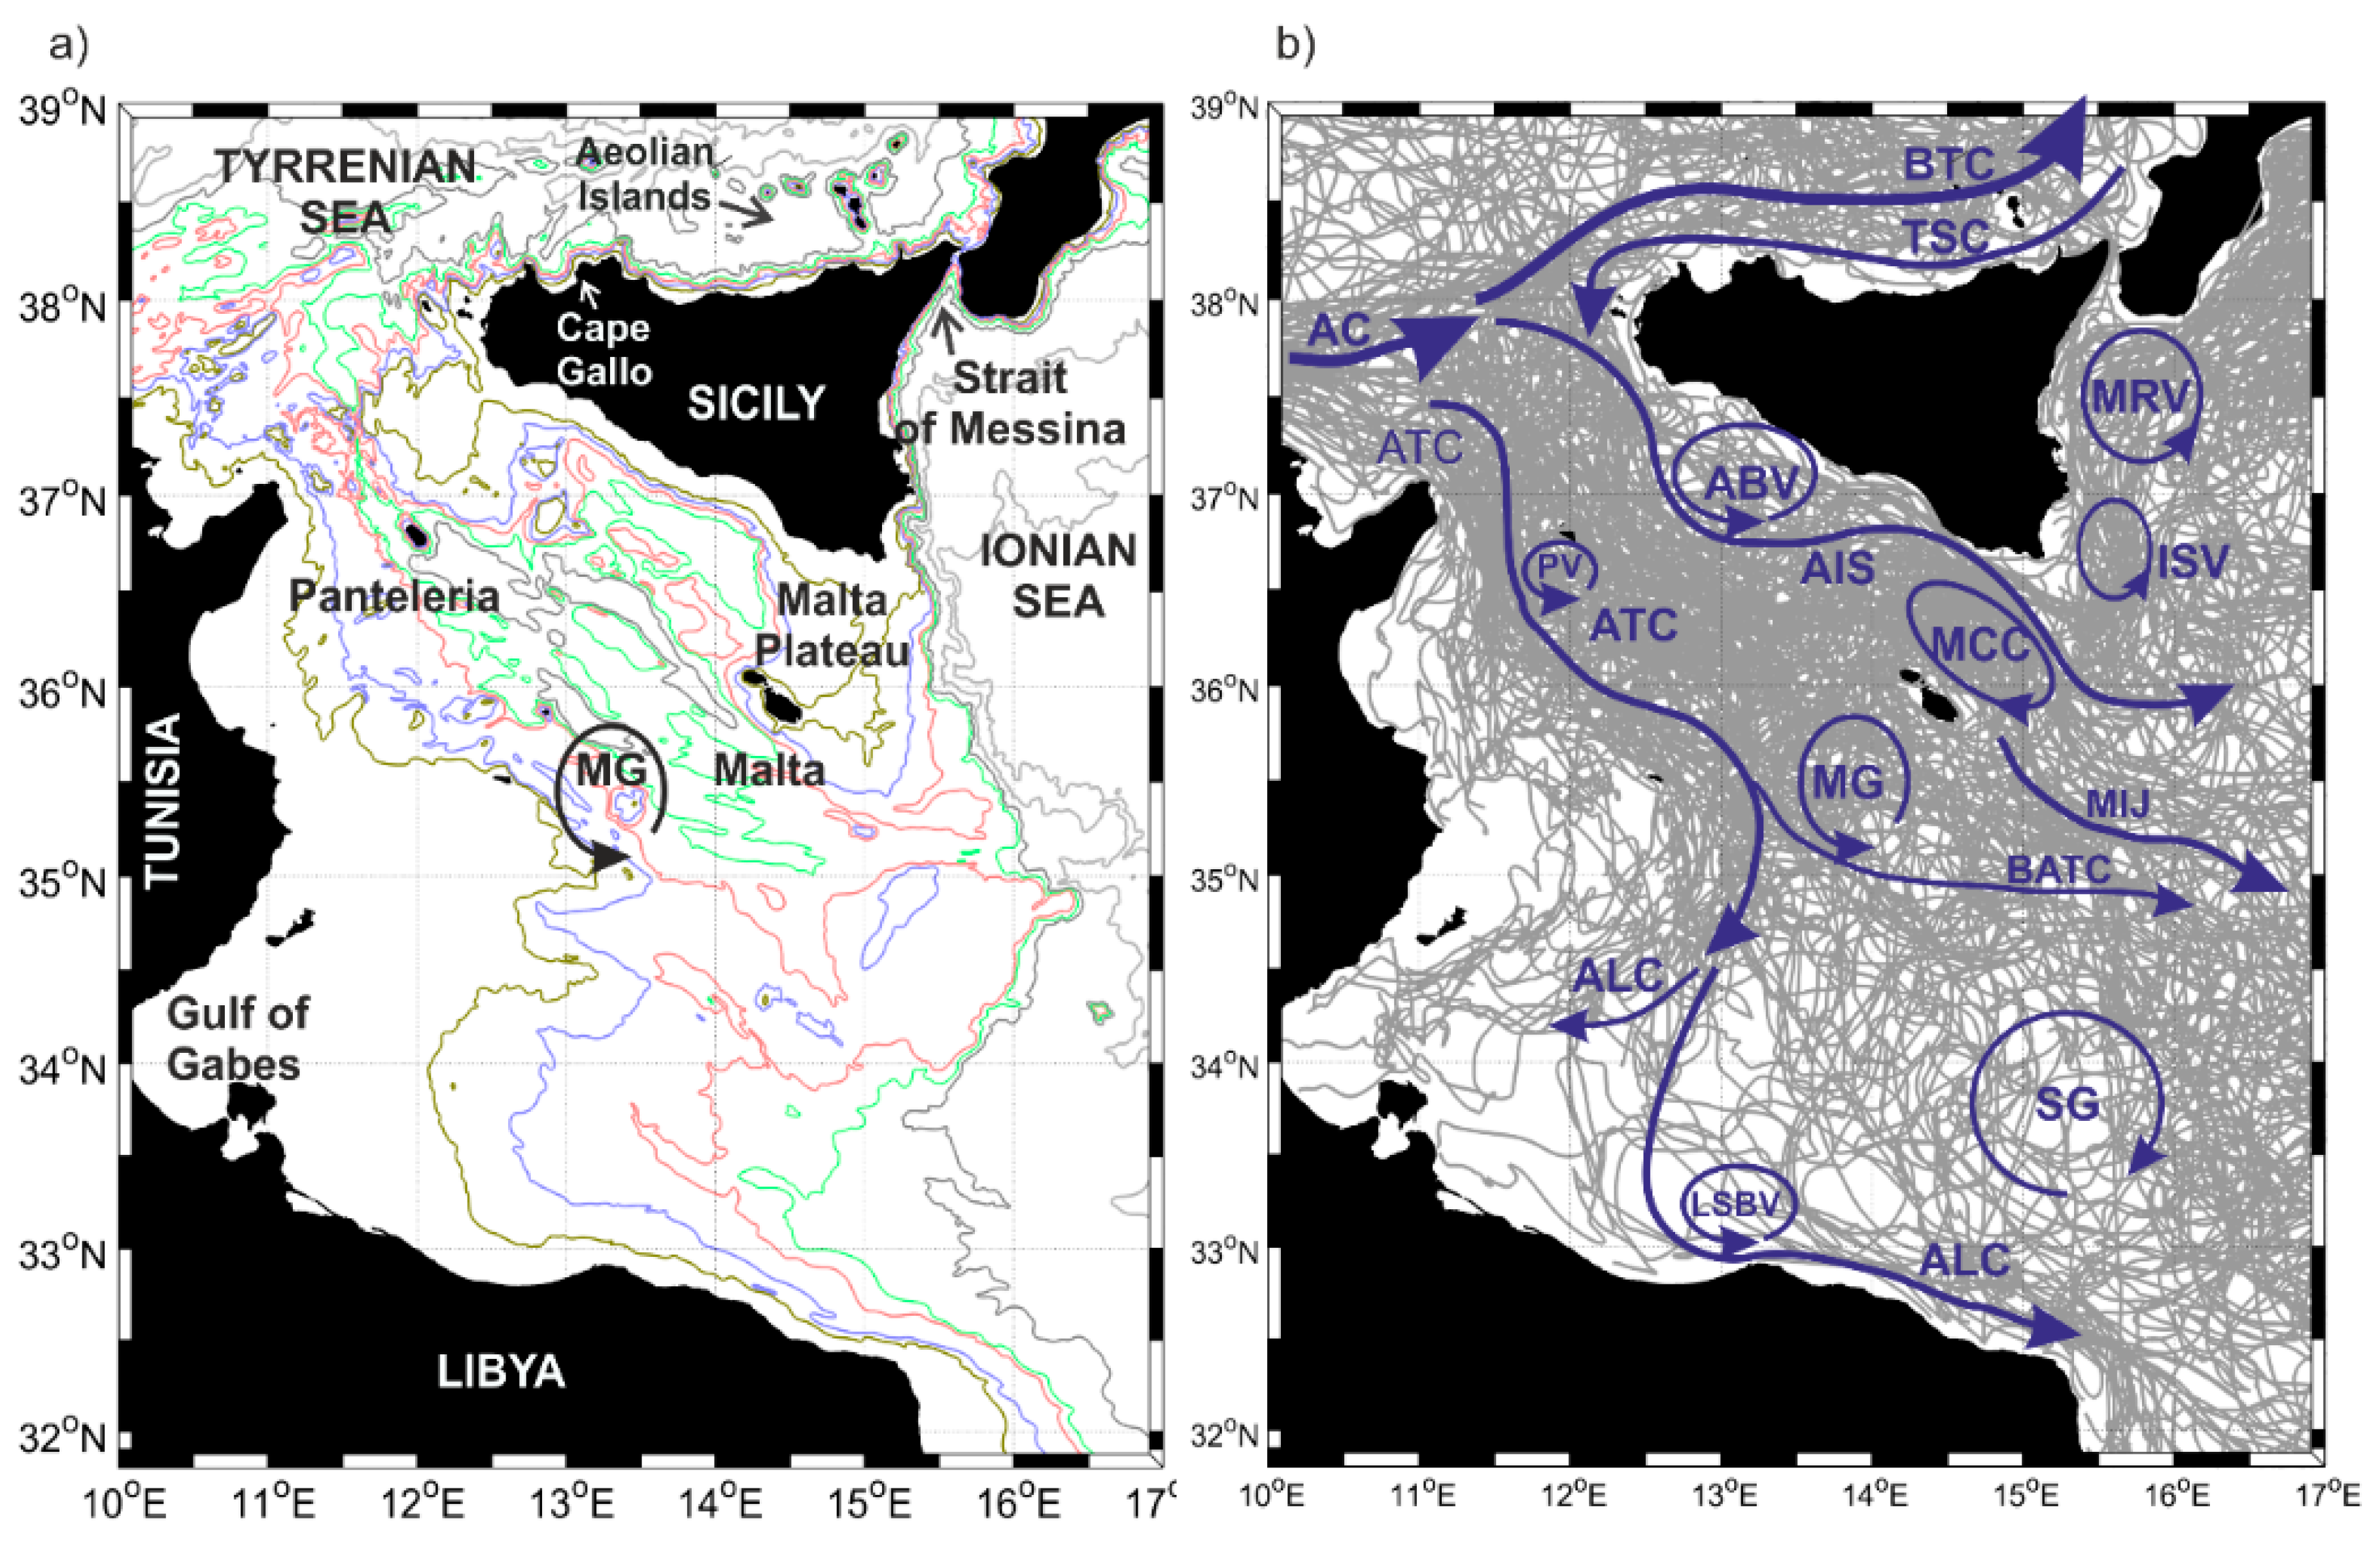
Figure 1. (a) Bathymetry of the SC (100 m, 200 m, 400 m, 600 m, 1000 m, 2000 m isobaths) and geographical references. (b) Low-pass filtered drifter trajectories in the SC between 1993 and 2018, superimposed with the schematic surface circulation adapted from [1,3]. Acronyms are listed in Table 1.
Water 11 01355 g001
Figure 2. Mean drifter currents (a) in spatial bins of 0.25° × 0.25° (blue vectors) superimposed on mean maps of absolute dynamic topography (colors) during the period from 1993 to 2018. Mean optimal currents (b) in spatial bins of 1/12° (vectors; one vector every two grid points is plotted) superimposed on mean maps of absolute dynamic topography (colors) during the period from 2012 to 2016. The structures emphasized with white arrows in panels (a,b) are new or with different shapes and positions with respect to those described in Figure 1b. The structures already known are highlighted with pink arrows. (c) Mean map of the wind stress amplitude (colors) and direction (vectors) and (d) wind stress curl over the period from 1993 to 2016.
Water 11 01355 g002
Figure 3. Pseudo-Eulerian drifter statistics (blue vectors) superimposed on mean maps of the absolute dynamic topography (colors) for the (a) extended summer and (b) extended winter. The schematic circulation structures superimposed on the current fields are colored with red arrows (a) when they are most intense in summer and with light blue arrows (b) when they are most intense in winter. Mean optimal currents in spatial bins of 1/12° (blue vectors: one vector every two grid points is plotted) superimposed on mean maps of absolute dynamic topography (colors) during the period from 20 12to 2016 for the (c) extended summer and (d) extended winter.
Water 11 01355 g003
Figure 4. Mean map of the wind stress (upper panels) amplitude (colours) and direction (vectors) and (d) wind stress curl (lower panels) over the extended summer (a,c) and extended winter (b,d).
Water 11 01355 g004
Figure 5. Mean maps of absolute geostrophic velocity anomalies (vectors) superimposed to the absolute dynamic topography anomalies (colours) during (a) anticyclonic (1993–1996, 2006–2010, 2017–2018) and (b) cyclonic (1997–2005 and 2011–2016) circulation modes in the northern Ionian.
Water 11 01355 g005
Figure 6. Time series of the spatially averaged, low pass filtered (13 month) vorticity field over the regions of the NSA and SCA. Dashed-dotted lines refer to the vorticity field derived from the AGV. The continuous lines are related to the vorticity field derived from optimal currents from 2012 to 2016. The dashed black lines show the average values of the vorticity over each anticyclonic/cyclonic period of the Northern Ionian Gyre.
Water 11 01355 g006
Figure 7. Map of the trajectory (black line) and profile positions (First profile: Magenta dot; Other profiles: Black dots) of the float WMO 6900981 superimposed on the mean map of the ADT (between 18 April 2012 and 3 January 2013) (a) and contour diagram of the potential density versus depth and time (b).
Water 11 01355 g007
Figure 8. Time series of the spatially averaged, low pass filtered (13 month) vorticity field over the regions of the Malta plateau. Dashed-dotted lines are referred to the vorticity field derived from the AGV; continuous lines are related to the vorticity field derived from optimal currents from 2012 to 2016.
Water 11 01355 g008
Figure 9. Trajectories and deployment positions (black dots) of the drifters deployed on the Malta Plateau in December 2012 (a) and March 2014 (b).
Water 11 01355 g009
Figure 10. Map of the trajectory (black line) and profile positions (First profile: Magenta dot; Other profiles: Black dots) of the float WMO 6901044, superimposed on the mean map of the ADT (between 16 December 2012 and 30 April 2013) (a) and contour diagram of the potential density versus depth and time (b).
Water 11 01355 g010
Figure 11. Time series of the spatially averaged, low pass filtered (13 month) vorticity field over the regions of MG, SMA, SMG, and LSBV. Dashed-dotted lines refer the vorticity field derived from the AGV. The continuous lines are related to the vorticity field derived from optimal currents from 2012 to 2016.
Water 11 01355 g011
Figure 12. Map of the trajectory (black line) and profile positions (First profile: Magenta dot; Other profiles: Black dots) of the float WMO 6903242, superimposed on the mean map of the ADT (between 12 September 2018 and 11 November 2018) (a). Map of the potential density measured at 20 m depth (b) and contour diagram of the potential density versus depth and time (c).
Water 11 01355 g012
Figure 13. Map of the trajectory (black line) and profile positions (First profile: Magenta dot; Other profiles: Black dots) of the float WMO 1900629, superimposed on the mean map of the ADT (between 27 August 2007 and 23 February 2008) (a) and contour diagram of the potential density versus depth and time (b).
Water 11 01355 g013
Figure 14. Map of the trajectory (black line) and profile positions (First profile: Magenta dot; Other profiles: Black dots) of the float WMO 1900948 superimposed on the mean map of the ADT (between 19 July 2015 and 28 February 2016) (a), and contour diagram of the potential density versus depth and time (b).
Water 11 01355 g014
Figure 15. (a) Time series of the spatially averaged, low pass filtered (13 month) vorticity field over the regions of the MRV-ISV and SISV. Dashed-dotted lines refer to the vorticity field derived from the AGV. The continuous lines are related to the vorticity field derived from optimal currents from 2012 to 2016; (b) time series of the monthly, spatially averaged low-pass filtered (13 month) wind-stress and (c) wind stress vorticity in the MRV region.
Water 11 01355 g015
Figure 16. Map of the trajectory (black line) and profile positions (First profile: Magenta dot; Other profiles: Black dots) of the float WMO 1900954, superimposed on the mean map of the ADT (between 20 October 2016 and 7 March 2017) (a) and contour diagram of the potential density versus depth and time (b).
Water 11 01355 g016
Figure 17. Schematized representation of the mean surface circulation in the Sicily Channel and Southern Tyrrhenian Sea (black arrows), based on the mean optimal current circulation map depicted in Figure 2b (bright grey vectors). (a) Black arrows emphasize the permanent sub-basin and mesoscale structures; dashed red/blue lines emphasize the seasonal summer/winter structures, respectively; red/blue arrows are superimposed on the black arrows when the structures are permanent but most intense in summer/winter, respectively. (b) Sub-basin and mesoscale structures are classified according to the mechanisms that drive them, wind forcing (orange arrows), the interaction between currents and topographical forcings (light green arrows), and large-scale internal processes (light purple arrows).
Water 11 01355 g017
Table 1. List of acronyms used in this paper.
Geographical Names
SCSicily Channel
Water Masses
AWAtlantic Water
LIWLevantine Intermediate Water
Currents
ACAlgerian Current
AISAtlantic Ionian Stream
ALCAtlantic Libyan Current
ATCAtlantic Tunisian Current
MIJMid-Ionian Jet
BTCBifurcation Tyrrhenian Current
BATCBifurcation Atlantic Tunisian Current
TSCTyrrhenian Sicilian Current
Gyres and Eddies
ABVAdventure Bank Vortex
ISVIonian Shelf break Vortex
LSBVLibyan Shelf Break Vortex
MGMedina Gyre
MCCMaltese Channel Crest
MRVMessina Rice Vortex
NSANorthern Sicily Anticyclone
PVPantelleria Vortex
SCASicily Channel Anticyclone
SGSidra Gyre
SISVSouthern Ionian Shelf break Vortex
SMGSouthern Medina Gyre
SMASouthern Maltese Anticyclone
Physical Properties
ADTAbsolute Dynamic Topography
AGVAbsolute Geostrophic Velocities
Table 2. List of selected Argo float profiles with dates and positions of the first and the last profile considered in this work, parking and profiling depths, and the cycle period of each instrument.
Float WMOFirst ProfileLast ProfileParking Depth (m)Profile Depth (m)Cycle Period (days)
690098123 April 20123 January 2013350600/20005
38.9° N, 13.6° E38.8° N, 14.9° E
690104416 December 201222 April 20133507001
36.3° N, 14.3° E36.7° N, 14.5° E
690324211 September 201813 November 20182002000.125
35.4° N, 14.4° E35.2° N, 15.0° E
190062922 August 20075 March 2008350700/20005
33.7° N, 13.5° E34.5° N, 13.9° E
190094819 July 201528 February 2016100015004
33.0° N, 15.6° E32.9° N, 15.0° E
190095416 October 20165 March 2017100015004
35.8° N, 15.6° E35.2° N, 14.8° E