1. Introduction
During the berthing and deberthing processes, the quay structure is often present in close proximity to the ship propeller, and the resulting local scour hole that forms the base of the quay wall is a growing concern, as it may cause structural instability or even failure. The Permanent International Association of Navigation Congresses [
1] reported that ship propeller-induced jet flow has been recognized as the main cause of scour around the quay structures. With reference to the impact of propeller jets, Sumer and Fredsøe [
2] stated that the quay structures can be categorized into two principal types, closed and open quays. The former is characterized by a vertical solid wall that is constructed in the berth front to resist the horizontal load from the landfill and any other live loads. The latter, on the other hand, consists of a slope foundation, above which the quay slab is supported by a group of piles, columns or lamellar walls.
The scour problems caused by propeller jets in both types of quay have received extensive attention over the past decades. For the closed quay, Stewart [
3] and Hamill et al. [
4] systematically investigated the scouring action related to a stern propeller whose axis is perpendicular to the quay wall. Their results suggested that the maximum scour depth was significantly augmented when compared to that in the absence of any quay structures. Furthermore, they reported that the maximum scour depth exhibited a monotonically decreasing trend with the increasing wall clearance (=the longitudinal distance between the propeller and quay wall). Following a similar experimental configuration to that of Stewart [
3] and Hamill et al. [
4], Ryan [
5] further extended their work by introducing the effect of a rudder in his study. As for the open quay, Sleigh [
6] and Cihan et al. [
7] experimentally investigated propeller-induced scour around an open quay with the focus on erosion on the quay slope itself. More recently, Wei and Chiew [
8] and Wei et al. [
9] examined the characteristics of the local scour hole around the toe of the quay slope, showing that the maximum scour depth first increases and then decreases with increasing toe clearance (=longitudinal distance between propeller and slope toe) until the quay effect becomes insignificant. To date, various empirical equations have been proposed to determine the maximum scour depth for both the closed and open quays. Although of important practical use, these studies have shed limited light on the underlying scouring mechanisms due to a lack of detailed flow field data within the scour hole, which is crucial to understanding the effect of the flow structure and the type of quay on the development of the scour.
In the case of the open quay, Wei and Chiew [
10] made the first attempt at investigating the mean flow and turbulence characteristics within the developing scour hole, in which the scouring mechanism was found to be subjected to the jet diffusion and quay obstruction effects. Their relative dominance, which is dependent on the magnitude of the toe clearance, dictates the characteristics of the final scour hole. For the closed quay, Wei and Chiew [
11] detailed the flow properties associated with the impingement behavior between the propeller jet and a vertical quay wall but in the absence of an erodible sand bed. Their results evidence the complex flow nature of the impinging jet. Thus far, few, if any, studies have been carried out to quantify how an impinging propeller jet flow induces the local scour hole around a vertical quay wall, and therefore a comprehensive understanding of the underlying physics remains elusive. For this reason, the main objective of the current study is to furnish a complementary investigation on this subject, which is of great importance for both the fundamental understanding and potential practical application to scour protection.
In what follows, the experimental setup and methodology are first introduced. Then, the asymptotic scour profiles and the associated flow patterns are discussed with four different wall clearances. Moreover, the temporal development of the vortex system within the developing scour hole is presented, together with a comparison of the circulation associated with each individual vortex. Furthermore, an energy spectra analysis of the time series of velocity fluctuations is conducted to examine the turbulent energy dissipation and its implication for the scouring process. Finally, near-bed flow characteristics are also discussed in terms of their correlation with the scouring development.
2. Experimental Setup and Methodology
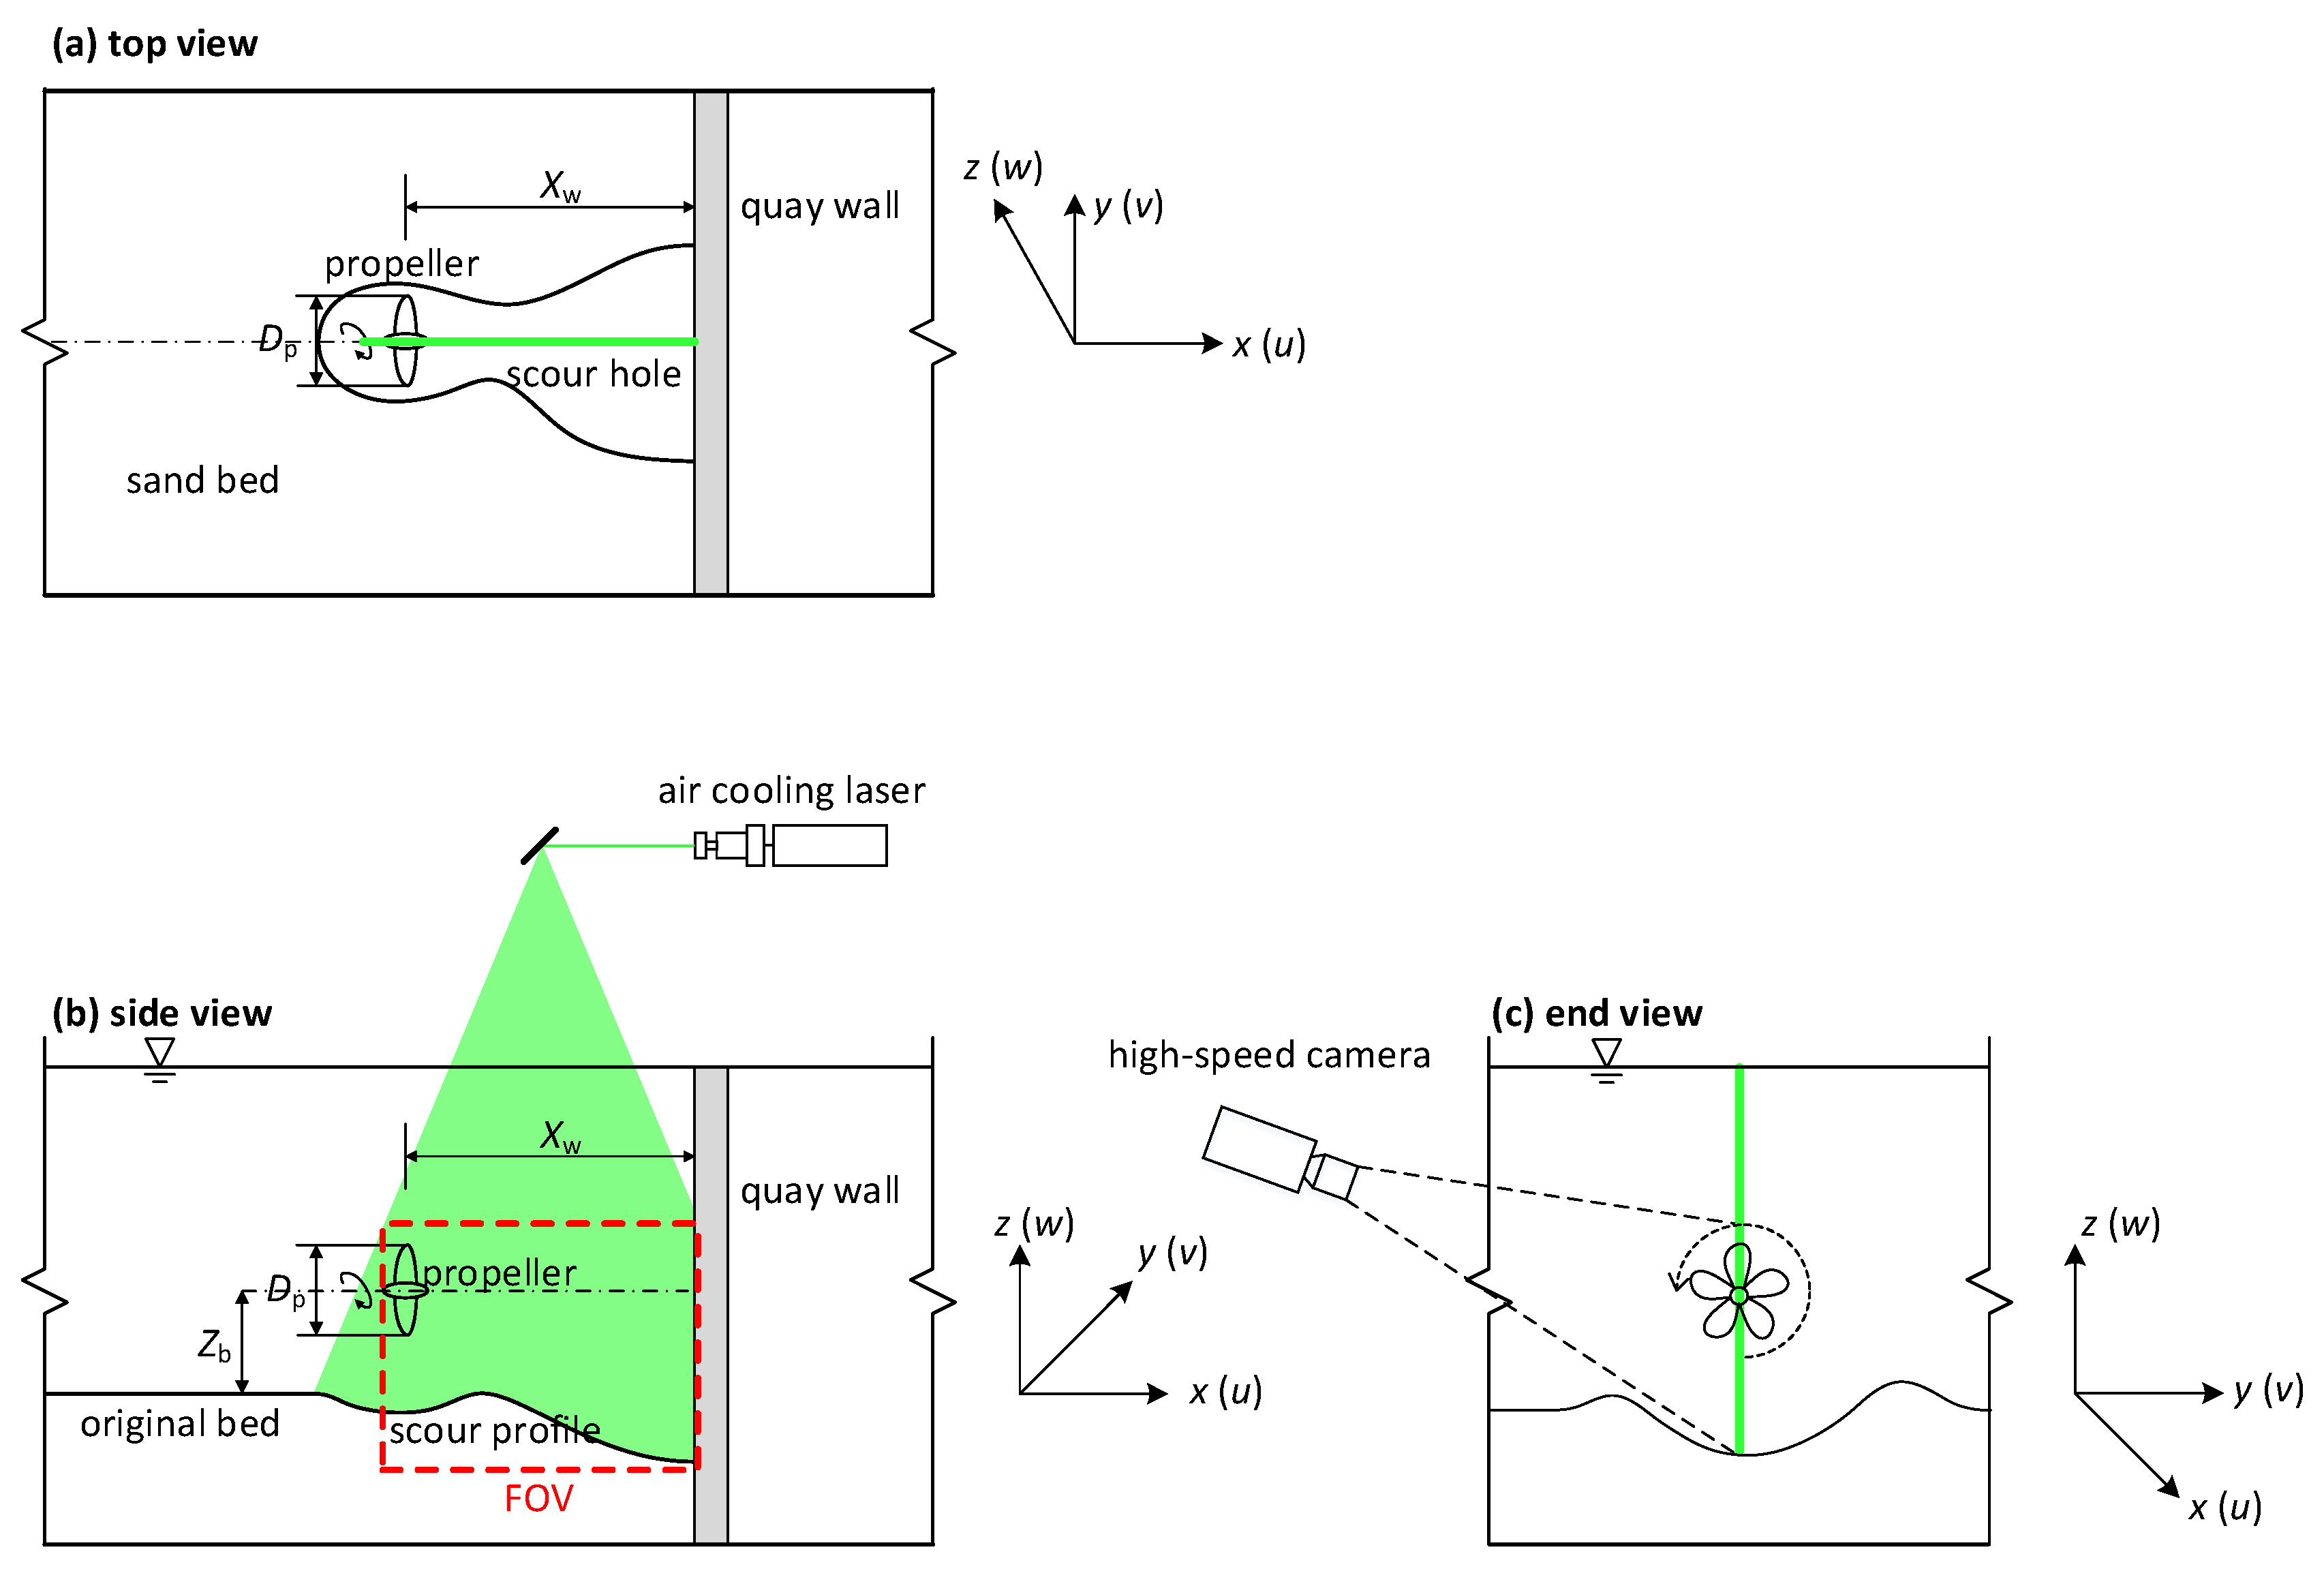
The experiments were conducted in a straight flume that is 11 m long, 0.6 m wide, and 0.7 m deep, in the Hydraulic Modeling Laboratory, Nanyang Technological University. The glass-sided flume walls enabled optical observations through the use of PIV techniques. The test section was located at a distance of 7 m downstream from the flume entrance. A five-bladed propeller with an overall diameter of
Dp = 7.5 cm and a hub diameter of
Dh = 1.0 cm was used in this study. The propeller rig was mounted on an appropriately designed movable carriage that spanned transversely across the flume and could be moved along the longitudinal rail installed on the sidewalls of the flume. In this way, the propeller was able to operate at different clearances from the model quay wall, namely the wall clearance
Xw, which is defined as the longitudinal distance between the propeller face and vertical wall. The quay model located downstream of the propeller was built using an acrylic plate with a dimension of 60 cm (height = water level) × 60 cm (width = flume width) × 2 cm (thickness). A 10 cm thick sand bed with uniform sediment of
d50 (=0.45 mm) was placed on the bottom of the flume. The still water depth above the sand bed was 0.5 m, which is reasonably deep, such that the effect of the free surface is negligible. Before the commencement of each test, the sand bed was carefully prepared and leveled to minimize the compaction difference among different test runs. The experimental setup is shown in
Figure 1, in which a right-handed coordinate system (
o-
xyz) is adopted, with the origin located at the undisturbed bed level and directly beneath the propeller face plane. The
x-axis is streamwise-oriented along the bottom centerline, the
y-axis spanwise-oriented toward the starboard, and the
z-axis along the upward vertical. Accordingly, the mean velocity components in the direction of (
x,
y,
z) are represented by (
u,
v,
w). The PIV system comprised a 5-W air-cooling laser with a wavelength of 532 nm as the light source and a high-speed camera. The laser was placed on top of the flume and the beam emitted from the laser source passed through the optics, resulting in a laser light fan of 1.5 mm thickness being cast down into the water. The laser sheet was set to align with the propeller axis of rotation, which is in the vertical plane of symmetry of the flume (see
Figure 1a). In this way, the streamwise flow data were collected from the sectional view of the jet central plane (see
Figure 1b). Meanwhile, using GetData Graph Digitizer Software, the centerline scour profile was determined from the illuminated line where the laser sheet intersects the sand bed. The high-speed camera used (Phantom Miro 320 with Nikkor 50 mm f/1.4 lens) had a maximum resolution of 1920 × 1200 pixels, 12-bit depth, and more than 1200 frames per second (fps) sampling rate. A sampling rate of 300 fps was used in this study to ensure that the particle displacement was within 50% overlap between adjacent interrogation windows for cross-correlation analyses. Aluminium particles with
d50 of 10 μm and specific density of 2.7 were used as seeding particles. The settling velocity of the aluminium particles was estimated to be 92.6 μm/s using Stoke’s law, which is negligible compared with the propeller jet velocity. The same particle has been extensively used in previous studies (e.g., Lin et al. [
12], Hsieh et al. [
13] and Wei et al. [
14]) and validated as a satisfactory seeding particle in PIV applications.
For a three-dimensional scour hole induced by a propeller jet, one may find it difficult to capture the flow field within the scour hole, since the lateral sediment deposition could block the optical access in a normal PIV operation where the camera is 90° to the laser sheet. For this reason, Wei and Chiew [
10] adopted an oblique particle image velocimetry (OPIV) method, in which the camera was tilted with a depression angle, and thus could capture a complete view of the flow field inside the scour hole. By performing an image correction procedure, their error analysis confirmed a reasonable accuracy of the OPIV method in measuring the flow field within a developing three-dimensional scour hole. Guan et al. [
15] have also successfully applied the same protocol for measuring the horseshoe vortex evolution of a pier-scour hole. By following a similar approach as in those studies, the camera in this study was set at a depression angle of 20° to cover a rectangular field of view (FOV) in front of the quay wall as shown in
Figure 1b,c. To ensure that the entire FOV was in focus, the lens aperture was set to
f = 5.6 to achieve a sufficient depth of field for the oblique viewing. Before capturing the particle seeded flow field, a calibration plate (with a regularly spaced grid of markers) was placed at the position of the laser sheet in still water, and a calibration image was obtained as shown in
Figure 2a, which shows that the coordinates of the markers were distorted from their actual positions due to the oblique viewing. To correct this distortion, a third-order polynomial transformation function was employed, in which the calibration coefficients were obtained by fitting the position of the distorted dots to the regular grid as shown in
Figure 2b. Thereafter, the same calibration parameters were applied to correct all the raw PIV images during the postprocessing stage. A comparison of sample images before and after correction is exemplified in
Figure 2c,d. In addition, a Butterworth high pass filter [
16] was applied to filter out undesirable light reflections (low-frequency) and highlight the seeding particles (high-frequency), as illustrated in
Figure 2c,d. The velocity vector fields were then calculated by using the Davis 8.4.0 software, in which a multi-pass iteration process was adopted with the interrogation windows starting from 64 × 64 pixels to 32 × 32 pixels.
To examine the influence of wall clearance on the final scour profile, the tests were conducted at four wall clearances, i.e.,
Xw = 1
Dp, 2
Dp, 3
Dp, and 4
Dp, of which the asymptotic scour profiles and their associated flow fields were measured using OPIV. To further examine the temporal development of the flow and scour subject to the wall confinement, a small clearance of
Xw = 2
Dp was selected as a typical case, for which PIV measurements were carried out during the entire scouring process from the initial instant to the asymptotic state at predetermined time intervals of
t = 0, 0.5, 2, 12, 24 h. The other variables were kept as constant, including the clearance height
Zb =
Dp, and propeller rotational speed
n = 300 rpm (revolution per minute), where
Zb is the vertical distance between the propeller axis and the undisturbed sand bed; and
n is the propeller rotational speed. The specific test conditions are tabulated in
Table 1, in which
Uo is the efflux velocity obtained as the maximum mean velocity along the initial efflux plane (i.e., the propeller disk) [
5]; and
Fo is the densimetric Froude number calculated as
, with
denoting the density of sediment grains,
the density of water, and
the gravitational acceleration. For each case, 3683 images were captured and then used for data analysis. According to a convergence analysis, the maximum residual within the FOV of the mean velocity fields was calculated as 0.00028 m/s. Furthermore, to assess the PIV measurement error, the uncertainty calculation was performed in DaVis software, which quantifies the differences between the two interrogation windows mapped onto each other by the computed displacement vector. In the case of the current study (
Xw = 2
Dp), the velocity vector uncertainty inside the scour hole ranges from 0.002 m/s to 0.023 m/s, which is far less than the target flow velocity. Moreover, a detailed error analysis associated with the OPIV method can be found in Wei and Chiew [
10].
3. Effects of Wall Clearance and Type of Quay
Figure 3 depicts the comparison of the asymptotic scour profiles between the unconfined (
Xw = ∞) and confined cases at different wall clearances (
Xw = 1
Dp, 2
Dp, 3
Dp, and 4
Dp). Also superimposed in the figure is the unconfined profile that was obtained under the same test conditions, but without any quay wall [
10]. Hong et al. [
17] observed that an unconfined propeller scour hole comprises a small scour hole directly beneath the propeller (due to the ground vortex), a primary scour hole (due to jet diffusion) and a deposition mound. In contrast,
Figure 3 shows that the confined scour profiles around a vertical quay wall were significantly altered, as the primary scour hole was truncated in length but enlarged in depth. In general, with the increasing wall clearance, the development of the scour profile exhibits a trend approaching that of its unconfined counterpart. Specifically,
Figure 3a–c show that the scour profiles are featured by a single primary scour hole when
Xw ≤ 3
Dp. As the wall clearance further increases to
Xw = 4
Dp, the wall effect is less pronounced, and the scour profile evolves into a combination of a primary scour hole and a small scour hole immediately in front of the wall (see
Figure 3d). A similar behavior was also observed by Wei and Chiew [
8], who experimentally investigated toe clearance effects on the propeller jet induced scour hole around a sloping quay and found that the asymptotic scour profiles could be classified into three types in terms of the toe clearance, namely, near field (featured by a single toe scour hole), intermediate field (featured by a primary and a toe scour holes), and far field (resembling the unconfined case). However, in terms of the development of the maximum scour depth,
Figure 3 shows that its magnitude appears to decrease monotonically as the wall clearance increases, which agrees well with what was observed in Hamill et al. [
4]. This further confirms the marked difference of the in scouring mechanisms associated with the closed and open quay, as was already pointed out in the introduction section.
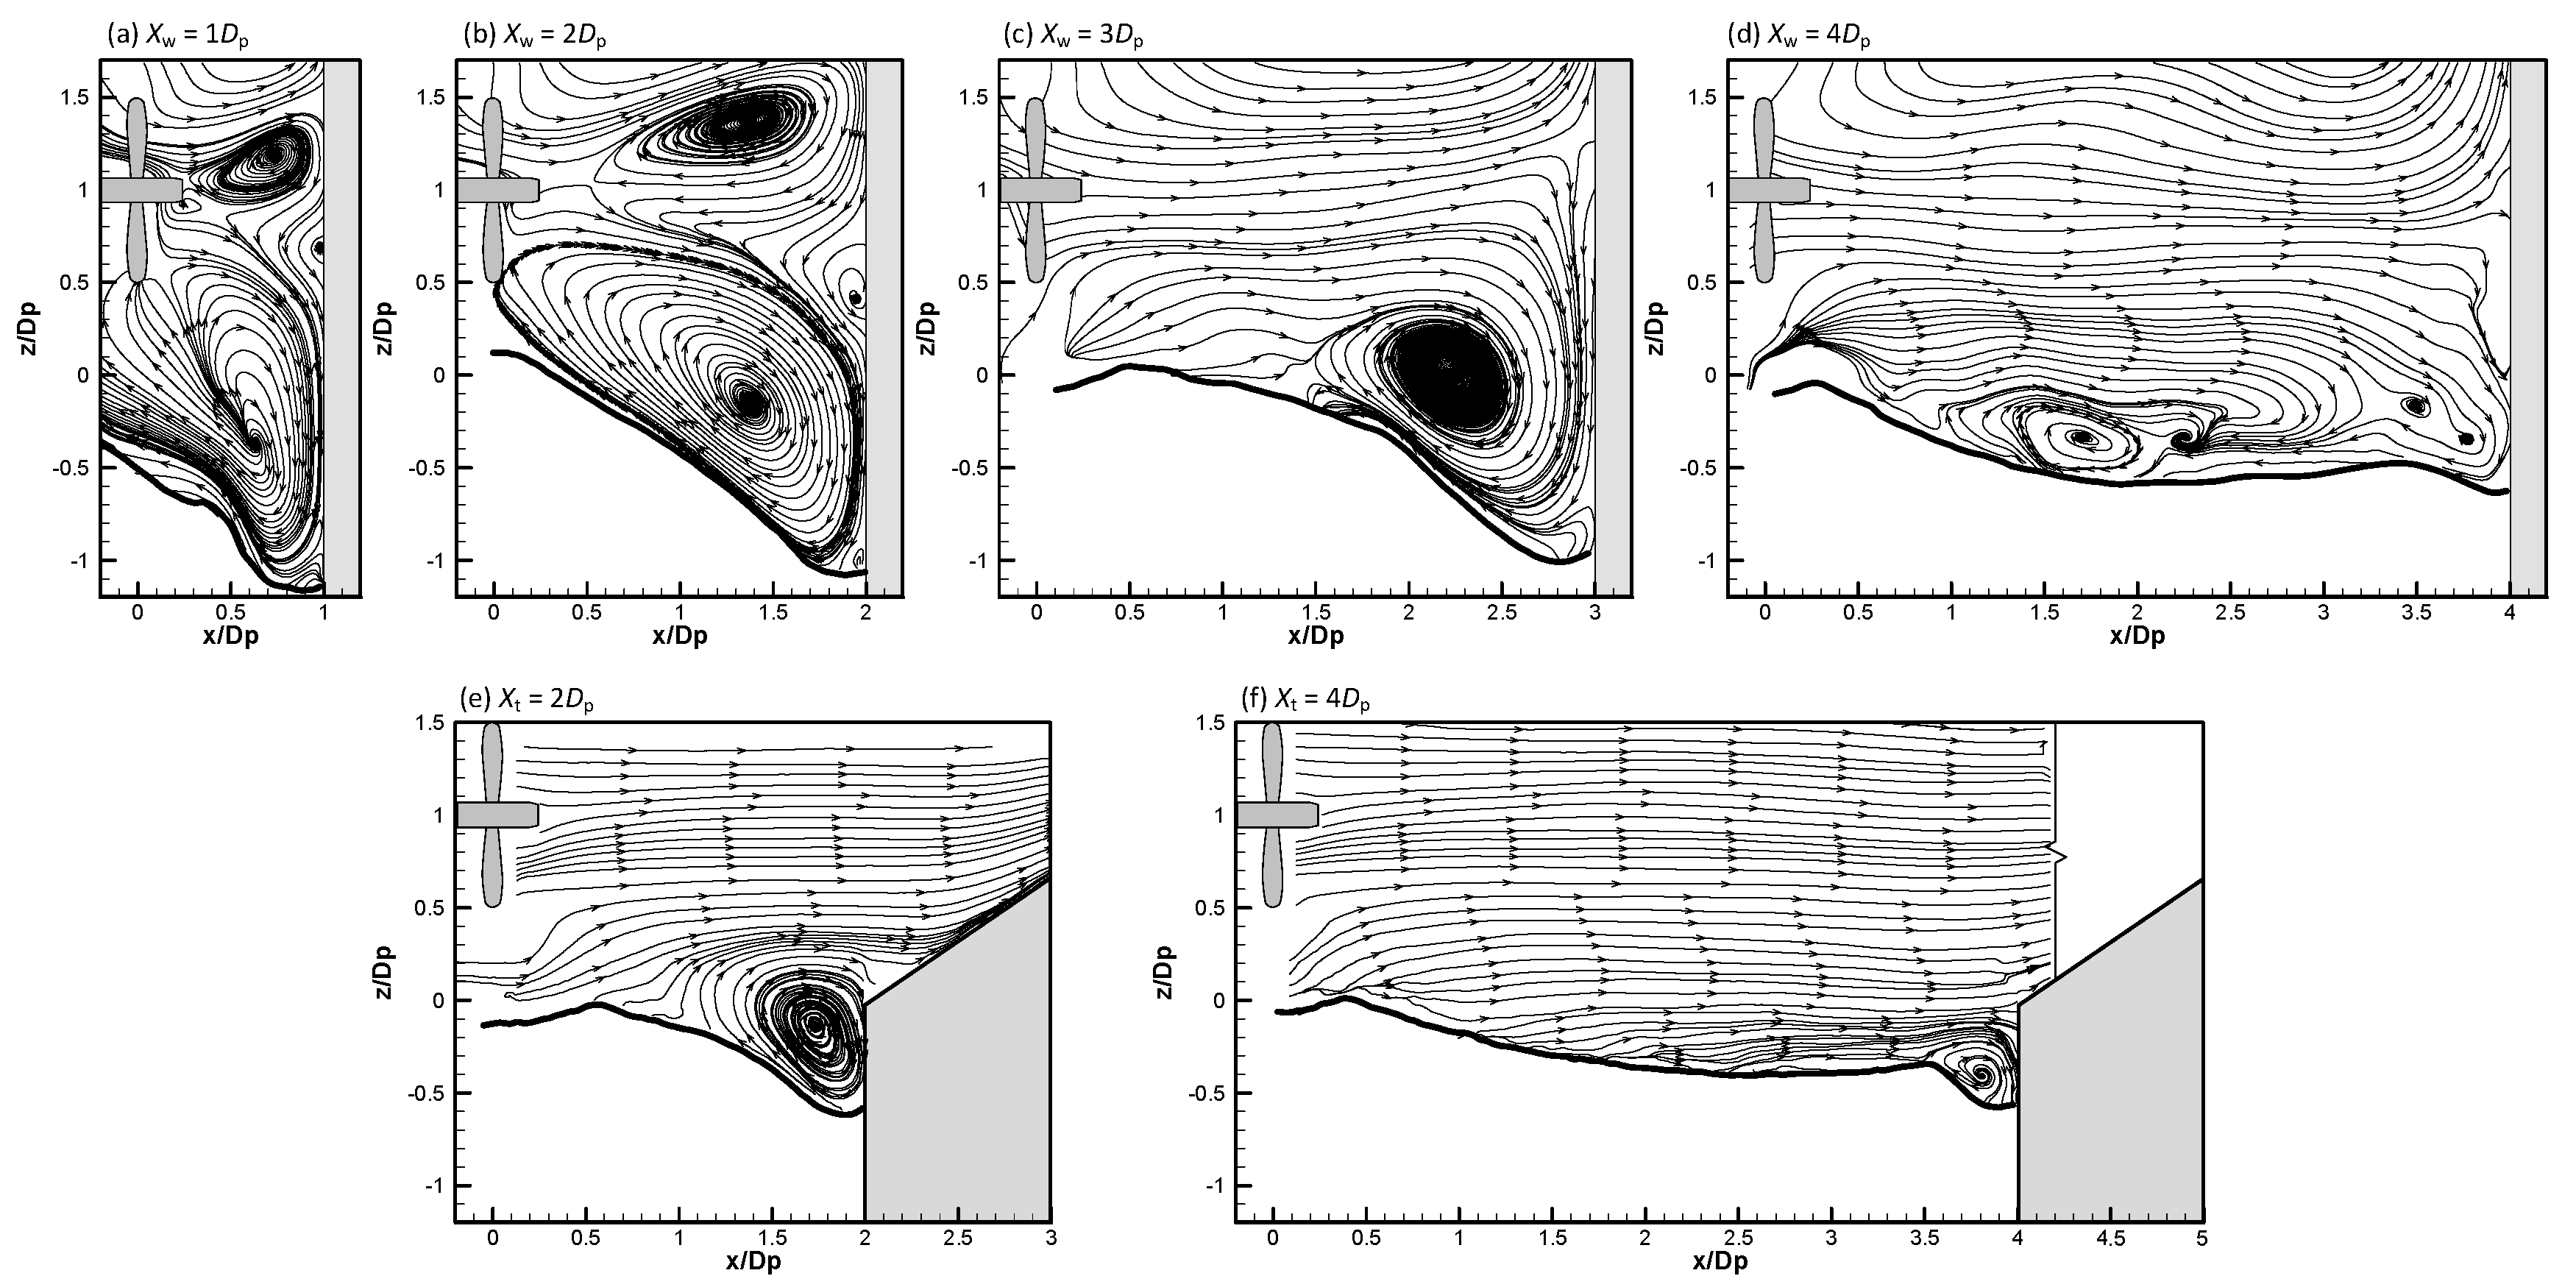
To examine the underlying mechanism associated with the observed scour characteristics at different wall clearances, it is useful at this stage to qualitatively discuss the features of the flow pattern within an asymptotic scour hole, which is most explicitly described in the streamline plots as shown in
Figure 4. Corresponding to
Figure 3,
Figure 4a–d depict a comparison of the results obtained in the present study for the four wall clearances,
Xw = 1
Dp, 2
Dp, 3
Dp, and 4
Dp. Additionally,
Figure 4e,f, which present the flow fields around two typical open quay cases with toe clearances of
Xt = 2
Dp and 4
Dp, are also included in the figure for illustrating the effect of the type of quay. Please note that the open quay cases were conducted by Wei and Chiew [
10] under the same test conditions (e.g., propeller configurations, bed material, etc.) as those in the current study but with an inclining quay.
In general,
Figure 4a,b reveal that the dimension of the asymptotic scour hole is closely related to the size of vortex that resides in it. Specifically,
Figure 4a,b show that with small wall clearances, in other words, intense wall effects, there exists a complex vortex system comprising three vortices in front of the wall, in which the primary vortex completely fills the entire scour hole, signifying its dominating role in shaping the scour hole. As the wall effect decreases with the increase in wall clearance, only one vortex that is responsible for scouring persists at
Xw = 3
Dp (see
Figure 4c). When
Xw = 4
Dp,
Figure 4d reveals that only a feeble vortex remains, with the formation of a small scour hole at the base of the quay wall because the majority of jet energy has already been dissipated before the jet impinges onto the wall. Based on this observation, one can reasonably infer that in the case of the closed quay, the confinement effect of the wall plays a crucial role in generating and stabilizing the vortex, which in turn facilitates the scouring development. An implication of this phenomenon is that the formation of a well-established vortex, i.e., the driving force of the scouring action, is positively related to the wall effect, which provides an explanation for the observed inverse correlation between the maximum scour depth and wall clearance. On the other hand, in the case of the open quay, only one vortex can be observed around the slope toe, even with the small toe clearance of
Xt = 2
Dp (see
Figure 4e). This is because the sharp edge of the slope toe fixes the separation point at the toe, thus limiting the size of the vortex. Moreover, the open type quay, as its name implies, provides an open space above the slope for jet energy dissipation, which allows much of the jet energy to be deflected upwards along the slope upon the flow separation takes place at the toe. This is especially true for the cases with the small clearance, i.e., the near field scenario defined in Wei and Chiew [
10], in which the maximum scour depth is positively correlated with the toe clearance, thus highlighting a significant difference between the scouring mechanism in open and closed quay.
For larger wall/toe clearances,
Figure 4d,f show that for the upstream portion, where the jet essentially is unconfined, the primary scour hole is subject to the direct impact associated with the radial expansion of the jet, in which the underlying scouring mechanism resembles that of an unconfined propeller scour. Given the similarities of the scour profile and the associated flow structures shown in
Figure 4d,f, one may conclude that as the wall/slope effect decreases with the increasing wall/toe clearance, the type of the quay, either closed (with vertical wall) or open (with slope wall) types, does not matter as much as in the small clearance cases.
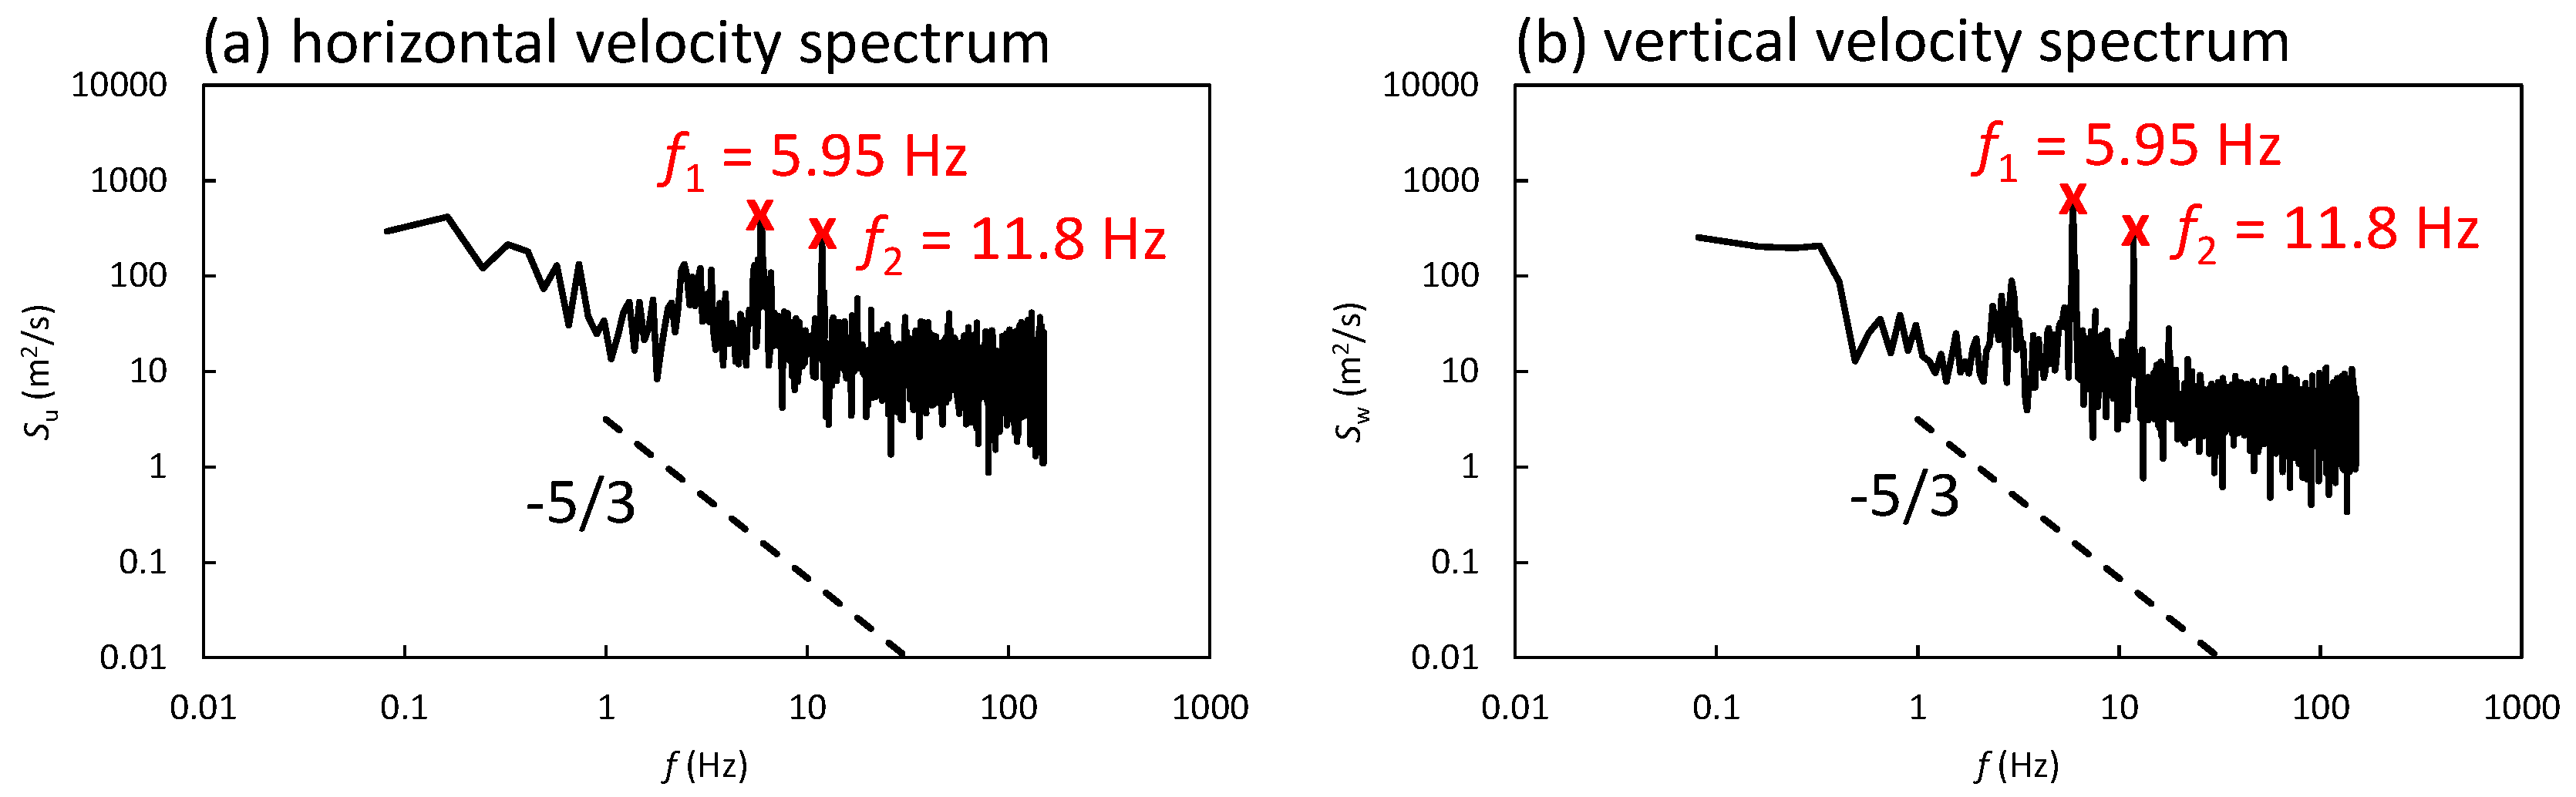
5. Energy Spectra Analysis
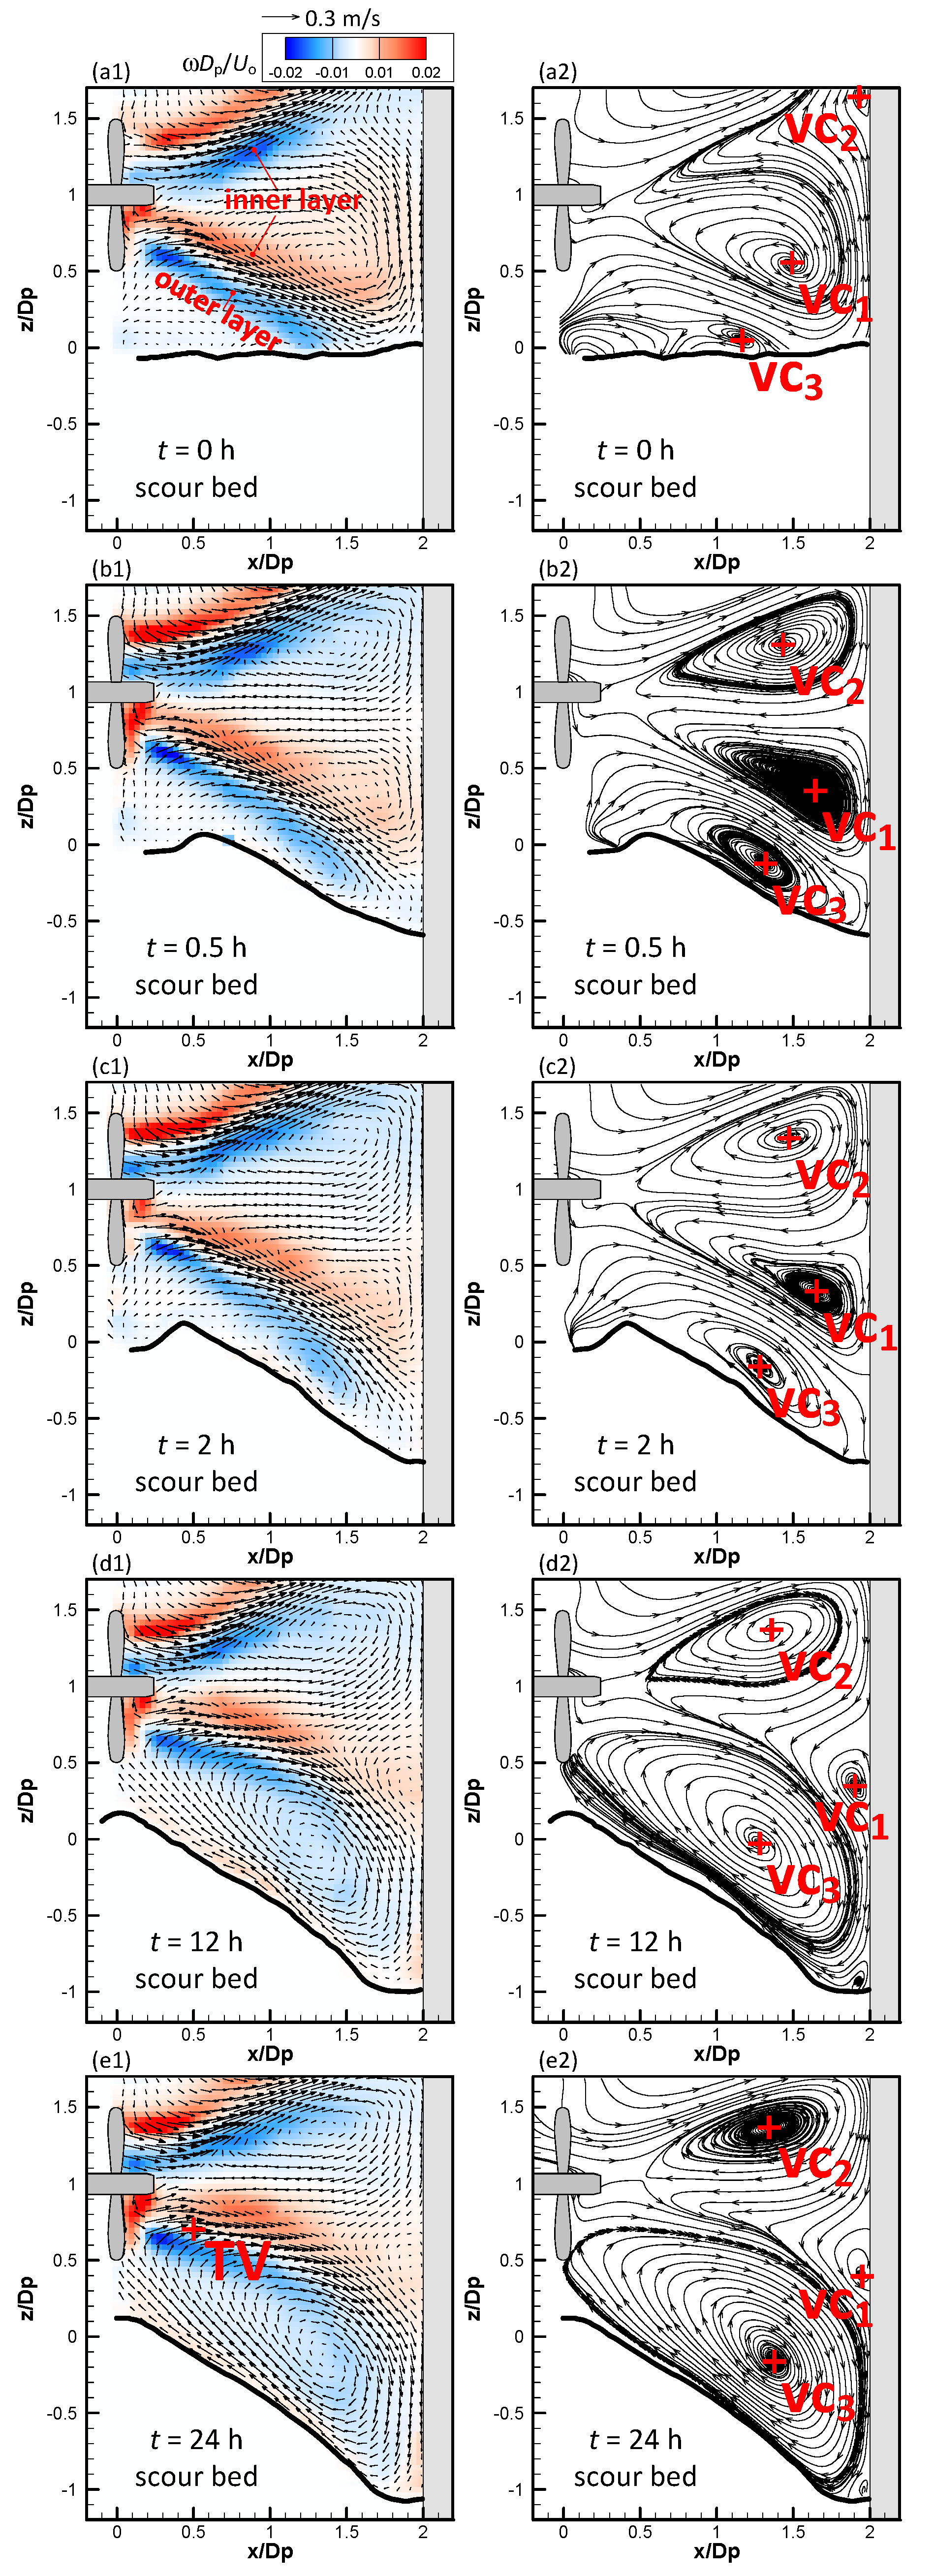
To provide a further insight into the interaction between the turbulent characteristics of the vortex system and developing scour hole, this section presents an energy spectra analysis of the time series of velocity fluctuations at four representative points. Graftieaux et al. [
20] suggested that the velocity fluctuations are their maximum near the mean vortex center within the region of a well-established vortex. For this reason, the vortex centers (marked as VC1, VC2, and VC3 in the right column of
Figure 5) were selected to examine the turbulent energy cascade associated with the vortex system. Additionally, a characteristic point located in the shear layer in the vicinity of the propeller (marked as TV in
Figure 5e1) was also selected for the sake of comparison. The TV position is located within the shedding path of the tip vortex originating from the propeller blades, as observed by Felli et al. [
24] and Wei and Chiew [
11], thus serving as a reference for the flow nature that is exclusively associated with the free jet diffusion.
Figure 7 and
Figure 8, respectively, illustrate the energy spectra distributions of the velocity fluctuations at point TV and the three vortex centers. The left column (
Su) and right column (
Sw) in the figures denote the spectral energy density of the horizontal and vertical velocity components, respectively. Since the shear layer structure close to the propeller possesses a steady attribute throughout the entire scouring process (see
Figure 5),
Figure 7 only presents the power spectra of point TV at the asymptotic state (
t = 24 h), whereas
Figure 8 includes the power spectra at the vortex centers associated with the evolving vortex system at different time intervals of
t = 0, 0.5, 2, 12, 24 h.
Figure 7 reveals that in the near wake region of the propeller, both
Su and
Sw exhibit two obvious spectra peaks superimposed on a broadband spectrum. The former is conjectured to be associated with the dominant frequencies of the tip vortex shedding originating from the rotating propeller blade. The latter reveals a less steep slope than the well-known Kolmogorov energy cascade slope of −5/3 as the turbulent energy is enhanced at small scale eddies (larger frequencies). One may, therefore, expect a local unbalance between turbulence production and dissipation close to the propeller, which is not surprising since the turbulence there is neither isotropic nor fully developed. Moreover, a side-by-side comparison between
Figure 7a,b show that the turbulent energy associated with the horizontal velocity fluctuation appears to be greater than its vertical counterpart for the entire frequency band, confirming the dominant role of the axial (horizontal) velocity within a propeller jet.
On the other hand, away from the near wake region of the propeller,
Figure 8 shows that no perceptible peak frequency can be observed from the spectra distributions associated with the vortex centers, indicating that the periodicity emanated from the propeller rotation has been attenuated. In the meantime, for all three vortices,
Figure 8 reveals that both
Su and
Sw exhibit a comparable power spectrum distribution which obeys the −5/3 law within the inertial range defined by Kolmogorov [
25], implying a fully developed turbulence and an asymptotic between production and dissipation. This means that unlike the near wake region (e.g., point TV), where the small-scale eddies hold a significant amount of turbulent energy, it is the large-scale turbulent eddies that matter in governing the formation of the coherent structures, i.e., the well-established vortices (V1, V2, and V3). Furthermore, it can be observed that, compared to V1 (in red line) and V2 (in blue line), the energy spectra of V3 (in black line) gradually decreases with the development of the scour hole. Given that V3 is directly responsible for enlarging the scour hole as already pointed out, this observation implies a direct coupling between the vortex evolution and the developing scour hole, that is, an energy transfer from the turbulent energy dissipation to the scouring action. On the other hand, V1, which initiated the onset of scour process, reveals an opposite scenario as its energy spectra in small-scales appears to be enhanced and exceed its two counterparts during
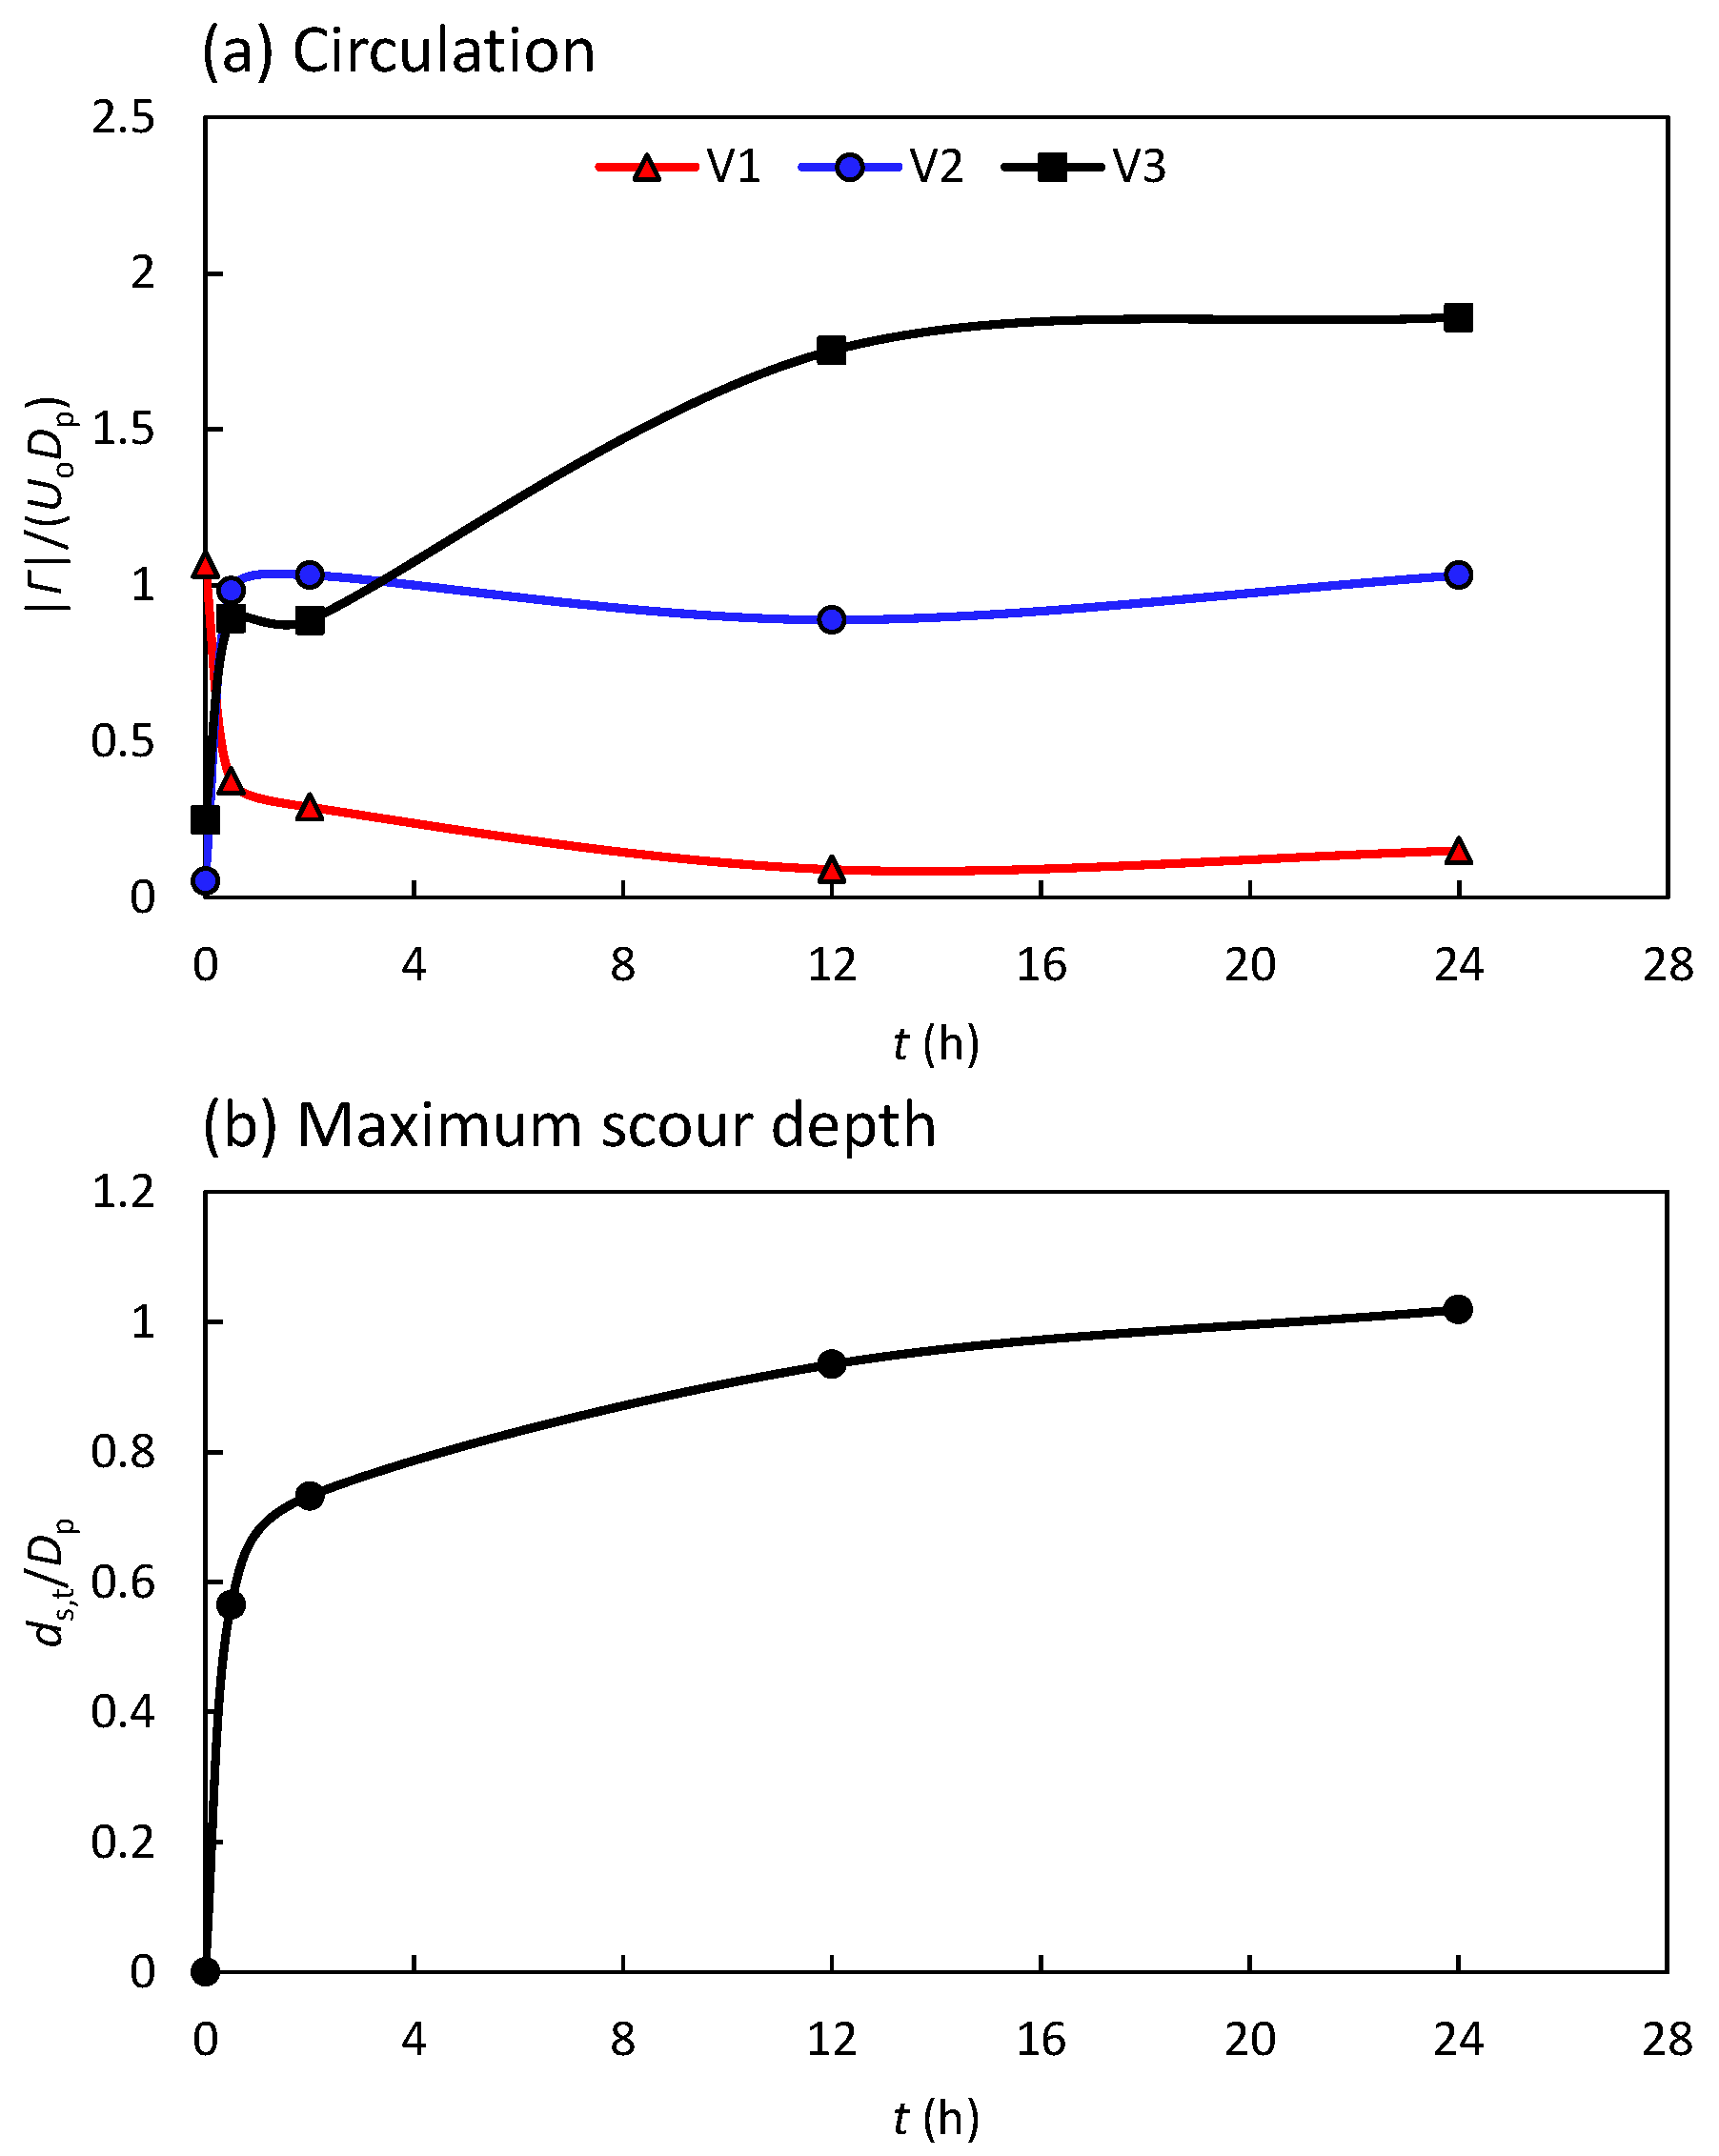
t = 12–24 h. One may surmise that under the confinement effect exerted by the two larger vortices (V2 and V3) on both sides, V1 is subject to a more intense velocity fluctuation and thus has higher turbulent kinetic energy, albeit in a smaller size.
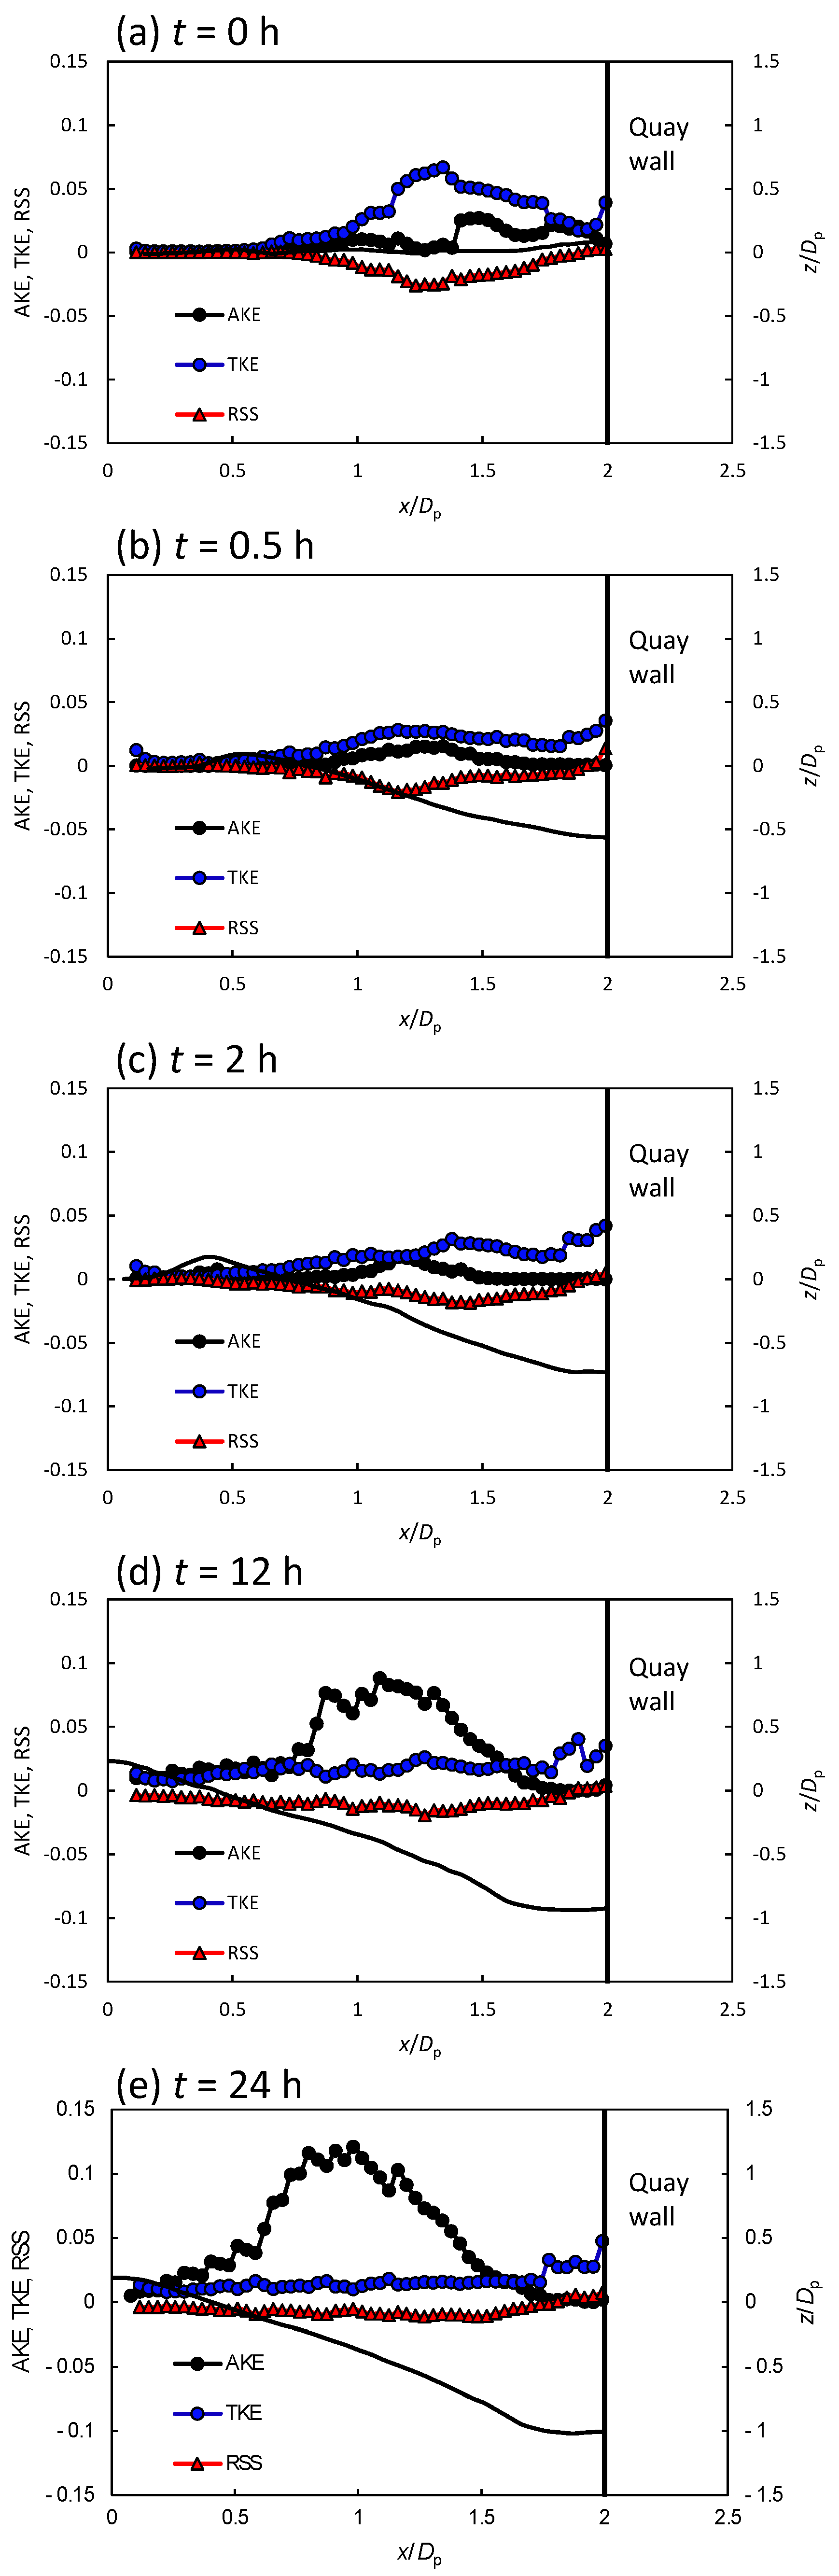
6. Comparison of Near-Bed Flow Characteristics
The near-bed flow characteristics are always of great importance in understanding the interaction between the flow and scouring bed. According to the adopted resolution of the PIV measurement (as shown in
Table 1), this study was able to extract the near-bed data at a distance of 2.7 mm (i.e., the location of the nearest data point close to the bed boundary) above the scoured bed boundary. The so-obtained results are plotted in
Figure 9, in which AKE is the averaged kinetic energy (=
); TKE is the turbulent kinetic energy (=
); and RSS is the Reynolds shear stress (=
), in which
,
are the fluctuating velocity components in the horizontal and vertical directions, respectively. It should be stated that these three parameters only consider the in-plane components of the three-dimensional jet flow due to the nature of the planer PIV measurement. For the sake of clarity, the scour bed profile is also superimposed in the figure whose scale follows the secondary ordinate axis on the right.
At the onset of the scouring action,
Figure 9a reveals a dominant TKE (blue filled circle) prevailing along the initial flatbed with a local maximum value between
x/
Dp = 1–1.5. This location is reasonably correlated with the core of the near-bed vortex (V3) as shown in
Figure 5a2. As the scour hole develops, the overall TKE profile undergoes a significant reduction (see
Figure 9b–d), which reflects a weakening of the scouring capacity associated with the scour-driving vortex. This inference is in conformity with the inference that one may deduce from the turbulent energy spectra plots. The local increase in TKE (around
x/
Dp = 2 at the quay wall), on the other hand, is likely attributed to the presence of the corner vortex that formed at the junction between the scour bed and the quay wall. At the asymptotic state (
t = 24 h), when the scour process almost ceases altogether, the near-bed TKE distribution drops to approximately zero (see
Figure 9e).
Conversely, the development of the near-bed AKE distribution (black filled square) reveals an opposite trend to that of its turbulent counterpart. Initially, the flatbed acts as a blockage and restrict jet expansion; this constraint facilitates an energy transfer from the mean flow to the turbulent flow field, thus resulting in a relatively small AKE value along the initial bed (see
Figure 9a). Thereafter, during
t = 0.5–2 h,
Figure 9b,c show that the AKE reveals a local increase a round
x/
Dp = 1–1.5, which is probably caused by the growing near-bed vortex (V3). Entering the stabilizing phase (
t = 12–24 h), the larger scour hole seems to be able to stabilize the well-established near-bed vortex, which, in turn, conserves the mean flow energy as the AKE is found to exceed its TKE counterpart (see
Figure 9d,e). In other words, being different from the initial state of the scouring process, less energy is extracted from the mean flow to the turbulence during the later scouring phases, which eventually retards the scouring process.
As for the RSS profile,
Figure 9a,b show that during the initial scouring stage the near-bed RSS exhibits a negative value due to the reverse flow associated with the clockwise vortex (V3). As the scour evolves,
Figure 9c–e reveal that the RSS distribution gradually decreases to a near-zero value. On the whole, in contrast to the distributions of AKE and TKE, the RSS exhibits a relatively insignificant change during the scouring process, which may indicate its less important role in driving the scour development.
7. Conclusions
This study presents an experimental study of the temporal evolution of the propeller jet flow within a developing scour hole around a vertical quay wall. The asymptotic scour profiles under the condition of four wall clearances (Xw = 1Dp, 2Dp, 3Dp, and 4Dp) were compared with their counterpart without any confinement; the results highlight the crucial role of the presence of the quay wall in shaping the final scour hole. The flow patterns within the asymptotic scour hole for the same four wall clearance cases were also compared to examine the vortex scouring mechanisms. In the small wall clearance cases (Xw = 1Dp, 2Dp), where the wall effect is more pronounced, a vortex system comprising three vortices was observed with the primary vortex being responsible for the scouring action. With increasing wall clearances and thus decreasing wall effects, the former three-vortices system transforms into a single vortex residing in the scour hole at Xw = 3Dp; when Xw = 4Dp, the single vortex further diminishes. This transformation provides an explanation for the observed inverse relationship between the scour depth and wall clearance in the case of the closed type quay. Moreover, similarities and differences were discussed with respect to the vortical structure in the case of the closed quay and that of the open quay. Such comparison elucidates the distinct influence of different quay types on the formation of flow patterns and the resulting scour profiles, which furnishes a laboratory reference for the maintenance work of quay structure in terms of propeller induced scour damage.
To investigate the evolution of the vortex system and its interaction with the developing scour hole, the temporal development of the flow patterns at a typical case of Xw = 2Dp was discussed. The results highlight the significant difference in the vortex scouring mechanism at the initial instant with a flatbed and that in the presence of a developing scour hole. During the scouring process, although the shear layer structure associated with the propeller jet streams seems to remain steady over time, the vortex system undergoes a considerable change, for which the relative dominance of each individual vortex was analyzed in terms of their circulation developments. As the scour process develops, the near-bed vortex (V3) gradually overwhelms its two counterparts (V1 and V2) and exhibits a positive correlation with the increasing scour depth. In addition, the energy spectra analysis was conducted to examine the turbulent energy cascade and its implication for the associated scouring process. The −5/3 law was confirmed for the energy spectra at the centers of all the three vortices throughout the entire scouring process, indicating an asymptotic balance between turbulence production and dissipation within large-scale eddies associated with the vortex system. Furthermore, a comparison of the overall spectra over the entire frequency band of the three vortices reveals that the turbulent kinetic energy associated with the scour-driving vortex (V3) gradually decreases as the scour hole evolves. This phenomenon, to some extent, links the energy transfer from the turbulence dissipation to the scour excavating action.
Finally, the near-bed flow characteristics (i.e., AKE, TKE, RSS), which are indicative of erosive flow mechanisms, are discussed. The results show that the near-bed TKE gradually decreases with the development of the scour hole, confirming the inference from the energy spectra analysis. Meanwhile, the near-bed AKE appears to be enhanced when the vortex is stabilized by the presence of a large scour hole. The increase of AKE and decrease of TKE with time shows that less energy is transferred from the mean to turbulent flow fields, which is the reason the scouring process progressively diminishes. The RSS distribution, on the other hand, undergoes an insignificant change during the scouring process, indicating its comparatively less important role in affecting scour.


