Article

Turbulent Flow Structures and Scour Hole Characteristics around Circular Bridge Piers over Non-Uniform Sand Bed Channels with Downward Seepage

1
Department of Civil Engineering, VJTI, Mumbai 400019, India
2
Department of Civil, Archictural and Environmental Engineering (DICEA), University of Naples Federico II (UNINA), 80125 Napoli NA, Italy
3
Department of Civil Engineering, Indian Institute of Technology, Guwahati 781039, India
*
Author to whom correspondence should be addressed.
Water 2019, 11(8), 1580; https://doi.org/10.3390/w11081580
Submission received: 6 June 2019 / Revised: 30 June 2019 / Accepted: 18 July 2019 / Published: 30 July 2019
(This article belongs to the Special Issue Experimental, Numerical and Field Approaches to Scour Research)

Abstract

:
In alluvial rivers bridge piers often cause local scour, a complex phenomenon as a result of the interaction between turbulent flow and bed material. In this paper, the results of an experimental study on the scour hole characteristics around single vertical pier sets on a non-uniform sand bed, under no seepage, and with downward seepage conditions, are described. In case of downward seepage, turbulent statistics, such as Reynolds stress, higher order moments, TKE-flux, and consequently sediment transport, decrease upstream of the pier, while increasing on both sides of it, where the enhanced erosive capacity of the flow results in an increase in the scour hole width. Moreover, the scour hole length shifts downstream. Empirical equations for the evaluation of scour hole characteristics, such as the length, width, area, and volume, including the downward seepage parameter, are proposed and experimentally tested. Model predictions give reasonably good agreement with the experimental data.

1. Introduction

Bridges play an important role in the transportation of goods and people across rivers. In civil engineering, one of the most important issues is to protect bridge piers from collapse. In fact, their foundation may be threatened by localized scour, as a result of the flow constriction of the cross-sectional area, and the subsequent increase of the flow velocity [1]. Thus, in order to ensure the protection of such structures, it is of a high priority to predict the flow field and sediment transport around the bridge piers.
Many researchers have studied the vortice systems around piers, stating that they primarily affect the local scour [2,3,4,5,6]. Melville and Coleman [5] stated that the flow field around a bridge pier is characterized by down-flow, surface roller, and wake vortices, such as the horseshoe vortex, at the base of the pier, and wake vortices behind the pier. According to Melville [2] and Chiew [4], a horseshoe vortex increases the flow velocity near the bed, and the wake vortex carries the eroded bed material downstream. However, the effect of the pier on flow separation, and the consequent sediment transport, depends on turbulence.
Some studies have investigated the stochastics nature of turbulent flow around a pier [2,7,8,9,10,11], but there still remains a lack information concerning the trend of higher order moments for the fluctuating velocities.
As the safety of the pier depends on the depth and volume of the scoured region around it, most researchers focus on the estimation of the maximum scour depth around the pier [5,12,13,14,15], developing, from laboratory and field data, empirical relations different from each other, for model or equation parameters. Melville and Coleman [5] proposed a scour depth prediction model depending on several parameters, such as flow depth, pier geometry, and flow intensity. Chavan and Kumar [14], from the experimental data, developed an empirical equation for the estimation of the scour depth in alluvial channels with a downward seepage.
Alluvial channels have granular permeable boundaries; hence, the flow field is a complex interaction between the surface and subsurface flow, as water is either seeping in (upward seepage) or seeping out (downward seepage) from the channel [15]. Shukla and Misra [16] quantified the water loss as a result of seepage as nearly 45% of the total flow volume. Tanji and Kielen [17] observed that the seepage losses in the earthen channels in semi-arid areas range between 20% and 50%. Kinzli et al. [18], and Martin and Gates [19] estimated that water loss as a result of downward seepage was around 15% and 40%, respectively. Moreover, seepage affects the channel morphology [20,21,22] and increases the streamwise velocity near the bed [23,24,25,26].
The aim of this study is to deepen the description of the turbulent flow field around a single vertical bridge pier set in a seepage-affected alluvial channel, and to develop empirical relations for evaluating scour hole characteristics such as length, width, area, and volume, including the downward seepage parameters.

2. Experimental Set-Up and Procedure

2.1. Experimental Facility

Experimental measurements have been carried out in a recirculating plexi-glassed tilting flume, with dimensions of 20 m long, 1 m wide, and 0.72 m deep, supplied by an overhead tank, through a regulating valve (Figure 1). The slope of the channel was 0.5%. Detailed information on the experimental flume can be found in Chavan et al. [9]. Starting 2 m from the inlet, the bed of the flume was made porous, placing a fine mesh on a pressure chamber at a length 15.2 m, width of 1 m, and depth of 0.22 m. Two electromagnetic flow meters measured the seepage discharge. The test section was 5 m, that is, it is 5 m to 10 m from the tailgate of the flume.
For the fine mesh, two river sands of median diameters (d50), 0.395 mm and 0.5 mm, and standard deviation (σg), 1.85 and 1.65, respectively, were selected. Both sands had standard deviation values higher than 1.4, so they were non-uniform [27]. The sand bed thickness was 17 cm. Two perspex circular piers with a diameter of (d) 75 mm and 90 mm, respectively, which were both 150 mm high, were alternatively set at the center of the test section, 7.5 m from the tail end of the flume (i.e., 7.5, 0.5, and 0). Both diameters of the piers were less than 10% of the channel width, so as to avoid a sidewall effect on the scour depth [14].

2.2. Experimental Measurements

For each river sand and pier, experimental measurements of the instantaneous velocity have been carried out along four vertical sections, set upstream (U), downstream (D), and laterally against (S1 and S2) the pier; each section was 6 cm away from the face of the pier, with five discharges, and, for each one, having three seepage percentages, that is, 0%, 10%, and 15%, respectively. Such percentages were selected so as to obtain a seepage velocity less or equal to 1% of the mean velocity in the channel [28]. The combinations resulted in 15 test runs, as specified in Table 1.
The instantaneous velocity was measured using an Acoustic Doppler Velocimeter (ADV), with an acoustic frequency of 10 MHz and a sampling rate of 200 Hz for 5 min at each of the data points. Each test run duration was 24 h. The duration of the experimental runs was set depending upon the criteria of the equilibrium state for the scour depth, given by Kumar et. al. [29]. During the experimental measurements, the signal-to-noise ratio (SNR) was kept at 15 or above, and the average correlation coefficient between the transmitted and received signal was less than 70%. The ADV uncertainty was evaluated by collecting 10 pulses over 5 min near the bed (z ≈ 5 mm). The results are shown in Table 2, where U ¯ , V ¯ , and W ¯ are the mean time velocities in an x (longitudinal), y (transverse), and z (vertical) direction, respectively, and u′, v′, and w′ are the corresponding fluctuating velocities, respectively.
The ADV data were contaminated with spikes because of interference between the transmitted and received signals. Acceleration threshold methods [30] were applied in order to remove the spikes, by fitting velocity power spectra with Kolmogorov’s −5/3 scaling law in the inertial subrange, with threshold values ranging between 1–1.5.
The measurement of bed deformations under water typically utilizes high-frequency sound wave (ultrasonic) technology. The bed profiles around the pier were measured using Sea Tech 5 MHz Ultrasonic Ranging System (URS), with four pairs of transducers fixed to a mechanical trolley moving at a constant speed. The sound waves transmitted from the sensors were reflected by a solid object, the time for the sound waves to travel from the sensor to the object and back to the sensor was recorded, and the distance from the sensor to the reflective object was obtained. The URS uncertainty was evaluated collecting 15 measurements near the bed (z ≈ 5mm). The results are in Table 3.

3. Results

3.1. Turbulence Characteristics

The distribution of the turbulent quantities, such as the sediment transport, is affected by the interaction between the bridge pier and flow. Chavan et al. [9,31] observed that the velocity and Reynolds stresses are negative upstream of the pier and close to bed, and downstream of the pier and close to the free surface, because of reversal flow, which causes a horseshoe vortex at the bed and a wake vortex at the free surface. In this paper, in order to deeply analyze the turbulent quantities and sediment transport around a bridge pier, upstream (U), downstream (D) and laterally against (S1 and S2) the pier, the distributions of the higher order moments (i.e., turbulence intensity and skewness), turbulent kinetic energy budget, and fluxes of turbulent kinetic energy, have been experimentally studied. In particular, as in the lateral sections, the turbulence quantities’ distributions are similar [9]; hereafter, only the lateral section S1 will be considered, in order to avoid the repetition of results.

3.1.1. Turbulence Intensities

Around the pier, the distributions of the fluctuating components of the streamwise and vertical instantaneous velocity (σu and σw, respectively), expressed as root mean square (RMS), have been evaluated for the different discharges and percentages of seepage. In Figure 2, σu and σw, scaled with the shear velocity (u*), are expressed as u* = √ (τ/ρ; where τ = γRS is the bed shear stress, ρ is the flow density, R is hydraulic radius, and S is the bed slope), versus the distance (z) from the bed, scaled with the flow depth (h), represented as h+, are shown.
Upstream of the pier (U), σu and σw show similar trends. In particular, σu is lower near the bed, because of the reversal flow. With respect of the zero seepage, σu is reduced by 15% in case of 10% seepage, and by 22% averagely in case of 15% seepage. For the different seepage percentages, σu and σw attain higher values at the edge of the scour hole (h+ ≈ 0.1), then, increasing in h+; while σw shows a nearly constant value, σu slightly decreases, oscillating around a constant value.
Downstream of the pier (D), where there is no obstruction to the flow, for the different seepage percentages, σw shows an increasing trend, attaining higher values than in the section U, because of the wake vortices behind the pier. Near the free surface, σw slightly decreases, because of the reduced strength of the wake vortices in the presence of the lateral flow through the channel boundaries. For the zero seepage percentage, σu shows a nearly constant value, while it slightly decreases, with scattering trends, for the seepage percentages of 10% and 15%, respectively.
Laterally to the pier (S1), in the case of 10% and 15% seepage percentages, near the bed (h+ < 0.2), σu and σw increase at an average about 20%–30% and 25%–35% with no seepage value, respectively, because of the enhanced turbulence near the bed.

3.1.2. Skewness

Despite many studies on the hydrodynamics of the flows around bridge piers and downward seepage, there is still a lack of knowledge about higher order moments of velocity fluctuations, which contain information related to the flux of the Reynolds normal stress, retaining the sign details [32].
The third order correlation, Mlm, is expressed as [33] follows:
M l m = u ^ l w ^ m ¯
where, u ^ = u ( u 2 ¯ ) 0.5   ,   w ^ = w ( w 2 ¯ ) 0.5 and (l + m) = 3.
In particular, M30 ( u ^ 3 )and M03 ( w ^ 3 ) express the longitudinal and vertical flux of streamwise RNS ( u u ¯ ) and vertical RNS ( w w ¯ ), respectively, and M12 and M21 indicate the advection of (ww′) and (uu′), in x-direction and z-direction, respectively. They are shown in Figure 3, together with the vertical profiles of the skewness factors in the streamwise (Su = u 3 ¯ / u * 3 ) and vertical (Sw = w 3 ¯ / u * 3 ) direction, respectively.
Upstream of the pier (U), near the bed, positive M30 and M12 and negative M03 and M21 show the flux of streamwise RNS and the diffusion of vertical RNS in streamwise direction, and the flux of vertical RNS and the diffusion of streamwise RNS in a downward direction, respectively. By increasing h+, M30 and M12 become negative, and M03 and M21 become positive. The positivity of M30 and M12 decreases in the seepage runs, showing that the flux of the streamwise RNS and the diffusion of the vertical RNS results in a lower mobility of the bed material.
Near the bed, the positive and negative values of the streamwise and vertical skewness factors confirm that the transport of the turbulent kinetic energy are in streamwise and downward directions, respectively.
In section D, near the bed, M30 is negative, while M03 is positive, suggesting that the streamwise and vertical RNS fluxes are in an opposite direction to the flow, and in an upward direction, respectively, showing ejections. By increasing h+, M30 and M03 attain an opposite sign, becoming positive and negative, respectively. Near the bed, M12, is positive, while M21, is negative, showing that the diffusion of vertical and streamwise RNS is in the flow and in downward directions, respectively. By increasing h+, M12 becomes negative, while M21 becomes positive, showing the diffusion of vertical and streamwise RNS in the opposite direction to the flow, and in the upward directions, respectively. In section D, near the bed, positive Sw and negative Su show that the transport of the turbulent kinetic energy is in the opposite direction to the flow, and in an upward direction, respectively, increasing the seepage percentage. The results confirm the dominance of the secondary currents downstream from the piers, because of the formation of wake vortices; however, downward seepage limits the strength of the wake vortices.
In the Section S1, near the bed, M30 and M12 increase with the seepage percentage, because of the increased particle mobility in the seepage runs. Similarly, the increased M03 and M21 in the seepage runs, correspond to the increasing vertical flux of RNS, and the advection of streamwise RNS in a downward direction, respectively. In the section of S1, in the seepage runs, the distributions of the skewness that factor their increase with h+, clearly show the increased movement of bed particles. These results show the prevalence of a high turbulent activity, resulting in enhanced sediment transport, laterally to the pier, in the case of seepage runs.

3.1.3. Turbulent Kinetic Energy Flux (TKE-Flux)

TKE-flux significantly describes the bed material movement in a sandy channel. The streamwise and vertical TKE-flux are calculated as follows [34]:
f k u = 0.75 ( u u u ¯ + u w w ¯ ) f k w = 0.75 ( u u w ¯ + w w w ¯ )
and are scaled with the shear velocity u*, thus obtaining (Fku = fku/u* 3) and (Fkw = fkw/u* 3), respectively. The vertical profiles of the TKE-flux around the pier, for all of the experimental conditions, are shown in Figure 4. In particular, upstream of the pier (U), near the bed (i.e., h+ < 0.2), Fku is positive and Fkw is negative, in agreement with the bed erosion as a result of the flow separation upstream of the pier. However, in the case of seepage runs, the absolute values of Fku and Fkw decrease, because of the lower erosive capacity of the reversal flow. Downward the pier (D), near the bed, FKu and FKw show slightly negative and positive values, respectively, with absolute values decreasing with the seepage percentage. This trend shows the hindered flow and the effects of low-speed incoming fluid particles. Moving towards the free surface, approximately at the edge of the scour hole (h+ ≈ 1), FKu and FKw become positive and negative, respectively.
Laterally to the pier (S1)1, near the bed, the increased positive and negative values of Fku and Fkw with a downward seepage show the enhanced erosion of the bed material in respect to the other sections.

3.1.4. Turbulence Production, Dissipation, and Diffusion

To deeply understand the trend of the velocity fluctuations, it is essential to consider the production, dissipation, and diffusion of the turbulent kinetic energy, expressed as follows:
Turbulence   production            t p = u w ¯ U ¯ z Turbulence   dissipation            ε = 15 ϑ U ¯ 2 ( u t ) Turbulence   diffusion            t D = f k w z
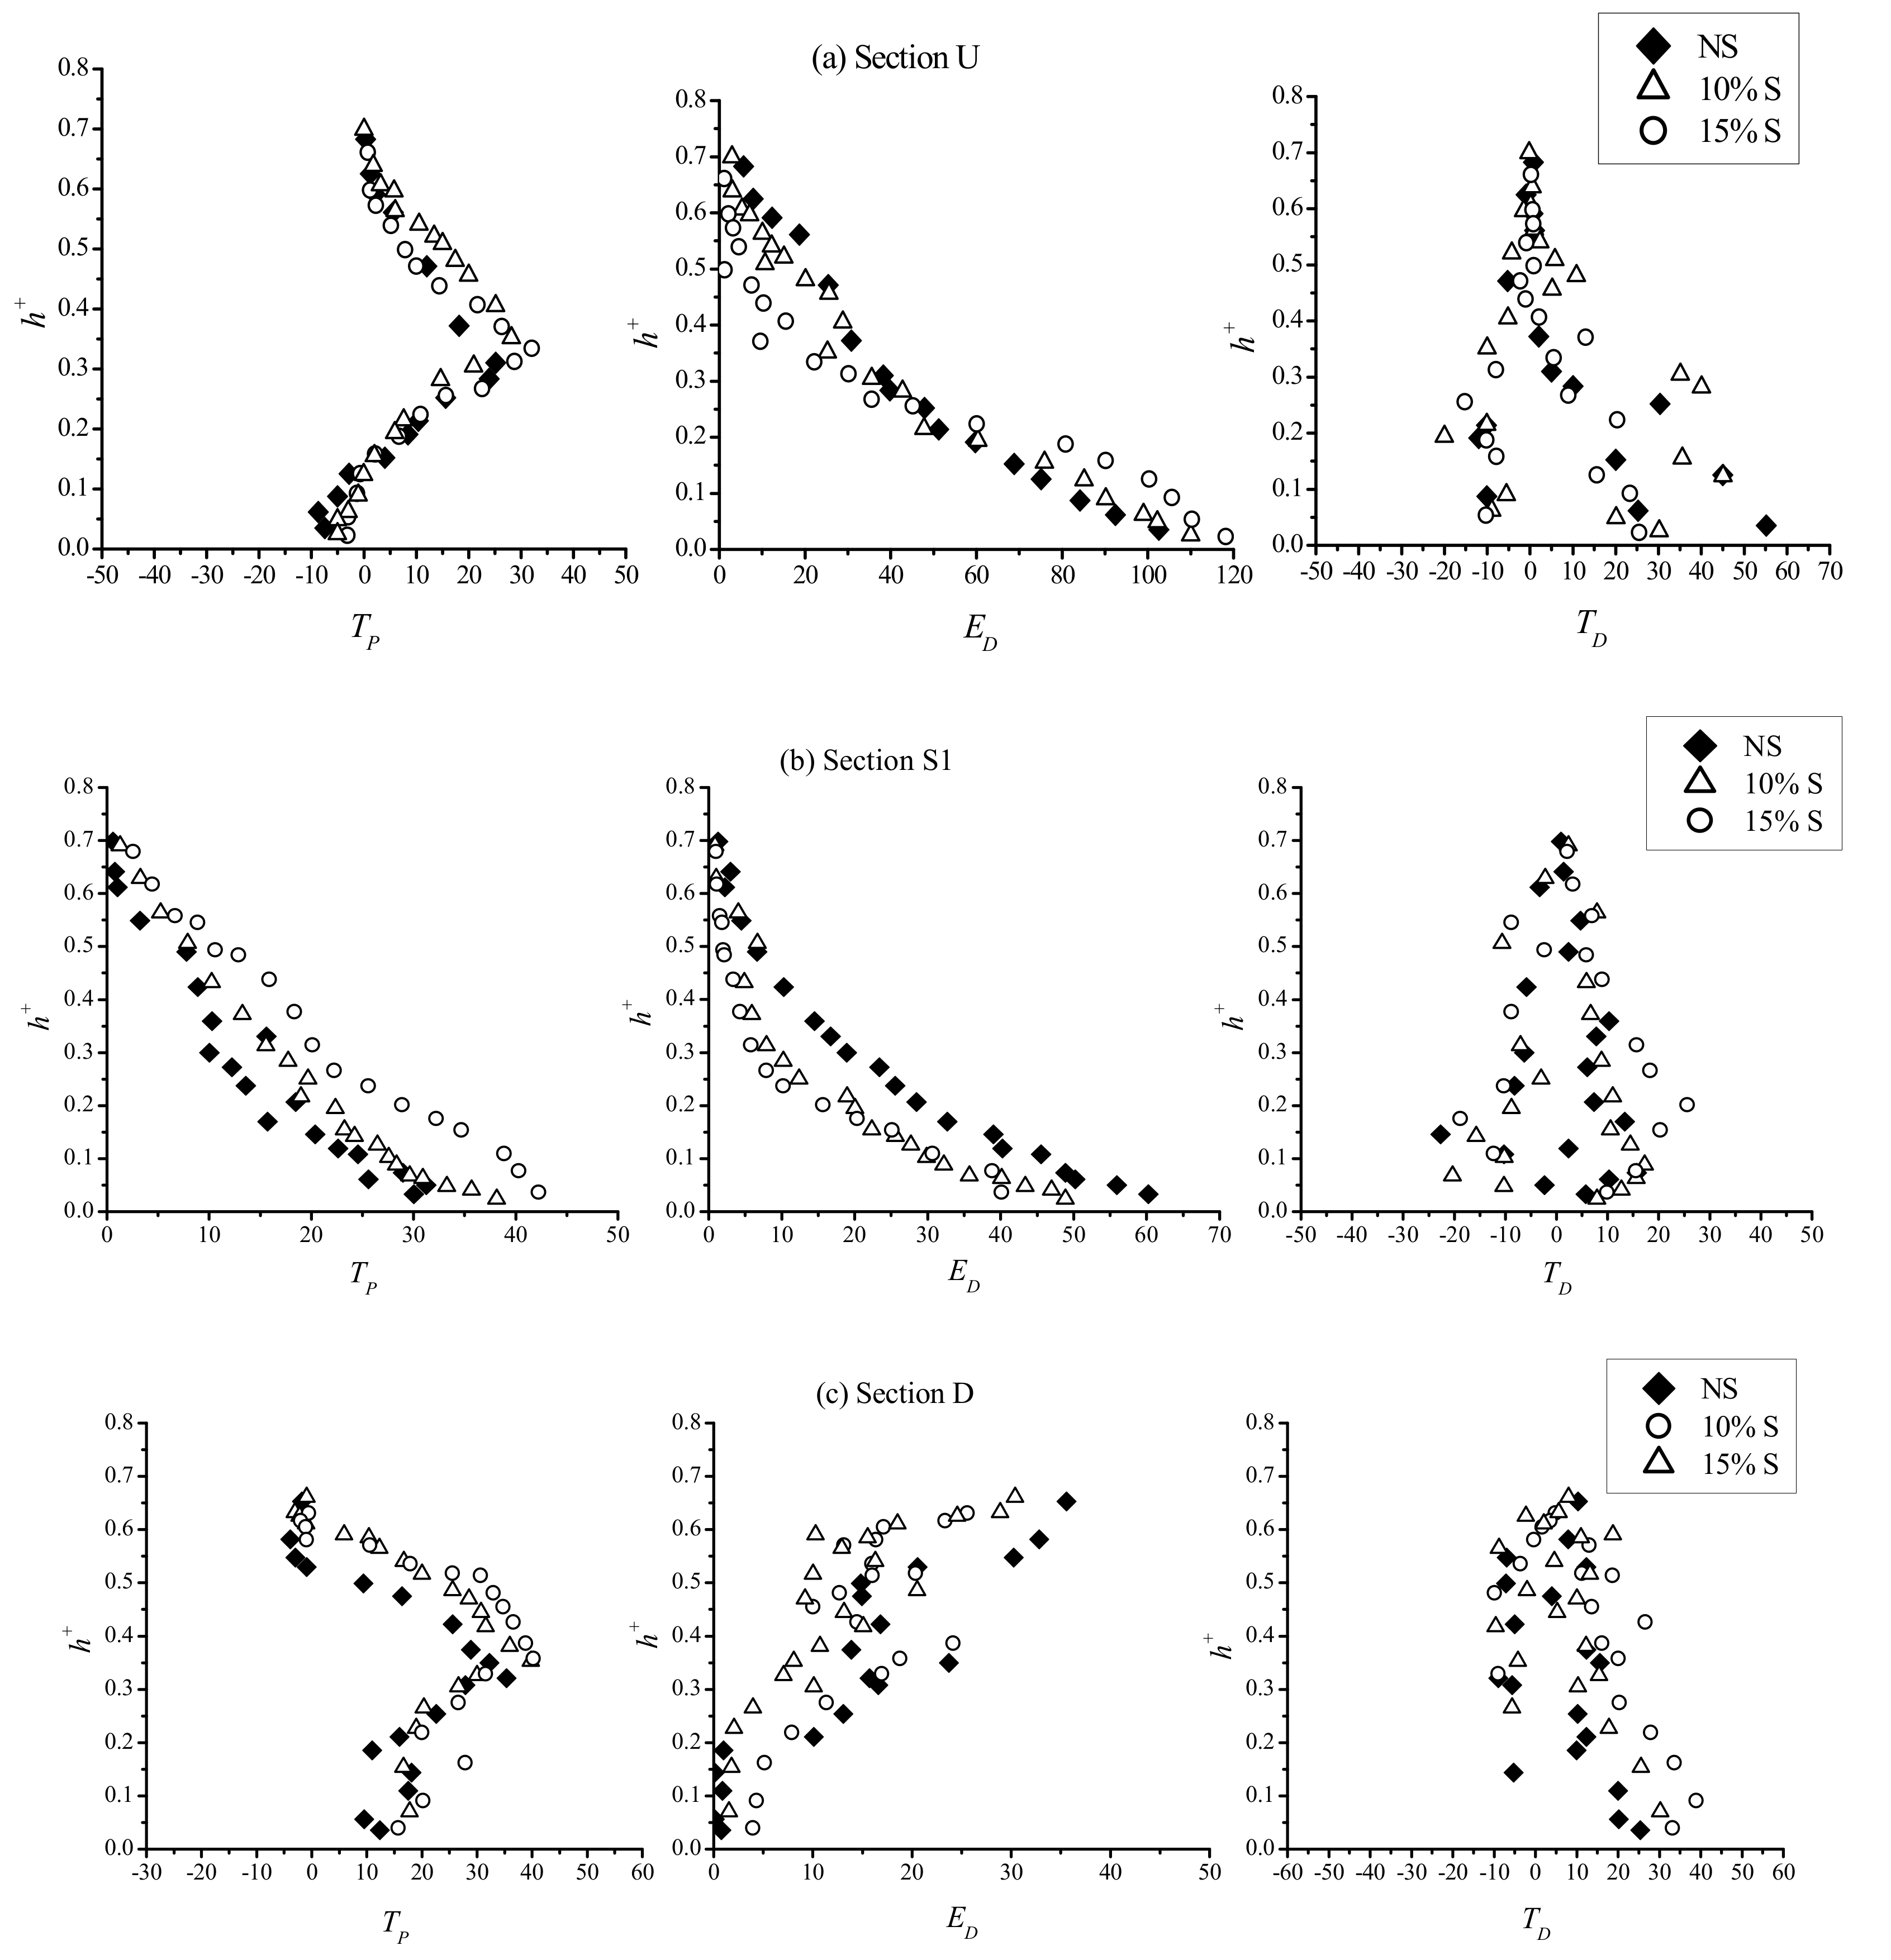
where tp, ε , and tD were scaled with h/u*2, and are denoted by TP, ED, and TD, respectively. In Figure 5, the vertical profiles of the production (TP), diffusion (ED), and dissipation (TD) of the turbulent kinetic energy around the pier, for all of the experimental conditions, are shown.
The turbulence production (TP) comes from the exchange of energy between the mean flow velocity and the velocity fluctuations. Therefore, the positive TP expresses the energy flowing from the mean flow velocity to the velocity fluctuations, while, on the contrary, the negative TP shows the energy flowing from the velocity fluctuations to the mean flow velocity. In Figure 5, it is possible to observe that in the section of U, near the bed, in the seepage runs, the decreased TP, with respect to sections D and S1, is evidence of lower turbulence intensities and moment transfer, as the reversal flow is hindered by the seepage flow. On the contrary, in sections D and S1, when the downward seepage is applied, a higher TP shows the enhanced turbulence level in the sections, because of more energy being converted into the turbulent fluctuations. Consequently, in section U, near the bed, in the seepage runs, the ED is higher than in sections D and S1. Moreover, in sections D and S1, near the bed, in the seepage runs, lower TD values correspond to a gain in TP, and a consequent reduction in ED.

3.2. Scour Hole Characteristics

Marine structures such as bridges, docks, and so on, are supported by piers embedded into the sand. The piers obstruct the flow of water, and result in a distortion of the flow pattern and local scour. Such scour can have detrimental effects on the stability of the structure, and hence it is essential to evaluate scour hole characteristics, such as the depth, length, width, area, and volume, so as to prevent the structure from the adverse effects of bed erosion. Obstruction to the flowing stream by piers develops a vortex system in the flow field around them. A horseshoe vortex, upstream of the pier and near the bed, is dominant in the vortex system, and is responsible for sweeping out the bed material around the pier, producing a local scour hole. Moreover, a wake vortices system arises behind the piers, which is shed from their sides as a result of flow separation. Because of the vertical axes, the vortices suck the sand into their cores as they move downstream, and increase the scouring action along their line of movement. The variation in the flow pattern as a result of the piers results in the erosion of the bed material around the piers in both longitudinal and transverse directions. The lateral flow through the channel boundaries, in the form of downward seepage, leads to an enhancement of mass and momentum transfer.
Hence, in the presence of downward seepage, additional forces may be exerted, and this results in enhancing the rate of sediment transport. In this section, the effect of downward seepage on scour hole characteristics is studied.

3.2.1. Geometry of Scour Hole

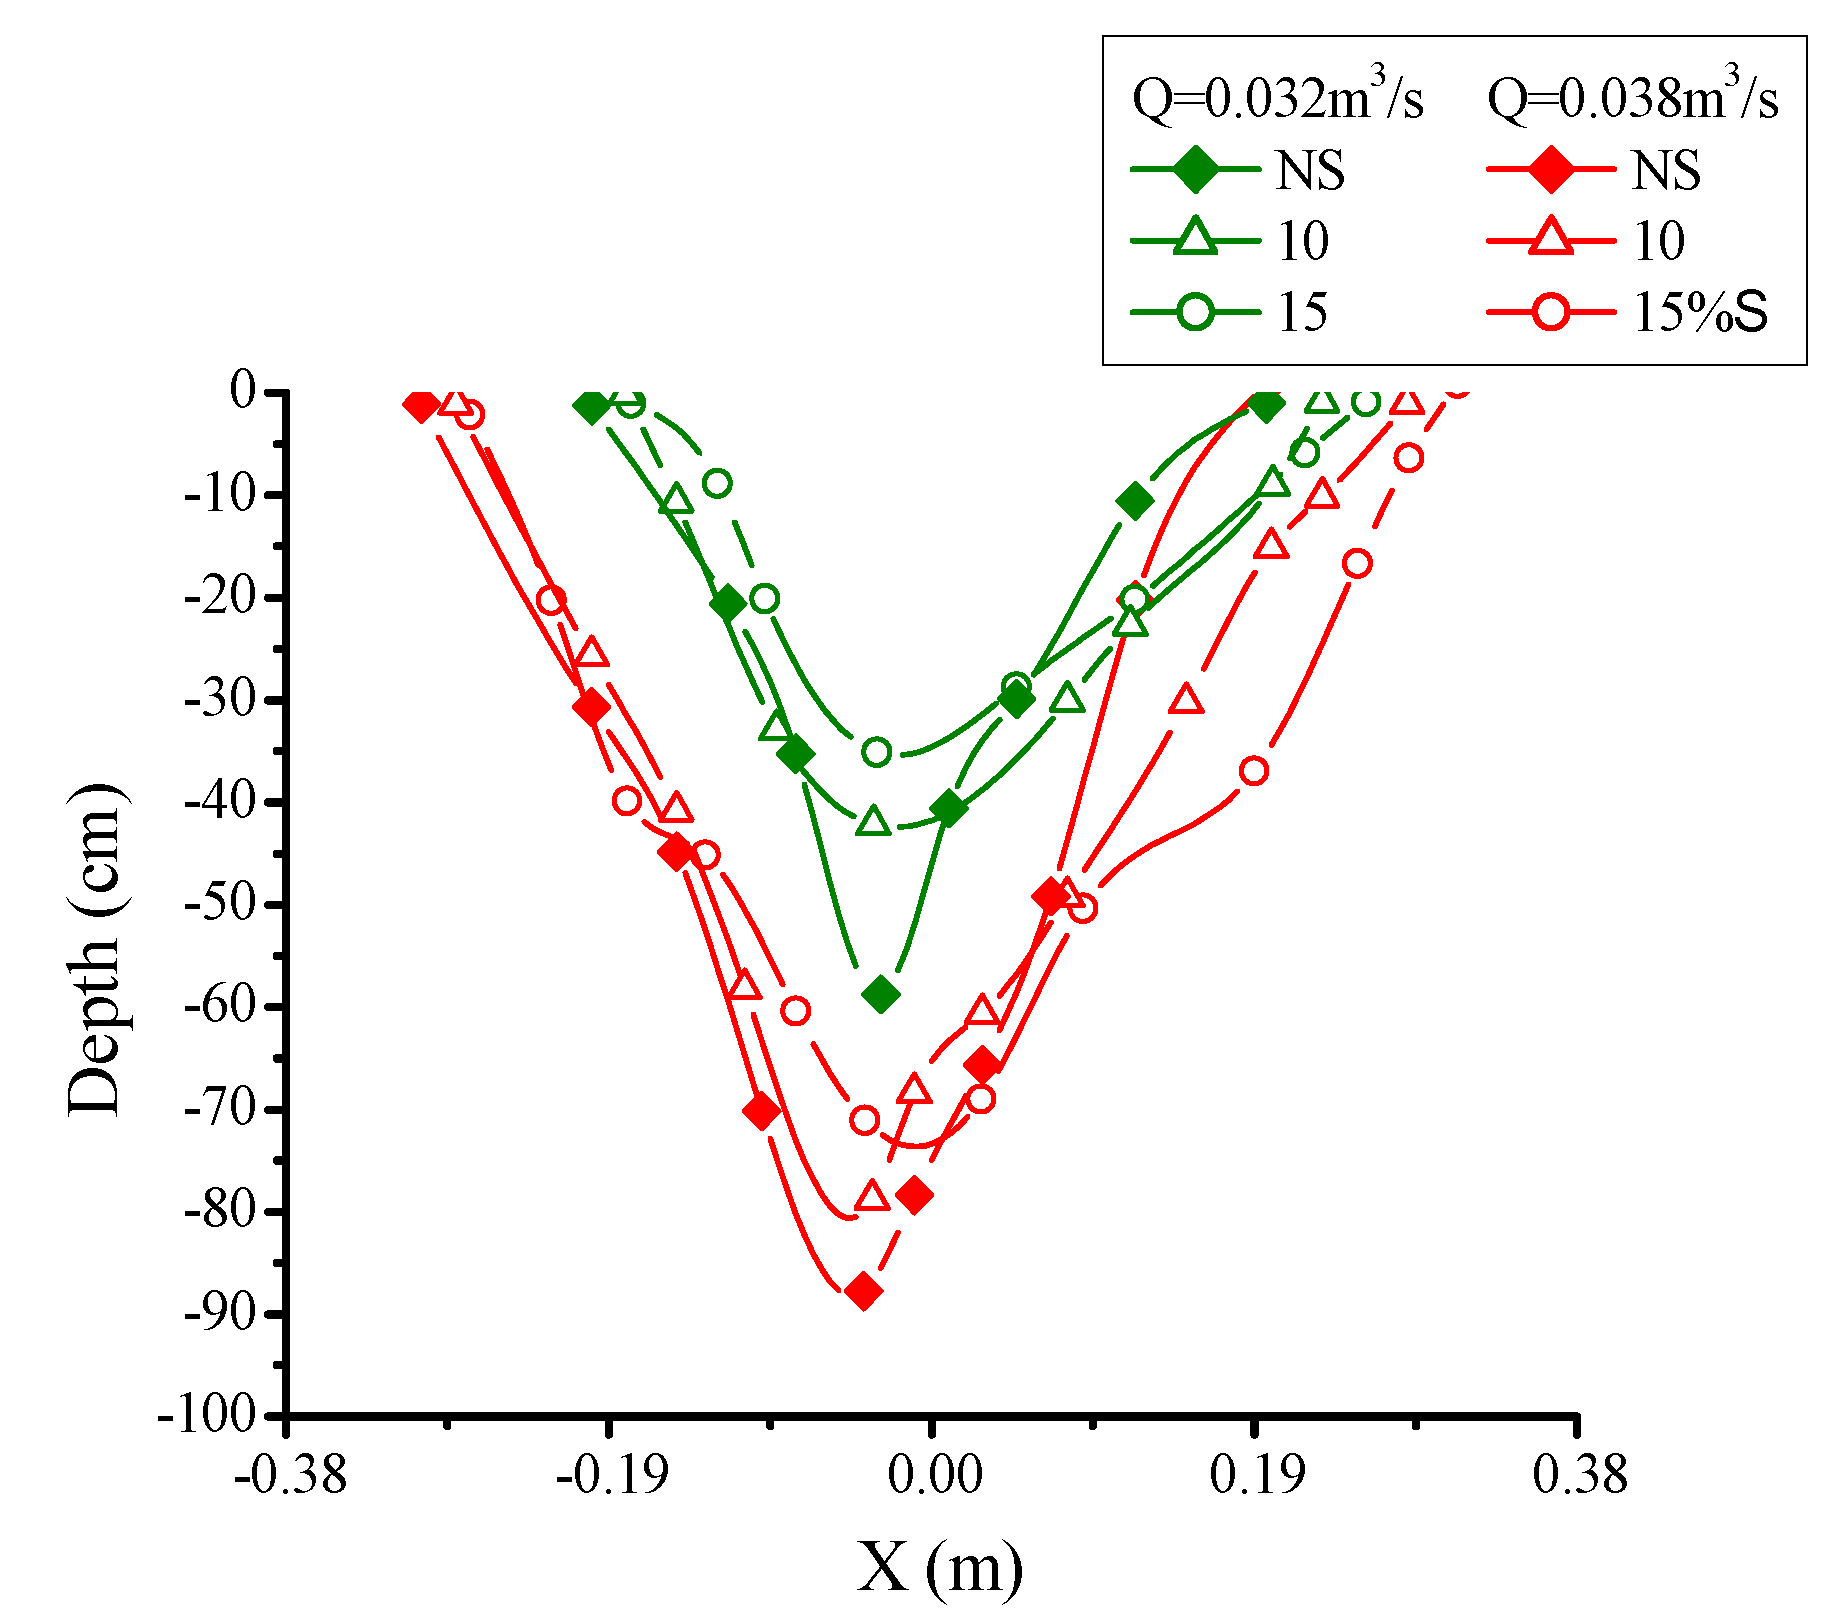
The experimental measurements carried out in the flume showed that scour starts upstream of the pier, and that the scour hole increases in size over time (Figure 1 shows a snapshot of the scour hole after an experimental run of 24 h, with various dimensions of scour hole). The slope of the scour hole is slightly milder downstream than upstream of the pier. In Figure 6, the length of the scour hole in a longitudinal direction along the centerline is shown, for different flow rates and increasing in seepage percentage. While the scour depth is decreasing, the scour hole length is increasing, and, moreover, the scour hole length is slightly shifting downstream.
Upstream of the pier, in the seepage runs, the reversal flow hindered by the lateral flow through the channel boundaries results in a reduction of the scour depth and the scour length, while downstream the pier, the increased momentum transfer results in the erosion of the bed material and an increase in the scour length. Similarly, from Figure 7, it is possible to observe that the scour hole is wider in the seepage runs than in no seepage run.
This phenomenon depends on the turbulent characteristics of the flow—increasing the turbulence near the bed, laterally to the pier, in the seepage runs, enhances the bed erosion, and, therefore, increases the scour hole width.

3.2.2. Dimensional Analysis

The scour process is mainly influenced by the flow and fluid characteristics, the geometry of the piers, and the bed material properties [15]. However, the lateral flow through the river boundaries also plays significant role in modifying the channel geometry. So, it is necessary to include the downward seepage parameters for the prediction of scour hole characteristics. In this study, the seepage Reynolds number (Res = Vsd50/υ) is used as a dimensionless seepage parameter. Hence, in the analysis of the scour hole characteristics, such as the length (ls) and width (ws) of the pier, the following independent parameters can be considered to affect the scour process:
ls, ws, = f (d50, σg, g, υ, h, U, Vs, R)
where, d50 (mm) is the median sand diameter, σg ( d 84 / d 16 ) is the standard deviation, g (m/s2) is the gravitation acceleration, υ (m2/s) is the kinematic viscosity, h (m) is the flow depth, U (m/s) is the depth average velocity, Vs (m/s) is the seepage velocity, and R is the hydraulic radius (m). Applying and suitably modifying Equation (1), it can be rearranged as Equation (2).
L s ,   W s = f { U g R   ,   h d 50 ,   V s d 50 ϑ , σ g }
where Ls (ls/D) is the dimensionless scour length and Ws (ws/D) is the dimensionless scour hole width. The dimensionless characteristics of the scour hole are a function of the following dimensionless parameters: the Froude number is Fd ( U / g R ); h/d50 is aspect ratio, Vsd50 is the Seepage Reynolds number (Res), and σg is the standard deviation. Starting from Equation (2), the length and width of the scour hole can be expressed as follows:
L s = a ( F d ) b   ( h / d 50 ) c   e x p ( R e s ) d ( σ g ) e
W s = a ( F d ) b   ( h / d 50 ) c   e x p ( R e s ) d ( σ g ) e
where a, b, c, d and e, are the empirical parameters evaluated through experimental measurements with both sands.
The seepage Reynolds number is stated in an exponential, form in order to fulfil the condition without seepage. The final forms of Equations (3) and (4) are the following ones:
L s = 0.06 ( F d ) 2.69   ( h / d 50 ) 1.54   e x p ( R e s ) 0.703 ( σ g ) 0.644
W s = 0.02 ( F d ) 4.23   ( h / d 50 ) 2.05   e x p ( R e s ) 0.707 ( σ g ) 0.705
The area and the volume of the scour hole are the function of the scour depth. Hence, Equation (2) can be modified as follows:
A s ,   V s = f { U g R   ,   h d 50 ,   V s d 50 ϑ , d s D }
where, As = as/ap, and as is the scour hole area and ap is the pier area, and Vs = vs/vp, where vs is the scour hole volume and vp is the pier volume.
From the dimensional analysis, the following expressions for the dimensionless area and volume of the scour hole result in the following:
A s = 0.49 ( F d ) 4.007   ( h / d 50 ) 1.18   e x p ( R e s ) 0.324 ( d s D ) 1.69
V s = 0.81 ( F d ) 3.39   ( h / d 50 ) 1.05   e x p ( R e s ) 3.15 ( d s D ) 2.17
Scour hole characteristics, such as the length, width, area, and volume, have been calculated from Equations (5), (6), (8) and (9), and the results have been compared with the measured values, as shown in Figure 8. The overall agreement between Equations (5), (6), (8) and (9), and the measured values is good, with R2 ranging between 0.88 and 0.92.

4. Summary and Conclusions

In order to deepen the impact of the downward seepage and the turbulent flow characteristics on the scour geometry around a pier, an experimental measurement of the instantaneous velocity with different percentages of with seepage (10% S and 15% S) and without seepage (NS) have been carried out in four different sections around a pier, for two different diameters (75 and 90 mm).
Upstream of the pier, the streamwise turbulence intensities, with respect of zero seepage, are reduced by 15% in case of the 10% seepage, and by 22% in case of the 15% seepage, respectively. Downstream of the pier, the higher values of vertical turbulence intensities show the presence of wake vortices. Laterally to the pier, the streamwise and vertical turbulence intensities are higher in the seepage runs than without seepage. Upstream of the pier, the positivity of M30 and M12 decreases, thus increasing the seepage percentage. Downstream of the pier, decreasing the negativity of M30 and the positivity of M03, respectively, with seepage, shows ejections. Laterally to the pier, the streamwise and vertical turbulence intensities increase by 20%–35% in the seepage runs, resulting in an enhanced in sediment transport.
Upstream of the pier, in the seepage runs, a reduction in TKE-flux confirms the lower erosive capability of the flow. However, the erosive capacity is found to be increased laterally to the pier, by the application of downward seepage. A pronounced effect of seepage has been found on TKE budget. Upstream of the pier, a reduction in the turbulence production, in the case of seepage runs, is in agreement with a lower turbulence level in the same section. From the turbulence statistics of the flow around the pier, in the seepage runs, it has been observed that they decrease upstream of the pier, which results in a lesser scour depth, while they increase laterally the pier, which results in a wider scour hole and shifting towards the downstream of the scour hole length.
The primary characteristics of the scour hole, like the length and width, were physically measured; and the area and volume were measured by using commercial software Surfer®. Finally, with the help of the experimental results obtained from the laboratory flume, empirical relationships for the prediction of the scour hole characteristics, like length, width, area, and volume, including the downward seepage parameter in terms of the seepage Reynolds number, have been developed. Considering that the laboratory flume is a distorted model of a river, the obtained expression showed a good fit with the estimated values.

Author Contributions

B.K. proposed the idea. R.C. did the experiments. R.C., B.K., and P.G. analyzed the results and drafted the manuscript; all of the authors contributed to reviewing and editing the manuscript.

Funding

R.C., B.K. and P.G. acknowledge the support by the UNINA-DICEA research project “Experimental and Numerical Fluids Dynamics”.

Conflicts of Interest

The authors declare no conflict of interest.

References

  1. Chiew, Y.M. Local Scour at Bridge Piers. Ph.D. Dissertation, The University of Auckland, Auckland, NJ, USA, 1984. [Google Scholar]
  2. Melville, B.W. Local Scour at Bridge Sites. Ph.D. Dissertation, The University of Auckland, Auckland, NJ, USA, 1975. [Google Scholar]
  3. Ettema, R. Scour at Bridge Piers. Ph.D. Dissertation, The University of Auckland, Auckland, NJ, USA, 1980. [Google Scholar]
  4. Melville, B.W.; Coleman, S.E. Bridge Scour; Water Resources Publication: Littleton, CO, USA, 2000. [Google Scholar]
  5. Richardson, E.V.; Davis, S.R. Evaluating Scour at Bridges, Hydraulic Engineering Circular No. 18 (hec-18). Publication No. FHWA NHI, 01-001. Available online: http://www.engr.colostate.edu/CIVE510/Manuals/HEC-18%204th%20Ed.(2001)%20-%20Evaluating%20Scour%20at%20Bridges.pdf (accessed on 27 July 2019).
  6. Istiarto, I. Flow Around a Cylinder in a Scoured Channel Bed. Ph.D. Thesis, Gadjah Mada University, Yogyakarta, Indonesia, 2001. [Google Scholar]
  7. Izadinia, E.; Heidarpour, M.; Schleiss, A.J. Investigation of turbulence flow and sediment entrainment around a bridge pier. Stoch. Environ. Res. Risk Assess. 2013, 27, 1303–1314. [Google Scholar] [CrossRef]
  8. Chavan, R.; Sharma, A.; Kumar, B. Effect of downward seepage on turbulent flow characteristics and bed morphology around bridge piers. J. Mar. Sci. Appl. 2017, 16, 60–72. [Google Scholar] [CrossRef]
  9. Breusers, H.N.C.; Nicollet, G.; Shen, H. Local Scour Around Cylindrical Piers. J. Hydraul. Res. 1977, 15, 211–252. [Google Scholar] [CrossRef]
  10. Ben Meftah, M.; Mossa, M. Scour holes downstream of bed sills in low-gradient channels. J. Hydraul. Res. 2006, 44, 497–509. [Google Scholar] [CrossRef]
  11. Guan, D.; Melville, B.W.; Friedrich, H. Flow Patterns and Turbulence Structures in a Scour Hole Downstream of a Submerged Weir. J. Hydraul. Eng. 2014, 140, 68–76. [Google Scholar] [CrossRef]
  12. Raudkivi, A.J.; Ettema, R. Clear-Water Scour at Cylindrical Piers. J. Hydraul. Eng. 1983, 109, 338–350. [Google Scholar] [CrossRef]
  13. Chiew, Y.M.; Melville, B.W. Local scour around bridge piers. J. Hydraul. Res. 1987, 25, 15–26. [Google Scholar] [CrossRef]
  14. Chavan, R.; Kumar, B. Prediction of scour depth and dune morphology around circular bridge piers in seepage affected alluvial channels. Environ. Fluid Mech. 2018, 18, 923–945. [Google Scholar] [CrossRef]
  15. Richardson, J.R.; Abt, S.R.; Richardson, E.V. Inflow Seepage Influence on Straight Alluvial Channels. J. Hydraul. Eng. 1985, 111, 1133–1147. [Google Scholar] [CrossRef]
  16. Shukla, M.K.; Mishra, G.C. Canal discharge and seepage relationship. In Proceedings of the 6th National symposium on Hydro, Shillong, India, 6–7 March 1994; pp. 263–274. [Google Scholar]
  17. Tanji, K.K.; Kielen, N.C. Agricultural Drainage Water Management in Arid and Semi-Arid Areas; Food and Agriculture Organization: Rome, Italy, 2002. [Google Scholar]
  18. Kinzli, K.D.; Martinez, M.; Oad, R.; Prior, A.; Gensler, D. Using an ADCP to determine canal seepage loss in an irrigation district. Agric. Water Manag. 2010, 97, 801–810. [Google Scholar] [CrossRef]
  19. Martin, C.A.; Gates, T.K. Uncertainty of canal seepage losses estimated using flowing water balance with acoustic Doppler devices. J. Hydrol. 2014, 517, 746–761. [Google Scholar] [CrossRef]
  20. Lu, Y.; Chiew, Y.-M.; Cheng, N.-S. Review of seepage effects on turbulent open-channel flow and sediment entrainment. J. Hydraul. Res. 2008, 46, 476–488. [Google Scholar] [CrossRef]
  21. Rao, A.R.; Sreenivasulu, G.; Kumar, B. Geometry of sand-bed channels with seepage. Geomorphology 2011, 128, 171–177. [Google Scholar] [CrossRef]
  22. Cao, D.; Chiew, Y.M. Suction effects on sediment transport in closed-conduit flows. J. Hydraul. Eng. 2013, 140. [Google Scholar] [CrossRef]
  23. MacLean, A.G. Open channel velocity profiles over a zone of rapid infiltration. J. Hydraul. Res. 1991, 29, 15–27. [Google Scholar] [CrossRef]
  24. Chen, X.; Chiew, Y.M. Velocity Distribution of Turbulent Open-Channel Flow with Bed Suction. J. Hydraul. Eng. 2004, 130, 140–148. [Google Scholar] [CrossRef]
  25. Singh, A.; Al Faruque, M.A.; Balachandar, R. Vortices and large-scale structures in a rough open-channel flow subjected to bed suction and injection. J. Eng. Mech. 2011, 138, 491–501. [Google Scholar] [CrossRef]
  26. Devi, T.B.; Sharma, A.; Kumar, B. Turbulence Characteristics of Vegetated Channel with Downward Seepage. J. Fluids Eng. 2016, 138, 121102. [Google Scholar] [CrossRef]
  27. Marsh, N.A.; Western, A.W.; Grayson, R.B. Comparison of Methods for Predicting Incipient Motion for Sand Beds. J. Hydraul. Eng. 2004, 130, 616–621. [Google Scholar] [CrossRef]
  28. Dey, S.; Sarkar, S.; Ballio, F. Double-averaging turbulence characteristics in seeping rough-bed streams. J. Geophys. Res. Space Phys. 2011, 116, F03020. [Google Scholar] [CrossRef]
  29. Kumar, V.; Raju, K.G.R.; Vittal, N. Reduction of Local Scour around Bridge Piers Using Slots and Collars. J. Hydraul. Eng. 1999, 125, 1302–1305. [Google Scholar] [CrossRef]
  30. Goring, D.G.; Nikora, V.I. Despiking Acoustic Doppler Velocimeter Data. J. Hydraul. Eng. 2002, 128, 117–126. [Google Scholar] [CrossRef] [Green Version]
  31. Chavan, R.; Kumar, B. Experimental investigation on flow and scour characteristics around tandem piers in sandy channel with downward seepage. J. Mar. Sci. Appl. 2017, 16, 313–322. [Google Scholar] [CrossRef]
  32. Bandyopadhyay, P.R.; Gad-El-Hak, M. Reynolds Number Effects in Wall-Bounded Turbulent Flows. Reynolds Number. Eff. Wall-Bounded Turbul. Flows 1994, 47, 307–365. [Google Scholar]
  33. Raupach, M.R. Conditional statistics of Reynolds stress in rough-wall and smooth-wall turbulent boundary layers. J. Fluid Mech. 1981, 108, 363. [Google Scholar] [CrossRef]
  34. Krogstadt, P.Å.; Antonia, R. Surface roughness effects in turbulent boundary layers. Exp. Fluids 1999, 27, 450–460. [Google Scholar] [CrossRef]
Figure 1. Schematic diagram of the experimental set-up.
Water 11 01580 g001
Figure 2. Non-dimensional distributions of turbulence intensities.
Water 11 01580 g002
Figure 3. Non-dimensional distribution of third order moment and skewness factors in streamwise and vertical direction for without seepage (NS), 10% seepage (S), and 15% S runs in the following sections: (a) upstream the pier (U); (b) downward the pier (D); (c) laterally to the pier (S1).
Water 11 01580 g003aWater 11 01580 g003bWater 11 01580 g003c
Figure 4. Non-dimensional distributions of turbulent kinetic energy flux (TKE-flux) in the following sections: (a) U; (b) D; (c) S1.
Water 11 01580 g004aWater 11 01580 g004b
Figure 5. Non-dimensional distributions of turbulent production (TP), turbulent kinetic energy dissipation (ED), and diffusion (TD) for NS, 10% S, and 15% S in the following sections: (a) U; (b) S1; (c) D.
Water 11 01580 g005
Figure 6. Longitudinal bed profile along the centerline.
Water 11 01580 g006
Figure 7. Lateral bed profile upstream from the piers.
Water 11 01580 g007
Figure 8. Comparison between the predicted and observed values of the dimensionless (a) scour length (Equation (5)), (b) scour width (Equation (6)), (c) scour area (Equation (8)), and (d) scour volume (Equation (9)).
Water 11 01580 g008
Table 1. Experimental conditions.
Expt. RunPier dia. D (mm)Standard Deviation of River Sand σgFlow Depth h (m)Flow Rate Q (m3/s)Reynolds Number (Re)Froude Number (Fr)Temp. (°C)Seepage Percentage
175 and 90 mm1.65 and 1.850.1180.03231,8600.25280
275 and 90 mm1.65 and 1.850.1180.03231,8600.252810
375 and 90 mm1.65 and 1.850.1180.03231,8600.252815
475 and 90 mm1.65 and 1.850.1210.03434,0010.2579280
575 and 90 mm1.65 and 1.850.1210.03434,0010.25792810
675 and 90 mm1.65 and 1.850.1210.03434,0010.25792815
775 and 90 mm1.65 and 1.850.1230.03636,0390.2667280
875 and 90 mm1.65 and 1.850.1230.03636,0390.26672810
975 and 90 mm1.65 and 1.850.1230.03636,0390.26672815
1075 and 90 mm1.65 and 1.850.1260.03838,0520.272280
1175 and 90 mm1.65 and 1.850.1260.03838,0520.2722810
1275 and 90 mm1.65 and 1.850.1260.03838,0520.2722815
1375 and 90 mm1.65 and 1.850.1290.0439,9900.28280
1475 and 90 mm1.65 and 1.850.1290.0439,9900.282810
1575 and 90 mm1.65 and 1.850.1290.0439,9900.282815
Table 2. Uncertainty associated with Acoustic Doppler Velocimeter (ADV) data.
U ¯   ( m / s ) V ¯   ( m / s ) W ¯   ( m / s ) ( u u ¯ ) 0.5 ( v v ¯ ) 0.5 ( w w ¯ ) 0.5
Standard deviation2.22 × 10−39.9 × 10−44.2 × 10 −41.0 × 10−39.1 × 10−43.21 × 10⁻⁴
Uncertainty %0.110.0850.0210.0950.090.034
Table 3. Uncertainty associated with Ultrasonic Ranging System (URS) data.
Statistical ParametersStandard DeviationStandard Deviation about the MeanUncertainty %
0.000950.018340.07264